Assessing the Carbon Footprint and Carbon Mitigation Measures of a Major Full-Service NetworkAirline:ACase Study of SingaporeAirlines
Glenn BaxterSchoolofTourismandHospitalityManagement,SuanDusitUniversity,Thailand
Received:17Sep2022;Receivedinrevisedform:06Oct2022;Accepted:12Oct2022;Availableonline:17Oct2022 ©2022TheAuthor(s).PublishedbyInfogainPublication.ThisisanopenaccessarticleundertheCCBYlicense (https://creativecommons.org/licenses/by/4.0/).
Abstract In this qualitative longitudinal case study, Singapore Airlines carbon footprint is examined for the period covering the company’s 2010/11 to 2021/22 financial years. The study’s qualitative data was examined by document analysis. The case study found that Singapore Airline’s carbon footprint is comprised of its Scope 1 direct emissions that are produced from the provision of its passenger and air cargo services together with the carbon dioxide (CO2) emission produced from the ground service equipment and vehicles used in its ground operations. The carbon footprint also includes its Scope 2 indirect emissions, which are produced from the airline’s consumption of electricity at its Singapore hub. Singapore Airlines has implemented a very comprehensive environmental policy and has pledged to achieve net zero carbon emissions by 2050. The largest source of carbon dioxide (CO2) emissions is from the airline’s passenger services. Singapore Airlines has implemented extensive carbon dioxide (CO2) emissions reduction measures that have focused on the reduction in aircraft weight, and highly efficient fuel management procedures. Other key carbon dioxide (CO2) emissions reduction measures include improved operational procedures, the optimization of air space management in collaboration with key air traffic control agencies, the use of cleaner energy vehicles, an extensive range of energy efficiency measures in its buildings and facilities, the use of sustainable aviation fuels, and the use of more energy efficient ground power sources. In addition, the acquisition and operation of the state of the art, next generation aircraft, such as the Airbus A350 900XWB and the Boeing 787 10 have helped the airline to mitigate its carbon footprint.
Keywords Airline, carbon dioxide (CO2) emissions, carbon footprint, case study, Singapore Airlines.
I. INTRODUCTION
The global air transport industry provides services to virtually every country in the world and has played an integral part in the creation of the world economy. In addition to its economic significance, the air transport industry also provides important social benefits (Daley, 2016; Daley & Thomas, 2016; Rizzi & Rizzi, 2022). As a means of mass transportation, air transport provides the linkage between many different countries and cultures. This contributes to the cultural understanding and increases multicultural cooperation (Caves, 2003;
ISSN: 2456 1878 (Int. J. Environ. Agric. Biotech.)


Vespermann & Holztrattner, 2011). Air transport also contributes to sustainable development. By facilitating tourism and global trade, the air transport industry generates economic growth, provides jobs, increases revenues from taxes, and fosters the conservation of protected areas (Air Transport Action Group, 2011, p. 3). Air transport is also very important for long distance travel and enables remote areas to be connected with the rest of the world (Bråthen & Halpern, 2012).
The global commercial airline industry has grown over the past twenty years or so at an annual rate of 4.5 5% in the
passenger and 6% in the air cargo segments. Whilst such developments have contributed to the globalization of the economy and overall social welfare, they have at the same time had an increased impact on the environment and society in terms of greenhouse gas (GHGs) emissions. In particular, the further growth of emissions of greenhouse gas (GHG) driven by growth of world air transportation demand could further contribute to global warming and the subsequent climate change (Janić, 2014). This is because carbon dioxide (CO2) emissions produced from air transportation services have an adverse environmental impact because of their potential greenhouse effects (Postorino & Mantecchini, 2014). Consequently, the global air transport industry’s contribution to global carbon dioxide (CO2) emissions has been under considerable scrutiny since the early 2000s (Bows Larkin et al., 2016). This increasing focus on the carbon dioxide (CO2) emissions is because the global aviation industry generates a substantial carbon footprint (Filimonau et al., 2018). Accordingly, the strong historical growth in commercial air transport traffic has increasingly raised concerns over the impact of air transport operations on air quality (Budd, 2017, Daley, 2016; Harrison et al., 2015). This is because the increase in airline flights increases the amount of carbon dioxide (CO2) that is released into the atmosphere (Fatihah & Abdul Rahim, 2017). In the global airline industry, the carbon dioxide (CO2) emitted by aircraft engines has become a particular area of concern (Grote et al., 2014), due to their harmful impact on the environment (Olsen et al., 2013). Furthermore, aviation related emissions are unique in that they occur at higher altitudes as well as from surface based activities (Olsen et al., 2013). Aviation emissions impact surface air quality on a multiple scale nearby airport pollution peaks from airport landing and take off (LTO) emissions, whilst intercontinental pollution is produced from aircraft cruise emissions (Yim et al., 2015). Thus, aviation related emissions not only impact air quality, but also the climate (Ashok et al., 2017; Kapadia et al., 2016).
The environmental sustainability of air transport has been receiving greater focus in recent times due to its critical impact on climate change and on the environment. Environmental issues associated with the global air transport industry have grown in importance in recent years. in response to these concerns some airlines have been proactive and have developed and demonstrated their “green” credentials (Wu et al., 2018). Indeed, in recent decades, “greening” (ensuring the sustainable development of the global air transport system) has been viewed as a highly significant part of the agenda by almost all the industry’s involved stakeholders (Janić, 2011). Many airlines have defined and implemented environmental
ISSN: 2456 1878 (Int. J. Environ. Agric. Biotech.)
https://dx.doi.org/10.22161/ijeab.75.9
related strategies that are designed to "green" their operations (Çabuk et al., 2019; Chan et al., 2021; Migdadi, 2020), or where possible make them more environmentally friendly. At a global level, the peak global airline industry body the International Air Transport Association (IATA) have recognized the requirement to address the global challenge of climate change and the organization has subsequently adopted a set of ambitious targets to mitigate carbon dioxide (CO2) emissions from air transport operations. The association has targeted an average improvement in aircraft fuel efficiency of 1.5% per year from 2009 to 2020 (International Air Transport Association, 2022b). At the associations annual general meeting in 2021, the airline industry committed to a target of net zero emissions by 2050, in line with the Paris Agreement that limits global warming to 1.5 degrees Celsius (Taneja, 2023). On 7 October 2022, the 184 International Civil Aviation Organization (ICAO) Member States adopted a collective long term global aspirational goal (LTAG) of net zero carbon emissions by 2050 (International Civil Aviation Organization, 2022). This important decision by the ICAO member states aligns with both the objectives of the Paris Agreement and the net zero carbon dioxide (CO2) emissions by the 2050 resolution agreed by the International Air Transport Association (IATA) member airlines at the 77th IATA Annual General Meeting in October 2021 (International Air Transport Association, 2022c).
With the growing focus on the impact of climate change, the embodied carbon dioxide (CO2) emission or “carbon footprint” is now frequently used as an environmental performance indicator for products or production activities (Laurent et al., 2010). One such airline that has sustainably managed its carbon footprint is Singapore Airlines. Singapore Airlines has historically placed a very high focus on sustainable environmental management, and on managing the airline’s carbon footprint. The objective of this study is to analyze Singapore Airlines annual carbon footprint from its flights, ground based facilities energy consumption, and ground operations fuel consumption and electricity consumption An additional objective of the study is to examine the airline’s strategies to mitigate its carbon footprint as part of its commitment to environmentally sustainable operations. The study period is from 2010/11 to 2021/22 inclusive.
The remainder of the paper is organized as follows: The literature review that sets the context of the case study is presented in Section 2. The research method that underpinned the study is presented in Section 3. The Singapore Airlines case study is presented in Section 4. Section 5 presents the findings of the study.
II. BACKGROUND
2.1. Carbon Dioxide (CO2): A Background Note
Carbon dioxide (CO2) is one of the main greenhouse gases present in the atmosphere (Köne & Büke, 2010; Marjanović et al., 2016; Ravanchi et al., 2011). Carbon dioxide (CO2) is naturally present in the atmosphere and is a heavy, colorless gas, which is part of the ambient air. Carbon dioxide (CO2) is produced from the respiration and decomposition of organic substances, and from the combustion of fossil fuels and biomass (Allaby & Park, 2007). Carbon dioxide (CO2) is the principal greenhouse gas emitted from human activities. However, the primary human activity that produces carbon dioxide (CO2) emissions is the combustion of fossil fuels (for example, coal, natural gas, and oil) for energy and transportation. Carbon dioxide (CO2) is also produced from some other industrial processes and land use changes (United States Environmental Protection Agency, 2022). Carbon dioxide emissions (CO2) means the release of greenhouse gases and/or their precursors into the atmosphere over a specified area and for a given time (Organization for Economic Cooperation and Development, 2013).
In the context of the global airline industry, an airline’s carbon dioxide (CO2) emission profile is dependent on a range of factors including, but not limited too, the aircraft deployed, commercial payload, aircraft route assignment, as well as the weather conditions for the flight (Yin et al., 2015).
2.2. Carbon Footprints
Climate change and carbon footprints are now viewed as key issues of corporate responsibility (Hrasky, 2012). According to Wiedemann and Minx (2007, p. 5), “the carbon footprint is a measure of the exclusive total amount of carbon dioxide emissions that is directly and indirectly caused by an activity or is accumulated over the life stages of a product”. A carbon footprint is also the carbon emissions that are released by activities of humans (Jha et al., 2021) and from various anthropogenic activities (Ramachandra & Shwetmala, 2012). The carbon footprint (CF) is also the amount of greenhouse gases (GHG) that are emitted into the atmosphere during a product's lifecycle (Röös et al., 2013).
Carbon footprints are now being extensively used as a measure of a firm's contribution to climate change (De Grosbois & Fennell, 2011). A carbon footprint enables an organization to estimate their own contributions to the changing climate (Gautam et al., 2012). Carbon foot printing has become one of the principal methods available to firms for quantifying their anthropogenic environmental impacts and for assisting them to tackle the threat of climate change (Williams et al., 2012). The carbon
ISSN: 2456 1878 (Int. J. Environ. Agric. Biotech.)
https://dx.doi.org/10.22161/ijeab.75.9
footprint includes both direct and indirect emissions (Cadarso et al., 2016; Lee, 2011; Sharp et al., 2016). Thus, a carbon footprint can be segregated into direct emissions which are the greenhouse effect caused by various greenhouse gas (GHG) emissions and leakage in each process, and the indirect emissions which are the carbon dioxide (CO2) equivalent emissions due to the energy consumption in each process (Wu et al., 2013).
2.3. The Sources of Airline Emissions
Aviation fuel is the principal source of energy consumed by the aviation industry, so both the quality and quantity of fuel affect an aircraft’s carbon dioxide (CO2) emissions (Hu et al., 2022). By consuming fuel, aircraft produce emissions of carbon dioxide (CO2), as well as nitrogen oxides (NOX), particles (principally soot) of sulphur oxides (SOX), carbon monoxide (CO), as well as various hydrocarbons. First, and generating the largest percentage share, are the emissions of carbon dioxide (CO2) which are produced in direct proportion to the volume of jet fuel used to operate flights over any distance (Sales, 2016). Water vapor is formed from the burning of jet fuels. At altitude, condensation trails from the aircraft. These comprise frozen ice crystals which deflect a small amount of sunlight away from the earth’s surface and reflect more infrared radiation back toward earth. This produces an overall warming effect on the earth’s atmosphere (Sales, 2013). After water vapor, carbon dioxide (CO2) is regarded as the second most important of all the greenhouse gases (Chavan, 2016; Drewer et al., 2018; Ngo & Natowitz, 2016). The amount of aircraft carbon dioxide (CO2) emissions is a product of hydrocarbon combustion, and the amount of these gases emitted is directly related to the volume of fuel consumed. This, in turn, is a function of the aircraft and its engine fuel efficiency (Cokorilo & Tomic, 2019), as well as the length of time that an aircraft’s engines or auxiliary power unit (APU) are running (Marais et al., 2016). Carbon dioxide (CO2) emissions are directly related to jet fuel consumption, with each kilogram of fuel consumed by aircraft producing more than three kilograms of carbon dioxide (CO2) (Mrazova, 2014) Carbon dioxide (CO2) are now regarded as being the most important aircraft emissions (Postorino & Mantecchini, 2014). In addition, aircraft taxi out procedures, which form part of the aircraft Landing and Take Off (LTO) cycle, generate substantial amounts of carbon emissions (Postorino et al., 2019). As previously noted, another source of emissions come from the aircraft auxiliary power units (APU). Because jet fuel is utilized as the power source for APUs, they emit exhaust gases (Culberson, 2011). APU’s supply the essential power requirements for an aircraft whilst it is on the ground in between flights (Ashford et al., 2013; Kazda & Caves, 2015). Aircraft parked at the airport gates
during their turnaround require power and air conditioning, which is typically provided by fossil fuel combusting equipment (Greer et al., 2021), all of which produce harmful emissions.
Ground support equipment (GSE) also produces exhaust emissions. Ground service equipment (GSE) refers to vehicles and equipment that are used in the airport precinct to service aircraft whilst they are at the gate in between flights (Hazel et al., 2011). Waste disposal, aircraft de icing usage, and wastewater processing also contribute emissions at an airport (Sahinkaya & Babuna, 2021). Other emissions are produced from aircraft maintenance and cleaning processes at an airport (Graham, 2018).
2.4. The Greenhouse Gas Protocol
The Greenhouse Gas Protocol has established a comprehensive global standardized framework to measure and manage greenhouse gas (GHG) emissions from both the private and public sectors, through value chains, and mitigation actions (Greenhouse Gas Protocol, 2022). The Greenhouse Gas Protocol categorizes greenhouse gases into both direct and indirect emissions and further categorizes them into Scope 1, Scope 2, and Scope 3 emissions (Jones, 2009). Scope 1, direct emissions, includes those emissions from sources that are owned or controlled by the firm (Girella, 2018; Vásquez et al., 2015). Scope 2, indirect emissions, come from the purchase of electricity, heat, steam or cooling. Scope 3 emissions are all the other indirect emissions that arise from the consequences of the various activities undertaken by a firm but occur from sources that are not owned nor controlled by that firm (Mazhar et al., 2019).
Although there are variations in air quality regulations by country (Budd, 2017; Elsom, 2013), airlines are now increasingly recording and reporting emissions in terms of Scope 1, Scope 2, and, in some cases, Scope 3 emissions (Baxter, 2021b).
2.5. Carbon Offsetting and Reduction Scheme for International Aviation (CORSIA)
At the 2015 Paris Climate Conference or COP 21, a landmark agreement that dealt with the adverse impact of climate change was agreed between governments (Fischlin & Ivanova, 2017; Rhodes, 2016; Viñuales et al., 2017). This significant step provided a very positive motivation for the air transport industry to develop a global market based measure (MBM) to reduce carbon dioxide (CO2) emissions (Singapore Airlines, 2017). In October 2016, the Member States of the International Civil Aviation Organization (ICAO) reached an agreement to adopt a global market based measure for aviation emissions (Attanasio, 2018).
ISSN: 2456 1878 (Int. J. Environ. Agric. Biotech.)
https://dx.doi.org/10.22161/ijeab.75.9
In 2021, an increasing share of the carbon emission growth in international air transport was subject to offsetting under the ICAO “Carbon Offsetting and Reduction Scheme for International Aviation” (CORSIA) program (Maertens et al., 2019). The International Air Transport Organization “CORSIA” program is a worldwide based market based measure that has been designed to offset international aviation carbon dioxide (CO2) emissions. The “CORSIA” program aims to stabilize the levels of such emissions from 2020 onwards. The offsetting of carbon dioxide (CO2) emissions in the air transport industry will be achieved through the acquisition and cancelation of emissions units from the global carbon market by aircraft operators (Federal Aviation Administration, 2022). The “CORSIA” program will be rolled out in three phases with the pilot phase operating from 2021 2023. The first phase will be from 2024 to 2026. Both the pilot and first phases are voluntary. The second phase of the program is targeted at the 2027 to 2035 time period (Javed et al., 2019). Following the pilot and first phase, a second mandatory scheme will enter in effect for all ICAO Member States, except for some least developed countries (Scott &Trimarchi, 2020).
2.6. Airline Passenger Carbon Offset Programs
Carbon offsetting has become an integral element of the airline industry strategy to reduce its carbon emissions (Becken & Mackey, 2017). Consequently, airlines are now offering carbon offset schemes for their passengers so that they can reduce their carbon footprint from their travel (Chen, 2013; Ritchie et al., 2020; Zhang et al., 2019).
Voluntary carbon offsetting by airline passengers is a useful measure that could help reduce environmental damage caused by air travel (Babakhani et al., 2017). In the global airline industry, carbon offsetting is a means for individuals or firms, in this case airline passengers and corporate customers, to “neutralize” their proportion of an aircraft’s carbon emissions on a particular journey through an investment in carbon reduction projects (International Air Transport Association, 2022a). The principle of carbon offsetting is that the emissions for each flight are allocated amongst the passengers. Each passenger can therefore pay to offset the emissions caused by their portion of the flight’s emissions. Passengers can offset their emissions through an investment in carbon reduction projects that generate carbon credits (International Air Transport Association, 2016).
Passengers participating in carbon offset programs can purchase carbon credits generated by certified renewable energy and energy efficiency projects in developing countries. These projects have been verified that they will reduce greenhouse gas emissions. A carbon credit is a permit that represents one tonne of carbon dioxide (CO2)
that has either been removed from the atmosphere or alternatively saved from being emitted. Once used these carbon credits are subsequently “cancelled” on an official register to ensure that they cannot be sold or used again (International Air Transport Association, 2016).
Carbon credits establish a market for the reduction in greenhouse emissions by providing a monetary value to the cost of polluting the air (International Air Transport Association, 2016).
III. RESEARCH METHODOLOGY
3.1 Research Method
This study used a qualitative longitudinal research design (Derrington, 2019; Hassett & Paavilainen Mäntymäki, 2013; Neale, 2018). Qualitative longitudinal research aims to expand and develop theories (Derrington, 2019). The researcher’s role when conducting case study research is to expand and generalize theories (analytical generalization) (Rahim & Baksh, 2003). Qualitative longitudinal research aims to expand and develop theories (Derrington, 2019). A case study enables the researcher(s) to explore complex phenomena (Remenyi et al., 2010; Taber, 2014; Yin, 2018). Case studies also enable the researcher(s) to collect rich, explanatory information that provides in depth insights into the phenomenon under investigation (Ang, 2014).
3.2 Data Collection
The data used in the study was obtained from a range of documents, company materials available on the internet and records as sources of case evidence. Documents included the Singapore Airlines annual sustainability reports, and the airline’s websites. An extensive search of the leading air transport journals and magazines was also conducted in the study.
The key words used in the database searches included “Singapore Airlines sustainability policy”, “Singapore Airlines climate pledge”, “Singapore Airlines passenger carbon offset program”, “Singapore Airlines membership of CORSIA”, “Singapore Airlines annual Scope 1 carbon dioxide emissions (CO2) from passenger and freighter aircraft operations and ground operations”, “Singapore Airlines annual Scope 2 carbon dioxide emissions from electricity consumption (CO2)”, “Singapore Airlines annual carbon dioxide (CO2) intensity ratios”, and “Singapore Airlines carbon dioxide (CO2) reduction measures”.
This study used secondary data. The three principles of data collection as suggested by Yin (2018) were followed: the use of multiple sources of case evidence, creation of a
ISSN: 2456 1878 (Int. J. Environ. Agric. Biotech.)
https://dx.doi.org/10.22161/ijeab.75.9
database on the subject and the establishment of a chain of evidence.
3.3 Data Analysis
The data collected for the case study was examined using document analysis. Document analysis is quite commonly used in case studies. Document analysis focuses on the information and data from formal documents and a firm’s records that are collected by a researcher(s) when conducting their case study (Andrew et al., 2011; Yin, 2018). Following the recommendations of Scott (2004, 2014) and Scott and Marshall (2009), the study’s documents were examined according to four criteria: authenticity, credibility, representativeness and meaning. The document analysis was undertaken in six distinct stages:
• Phase 1: The first phase involved planning the types and required documentation and their availability for the study.
• Phase 2: The data collection phase involved sourcing the documents and developing and implementing a scheme for the document management.
• Phase 3: The collected documents were examined to assess their authenticity, credibility and to identify any potential bias.
• Phase 4: The content of the collected documents was carefully examined, and the key themes and issues were identified.
• Phase 5: This phase involved the deliberation and refinement to identify any difficulties associated with the documents, reviewing sources, as well as exploring the documents content.
• Phase 6: In this phase the analysis of the data was completed (O’Leary, 2004, p. 179).
Following the guidance of Yin (2018), the study’s documents were downloaded and stored in a case study database. All the documents gathered for the study were all written in English. Each document was carefully read, and key themes were coded and recorded in the case study research framework (Baxter, 2021a).
IV. RESULTS
4.1. A Brief Overview of Singapore Airlines Singapore Airlines was established on 28 January 1972. The establishment of the new airline followed the emergence of Singapore as a Republic. Singapore had become independent from the Federation of Malaysia in 1965 (Trocki, 2006). As a result, Malaysia Singapore
Airlines (MSA) was split into two individual airlines that subsequently became the national flag carriers of Singapore and Malaysia, respectively (Chant, 1997; Huat, 2016). Singapore Airlines commenced commercial operations on 1 October 1972 (Chan, 2000; Green & Swanborough, 1975; Seth, 2006). Singapore Airlines began serving the same international destinations that had been previously served by Malaysia Singapore Airlines (MSA). During this period, Singapore Airline operated a fleet of Boeing B707 and Boeing B737 aircraft on these services (Chant, 1997).
On 2 April 1973, Singapore Airlines commenced daily services between Singapore and London. On 31 July 1973, the airline commenced a major expansion program following the delivery of its first wide body aircraft type, the four turbofan powered Boeing B747 212B aircraft. This was followed quite soon thereafter by another wide body aircraft, the McDonnell Douglas DC10 30. These aircraft were operated on the airline’s medium and high density air routes (Chant, 1997). In the late 1970s, Singapore Airlines began operating services across the Pacific, terminating at San Francisco (Brimson, 1985).
On 20 December 1980, Singapore Airlines received its first Airbus A300B4 203 aircraft. Following its introduction into commercial service, this aircraft type complemented the Boeing B747 212B and McDonnell Douglas DC10 30 aircraft (Chant, 1997). In June 1994, Singapore Airlines announced an order for Boeing 747s, Airbus A340, plus the lease of eight Boeing 777 aircraft (Birtles, 1998). As of September 1997, Singapore Airlines had placed firm orders for thirty four Boeing 777s (Upton, 1998). Singapore Airlines was the first airline to place an order for the Airbus A380 aircraft (Jackson, 2021; Materna et al., 2015). Singapore Airlines subsequently took delivery of its first Airbus A380 aircraft on the 15th of October 2007. Singapore Airlines was the first airline in the world to operate the Airbus A380 aircraft. On October 15, 2007, the first Airbus A380 800 aircraft was delivered to Singapore Airlines. Singapore Airlines began Airbus A380 commercial operations on 25 October 2007, when it commenced daily Airbus A380 flights between Singapore and Sydney (Kingsley Jones, 2008; Simons, 2014). Singapore Airlines was the launch customer for Boeing Commercial Airplanes Boeing 787 10 aircraft (Polek, 2017).
At the time of the present study, Singapore Airlines operated a modern passenger fleet of 123 aircraft and had outstanding orders for a further 44 aircraft. SIA Cargo operated a fleet of 7 Boeing B747 400 freighter aircraft (Singapore Airlines, 2022). The Singapore Airlines Group comprises the wholly owned subsidiaries Scoot Airways, and SIA Cargo. On 25 July 2017, Scoot and Tigerair, the
ISSN: 2456 1878 (Int. J. Environ. Agric. Biotech.)
https://dx.doi.org/10.22161/ijeab.75.9
SIA Group low cost carriers, were officially merged into a single entity that retained the Scoot brand (Gupta Kapoor, 2017; Ong, 2017; Singapore Airlines, 2019). Singapore Airlines formally joined the Star global passenger alliance in 2000 (Heracleous & Wirtz, 2012; Iatrou & Alamdari, 2005; Ramaswamy, 2002). As at September 2021, Silkair had been fully integrated into Singapore Airlines (Singapore Airlines, 2022)
Singapore Airlines has adopted the full service network carrier business model. According to Ehmer et al. (2008, p. 5), a “full service network carrier is an airline that focuses on providing a wide range of pre flight and onboard services, including different service classes, and connecting flights”. As of March 31, 2022, the airline’s combined passenger network covered 69 destinations (Singapore Airlines, 2022).
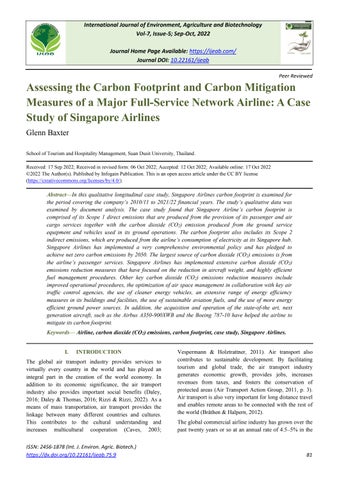
Figure 1 presents Singapore Airlines annual enplaned passengers and revenue passenger kilometres performed (RPKs) for the period covering the financial years 2010/2011 to 2021/2022. One passenger enplanement measures the embarkation of a revenue passenger, whether originating, stop over, connecting or returning (Holloway, 2016). One revenue passenger kilometre (RPK) is one passenger transported one kilometre (Belobaba, 2016; Gillen, 2017). Over the period FY2010/2011 to 2019/2020, Singapore Airlines enplaned passengers and RPKs showed quite consistent growth (Figure 1). Figure 1 shows, however, that there was a very steep decline in both the annual number of enplaned passengers and RPKs in 2020, which were both adversely impacted by the global COVID 19 pandemic. In 2020, the COVID 19 pandemic caused a decline in economic activity around the world. This decline in economic activity caused a major disruption in the air travel market supply and demand chain (Dube et al., 2021). Air transportation was one of the sectors most adversely impacted by the corona virus pandemic (Barczak et al., 2022; Karakuş et al., 2021; Sun et al., 2022). In addition, due to the global coronavirus crisis, most countries placed restrictive measures to confine the pandemia (Maria Iacus et al., 2020). As a result, these restrictions had a very adverse impact on global airline passenger demand, and thus, on the total number of revenue passenger kilometres performed (RPKs) by the world’s airlines in 2020 (International Air Transport Association, 2021). On 24th March 2020, the Singaporean Government closed its international borders (Djalante et al., 2020). Figure 1 shows that Singapore Airlines annual enplaned passengers grew from 457,000 in the 2020/2021 financial year to 3,388,000 enplaned passengers in the 2021/2022 financial year. In the 2021/2022 financial year, the airline’s revenue passengers’ kilometres performed (RPKs) increased by 642.75% on the
2020/2021 financial year levels. The increase in both enplaned passengers and RPKs in the 2021/2022 financial year, reflected the growth in the airline’s operations as COVID 19 pandemic measures were eased throughout its route network
At the time of the present study, Singapore Airlines operated a fleet of fifteen Boeing 787 10 aircraft (Singapore Airlines, 2022). The Boeing 787 10 aircraft burns 20% less fuel than its predecessor the Boeing B767 (Vasigh et al., 2012). A key focus of the airline’s environmental policy is on improving aircraft fuel productivity through the implementation of “green” operations and by reducing fuel usage through highly efficient aircraft weight management together with the optimization of flight routes (Singapore Airlines, 2021).
Fig.1: Singapore Airlines annual enplaned passengers and revenue passenger kilometres performed (RPKs): 2010/11 2021/22. Note: Financial years from 1 April to 31 March.
Source: Data derived from Singapore Airlines (2013, 2016, 2021, 2022).
4.2. Singapore Airlines Environmental Policy Singapore Airlines has implemented a very comprehensive environment and sustainability related policy that is underpinned by four key pillars.
Pillar One: Improved technology: Singapore remains committed to its long held policy of operating a modern and fuel efficient fleet (Singapore Airlines, 2019). Singapore Airlines took delivery of its first Boeing 787 10 aircraft on March 25, 2018 (Australian Aviation, 2018; Singapore Airlines, 2018a). On September 22, 2018, Airbus delivered the first A350 900 Ultra Long Range (ULR) aircraft to Singapore Airlines (Airbus, 2018). As of 31 March 2022, Singapore Airlines operated a fleet of 123 aircraft, with an average age of five years and seven months. In addition, the airline had 7 Airbus A350 900XWB, 31 Boeing 777 9s, 13 Boeing 787 10s, and 24 Boeing 737 8 MAX aircraft on firm order (Singapore Airlines, 2022). As part of its environmental policy, Singapore Airlines makes investments in engineering improvement packages for its aircraft airframes and engines. These improvements help to reduce drag and whilst at the same time improve engine efficiency, and thus, enhance fuel efficiency (Singapore Airlines, 2021).
Pillar Two: Operational measures: Importantly, as previously noted, Singapore Airlines maintains a modern and fuel efficient fleet. As of 31 March 2022, the airline was operating 58 Airbus A350 900XWB aircraft. The Airbus A350 900XWB aircraft is acknowledged for its improved operating efficiency (Singapore Airlines, 2019).
ISSN: 2456 1878 (Int. J. Environ. Agric. Biotech.)
https://dx.doi.org/10.22161/ijeab.75.9
Pillar Three: Improved infrastructure: Infrastructure improvements in the air transport industry present an opportunity for airlines to reduce both fuel use and carbon dioxide (CO2) emissions. Such improvements can be achieved from the optimization of air routes through efficient air traffic control management. Singapore Airlines collaborates with Air Traffic Management stakeholders to investigate new ways to improve and enhance airspace incremental efficiency (Singapore Airlines, 2019, 2021).
Pillar Four: Global Market Based Measure (MBM): Singapore Airlines recognizes that the International Civil Aviation Organization (ICAO) CORSIA scheme will play an essential role in achieving carbon neutral growth in a cost efficient manner. As such, Singapore Airlines fully supports the ongoing efforts towards meeting the requirements in the ICAO “CORSIA” Monitoring, Reporting and Verification system of carbon emissions. As of 1 January 2019, Singapore Airlines commenced the monitoring and reporting of its carbon dioxide (CO2) emissions on an annual basis. Furthermore, Singapore Airlines will voluntarily participate in the ICAO CORSIA program from 2021 to 2026, following which the scheme becomes mandatory (Singapore Airlines, 2019).
The International Civil Aviation Organization (ICAO) is responsible for setting the international standards for nitrous oxides (NOx), carbon dioxide (CO2), hydrocarbons, and exhaust levels from aircraft engine emissions in accordance with Annex 16 (Volume III) to the 1944 Chicago Convention on International Civil Aviation (International Civil Aviation Organization, 2014; Young, 2018). As part of its sustainable environment policy, Singapore Airlines fully supports the new carbon dioxide (CO2) emissions standard that has been set by the International Civil Aviation Organization (ICAO) in order meet the air transport industry’s long term commitment to reduce carbon dioxide (CO2) emissions (Singapore Airlines, 2021).
Singapore Airlines is dedicated to its long term responsibility to protect the environment while delivering air transportation services that are of the highest quality.
As discussed below, Singapore Airlines has introduced an extensive range of programs to enable it to implement sustainable practices across its operations in a responsible manner. The airline actively manages issues such as carbon dioxide (CO2) emissions, noise, waste, as well as energy and water consumption. Singapore Airlines continues to explore new sustainable practices across all areas of its operations. The company has adopted the International Air Transport Association (IATA) four pillar strategy to address climate change, and, as a result, it seeks opportunities to reduce the carbon footprint of its operations. The airline also promotes eco friendly habits among its employees and stakeholders. In addition, Singapore Airlines raises the awareness on the importance of taking action to reduce its impact on the environment (Singapore Airlines, 2020). In 2021, the Singapore Airlines Group (SIA) committed to a net zero carbon emissions standard across all operations by 2050 (Asian Aviation, 2021; Becken, 2021). According to the Climate Council (2022), “net zero emissions’ refers to achieving an overall balance between greenhouse gas emissions produced and greenhouse gas emissions taken out of the atmosphere”.
Singapore Airlines became a signatory to the Ten Principles of the United Nations Global Compact in 2018 (Singapore Airlines, 2019). Singapore Airlines has prioritized three of the seventeen United Nations (UN) Development goals, that is, Goal Number 8 (Promote sustained, inclusive, and sustainable economic growth, full and productive employment, and decent work for all), Goal 12 (Ensure sustainable consumption and production patterns), and Goal 13 (Take urgent action to combat climate change and its impact), The airline has also adopted UN Development Goal 7 affordable and clean energy (Singapore Airlines, 2021). In 2015, all United Nations Member States adopted the “2030 Agenda for Sustainable Development” and its seventeen 17 Sustainable Development Goals (SDGs). Each SDG comprises a range of targets to be achieved by 2030 (Katila et al., 2019; United Nations, 2022). The United Nations Sustainable Development Goals (SDGs) provide a framework for business and government to solve global economic, social, and environmental challenges (Air New Zealand, 2018).
On 10 February 2021, the Singaporean Government announced its “Singapore Green Plan 2030”, that charts the country’s targets for sustainability for the forthcoming decade (Chng & Ong, 2021; Lin Heng, 2021). In line with the “Singapore Green Plan 2030”, as well as Singapore Airlines Sustainability Policy and Climate Action Pledge, the airline is continuing to explore and implement new sustainable practices across its operations. These include a
ISSN: 2456 1878 (Int. J. Environ. Agric. Biotech.)
https://dx.doi.org/10.22161/ijeab.75.9
focus on the use of green energy, green infrastructure, and buildings, as well as green citizenry, which involves reducing water consumption, and reducing waste disposed to landfill (Singapore Airlines, 2022)
4.3. Singapore Airlines Annual Scope 1 Carbon Dioxide (CO2) Emissions from Flight and Ground Operations
Direct Scope 1 greenhouse gas (GHG) emissions occur from sources that are owned or controlled by Singapore Airlines. These direct Scope 1 emissions include emissions from aircraft jet fuel and fuel consumption in Singapore Airlines owned or controlled vehicles (Singapore Airlines, 2020).
4.3.1. Annual Carbon Dioxide (CO2) Emissions from Freighter Services
The provision of air freight services is a core business product of Singapore Airlines. As previously noted, SIA Cargo, the air cargo division of Singapore Airlines, operates a fleet of 7 Boeing B747 400 freighter aircraft. A freighter aircraft is an aircraft that has been expressly designed or which has been converted to transport air cargo, express, and so forth, rather than passengers (Wensveen, 2016). The Boeing B747 400 freighter is 10 16 per cent more fuel efficient than its 747 200 model (Wallis, 2013), and this additional fuel efficiency translates into lower aircraft emissions. Singapore Airlines annual Scope 1 carbon dioxide (CO2) emissions from the operation of SIA Cargo freighter services and the year on year change (%) from the 2010/11 financial year to the 2021/22 financial year is presented in Figure 2. As can be observed in Figure 2, SIA Cargo annual freighter aircraft carbon dioxide (CO2) emission levels have predominantly displayed a downward trend, decreasing from a high of 1,716.87 thousand tonnes in the 2010/11 financial year to a low of 874.7 thousand tonnes in the 2018/19 financial year. This downward trend is demonstrated by the year on year percentage change line graph, which is more negative than positive, that is, more values are below the line than above. Figure 2 shows that during the study period, there were just three years, when the SIA Cargo freighter carbon dioxide (CO2) emissions increased on a year on year basis. These increases were recorded in the 2014/2015 financial year (+4.18%), the 2020/21 financial year (+17.05%), the 2021/2022 financial year (+2.36%), respectively (Figure 2) These increases could be attributed to greater freighter flight frequencies in these respective years. The largest single annual decrease in carbon dioxide (CO2) emissions occurred in the 2012/13 financial year, when these aircraft emissions decreased by 38.68% on the previous year levels (Figure 4). The overall downward trend is highly favorable and shows that SIA Cargo has been able to accommodate
the growing demand for their services while at the same time mitigating as much as possible the detrimental impact of their freighter aircraft carbon dioxide (CO2) emissions on the environment.
Fig.2: Singapore Airlines annual Scope 1 carbon dioxide (CO2) emissions from SIA Cargo freighter services and the year on year change (%): 2010/11 2021/22 Note: Financial years from 1 April to 31 March.
Source: Data derived from Singapore Airlines (2013, 2014, 2017, 2022).
The SIA Cargo annual carbon dioxide (CO2) freighter aircraft emissions intensity ratio (KgCO2/LTK) and the year on year change from the 2010/11 financial year to the 2021/22 financial year is depicted in Figure 3. Load tonne per kilometre (LTK) is a unit of measurement for transport capacity and represents the transport of a tonne (1000 kilograms) of load capacity over one kilometre (Statistics Netherlands [CBS], 2022). Figure 3 shows that the SIA Cargo annual freighter aircraft carbon dioxide emissions intensity ratio oscillated over the study period, rising from a low of 0.53 Kg CO2/LTK to a high of 0.58 Kg CO2/LTK in the 2015/16 financial year and the 2019/20 financial year, respectively (Figure 3). The largest single annual increase in this metric occurred in 2015/2016 and 2019/2020 financial years, when the annual value of this ratio increased by 5.45% in both years (Figure 3). The largest single annual decrease in this ratio was recorded in the 2017/18 financial year, when there was a decrease of 3.63% on the previous year level (Figure 3). The decrease in the 2020/21 financial year ( 3.44%) was attributed to lower levels of freighter flight activity associated with the downturn in demand from the Covid 19 pandemic. This ratio decreased by 1.78% in the 2021/2022 financial year, which once again was a favorable result given the increase in freighter services in the 2021/2022 financial year.
Fig.3: Singapore Airlines annual carbon dioxide (CO2) emissions intensity ratio (KgCO2/LTK) for SIA Cargo freighter services and the year on year change: 2010/11 2020/21.

Source: Data derived from Singapore Airlines (2013, 2014, 2017, 2022).
4.3.2. Annual Carbon Dioxide (CO2) Emissions from Passenger Services
Singapore Airlines annual Scope 1 carbon dioxide (CO2) emissions from its passenger services and the year on year change (%) from the 2010/11 financial year to the 2021/22 financial year is presented in Figure 4. As can be observed in Figure 4, despite the increase in the number of passengers carried and the higher number of services operated, Singapore Airlines annual Scope 1 carbon dioxide (CO2) emissions from passenger services remained relatively constant over the period 2010/11 to 2019/2020. During this period, the highest single year on year change in emissions, was recorded in the 2012/13 financial year, at which time the annual carbon dioxide (CO2) emissions increased by 4.97% on the previous year levels (Figure 4) Figure 4 shows that the airline’s passenger service carbon dioxide (CO2) emissions decreased on a year on year basis in the 2014/15 financial year, when the annual carbon dioxide (CO2) emissions decreased by 1.93% on the 2013/14 financial year levels (Figure 4). Figure 4 also shows that was a very significant decrease ( 78.22%) in the airline’s annual carbon dioxide (CO2) levels in the 2020/21 financial year. This substantial decrease was due to the greatly scaled back level of operations because of the global Covid 19 pandemic (Singapore Airlines, 2021).

Figure 4 shows that there was a pronounced spike in this metric during the 2021/2022 financial year, at which time it increased by 126.1% on the previous year levels. In the 2021/2022 financial year, Singapore Airlines was able to operate more passenger services following the gradual easing of COVID 19 pandemic measures throughout its route network. In the 2021/2022 financial year, Singapore Airlines increased the number of destinations that it served
ISSN: 2456 1878 (Int. J. Environ. Agric. Biotech.)
https://dx.doi.org/10.22161/ijeab.75.9
from 47 destinations in the 2020/2021 financial year to 69 destinations in the 2021/2022 financial year.
Singapore Airlines was able to increase its passenger traffic in the 2021/2022, whilst at the same time decreasing the amount of carbon dioxide (CO2) emissions per enplaned passenger.
Fig.4: Singapore Airlines annual Scope 1 carbon dioxide (CO2) emissions from passenger services and the year on year change (%): 2010/11 2021/22

Source: Data derived from Singapore Airlines (2013, 2014, 2017, 2022).
Figure 5 presents Singapore Airlines annual passenger services carbon dioxide (CO2) emissions intensity ratio (Kg CO2/LTK) and the year on year change from the 2010/11 financial year to the 2021/22 financial year is presented in Figure 5 Figure 5 shows that there were three discrete trends with this ratio. From the 2010/11 financial year to the 2012/13 financial year, there was an upward trend with the value of the ratio increasing from 0.93 Kg CO2/LTK to 0.95 KgCO2/LTK in the 2012/13 financial year (Figure 5). Over the period 2012/13 to 2018/19, the ratio decreased from a high of 0.95 Kg CO2/LTK in the 2012/13 financial year to a low of 0.88 KgCO2/LTK in the 2018/19 financial year (Figure 5). This was a very favorable result given the increase in the number of passengers carried and the higher level of services operated by the airline. Figure 5 shows that there was a pronounced spike in this metric in the 2020/21 financial year, when it increased by 28.08% on the 2019/20 level. This increase may be due to the smaller number of passengers carried as well as the lower number of flights operated due to the COVID 19 virus pandemic. These two factors resulted in the ratio increasing from 0.89 KgCO2/LTK in 2018/19 to a high of 1.14 KgCO2/LTK in 2020/21 (Figure 5). Figure 5 shows that this metric decreased on a year on year basis in the 2021/2022 financial year by 4.38%. This was a very favorable outcome as the airline passenger traffic increased by 641.35% whilst carbon dioxide (CO2) emissions from its passenger services increased by 126.1%. There was a further decrease in this metric in the 2021/2022 financial year, at which time it decreased by 4.38% on the previous year levels (Figure 5). This decrease suggests that
ISSN: 2456 1878 (Int. J. Environ. Agric. Biotech.)
https://dx.doi.org/10.22161/ijeab.75.9
Fig.5: Singapore Airlines annual carbon dioxide (CO2) emissions intensity ratio (KgCO2/LTK) for passenger services and the year on year change: 2010/11 2020/21.

Source: Data derived from Singapore Airlines (2013, 2014, 2017, 2022).
4.3.3. Total Annual Carbon Dioxide (CO2) Emissions from Flight Operations Singapore Airlines total annual scope 1 carbon dioxide (CO2) emissions from passenger and freighter operations and the year on year change (%) from the 2010/11 financial year to the 2020/22 financial year is presented in Figure 6. Figure 6 shows that the total annual Scope 1 carbon dioxide (CO2) emissions from the total flight operations (passenger and freighter flights) oscillated over the study period. There was a slight annual increase in these carbon dioxide (CO2) emissions over the financial years covering the period 2010/11 to 2012/13. Following this there was a slight downward trend in the 2013/14 financial year ( 1.04%), and again in the 2014/15 financial year ( 2.25%), respectively (Figure 6). The airlines total annual scope 1 carbon dioxide (CO2) emissions from flight operations grew on a year on year basis from the 2015/16 financial year to the 2018/19 financial year. During this time frame, the largest single annual increase in carbon dioxide (CO2) emissions was recorded in the 2018/19 financial year, when these emissions increased by 1.76% on the previous year’s levels (Figure 6). In the latter years of the study, that is, from the 2019/20 financial year and the 2020/21 financial year, there was a downward trend in these emissions, with a very significant decrease recorded in the 2020/21 financial year ( 72.03%) (Figure 6). The sharp decrease in the 2020/21 financial year was attributed to lower levels of flight activity associated with the downturn in demand from the COVID 19 pandemic. Figure 6 shows that this metric increased by 92.42% in the
2021/2022 financial year, reflecting the increase in both passenger and freighter services operated by the airline. As outlined below, Singapore Airlines has implemented a wide range of carbon dioxide (CO2) reduction measures over the study period, and these measures have enabled the airline to mitigate its carbon footprint.
years, and suggest that Singapore Airlines has been able to reduce its overall ground operations carbon dioxide (CO2) emissions very effectively, and hence, mitigate the impact of these emissions upon the environment
Fig.6: Singapore Airlines annual Scope 1 carbon dioxide (CO2) emissions from flight operations and the year on year change (%): 2010/11 2021/22


Source: Data derived from Singapore Airlines (2013, 2014, 2017, 2022).
4.3.4. Annual Carbon Dioxide (CO2) Emissions from Ground Operations
Throughout the study period, Singapore Airlines operated a fleet of ground based vehicles that were powered by either petrol or diesel engines. These vehicles are required to comply with the National Environmental Agency’s (NEA) requirements on motor vehicle emissions (Singapore Airlines, 2021). Singapore Airlines annual Scope 1 carbon dioxide (CO2) emissions from fossil fuel consumption and the year on year change for the period covering the 2010/11 financial year to the 2021/22 financial year is presented in Figure 7. As can be observed in Figure 7, the annual carbon dioxide (CO2) emissions from fossil fuel consumption fluctuated over the study period. The largest single annual decrease in these emissions was recorded in 2016/2017 financial year ( 99.43%) (Figure 7). The highest single annual increase in these emissions was in the 2021/2022 financial year, when they increased by 28.07% on the 2020/2021 financial year levels. Figure 7 also shows that there was a considerable decrease in these emissions in the 2014/15 financial year of 10.35% (Figure 7). In the latter years of the study period, there was a very significant decrease in the airline’s annual fossil fuel related carbon dioxide (CO2) emissions. From an environmental perspective, these carbon dioxide (CO2) emissions have decreased significantly in the latter years of the study period, that is, from the 2016/2017 financial year to 2021/2022 financial
ISSN: 2456 1878 (Int. J. Environ. Agric. Biotech.)
https://dx.doi.org/10.22161/ijeab.75.9
Fig.7: Singapore Airlines annual Scope 1 carbon dioxide (CO2) emissions from ground operations and the year on year change (%): 2010/11 2021/22
Source: Data derived from Singapore Airlines (2013, 2014, 2017, 2022).
4.3.5. Annual Carbon Dioxide (CO2) Emissions from Diesel Consumption
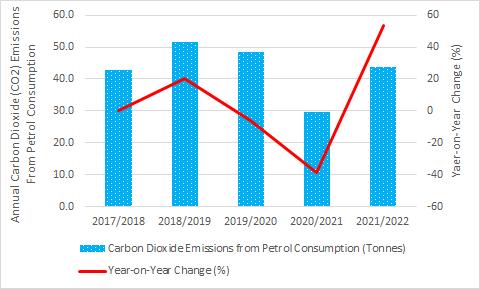
Singapore Airlines indirect (Scope 2) carbon dioxide (CO2) emissions from its ground vehicle diesel consumption and the associated year on year change (%) from the 2017/18 financial year to the 2021/22 financial year is presented in Figure 8 As can be observed in Figure 8, there has been an overall upward trend in this metric, when it increased from a low of 8.9 tonnes in the 2017/2018 financial year to a high of 29.2 tonnes in the 2021/2022 financial year. This overall upward is demonstrated by the year on year percentage change line graph, which is more positive than negative, that is, all values are above the line Figure 8 shows that there were two very substantial spikes in this metric during the study period. These significant increases were recorded in the 2018/2019 financial year (+59.55%) and in the 2019/2020 financial year (+91.54%), respectively (Figure 8), and reflected an increased demand for diesel fuel in both financial years Figure 8 shows that there were no recorded annual decreases in this metric during the study period.
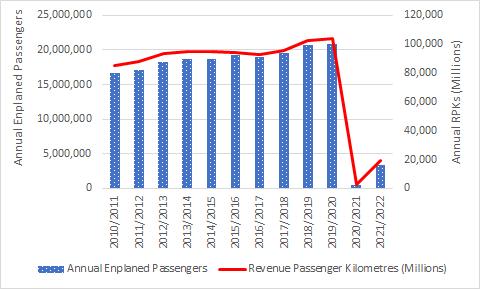
4.3.6. Annual Carbon Dioxide (CO2) Emissions from Petrol Consumption
Singapore Airlines indirect (Scope 1) carbon dioxide (CO2) emissions from its ground vehicle petrol consumption and the associated year on year change (%) from the 2017/2018 financial year to the 2021/2022 financial year are presented in Figure 9. Figure 9 shows that the annual carbon dioxide (CO2) emissions from its
petrol consumption increased by 20.32% in the 2018/2019 financial year, reflecting a higher demand for petrol in that financial year (Figure 9). There was a pronounced decrease in this metric during the 2020/2021 financial year, at which time it decreased by 38.55% on the previous year levels (Figure 9). As previously noted, Singapore Airlines was adversely impacted by the COVID 19 pandemic and the related government pandemic response measures in 2020. These factors influenced Singapore Airlines petrol consumption in the 2020/2021 financial year, and due to the lower demand for petrol there was an associated decrease in the airline’s carbon dioxide (CO2) emissions because of the lower petrol consumption in the 2020/2021 financial year. Figure 9 shows that there was a significant spike in this metric during the 2021/2022 financial year, at which time it increased by 53.69% on the 2020/2021 financial year levels. This increase could be attributed to the increased operational activities associated with the increase in flights operated by Singapore Airlines in the 2021/2022 financial year. As noted earlier, Singapore Airlines expanded the number of destinations that it served in the 2021/2022 financial year
2010/11 financial year to the 2021/2022 financial year As can be observed in Figure 10, the annual Scope 2 carbon dioxide (CO2) emissions from indirect energy (electricity) consumption have exhibited an overall downward trend during the study period. As discussed below, Singapore Airlines has implemented a wide range of energy efficiency measures that have played a key role in reducing the airline’s annual carbon dioxide (CO2) emissions from its electricity consumption. This overall downward trend is demonstrated by the year on year percentage change line graph, which is more negative than positive, that is, more values are below the line than above. Indeed, Figure 10 shows that there were only two annual increases in Singapore Airlines annual indirect Scope 2 carbon dioxide (CO2) emissions from its electricity consumption. These annual increases were recorded in the 2010/11 and 2021/2022 financial years. In the 2010/2011 financial year, Singapore Airlines annual carbon dioxide (CO2) emissions from its electricity consumption increased by 1.06% on the previous year levels. In the 2021/2022 financial year Singapore Airlines annual carbon dioxide (CO2) emissions from its electricity consumption increased by 1.46% on the previous year levels, with the increase reflecting a higher demand for electricity in the 2021/2022 financial year (Figure 10) As can be observed in Figure 10, there were three quite significant annual decreases in this metric.
Fig.8: Singapore Airlines annual Scope 1 carbon dioxide (CO2) emissions from diesel consumption and the year on year change (%): 2010/11 2021/22
Note: Data prior to 2017/2018 not available.
Source: Data derived from Singapore Airlines (2013, 2017, 2022).
4.4. Singapore Airlines Annual Scope 2 Carbon Dioxide (CO2) Emissions
Singapore Airlines indirect (Scope 2) greenhouse gas (GHG) emissions are those emissions that are produced from the generation of purchased electricity that is consumed in Singapore Airlines buildings (total gross floor area) and offices (total leased area). These emissions physically occur at the facilities where electricity is generated (Singapore Airlines, 2020). Figure 10 presents Singapore Airlines annual Scope 2 carbon dioxide (CO2) emissions from indirect energy consumption (electricity) and the year on year change for the period covering the
ISSN: 2456 1878 (Int. J. Environ. Agric. Biotech.)
https://dx.doi.org/10.22161/ijeab.75.9
Fig.9: Singapore Airlines annual Scope 1 carbon dioxide (CO2) emissions from petrol consumption and the year on year change (%): 2010/11 2021/22
Note: Data prior to 2017/2018 not available.
Source: Data derived from Singapore Airlines (2013, 2016, 2021, 2022).
These decreases occurred in the 2014/2015 financial year ( 10.63%), the 2017/2018 financial year ( 44.03%), and the 2020/2021 financial year ( 27.4%), respectively (Figure 10). In each of these years, Singapore Airlines was able to increase its passenger traffic and services, whilst at the same time reducing its annual electricity consumption, and thus, its carbon dioxide (CO2) emissions that are
produced from this energy source. This is a very favorable trend and suggests that the wide range of energy saving measures have had a significant impact on the annual level of Scope 2 carbon dioxide (CO2) emissions from the airline’s electricity consumption.
financial year, when it decreased by 86.31% on the 2020/2021 financial year levels. This was another favorable outcome as it demonstrated that Singapore Airlines was once again able to handle more passengers whilst at the same time reducing its electricity consumption per enplaned passenger, and this in turn, resulted in the significant decrease in this metric in the 2021/2022 financial year.
Fig.10: Singapore Airlines annual Scope 2 carbon dioxide (CO2) emissions from electricity consumption and the year on year change (%): 2010/11 2021/22


Source: Data derived from Singapore Airlines (2013, 2016, 2021, 2022).
Singapore Airlines annual Scope 2 carbon dioxide (CO2) emissions from electricity consumption per enplaned passenger and the year on year change (%) for the period covering the 2010/11 to 2021/22 financial years is depicted in Figure 11 Figure 11 shows that there was an overall downward trend in this metric from the 2010/2011 financial year to the 2019/2020 financial year. During this period, there were three quite significant annual decreases in this metric. These decreases were recorded in the 2012/2013 financial year ( 12.98%), the 2014/2015 financial year ( 11.19%), and the 2017/2018 financial year ( 45.48%), respectively (Figure 11). This was a very favorable outcome as it showed that the airline could handle higher levels of demand for its passenger services whilst at the same time reducing its electricity consumption, and hence, its carbon dioxide (CO2) emissions per enplaned passenger. However, there was one marked exception to this trend, which occurred in the 2020/2021 financial year. Figure 11 shows that there was a very substantial spike in this metric in the 2020/2021, when it increased by 3,221.1% on the 2019/2020 financial year levels. This substantial increase could be attributed to the annual decrease in passengers ( 97.81%) being a lot greater than the annual decrease in the airline’s electricity consumption ( 27.4%). As a result, there were fewer passengers to spread the electricity consumption related carbon dioxide (CO2) emissions over in the 2020/2021 financial year. Figure 11 also shows that there was quite a significant decrease in this metric during the 2021/2022
ISSN: 2456 1878 (Int. J. Environ. Agric. Biotech.)
https://dx.doi.org/10.22161/ijeab.75.9
Fig.11: Singapore Airlines annual Scope 2 carbon dioxide (CO2) emissions from electricity consumption per enplaned passenger and the year on year change (%): 2010/11 2021/22
Source: Data derived from Singapore Airlines (2013, 2016, 2021, 2022).
4.5. Singapore Airlines Carbon Footprint Mitigation Measures
4.5.1. Aircraft Weight Reduction Program
A significant development in the airline industry in recent times has been the efforts made by airlines to reduce the weight of their aircraft, and thus, reduce aircraft fuel burn and the associated harmful emissions (Gilani & Körpe, 2019).
The aircraft operated by airlines on their commercial services have a potable water uplift capability which is used to service the aircraft cabin and its associated amenities. Depending upon the size of the aircraft assigned to a flight, the potable water uplift can exceed 2,000 litres (Franzi, 2018). Airlines have also implemented potable water strategies whereby they carefully optimize the water uplift on flights to satisfy passenger requirements whilst at the same time achieving aircraft fuel burn reductions and the related emissions savings from the lower aircraft weight (Baxter, 2016).
Throughout the study period, Singapore Airlines has implemented initiatives both within the airlines that are part of the Singapore Airlines Group and with the Original Equipment Manufacturers (OEMs) that are designed to reduce the weight of its aircraft fleet. An example of such
a weight saving initiative was the optimization of the water uplift based on flight sector requirements through a tailored potable water program. A further weight saving initiative involved the removal of unutilized overhead storage compartments located in between the galleys of the airline’s Boeing 777 300ER aircraft. These two aircraft weight initiatives saved 2,400 tonnes of fuel per year whilst also reducing carbon dioxide (CO2) emissions by around 7,560 tonnes per annum (Singapore Airlines, 2017).
4.5.2. ASPIRE Program
The Asia and Pacific Initiative to Reduce Emissions (ASPIRE) program is a partnership of air traffic control service providers that is focused on environmental stewardship within the Asia/Pacific region (Singapore Airlines, 2014). On February 18, 2008, the ASPIRE agreement was signed in Singapore, with the original members being Australia’s and New Zealand’s air traffic service providers and the United States Federal Aviation Administration (FAA). The agreement was subsequently signed by the Japan, Singapore, and Thailand air traffic service providers (Nakamura et al., 2014; Woon Lee et al., 2018).
As part of the “ASPIRE Daily City Pair’ program”, regular “green” flights have been conducted between pairs of airports located throughout the Asia Pacific region. Under this program, the aviation authorities in Singapore, the United States, and Japan have also worked in partnership to ensure optimal air traffic conditions (Singapore Airlines, 2014). The first multi sector demonstration “green flight” operated by Singapore Airlines under the ASPIRE program was the airline’s flight SQ11. This flight operated from Los Angeles to Singapore, with a transit stopover in Tokyo, Tokyo on 31 January 2010. In total, the airline achieved a fuel saving of 6% as compared to a similar flight. This fuel saving translated into a reduction of 33,769 kg of carbon dioxide (CO2) emissions. On 16 May 2011, the first scheduled commercial service between Los Angeles and Singapore, flight number SQ37, was launched as part of the program. The non stop flight employed enhanced gate to gate air traffic management operational procedures that were designed to reduce both aircraft fuel burn and carbon dioxide (CO2) emissions. Other flight optimization measures included Dynamic Airborne Reroute Procedures, 30/30 Reduced Oceanic Separation, and Time Based Arrival Management and Arrival Optimization. These measures significantly reduce fuel burn and the carbon dioxide (CO2) emissions on the airline’s flights. According to Singapore Airlines, there is an average carbon dioxide (CO2) emission saving of 3.8 tonnes for each Los Angeles Singapore flight operated by the airline (Singapore Airlines, 2013). The Oceania region
ISSN: 2456 1878 (Int. J. Environ. Agric. Biotech.)
https://dx.doi.org/10.22161/ijeab.75.9
has been included in the ASPIRE program since 15 September 2012 (Singapore Airlines, 2015).
Under the ASPIRE program, Singapore Airlines commenced Singapore Canberra Wellington and vice versa flights in 2017 that used the range of ASPIRE practices. These ASPIRE practices included the use of favorable winds, reducing airborne holding, and enabling efficient continuous descent arrivals and reducing aircraft taxiing times. On an annual basis, the use of the ASPIRE Program practices would enable Singapore Airlines to reduce its aircraft fuel consumption by an estimated 1,500 tonnes of fuel and this would translate into annual saving of 4,600 tonnes of carbon dioxide (CO2) emissions on these flight sectors (Singapore Airlines, 2017). Singapore Airline’s non stop service between Singapore and San Francisco was included in the ASPIRE program in the 2017/18 financial year (Singapore Airlines, 2018).
4.5.3. Cleaner energy vehicles
In addition to the emissions produced from aircraft, the operation of the aircraft ground service equipment used to service aircraft during the time they are on the ground in between flights can also produce significant amounts of carbon dioxide (CO2) emissions (International Airport Review, 2010). Thus, the replacement of internal combustion engine powered airport ground support vehicles and equipment used by airlines and ground handling agents could potentially reduce carbon dioxide (CO2), carbon monoxide (CO), hydrocarbons (HC), nitrogen oxides (NOx), and particulate matter (PM) (Gellings, 2011). Singapore Airlines has been cognizant of the environmental impact of fossil fuel vehicles and equipment and, as a result, in the 2020/21 financial year, Singapore Airlines installed six electric vehicles (EV) charging stations and promoted the use of electric vehicles (Singapore Airlines, 2021).
4.5.4. Energy Conservation Measures
An important development in the global airline industry has been the strategy implemented by airlines to actively promote energy saving and carbon reduction measures These measures are being implemented to enable airlines to to reduce the greenhouse (GHG) gases that are generated in the provision of transportation services (Tsai et al., 2014). The associated environmental related benefit of reduced energy consumption is the reduction in carbon dioxide (CO2) emissions. Indeed, energy efficiency provides several important environmental benefits. Energy efficiency measures can reduce greenhouse (GHG) emissions, both direct emissions from fossil fuel combustion and consumption, as well as the indirect emissions reductions from electricity generation (International Energy Agency, 2022).
Throughout the study period, Singapore Airlines has introduced a range of facility and building related energy saving measures, which had a particular focus on air conditioning, ventilation, lightings, and lifts within the company’s buildings in Singapore. With the goal of ensuring environmental protection, a broad spectrum of measures was put in place under the airline’s Office Management System (OMS) (Singapore Airlines, 2015).
During the 2014/15 financial year, Singapore Airlines buildings and facilities were upgraded with more energy efficient equipment and technology. These energy efficiency measures included the upgrading of lifts with a more efficient model that had a variable voltage variable frequency (VVVF) motor, the changing of high bay lights from metal halide lamps to more energy efficient light emitting diode (LED) lights, the replacement of neon signs on the company’s main buildings with LED technology, the installation of a heat exchange system at the SilverKris Lounge at Changi Airport, which is used to produce hot water for the showers, and the replacement of an old chiller system with a higher energy efficiency model. These energy saving measures amounted to 80,000 kWh per month (Singapore Airlines, 2015) and this energy saving measure reduces carbon dioxide (CO2) emissions by around 68.83 tonnes per month. In the 2016/17 financial year, Singapore Airlines energy saving measures primarily focused on the management of air conditioning systems and lighting within its buildings. A key measure was the replacement of high bay lighting for hangar operations (Singapore Airlines, 2017). These measures reduced both energy consumption and the associated carbon dioxide (CO2) emissions. In the 2017/18 financial year, Singapore Airlines continued its energy saving measures program which included the completion of replacement of high bay lights project for the airline’s Hangar 1 from 1,000W sodium metal halide lamps to 400W dimmable LED high bay lights. This measure provided energy efficiency savings and lower carbon dioxide (CO2) emissions. Other energy efficiency measures included the ongoing replacement of fan coil units (FCUs) within the company’s buildings with more efficient models as well as the replacement of computer air conditioning units (CAUs) serving the aircraft simulator computers with higher efficiency units (Singapore Airlines, 2018b). In the 2018/19 financial year, Singapore Airlines conducted a study that focused on the potential use of solar energy to support the company’s use of “green” energy to meet its buildings’ energy requirements (Singapore Airlines, 2019) Green energy is “a sustainable energy source that zero or minimal environmental and economic impact, and can be obtained from solar, wind, hydro, geothermal, biomass, and other
ISSN: 2456 1878 (Int. J. Environ. Agric. Biotech.)
https://dx.doi.org/10.22161/ijeab.75.9
renewable sources” (Enescu, 2019). A tender was subsequently issued for the installation of solar panels at the airline’s Head Office building in Singapore (Singapore Airlines, 2019) Importantly, increasing the proportion of renewable energy consumption to replace part of the fossil energy consumption is regarded as very suitable solution for the problem of air pollution (Shen et al., 2020). This is because renewable energy sources reduce air pollution and cuts down carbon dioxide (CO2) emissions (Spellman, 2015; Xie et al., 2021). Furthermore, the use of solar power helps a firm to mitigate its greenhouse gases (GHGs) and achieve it sustainability objectives (Sreeneth et al., 2021). Other energy saving measures in the 2018/2019 financial year included the progressive upgrading of air conditioning equipment to ensure that the most energy efficient equipment is used in the company’s buildings and facilities. Singapore Airlines also continued the replacement of Fan Coil Units (FCUs) within its buildings with more efficient models, and the company continued to replace old light fittings with LED lighting (Singapore Airlines, 2019).
In the 2019/20 financial year, Singapore Airlines continued to implement energy reduction initiatives, and these resulted in an estimated 800 MWh of energy savings principally through adjustments to the operating parameters of its chiller plants and air handling units (AHU), and through the replacement of lighting with more energy efficient light emitting diode (LED) light fittings. In addition to its energy reduction initiatives, the airline started using renewable energy. As part of this strategy, Singapore Airlines entered a partnership with SembCorp Solar to install rooftop solar panels on three of its buildings: Airline House, SIA Training Centre and TechSQ. As well as delivering considerable energy savings, the new system has reduced the airline’s carbon dioxide (CO2) emissions by 4.3 million tonnes per year (Singapore Airlines, 2021).
In the 2021/2022 financial year, Singapore Airlines maintained its energy efficiency measures program. Consequently, an extensive number of energy efficiency measures were undertaken. These energy efficiency measures included the upgrade and adjustment of the operating parameters of one of its chiller plants and air handling units (AHU). The airline reduced unnecessary usage of utilities such as air conditioners, lighting, and IT hardware in the SIA Data Centre: The data centre used more energy efficient air conditioning and computer hardware. In addition, the airline progressively replaced lights with more energy efficient light emitting diode (LED) light fittings. During the 2021/2022 financial year, all the conventional metal halide high bay lights in the SIA Supplies Centre were retrofitted with energy efficient LED
high bay lights. The use of energy efficient LED high bay lights is expected to save 330,000kWh annually, which is equivalent to 135 tonnes of annual carbon dioxide (CO2) emissions savings. In the 2021/2021 financial year, Singapore Airlines also replaced goods and passenger lifts in the SIA Supplies Centre. Also, in the 2021/2022 financial year, Singapore Airlines let a tender for the replacement of chiller plant systems in the SIA Training Centre and TechSQ facilities. To optimize operating efficiency, existing chiller systems, which were no longer operating at its optimal performance and efficiency, will be combined into a larger and more efficient chiller system. The combined chiller system is expected to save more than 700,000kWh of energy annually. This will result in an annual reduction of 286 tonnes of carbon dioxide (CO2) emissions The new chiller system is anticipated to be commissioned in the fourth quarter of 2022/23 financial year (Singapore Airlines, 2022).
4.5.5. Improved Flight Operations Procedures
A key focus for Singapore Airlines environmentally sustainable operations has been the adoption of several improved flight operation measures that not only reduce aircraft fuel consumption but also the associated carbon dioxide (CO2) emissions. These measures include the use “continuous descent” operations and are designed to minimize fuel use (without impacting safety) (Singapore Airlines, 2017, 2018) A “continuous descent” operation is one in which the arriving aircraft descends continuously, to the greatest possible extent, by employing minimal engine thrust, prior to the final approach fix/final approach point (Young, 2018).
Operational procedures that reduce fuel burn for Singapore Airlines Airbus A380 operations have been implemented at London’s Heathrow Airport. Singapore Airlines Airbus A380 aircraft departing from Heathrow Airport use less power when taking off, resulting in fuel savings and less carbon dioxide (CO2) and nitrous oxide (NOx) emissions. Furthermore, Singapore Airlines optimization of flight operations and flight planning systems have led to more optimum flight route selection (Singapore Airlines, 2017, 2018b), and thus, a reduction in carbon dioxide (CO2) emissions.
In the 2021/2022 financial year, Singapore Airlines route structure for flights arriving at Singapore Changi Airport were reviewed, and, as a result, direct tracks on applicable flight routes enabled the airline to achieve better route efficiency. This initiative resulted in Singapore Airlines saving around 456 tonnes of fuel and 1,436 tonnes of carbon dioxide (CO2) emissions annually (Singapore Airlines, 2022).
ISSN: 2456 1878 (Int. J. Environ. Agric. Biotech.)
https://dx.doi.org/10.22161/ijeab.75.9
4.5.6. Improving Aircraft Zero Fuel Weight (ZFW) Used to Plan Aircraft Fuel Uplift
An aircraft’s maximum zero fuel weight (MZFW) is the maximum weight permitted on the aircraft before fuel is loaded. The MZFW is limited by the strength and aircraft airworthiness requirements (Jofré & Irrgang, 2000). Importantly, the maximum zero fuel weight (MZFW) defines the available payload capability on a given flight (Meijer, 2021). By improving the accuracy of an aircraft’s maximum zero fuel weight (MZFW), the correct amount of fuel is uplifted on the flight. This reduces the overall weight of the aircraft. Singapore Airlines has implemented a range of measures to improve the MZFW accuracy of its aircraft fleet. The airline has deployed a “ZFW Monitoring Dashboard”, which enables its Airport Operations department to monitor the MZFW of its aircraft fleet more closely. In the 2019/20 financial year, the optimization of aircraft MZFW resulted in an estimated 1,800 tonnes of fuel savings, which translated to an estimated annual saving of 5,670 tonnes of carbon dioxide (CO2) emissions (Singapore Airlines, 2020).
4.5.7. Modification to the Airbus A380 Trent 900 Engines
To enhance the performance of its fleet of Airbus A380 aircraft, Singapore Airlines has modified the aircraft’s Rolls Royce Trent 900 engines, which has resulted in annual savings of 10,010 tonnes of fuel and an annual reduction of 31,531.5 tonnes of carbon dioxide (CO2) emissions (Singapore Airlines, 2017, 2018b).
4.5.8. Removal of Economy Class Footrests in Selected Aircraft
In 2019, Singapore Airlines removed some Economy Class footrests on selected aircraft. This initiative saved around 200kg to 300kg per aircraft (Singapore Airlines, 2019). The lower aircraft weight translates into lower fuel burn, and thus, lower emission levels.
4.5.9. Singapore Airlines’ “Green Package” Flights
In May 2017, in accordance with the airline’s commitment to reduce international aviation emissions, Singapore Airlines partnered with the Civil Aviation Authority of Singapore (CAAS) and operated a series of 12 “green package” flights over a three month period on the airline’s non stop San Francisco Singapore route. These flights utilized Singapore Airlines latest generation and most fuel efficient aircraft the Airbus A350 900XWB aircraft as well as sustainable aviation fuels, and optimized air traffic management best practices (Singapore Airlines, 2019).
The 12 “green package” flights were powered by a combination of hydro processed esters and fatty acids (HEFA), a sustainable biofuel produced from used cooking
oils and conventional jet fuel. This fuel offers a life cycle potential reduction of 80% in carbon emissions when compared to traditional jet fuel (Singapore Airlines, 2019).
4.5.10. The Optimization of Aircraft Fuel Efficiency
An important characteristic of the global airline industry is that it is highly energy intensive (Baxter et al., 2021) and fuel intensive. As a result, high and volatile aircraft fuel prices can have a significant impact on an airline’s bottom lines (Liu, 2021). Nowadays, airlines are placing a high focus on jet fuel cost and aircraft fuel efficiency. The fuel cost is typically the largest cost for most airlines (Zhang & Zhang, 2018). Reducing aircraft fuel consumption affects an airline’s bottom line by reducing fuel costs and the related carbon dioxide (CO2) emissions (Johnson & Gonzalez, 2013). Thus, aircraft fuel efficiency has become one of the most important policy goals for airline operations management (Oliveira et al., 2021). Indeed, growing environmental concerns have attracted significant attention of the air transport industry in recent times towards the requirement for the judicious use of aviation fuel (Singh et al., 2018). Airlines and the aircraft manufacturers have invested in new technologies and strategies to reduce aircraft fuel consumption, and thus, reduce their carbon dioxide (CO2) aircraft emissions. Aircraft fuel has a close relationship with the emissions of carbon dioxide (CO2) (Zou et al., 2016).
Singapore Airlines has placed a high focus on its aircraft fuel efficiency and has implemented a range of measures that are designed to optimize its aircraft fuel efficiency. The added benefit of such a strategy is the reduction in carbon dioxide (CO2) emissions due to the lower amounts of fuel used on both its passenger and air cargo services. In the 2021/2022 financial year, Singapore Airlines carefully monitored its fuel usage to ensure an optimal level of uplifted fuel on its aircraft. The airline also sought to optimize its contingency fuel to reduce fuel uplift. Singapore Airlines also utilized more fuel efficient aircraft and engines for its long haul. This practice reduced the amount of fuel burnt during a flight. Also, in the 2021/2022 financial year, Singapore Airlines ensured that optimal flaps settings were used during take off to reduce the amount of fuel burnt (Singapore Airlines, 2022)
4.5.11. The Use of Aviation Biofuels
Prior to examining Singapore Airlines sustainable fuel strategy, it is important to note that the concerns related to climate change and energy supply have resulted in the production of more sustainable aviation fuels (SAF) (Brooks et al., 2016). As a result, there has been a growing interest by the global aviation industry in sustainable aviation fuels (SAF) (Trejo Pech et al., 2019). Accordingly, sustainable aviation fuels are increasingly
ISSN: 2456 1878 (Int. J. Environ. Agric. Biotech.)
https://dx.doi.org/10.22161/ijeab.75.9
being viewed as an ideal option for the airline industry to achieve large, near term emissions reductions (Staples et al., 2014). This is because the use of biomass and crop based sustainable aviation fuels can help reduce emissions in the aviation industry (McCollum et al., 2021). Consequently, airlines are now using aviation biofuel as an environment sustainability measure (Baxter et al., 2020; Goh et al., 2022). Depending upon the raw material used in its production, biofuels can reduce carbon dioxide (CO2) emissions by 60 80% (Bioenergy International, 2019; Tavares Kennedy, 2019).
Singapore Airlines has been an active member of the “Sustainable Aviation Fuel Users Group” (SAFUG) since 2011. SAFUG was established to accelerate the development and commercialization of Sustainable Aviation Fuels (SAF). Singapore Airlines views sustainable aviation fuels as a key long term measure to support the air transport industry’s carbon neutral growth goal beyond 2020. Accordingly, the airline has pledged to advance and adopt aviation biofuels produced in a sustainable way. The sustainable aviation fuels should have minimal impact on biodiversity, such fuels should meet a sustainability standard, in relation to land, water and energy use, the production of sustainable aviation fuels should not displace or compete with food crops; and these fuels should also provide a positive socio economic impact (Singapore Airlines, 2019).
In addition to the use of sustainable aviation fuels on its series of “Green Flights” in 2017, Singapore Airlines began working with Stockholm’s Swedavia Airport in 2020 on the use of sustainable aviation fuels (Becken, 2021). In January 2020, Singapore Airlines began a year long partnership with Swedish airport operator Swedavia. As part of Swedavia’s SAF Incentive Scheme, the airline commenced using a blend of jet fuel and SAF on its flights between Stockholm and Moscow (Singapore Airlines, 2020). This arrangement between the two parties continued in the 2020/21 financial year and resulted in a reduction of around 47 tonnes of carbon dioxide (CO2) (Singapore Airlines, 2021).
In the 2021/2022 financial year, Singapore Airlines together with Civil Aviation Authority of Singapore (CAAS) and Temasek conducted a year long pilot study that focused on ways to operationalize the deployment of blended sustainable aviation fuel (SAF) at Singapore Changi Airport (Singapore Airlines, 2022).
In February 2022, Singapore Airlines firmed up orders for 1.25 million litres of neat sustainable aviation fuel (SAF), which will be blended with refined jet fuel and delivered to Singapore Changi Airport for use on Singapore Airline and its subsidiary Scoot Tigerair flights from the third quarter
of 2022. This sustainable aviation fuel (SAF) pilot program is anticipated to reduce the two airlines carbon dioxide (CO2) emissions by around 2,500 tonnes per annum (Singapore Airlines, 2022)
In February 2022, Singapore Airlines was the first airline to sign the Global Sustainable Aviation Fuel (SAF) Declaration (Polek, 2022; Singapore Airlines, 2022; Tolba, 2022). The Global SAF Declaration calls on industry partners from the aerospace, aviation, and fuel value chains to jointly work together to increase the uptake of sustainable aviation fuel (SAF) as an important part of the industry’s decarbonization with the ambition of ensuring a steady ramp up in the use of sustainable aviation fuel (SAF) over the next decade (Travel News Asia, 2022) As previously noted, sustainable aviation fuel (SAF) offers a considerably smaller carbon dioxide (CO2) emission footprint when compared to the use of fossil fuels (Shahriar & Khanal, 2022).
4.5.12. The Use of Light Weight Flight Catering Items on Regional Services
In 2020, Singapore Airlines introduced a new regional economy class which offered passengers increased meal choices and these were accompanied with bamboo cutlery and sustainable paper packaging. The new packaging was lighter, weighing half that of plastics. This reduction in weight resulted in lower fuel consumption (Becken, 2021; Singapore Airlines, 2021), and thus, lower carbon dioxide (CO2) emissions.
4.5.13. The Use of Lightweight Air Cargo Containers
An important development in the global airline industry in recent times has been the use by airlines of light weight aircraft containers or unit load devices. These containers help to minimize aircraft weight without compromising the business volume of the lightweight aircraft unit load devices (ULDs) (Laniel et al., 2011). Aircraft unit load devices, or ULDs, are pallets and containers which are used to carry air cargo, mail and passenger baggage on wide body passenger and freighter aircraft (Baxter et al., 2014; Lu & Chen, 2011). The trend towards increased use of lightweight ULDs reflects airline’s objective of achieving fuel savings and reducing the carbon dioxide (CO2) impact within the industry (Bandi & Lumia, 2013).
Singapore Airlines is one such airline that has acquired light weight aircraft ULDs that contribute to its ability to reduce carbon dioxide (CO2) emissions (Singapore Airlines, 2021).
4.5.14. The Use of Mobile Ground Power Units
Electrical power is required on the airport apron for the servicing of aircraft prior to engine start up. (Ashford et al., 2013; Horonjeff et al., 2010; Kazda & Caves, 2015).
ISSN: 2456 1878 (Int. J. Environ. Agric. Biotech.)
https://dx.doi.org/10.22161/ijeab.75.9
As part of their environmental policy, Singapore Airlines uses mobile ground power units and preconditioned air units during night layovers and long transits to reduce the reliance on its aircraft auxiliary power units (APUs) (Singapore Airlines, 2017, 2019). This reduction in fuel consumption also translates into lower carbon dioxide (CO2) emissions. In the 2019/20 financial year, this measure delivered an estimated 910 tonnes in fuel savings, which translated into an annual saving of 2,867 tonnes of carbon dioxide (CO2) emissions (Singapore Airlines, 2020).
4.5.15. Total Mission Management (TMM)
In the 2020/21 financial year, Singapore Airlines Total Mission Management (TMM) Department collaborated with the airline’s Flight Operations Division and the Civil Aviation Authority of Singapore (CAAS) to introduce various initiatives whose objective was to improve operational efficiencies (Singapore Airlines, 2021). Singapore Airlines Total Mission Management (TMM) is a transversal department that works very closely with cabin crew, pilots, engineers, and airport staff to improve the airline’s operational excellence and flight punctuality (Lim, 2020). As part of this collaboration, the workgroup also explored opportunities to implement “green” operating procedures using a data driven approach. This objective was achieved through the development of data analytics tools from Rolls Royce for insights on flight data, together with regular meetings with the CAAS to assess Air Traffic Management (ATM) performance and to identify initiatives to improve flight efficiency of the Singapore air hub. As part of this collaboration, a range of ‘green’ operational initiatives was implemented, which resulted in the improved efficiency of flight operations in the Singapore airspace (Singapore Airlines, 2021).
At times, Singaporean airspace is often congested. As a result, flights may be required to hold for longer periods of time before landing, this leads to extra fuel burnt. To reduce the aircraft arrival holding periods, the TMM Department worked with the CAAS and the Singapore Airlines Flight Operations Division to sequence flights before they enter Singapore airspace to better provide adequate separation between flight arrivals (Singapore Airlines, 2022) This initiative resulted in an annual reduction of 1,808 tonnes of carbon dioxide (CO2) emissions (Singapore Airlines, 2021).
At the time of the present study, the TMM Department was still collaborating with the CAAS and the airline’s Flight Operations Division to review the route structure for flights arriving at Singapore. Direct flight tracks on applicable flight routes were introduced to achieve better aircraft route efficiency. In the 2020/21 financial year, an
initial trial was carried out between September 2020 and January 2021 to establish the process, and this trial was subsequently extended to November 2021. The trial was subsequently extended to include new routes. This initiative reduced Singapore Airlines annual carbon dioxide (CO2) emissions by 599 tonnes (Singapore Airlines, 2021).
Due to the normally high air traffic density in Singapore’s airspace, flights arriving in Singapore are typically subjected to step descents. This practice results in higher aircraft fuel burn. During the 2020/21 financial year, the TMM Department worked closely with the CAAS to establish a procedure that reduces the steep descent for flights entering the Singapore airspace, and this in turn reduces aircraft fuel burn. This initiative had favorable an environmental impact as it reduced Singapore Airlines annual carbon dioxide (CO2) emissions by an estimated 725 tonnes in the 2020/ 2021 financial year (Singapore Airlines, 2021). A similar situation occurred in the 2021/2022 financial year, when the airline reduced its carbon dioxide (CO2) emissions by 2,041 tonnes by using this enhanced airspace management procedure (Singapore Airlines, 2022).
The Cost Index (CI) that is used by Singapore Airlines is a ratio that defines the time related cost versus cost of fuel when operating an aircraft on a flight. This figure is calculated at the pre flight stage so that the economical speed for the flight can be determined. As part of Singapore Airlines Cost Index Adjustment process, the TMM Department monitors each aircraft’s flight time and adjusts the CI at the flight planning stage to achieve on time performance whilst also conserving fuel by utilizing a lower CI when flights are estimated to arrive at Singapore ahead of schedule. This initiative reduced Singapore Airlines annual carbon dioxide (CO2) emissions by around 1,827 tonnes in the 2020/21 financial year (Singapore Airlines, 2021). In the 2021/2022 financial year, Singapore Airlines achieved a saving of 602 tonnes of fuel that was equivalent to 1,896 tonnes of carbon dioxide (CO2) emissions saved from using this operational efficiency measure (Singapore Airlines, 2022).
4.5.16. Washing of Aircraft Engines
Singapore Airlines has implemented an aircraft fleet wide engine washing program (Singapore Airlines, 2017). This program has resulted in lower annual carbon dioxide (CO2) emissions of around 32,670 tonnes of carbon dioxide (CO2). Since the 2018/19 financial year, this initiative has been implemented by the airline for their Rolls Royce Trent XWB and Trent 1000 engines on the airline’s fleet of Airbus A350 900XWB and Boeing 787 10 aircraft respectively. As of 31 March 2022, 148 tonnes
ISSN: 2456 1878 (Int. J. Environ. Agric. Biotech.)
https://dx.doi.org/10.22161/ijeab.75.9
of fuel, equivalent to 466 tonnes of carbon dioxide (CO2) emissions, had been saved from optimized engine washing in the 2021/22 financial year (Singapore Airlines, 2022).
4.6. Singapore Airlines Passenger Carbon Offsets Program
Singapore Airlines (SIA) and its low cost carrier (LCC) Scoot subsidiary introduced a voluntary carbon offsets program in June 2021. This program enables the airline’s passengers to offset their share of the flight's carbon emissions by contributing to environmental projects in Indonesia, India, and Nepal. Under the program, passengers can purchase carbon offsets from dedicated microsites before or after a flight. From late 2021, the airline’s passengers would be able to use their “KrisFlyer” miles and “HighFlyer” points to purchase carbon offsets (Surgenor, 2021; The Business Times, 2021). The airline’s carbon offset environmental projects include the protection of forests in Indonesia, supporting renewable solar energy projects in India, and the provision of efficient, clean burning cookstoves for rural families in Nepal (Baker, 2021; Otley, 2021; Surgenor,2021).
V. CONCLUSION
In conclusion, this study has investigated Singapore Airlines annual carbon footprint as well as the strategies defined and implemented by Singapore Airlines to mitigate the environmental impact from its flights, ground operations, and Singapore based facility and building energy consumption related carbon dioxide (CO2) emissions. To achieve the objectives of the study, Singapore Airlines was selected as the case airline. The research was underpinned by an in depth qualitative longitudinal case study research approach. The study’s qualitative data was examined using document analysis. The study was supported by a case study research framework that followed the recommendations of Yin (2018).
Singapore Airlines has defined and implemented a very comprehensive environmental policy and has pledged to achieve net zero carbon emissions by 2050. This goal will be attained through the reinforcement of its long held strategy of working towards decarbonization and environmental sustainability across its global operations. The case study also revealed that Singapore Airlines is an active participant in the “Singapore Green Plan 2030”, and thus, the airline is aligning its green objectives with the “Singapore Green Plan”. Singapore Airlines has also embraced the International Air Transport Association (IATA) climate targets, and this is underpinned by the four pillars of Singapore Airlines environmental policy.
The case study found that Singapore Airline’s carbon footprint is comprised of its Scope 1 emissions that are produced from the provision of passenger and air cargo services together with the carbon dioxide (CO2) emission produced from its ground operations, and the Scope 2 indirect emissions which are produced from the airline’s consumption of electricity at its Singapore hub. Singapore Airlines principal sources of carbon dioxide (CO2) emissions is from its passengers’ services and its consumption of electricity. A key finding of the case study is that despite Singapore Airlines growing the number of passengers carried, the number of destinations served and its aircraft fleet size, the annual Scope 1 carbon dioxide (CO2) emissions have developed at a rate that is much lower than the growth in enplaned passengers. This is a very favorable trend that was helped by the extensive carbon dioxide (CO2) reduction measures implemented by the airline over the study period. Over the study period, Singapore Airlines Scope 2 carbon dioxide (CO2) emissions exhibited an overall downward trend. This very favorable decrease was positively impacted by the large range of energy efficiency measures implemented by Singapore Airlines throughout the study period. The case study revealed that Singapore Airlines annual Scope 1 carbon dioxide (CO2) emissions from fossil fuel consumption oscillated throughout the study, reflecting differing usage requirements. In addition, air cargo is a core business product of Singapore Airlines and throughout the study period its cargo division, SIA Cargo, operated a fleet of Boeing 747 400 freighters that linked key air cargo markets with its Changi Airport Hub. The total annual Scope 1 carbon dioxide (CO2) emissions from freighter services largely exhibited a general downward trend over the study period. This was a very favorable response given the number of services provided by SIA Cargo throughout the study period.
A key finding of the case study is that Singapore Airlines has implemented a wide range of carbon dioxide (CO2) emissions reduction measures that have focused on the reduction in aircraft weight which delivers fuel burn savings, and thus, lower carbon dioxide (CO2) emissions, improved operational procedures, optimization of air space management in collaboration with key air traffic control agencies, the use of cleaner energy vehicles, an extensive range of energy efficiency measures in its buildings and facilities, the use of sustainable aviation fuels, and the use of more energy efficient ground power sources when its aircraft have night layovers and long transits. Finally, Singapore Airlines has implemented a passenger carbon offsetting program, which enables passengers to offset carbon dioxide (CO2) emissions by contributing to projects in Central Kalimantan in Indonesia, solar power projects in
ISSN: 2456 1878 (Int. J. Environ. Agric. Biotech.)
https://dx.doi.org/10.22161/ijeab.75.9
India, and a final project that is providing more efficient, clean burning stoves for rural homes located in Nepal.
REFERENCES
[1] AirNewZealand.(2018).Sustainabilityreport2018. Retrievedfrom https://www.airnewzealand.com.au/sustainability reporting and communication.
[2] AirTransportActionGroup.(2011).Theeconomicand socialbenefitsofairtransport.Retrievedfrom https://www.icao.int/meetings/wrdss2011/documents/joint workshop2005/atag_socialbenefitsairtransport.pdf.
[3] Airbus.(2018).Firstultra longrangeA350XWB deliveredtoSingaporeAirlines.Retrievedfrom https://www.airbus.com/en/newsroom/press releases/2018 09 first ultra long range a350 xwb delivered to singapore airlines.
[4] Allaby,M.,&Park,C.(2007). Dictionary of environment & conservation.Oxford:OxfordUniversityPress.
[5] Andrew, D.P.S., Pedersen, P.M., & McEvoy CD. (2011). Research methods and design in sport management Champaign:HumanKinetics.
[6] Ang, S.H. (2014). Research design for business & management.London:SAGEPublications.
[7] Ashford,N.J.,MartinStanton,H.P.,Moore,C.A.,Coutu, P.,&Beasley,J.R.(2013). Airport operations (3rded.). NewYork:McGraw Hill.
[8] Ashok,A.,Balakrishnan,H.,&Barrett,S.R.H.(2017). ReducingtheairqualityandCO2 climateimpactsoftaxi andtakeoffoperationsatairports. Transportation Research Part D: Transport and Environment,54,287 303. https://doi.org/10.1016/j.trd.2017.05.013
[9] AsianAviation.(2021).SingaporeAirlinesGroupcommits tonetzerocarbonemissions. Retrievedfrom https://asianaviation.com/singapore airlines group commits to net zero carbon emissions/.
[10] Attanasio,G.(2018).NaplesInternationalAirportand airportcarbonaccreditation(ACA).In J.Casares,J. Longhurst,G.Passerini,G.Perillo&J.Barnes (Eds.), WIT transactions on ecology and the environment: Air pollution XXVI (pp.465 474) Southampton:WITPress.
[11] AustralianAviation (2018).SingaporeAirlinestakesits firstBoeing787 10.Retrievedfrom https://australianaviation.com.au/2018/06/singapore airlines takes its first boeing 787 10/.
[12] Babakhani,N.,Ritchie,B.W.,&Dolnicar,S.(2017). Improvingcarbonoffsettingappealsinonlineairplane ticketpurchasingtestingnewmessages,andusingnewtest methods Journal of Sustainable Tourism,25(7),955 969 https://doi.org/10.1080/09669582.2016.1257013
[13] Baker,M.B.(2021).SingaporeAirlineslaunchescarbon offsetmicrosites.Retrievedfrom https://www.businesstravelnews.com/Transportation/Air/Si ngapore Airlines Launches Carbon Offset Microsites.
[14] Bandi, S., & Lumia, R. (2013). Cycle time reduction of a composite panel manufacturing line. International Journal
International Journal of Environment,
of Mechanical Engineering and Robotics Research, 2(2), 189 203.
[15] Barczak, A., Dembińska, I., Rozmus, D., &; Szopik Depczyńska, K. (2022). The impact of COVID 19 pandemic on air transport passenger markets Implications for selected EU airports based on time series models analysis. Sustainability, 14, 4345. https://doi.org/10.3390/su14074345
[16] Baxter, G. (2016). AERO2410 Airline operations: Topic 6 Learning guide Airline capacity management and passenger aircraft fleet planning. Melbourne: RMIT University.
[17] Baxter, G. (2021a). Mitigating an airport’s carbon footprint through the use of “green” technologies: The case of Brisbane and Melbourne Airports, Australia. International Journal of Environment, Agriculture and Biotechnology, 6(6),29 39.https://dx.doi.org/10.22161/ijeab.66.4
[18] Baxter,G.(2021b).Towardscarbonneutralairline operationsby2045:ThecaseofFinnairPLC. International Journal of Environment, Agriculture and Biotechnology, 6(6),352 370.https://dx.doi.org/10.22161/ijeab.66.38
[19] Baxter,G.,Kourousis,K.,&Wild,G.(2014).Fireresistant aircraftunitloaddevicesandfirecontainmentcovers: A newdevelopmentintheglobalaircargoindustry. Journal of Aerospace Technology and Management,6(2),202 209. https://doi.org/10.5028/jatm.v6i2.327
[20] Baxter,G.,Srisaeng,P.,&Wild,G.(2020).Theuseof aviationbiofuelsasanairportenvironmentalsustainability measure:ThecaseofOsloGardermoenAirport Magazine of Aviation Development,8(1),6 14.
[21] Baxter, G., Srisaeng, P., & Wild, G. (2021). A qualitative assessment of a full service network airline sustainable energy management: The case of Finnair PLC WSEAS Transactions on Environment and Development, 17, 167 180.
[22] Becken,B.(2021).SingaporeAirlinestargetsnetzero carbonemissionsby2050. Retrievedfrom https://www.businesstravelerusa.com/business traveler usa story/singapore airlines targets net zero carbon emissions by 2050/.
[23] Becken,S.,&Mackey,B.(2017).Whatroleforoffsetting aviationgreenhousegasemissionsinadeep cutcarbon world? Journal of Air Transport Management,63,71 84. https://doi.org/10.1016/j.jairtraman.2017.05.009
[24] Belobaba,P.P.(2016).Overviewofairlineeconomics, markets,anddemand.InP.Belobaba,A.Odoni&C. Barnhart(Eds.), The global airline industry (pp.47 74) (2nded.).Chichester:JohnWiley&Sons.
[25] BioenergyInternational.(2019).Finnairintroducescarbon offsettingandbiofuelserviceforcustomers. Retrieved fromhttps://bioenergyinternational.com/markets finance/finnair introduces carbon offsetting and biofuel service for customers.
[26] Birtles,P.(1998). Boeing 777.Osceola:MBIPublishing Company.
[27] Bows Larkin,A.,Mander,SL.,Traut,M.B.,Anderson, K.L.,&Wood,R.F.(2016)Aviationandclimatechange Thecontinuingchallenge.In R.Agarwal,F.Collier,A.
ISSN: 2456 1878 (Int. J. Environ. Agric. Biotech.)
https://dx.doi.org/10.22161/ijeab.75.9
and
Schaefer&A.Seabridge,A.(Eds.). Green aviation (pp.3 13).Chichester:JohnWiley&Sons.
[28] Bråthen, S., & Halpern, N. (2012). Air transport service provision and management strategies to improve the economic benefits for remote regions. Research in Transportation Business & Management, 4, 3 12. https://doi.org/10.1016/j.rtbm.2012.06.003
[29] Brimson, S. (1985). The airlines of the world. Sydney: DreamweaverBooks.
[30] Brooks, K.P., Snowden Swan, l.J., Jones, S.B., Butcher, M.J., Lee, J.S.J., Anderson, D.M., Frye, J.G., Holladay, J.E., Owen, J., Harmon, L., Burton, F., Palou Rivera, I., Plaza, J., Handler, R., & Shonnard, D. (2016). Low carbon aviation fuel through the alcohol to jet pathway. In C. Chuck (Ed.), Biofuels for aviation: Feedstocks, technology, and implementation (pp. 109 146). London: Academic Press.
[31] Budd, T. (2017). Environmental impacts and mitigation. In L. Budd & S. Ison (Eds.), Air transport management: An international perspective (pp. 283 306). Abingdon: Routledge.
[32] Çabuk, S., Güreş, N., İnan, H., & Arslan, S. (2019). A survey on the attitudes of passengers towards green airlines Yaşar Üniversitesi E Dergisi,14 (55), 237 250. DOI:10.19168/jyasar.452297
[33] Cadarso, M.A., Gómez, N., López, L.A., & Tobarra, M.A. (2016). Calculating tourism's carbon footprint: Measuring the impact of investments. Journal of Cleaner Production, 111(Part B), 529 537. https://doi.org/10.1016/j.jclepro.2014.09.019
[34] Caves, R. (2003). The social and economic benefits of aviation. InP. Upham, J. Maughan, D. Raper&C.Thomas (Eds.), Towards sustainable aviation (pp. 36 47). London: EarthscanPublications.
[35] Chan, G.S.H., Wang, B.Y., Zhang, V.X., & Li, M.Z. (2021). Predicting psychological benefit in green airlines passengers affect organization corporate image to switching decision. International Journal of Social Science Research,3(4),183 200.
[36] Chan, D. (2000) The story of Singapore Airlines and the Singapore Girl Journal of Management Development, 19(6), 456 472. https://doi.org/10.1108/02621710010372873
[37] Chant, C. (1997). Airlines of the world. London: Tiger BooksInternational.
[38] Chavan, R. (2016). Understanding climate change and its mitigation.Mumbai:PartridgePublishing.
[39] Chen, F.Y. (2013). The intention and determining factors for airline passengers' participation in carbon offset schemes. Journal of Air Transport Management,29,17 22. https://doi.org/10.1016/j.jairtraman.2013.01.001
[40] Chng, K., &Ong, K.W.(2021).TheSingaporeGreen Plan 2030: Analysing its implications on law and the legal industry in Singapore. Environmental Law Review, 23(4), 336 343.https://doi.org/10.1177/14614529211052597
[41] Climate Council. (2022). What does net zero emissions mean? Retrieved from
https://www.climatecouncil.org.au/resources/what does net zero emissions mean/.
[42] Cokorilo, O., & Tomic, L. (2019). CORSIA Carbon offsetting and reduction scheme for international aviation: Challenge and practice. In I. Grgurević & T. Rožić (Eds.), Proceedings of the International Scientific Conference “Science and Traffic Development” (ZIRP 2019), 9th 10th May, Opatija, Croatia (pp.105 112).
[43] Culberson. S.D. (2011). Environmental impacts ofairports. In N.J. Ashford., S.A. Mumayiz & P.H. Wright (Eds.), Airport engineering: Planning, design, and development of 21st century airports (pp. 704 738) (4th ed.). Hoboken: JohnWiley&Sons.
[44] Daley, B. (2016). Air transport and the environment Abingdon:Routledge.
[45] Daley, B., & Thomas, C. (2016). Challenges to growth: Environmental issues and the development of the air transport industry. In J.F. O’Connell & G. Williams (Eds.), Air transport in the 21st century: Key strategic developments (pp.269 294).Abingdon:Routledge.
[46] De Grosbois, D., &Fennell, D. (2011). Carbon footprint of the global hotel companies: Comparison of methodologies and results. Tourism Recreation Research, 36(3), 231 245. https://doi.org/10.1080/02508281.2011.11081669
[47] Derrington,M.L.(2019). Qualitative longitudinal methods: Researching implementation and change. Thousand Oaks: SAGEPublications.
[48] Djalante, R., Nurhidayah, L., Van Minh, H., Phuong, N.T.N., Mahendradhata, Y., Trias, A., Lassa, J., & Miller, M.A. (2020). COVID 19 and ASEAN responses: Comparative policy analysis. Progress in Disaster Science, 8,100129.https://doi.org/10.1016/j.pdisas.2020.100129
[49] Drewer, J., Howard, D., & McNamara, N. (2018). Greenhouse gas (GHG) and biogenic volatile organic compound (bVOC) fluxes associated with land use change to bio energy crops. In P. Thornley & P. Adams (Eds.), Greenhouse gas balances of bioenergy systems (pp.77 96). London:AcademicPress.
[50] Dube, K., Nhamo, G., & Chikodzi, D. (2021). COVID 19 pandemic and prospects for recovery of the global aviation industry. Journal of Air Transport Management, 92, 102022.https://doi.org/10.1016/j.jairtraman.2021.102022
[51] Elsom,D.(2013). Managing urban air quality.London: Earthscan.
[52] Enescu,D.(2019).Preface.InD.Enescu(Ed.), Grenn energy advances (p.ix).London:InTechOpenPublishing.
[53] Fatihah,S.,&AbdulRahim,A.S.(2017).Thewillingness topayofairtravelpassengerstooffsettheircarbondioxide (CO2)emissions:APutrajayaresidentcasestudy. Journal of Tourism, Hospitality and Environment Management, 2(5),18 32.
[54] FederalAviationAdministration (2022).Carbon OffsettingandReductionSchemeforInternational Aviation.Retrievedfrom https://www.faa.gov/about/office_org/headquarters_offices /apl/aee/corsia.
[55] Ehmer,H.,Berster,P.,Bischoff,G., Grimme,W., Grunewald,E.,&Maertens,S.(2008).Analysesofthe
ISSN: 2456 1878 (Int. J. Environ. Agric. Biotech.)
https://dx.doi.org/10.22161/ijeab.75.9
Europeanairtransportmarket:Airlinebusinessmodels. Retrievedfrom https://ec.europa.eu/transport/sites/transport/files/modes/air /doc/abm_report_2008.pdf.
[56] Filimonau, V., Mika, M., & Pawlusiński, R. (2018). Public attitudestobiofueluseinaviation:Evidencefroman emergingtouristmarket. Journalof Cleaner Production, 172,3102 3110. https://doi.org/10.1016/j.jclepro.2017.11.101
[57] Fischlin,A.&Ivanova,M.(2017).Introduction:Scientific andpoliticaldriversfortheParisAgreement.InD.Klein, M.P.Carazo,M.Doelle,J.Bulmer&A.Higham(Eds.), The Paris Agreement on climate change: Analysis and commentary (pp.3 26).Oxford:OxfordUniversityPress.
[58] Franzi,M.(2018).Rampoperations.InP.J.Bruce,Y.Gao &J.M.C.King(Eds.), Airline operations: A practical guide (pp.181 194).Abingdon:Routledge.
[59] Gautam,M.,Pandey,B.,&Agrawal,M.(2012).Carbon footprintofaluminumproduction:Emissionsand mitigation.InS.S.Muthu(Ed.), Environmental carbon footprints: Industrial case studies (pp.197 228).Oxford, UK:Butterworth Heinmann.
[60] Gellings,C.W.(2011). Saving energy and reducing CO2 emissions with electricity.Lilburn:TheFairmontPress.
[61] Gilani,M.,&Körpe,D.S.(2019).Airlineweightreduction tominimizedirectoperatingcost.In Proceedings of the 4th International Aviation Management Conference (4th INTAVIC), Ankara, Turkey, November 18 19 (pp.1 12).
[62] Gillen,D.(2017).Aviationeconomicsandforecasting.In L.Budd&S.Ison(Eds.), Air transport management: An international perspective (pp.27 45).Abingdon: Routledge.
[63] Girella, L. (2018). The boundaries in financial and non financial reporting: A comparative analysis of their constitutive role.Abingdon:Routledge.
[64] Goh, B.H.H., Chong, C.T., Ong, H.C., Seljak, T., Katrašnik, T., Józsa, V., Ng, J.H., Tian, B., Karmarkar, S., & Ashokkumar, V. (2022). Recent advancements in catalytic conversion pathways for synthetic jet fuel produced from bioresources. Energy Conversion and Management, 251, 114974. https://doi.org/10.1016/j.enconman.2021.114974
[65] Graham, A. (2018). Managing airports: An international perspective (5thed.).Abingdon:Routledge.
[66] Green, W., & Swanborough, G. (1975). The Observer’s world airlines and airliners directory. London: Frederick Warne&Co.
[67] Greenhouse Gas Protocol. (2022). About us. Retrieved fromhttps://ghgprotocol.org/about us.
[68] Greer, F., Rakas, J., & Horvath, A. (2020). Airports and environmental sustainability: A comprehensive review. Environmental Research Letters,15(10),103007.
[69] Grote, M., Williams, I., &Preston, J. (2014). Direct carbon dioxide emissions from civil aircraft. Atmospheric Environment, 95, 214 224. https://doi.org/10.1016/j.atmosenv.2014.06.042
[70] Gupta Kapoor, N. (2017). Scoot and Tigerair merge. Retrieved from
https://www.businesstraveller.com/business travel/2017/07/26/scoot tigerair merge/
[71] Harrison, R.M., Masiol, M., & Vardoulakis, S. (2015). Civil aviation, air pollution and human health. Environmental Research Letters,10,041001.
[72] Hassett, M., & Paavilainen Mäntymäki, E. (2013). Longitudinal research in organizations: An introduction. In M. Hasset & E. Paavilainen Mäntymäki (Eds.), Handbook of longitudinal research methods in organisation and business studies (pp. 1 12). Cheltenham: Edward Elgar Publishing.
[73] Hazel, R.A., Blais, J.D., Browne, T.J., & Benzon, D.M. (2011). Resource guide to airport performance indicators Airport Cooperative Research Program Report 19A. Washington:TransportationResearchBoard.
[74] Heracleous, L., & Wirtz J. (2012). Strategy and organisation at Singapore Airlines: Achieving sustainable advantage through dual strategy. In O. Inderwildi & S. King (Eds.), Energy, transport, & the environment (pp. 479 493).London:Springer.
[75] Holloway, S. (2016). Straight and level: Practical airline economics (3rded.).Abingdon:Routledge.
[76] Horonjeff,R.,McKelvey,F.X.,Sproule,W.J.,&Young, S.B.(2010). Planning & design of airports (5thed.). New York:McGraw Hill.
[77] Hrasky,S.(2012).Carbonfootprintsandlegitimation strategies:Symbolismoraction? Accounting, Auditing & Accountability Journal,25(1),174 198. https://doi.org/10.1108/09513571211191798
[78] Hu,Y.J.,Yang,L.,Wang,H.,Li,C.,&Tang,B.J.(2022). Strategiestomitigatecarbonemissionsforsustainable aviation:Acriticalreviewfromalife cycleperspective. Sustainable Production and Consumption,33,788 808. https://doi.org/10.1016/j.spc.2022.08.009
[79] Huat,C.B.(2016).State ownedenterprises,state capitalismandsocialdistributioninSingapore. The Pacific Review, 29(4),499 521. https://doi.org/10.1080/09512748.2015.1022587
[80] Iatrou,K.,&Alamdari,F.(2005).Theempiricalanalysis oftheimpactofalliancesonairlineoperations. Journal of Air Transport Management,11(3),127 134. https://doi.org/10.1016/j.jairtraman.2004.07.005
[81] InternationalAirTransportAssociation.(2016).IATA carbonoffsetprogram:Frequentlyaskedquestions. Retrievedfrom http://www.iata.org/contentassets/922ebc4cbcd24c4d9fd55 933e7070947/icop20faq20general20for20airline20particpa nts20jan202016.pdf.
[82] InternationalAirTransportAssociation.(2021).Airline industrystatisticsconfirm2020wasworstyearonrecord. Retrievedfrom https://www.iata.org/en/pressroom/pr/2021 08 03 01/.
[83] InternationalAirTransportAssociation,(2022a).Enabling voluntarycarbonoffsetting.Retrievedfrom https://www.iata.org/en/programs/environment/carbon offset/.
[84] InternationalAirTransportAssociation.(2022b).Fuel efficiency.Retrievedfrom
ISSN: 2456 1878 (Int. J. Environ. Agric. Biotech.)
https://dx.doi.org/10.22161/ijeab.75.9
https://www.iata.org/en/programs/ops infra/fuel/fuel efficiency/.
[85] InternationalAirTransportAssociation.(2022c).Netzero CO2 emissionsgoaltopsachievementsat41stICAO Assembly.PressReleaseNo.47.Retrievedfrom https://www.iata.org/en/pressroom/2022 releases/2022 10 07 01/.
[86] InternationalAirportReview.(2010).UKairportoperators launchnewguidelinestoreduceaircraftgroundemissions. Retrievedfrom http://www.internationalairportreview.com/2717/airport news/uk airport operators launch new guidelines to reduce aircraft ground emissions/.
[87] InternationalCivilAviationOrganization.(2014). Environmental technical manual: Volume II: Procedures for the emissions certification of aircraft engines (2nded.). Document9501:AN/929.Montreal:ICAO.
[88] (InternationalCivilAviationOrganization (2022).States adoptnet zero2050globalaspirationalgoalfor internationalflightoperations.Retrievedfrom https://www.icao.int/Newsroom/Pages/States adopts netzero 2050 aspirational goal for international flight operations.aspx
[89] InternationalEnergyAgency.(2022).Multiplebenefitsof energyefficiency.Retrievedfrom https://www.iea.org/reports/multiple benefits of energy efficiency/emissions savings.
[90] Jackson,R.(2021). Airbus A380.Barnsley:Pen&Sword Aviation.
[91] Javed,T.,Ahmed,A.,Raman,V.,Alqualty,A.B.S.,& Johansson,B.(2019).Combustion basedtransportationin acarbonconstrainedworld Areview.InR.A.Agarwal., A.K.Agarwal.,T.Gupta.&N.Sharma(Eds.), Pollutants from energy sources: Characterization and control (pp.7 34).Singapore:SpringerNatureSingapore.
[92] Janić, M. (2011). Greening airports: Advanced technology and operations.London:Springer Verlag.
[93] Janić, M. (2014). Greeningcommercialairtransportation byusingliquidhydrogen(LH2)asafuel. International Journal of Hydrogen Energy,39(29),16426 16441. https://doi.org/10.1016/j.ijhydene.2014.08.011
[94] Jha,G.,Soren,S.,&DeoMehta,K.(2021).Carbon footprintassessmentwithLCAmethodology.InS.S. Muthu(Ed.), LCA based carbon footprint assessment (pp. 1 34).Singapore:SpringerNatureSingapore.
[95] Johnson,M.E.,&Gonzalez,A.(2013).Estimatingcost savingsforaviationfuelandCO2emissionreductions strategies. Collegiate Aviation Review,31(2),79 102. https://doi.org/10.22488/okstate.18.100513
[96] Jofré,M.,&Irrgang,M.E.(2000).Integrationofcargoand passengeroperations.InG.F.Butler&M.R.Keller(Eds.), Handbook of airline operations (pp.259 271).NewYork: McGraw Hill.
[97] Jones,M.(2009). Sustainable event management: A practical guide (2nded.).Abingdon:Routledge.
[98] Kapadia,Z.Z.,Spracklen,D.V.,Arnold,S.R.,Borman, D.J.,Mann,G.W.,Pringle,K.J.,Monks,S.A,Reddington, C.L.,Benduhn,F.,Rap,A.,Scott,C.E.,Butt,E.W.,&
Yoshioka,M.(2016).Impactsofaviationfuelsulfur contentonclimateandhumanhealth. Atmospheric Chemistry and Physics,16,10521 10541. https://doi.org/10.5194/acp 16 10521 2016
[99] Karakuş, G., Sak, F.S., & Altınel, A. (2021). Theimpactof theCoronavirus(COVID 19)pandemiconairport operations: A study in Turkey. In M. Demir, A. Dalgıç & and F. Doğanay Ergen (Eds.), Handbook of research on the impacts and implications of COVID 19 on the tourism industry (pp.558 582).Hershey:IGIGlobal.
[100] Katila,P.,PierceColfer,C.J.,deJong,W.,Galloway,G., Pacheco,P.,&Winkel,G.(2019).Introduction.InP. Katila.,C.J.Pierce.,C.J.Colfer.,W.deJong.,G. Galloway.,P.Pacheco&G.Winkel (Eds.), Sustainable development goals (pp.1 16).Cambridge:Cambridge UniversityPress.
[101] Kazda,A. &Caves,R.E.(2015). Airport design and operation (2nded.).Bingley:EmeraldGroupPublishing.
[102] Kingsley Jones,M.(2008).Failureneveranoption. Flight International,173(5123),32 33.
[103] Köne, A.C., & Büke, T. (2010). Forecasting of CO2 emissions from fuel combustion using trend analysis. Renewable and Sustainable Energy Reviews, 14(9), 2906 2915.https://doi.org/10.1016/j.rser.2010.06.006
[104] Laniel, M., Uysal, J., & Emond, J. P. (2011). Radio frequency interactions with air cargo container materials for real time cold chain monitoring. Applied Engineering in Agriculture,27(4),647 652.
[105] Laurent, A, Olsen, S.I., & Hauschild, M.Z. (2010). Carbon footprint as environmental performance indicator for the manufacturing industry. CIRP Annals, 59(1), 37 40. https://doi.org/10.1016/j.cirp.2010.03.008
[106] Lee, K.H. (2011). Integrating carbon footprint into supply chain management: The case of Hyundai Motor Company (HMC) in the automobile industry. Journal of Cleaner Production, 19(11), 1216 1223. https://doi.org/10.1016/j.jclepro.2011.03.010
[107] Lim, J. (2020). Soaring high. Retrieved from https://brightsparks.com.sg/magazine/february 2020/feature/sia/soaring high.php.
[108] Lin Heng, L. (2021). Environmental law in Singapore (2nd ed.). AH Alphen aan den Rijn: Kluwer Law International B.V.
[109] Liu, Z.J. (2021). Effect of fuel price volatility on real activities earnings management in airlines related to fuel pricehedging. Икономика и управление,33 53.
[110] Lu, H.A., & Chen, C.Y. (2011). A time space network model for unit load device stock planning in international airline services. Journal of Air Transport Management, 17(2), 94 100. https://doi.org/10.1016/j.jairtraman.2010.09.004
[111] Maertens, S., Grimme, W., Scheelhaase, J., & Jung, M (2019). Options to continue the EU ETS for aviation in a CORSIA world. Sustainability, 11(20), 5703. https://doi.org/10.3390/su11205703
[112] Maria Iacus, S., Natale, F., Santamaria, C., Spyratos, S., & Vespe, M. (2020). Estimating and projecting air passenger traffic during the COVID 19 coronavirus outbreak and its
ISSN: 2456 1878 (Int. J. Environ. Agric. Biotech.)
https://dx.doi.org/10.22161/ijeab.75.9
socio economic impact. Safety Science, 129, 104791. https://doi.org/10.1016/j.ssci.2020.104791
[113] Marais, K., Wolfe, P.J., &Waitz,I.A. (2016). Airtransport and the environment. In P. Belobaba, A. Odoni & C. Barnhart (Eds), The global airline industry (pp. 423 457) (2nded.).Chichester:JohnWiley&Sons.
[114] Marjanović, V., Milovančević, M., & Mladenović, I. (2016). Prediction of GDP growth rate based on carbon dioxide (CO2) emissions Journal of CO2 Utilization, 16, 212 217.https://doi.org/10.1016/j.jcou.2016.07.009
[115] Materna, R., Mansfield, R.E., & Waltan, R.O. (2015). Aerospace industry report: Facts, figures & outlook for aviation and the aerospace manufacturing industry DaytonaBeach:EmbryRiddleAeronauticalUniversity.
[116] Mazhar,M.U.,Bull,R.,Lemon,M.,&BinSaleemAhmad, S.(2019).CarbonmanagementplanninginUK universities:Ajourneytolowcarbon builtenvironment.In W.LealFilho&R.Leal Arcas(Eds.), University initiatives in climate change mitigation and adaptation (pp. 33 56).Cham:SpringerInternationalPublishing.
[117] McCollum,C.J.,Ramsey,S.M.,Bergtold,J.S.,& Andrango,G.(2021).Estimatingthesupplyofoilseed acreageforsustainableaviationfuelproduction: Taking account of farmers’ willingness to adopt. Energy, Sustainability and Society,11,33 https://doi.org/10.1186/s13705 021 00308 2
[118] Meijer,G.(2021). Fundamentalsof aviation operations Abingdon:Routledge.
[119] Migdadi,Y.K.A.A.(2020). Green operational strategy for airlines: Content and regional analysis.Hershey:IGI Global.
[120] Mrazova,M.(2014).Sustainabledevelopment Thekey forgreenaviation. INCAS Bulletin,6(1),109 122.
[121] Nakamura,H.,Kajikawa,Y.,&Suzuki,S.(2014). Innovationforsustainabilityinaviation:Worldchallenges andvisions.InInformationResourcesManagement Association(Eds.), Sustainable practices: Concepts, methodologies, tools, and applications (pp.885 902). Hershey:IGIGlobal.
[122] Neale,B.(2018). What is qualitative longitudinal research? London:BloomsburyPublishing.
[123] Ngo,C.,&Natowitz,J.(2016). Our energy future: Resources, alternatives, and the environment.Hoboken: JohnWiley&Sons.
[124] O’Leary, Z. (2004). The essential guide to doing research London:SAGEPublications.
[125] Oliveira, A.V.M., Narcizo, R.R., Caliari, T., Morales, M.A.V., & Prado, R. (2021). Estimating fuel efficiency while accounting for dynamic fleet management: Testing the effects of fuel price signals and fleet rollover
Transportation Research Part D: Transport and Environment, 95, 102820 https://doi.org/10.1016/j.trd.2021.102820
[126] Olsen, S.C., Wuebbles, D.J., & Owen, B. (2013). Comparison of global 3 D aviation emissions datasets. Atmosphere Chemistry and Physics, 13, 429 441. https://doi.org/10.5194/acp 13 429 2013
[127] Ong, M. (2017). Scoot and Tigerair merger: What can we expect? Retrieved from https://www.asiaone.com/travel/scoot and tigerair merger what can we expect.
[128] Organization for Economic Cooperation and Development. (2013). Carbon dioxide emissions. Retrieved from https://stats.oecd.org/glossary/detail.asp?ID=6323.
[129] Otley, T. (2021). Singapore Airlines Group launches voluntary carbon offset programme. Retrieved from https://www.businesstraveller.com/business travel/2021/06/27/singapore airlines group launches voluntary carbon offset programme/.
[130] Polek, G. (2017). New widebodies. Aviation International News,49(6),56 59.
[131] Polek,G.(2022).Airbus,Rolls,Safran,SIAsignGlobal SAFDeclaration.Retrievedfrom https://www.ainonline.com/aviation news/air transport/2022 02 16/airbus rolls safran sia sign global saf declaration.
[132] Postorino,M.N.,&Mantecchini,L.(2014).Atransport carbonfootprintmethodologytoassessairportcarbon emissions. Journal of Air Transport Management,37,76 86.https://doi.org/10.1016/j.jairtraman.2014.03.001
[133] Postorino,M.N.,Mantecchini,L.,&Paganelli,F.(2019). Improvingtaxi outoperationsatcityairportstoreduce CO2 emissions. Transport Policy,80,167 176. https://doi.org/10.1016/j.tranpol.2018.09.002
[134] Rahim,A.R.,&Baksh,M.S.(2003).Casestudymethod fornewproductdevelopmentinengineer to order organisations, Work Study,52(1),25 36. https://doi.org/10.1108/00438020310458705
[135] Ramachandra, T.V., & Shwetmala. (2012). Decentralised carbon footprint analysis for opting climate change mitigation strategies in India. Renewable and Sustainable Energy Reviews, 16(8), 5820 5833. https://doi.org/10.1016/j.rser.2012.05.035
[136] Ramaswamy, K. (2002). Singapore International Airlines: Strategy with a smile. Thunderbird International Business Review,44(4),533 555.https://doi.org/10.1002/tie.10027
[137] Ravanchi, M.T., Sahebdelfar, S., & Zangeneh, F.T. (2011). Carbon dioxide sequestration in petrochemical industries with the aim of reduction in greenhouse gas emissions. Frontiers of Chemical Science and Engineering, 5, 173 178.https://doi.org/10.1007/s11705 010 0562 1
[138] Remenyi, D, Williams, B, Money, A, & Swartz, E A. (2010). Doing research in business and management: An introduction to process and method. London, UK: SAGE Publications.
[139] Rhodes, C.J. (2016). The 2015 Paris Climate Change Conference:COP21. Science Progress,99(1),97 104.
[140] Ritchie, B.W., Sie, L., Gössling, S., & Dwyer, L. (2020). Effects of climate change policies on aviation carbon offsetting: Athree yearpanel study. Journal of Sustainable Tourism, 28(2), 337 360. https://doi.org/10.1080/09669582.2019.1624762
[141] Rizzi, P.,&Rizzi, C.(2022).The growinginterdependence between aviation industry and the economic development of nations. In P. Rizzi, C. Rizzi & M. Tettemanti (Eds.),
ISSN: 2456 1878 (Int. J. Environ. Agric. Biotech.)
https://dx.doi.org/10.22161/ijeab.75.9
The impact of COVID 19 on world aviation industry: Challenges and opportunities (pp. 1 46). Singapore: World ScientificPublishing.
[142] Röös, E., Sundberg, C., Tidåker, P., Strid, I., & Hansson, P.A. (2013). Can carbon footprint serve as an indicator of the environmental impact of meat production? Ecological Indicators, 24, 573 581. https://doi.org/10.1016/j.ecolind.2012.08.004
[143] Sahinkaya,S.S.,&Babuna,F.G.(2021).Baselinevaluesof greenhouse gas emissions for an airport. International Journal of Global Warming,23(2),129 137.
[144] Sales, M. (2013). Air cargo management: Air freight and the global supply chain.Abingdon:Routledge.
[145] Sales, M. (2016). Aviation logistics: The dynamic partnership of air freight and supply chain. London: KoganPace.
[146] Scott, B.J., & Trimarchi, A. (2020). Fundamentals of international aviation law and policy. Abingdon: Routledge.
[147] Scott, J. (2014). A dictionary of sociology (4th ed.). Oxford:OxfordUniversityPress.
[148] Scott, J., & Marshall G. (2009). A dictionary of sociology (3rded.).Oxford;OxfordUniversityPress.
[149] Seth, S.S. (2006). Successful tourism management. Volume II: Tourism practices (5th ed.) New Delhi: Sterling Publishers.
[150] Shahriar, M.F., & Khanal, A. (2022). The current techno economic, environmental, policy status and perspectives of sustainable aviation fuel (SAF) Fuel, 325, 124905 https://doi.org/10.1016/j.fuel.2022.124905
[151] Sharp, H., Grundius, J., & Heinonen, J. (2016). Carbon footprint of inbound tourism to Iceland: A consumption based life cycle assessment including direct and indirect emissions. Sustainability, 8(11), 1147. https://doi.org/10.3390/su8111147
[152] Shen, N., Wang, Y., Peng, H., & Hou, H. (2020). Renewable energy green innovation, fossil energy consumption, and air pollution Spatial empirical analysis based on China Sustainability, 2(16), 6397 https://doi.org/10.3390/su12166397
[153] Simons, G.M. (2014). The Airbus A380: A history Barnsley:Pen&SwordAviation.
[154] Singapore Airlines. (2013). Sustainability Report 2012/13. Retrieved from https://www.singaporeair.com/saar5/pdf/Investor Relations/Annual Report/sustainabilityreport1213.pdf.
[155] Singapore Airlines. (2014). Sustainability Report 2013/14. Retrieved from https://www.singaporeair.com/saar5/pdf/Investor Relations/Annual Report/sustainabilityreport1314.pdf.
[156] Singapore Airlines. (2015). Sustainability Report 2014/15. Retrieved from https://www.singaporeair.com/saar5/pdf/Investor Relations/Annual Report/sustainabilityreport1415.pdf.
[157] Singapore Airlines. (2017). Sustainability Report 2016/17. Retrieved from https://www.singaporeair.com/saar5/pdf/Investor Relations/Annual Report/sustainabilityreport1617.pdf.
Baxter[158] Singapore Airlines. (2018a). Singapore Airlines takes delivery of world's first Boeing 787 10. Retrieved from https://www.singaporeair.com/en_UK/np/media centre/press release/article/?q=en_UK/2018/January March/ne1018
180326#:~:text=26%20March%202018%20%2D%20Sing apore%20Airlines,enter%20commercial%20service%20ne xt%20month.
[159] Singapore Airlines. (2018b). Sustainability Report 2017/18. Retrieved from https://www.singaporeair.com/saar5/pdf/Investor Relations/Annual Report/sustainabilityreport1718.pdf.
[160] Singapore Airlines. (2019). Sustainability Report 2018/19. Retrieved from https://www.singaporeair.com/saar5/pdf/Investor Relations/Annual Report/sustainabilityreport1819.pdf.
[161] Singapore Airlines. (2020). Sustainability Report 2019/20. Retrieved from https://www.singaporeair.com/saar5/pdf/Investor Relations/Annual Report/sustainabilityreport1920.pdf.
[162] Singapore Airlines. (2021). Sustainability Report 2020/21. Retrieved from https://www.singaporeair.com/saar5/pdf/Investor Relations/Annual Report/sustainabilityreport2021.pdf.
[163] Singapore Airlines. (2022). Sustainability Report 2021/22 Retrieved from https://www.singaporeair.com/saar5/pdf/Investor Relations/Annual Report/sustainabilityreport2122.pdf
[164] Singh,J,Sharma Kumar,S,&Srivastava,R.(2018). Managingfuelefficiencyintheaviationsector:challenges, accomplishmentsandopportunities. FIIB Business Review, 7(4),244 251. https://doi.org/10.1177%2F2319714518814073
[165] Spellman, F.R. (2015). Environmental impacts of renewable energy.BocaRaton:CRCPress.
[166] Sreeneth, S., Sudhakar, K., & Yusop, A.F. (2021). Suitability analysis of solar tracking PV System in the airport based on glare assessment. International Journal of Automotive and Mechanical Engineering, 18(1), 9061 9070.https://doi.org/10.15282/ijame.18.3.2021.18.0695
[167] Staples, M.D., Malina, R., Suresh, P., Hileman, J.I., & Barrett, S.R.H. (2014). Aviation CO2 emissions reductions from the use of alternative jet fuels. Energy Policy, 114, 342 354.https://doi.org/10.1016/j.enpol.2017.12.007
[168] Statistics Netherlands (CBS). (2022). Load capacity tonne kilometre. Retrieved from https://www.cbs.nl/en gb/onze diensten/methods/definitions/load capacity tonne kilometre.
[169] Sun, X., Wandelt, S., & Zhang, A. (2022). STARTUPS: FoundingairlinesduringCOVID 19 Ahopelessendeavor or an ample opportunity for a better aviation system?
Transport Policy, 118, 10 19. https://doi.org/10.1016/j.tranpol.2022.01.013
[170] Surgenor, C. (2021). Singapore Airlines Group launches voluntary carbon offset programme for travellers and cargo customers. Retrieved from https://www.greenairnews.com/?p=1261.
ISSN: 2456 1878 (Int. J. Environ. Agric. Biotech.) https://dx.doi.org/10.22161/ijeab.75.9
[171] Taber, K.S. (2014). Classroom based research and evidence based practice: An introduction. London: SAGE Publications.
[172] Taneja, N.K. (2023). Airimagination: Extending the airline business boundaries.Abingdon:Routledge.
[173] Tavares Kennedy, H. (2019). Finnair introduces CO2 offsetting and biofuel service for customers. Retrieved from https://www.biofuelsdigest.com/bdigest/2019/01/19/finnair introduces co2 offsetting and biofuel service for customers/.
[174] The Business Times. (2021). SIA launches voluntary carbon offset programme for passengers. Retrieved from https://www.businesstimes.com.sg/companies markets/sia launches voluntary carbon offset programme for passengers.
[175] Tolba, K. (2022). Aviation leads sign Global SAF Declaration at Singapore Airshow. Retrieved from https://www.aviationbusinessme.com/news/saf declaration singapore airshow.
[176] Travel News Asia (2022). Airbus, Rolls Royce, Safran and Singapore Airlines sign Global SAF Declaration Retrieved from https://www.travelnewsasia.com/news22/182 SAF.shtml
[177] Trejo Pech, C.O., Larson, J.A, English, B.C., & Yu, T.E. (2019). Cost and profitability analysis of a prospective pennycress to sustainable aviation fuel supply chain in Southern USA. Energies, 12(16), 3055. https://doi.org/10.3390/en12163055
[178] Trocki, C.A. (2006). Singapore: Wealth, power and the culture of control.Abingdon:Routledge.
[179] Tsai, W.H., Chang, W.C., Lin, S.J., Chen, H.C., & Chu, P.Y. (2014). A green approach to the weight reduction of aircraft cabins. Journal of Air Transport Management, 40, 65 77.https://doi.org/10.1016/j.jairtraman.2014.06.004
[180] United Nations. (2022). Sustainable development goals. Retrieved from https://sustainabledevelopment.un.org/?menu=1300.
[181] United States Environmental Protection Agency. (2022). Overview of greenhouse gases. Retrieved from https://www.epa.gov/ghgemissions/overview greenhouse gases#carbon dioxide.
[182] Upton, J. (1998). Boeing 777. Indianapolis:Specialty Press Publishing.
[183] Vasigh, B., Taleghani, R., & Jenkins, D. (2012). Aircraft finance: Strategies for managing capital costs in a turbulent industry. FortLauderdale:J.RossPublishing.
[184] Vásquez, L., Iriarte, A., Almeida, M., & Villalobos, P. (2015). Evaluation of greenhouse gas emissions and proposals for their reduction at a university campus in Chile. Journal of Cleaner Production, 108(Part A), 924 930.https://doi.org/10.1016/j.jclepro.2015.06.073
[185] Vespermann, J., & Holztrattner, S. (2010). The air transport system. In A. Wald, C. Fay & R. Gleich (Eds ), Introduction to aviation management (pp. 9 24). Münster, Germany:LITVerlag.
[186] Viñuales, J.E., Depledge, J., Reiner, D.M., & Lees, E. (2017). Climate policy after the Paris 2015 climate
conference. Climate Policy, 17(1), 1 8. https://doi.org/10.1080/14693062.2016.1242060
[187] Wallis, K. (2013). Cost of fuel may force airlines to pull out of air cargo market. Retrieved from http://www.chinaaviationdaily.com/news/24/24106.html.
[188] Wensveen, J.G. (2016) Air transportation: A management perspective (8thed.).Abingdon:Routledge.
[189] Wiedemann, T., & Minx, J. (2007). A definition of carbon footprint. In C.C. Pertsova (Ed.), Ecological economics research trends (pp. 1 11). New York: Nova Science Publishers.
[190] Williams, I., Kemp, S., Coello, J., Turner, D.A., & Wright, L.A. (2012). A beginner’s guide to carbon footprinting. Carbon Management, 3(1), 55 67. https://doi.org/10.4155/cmt.11.80
[191] Woon Lee, J., Mayer, B., & Wheeler, J. (2018). Aviation and sustainable development: Some perspectives from the Asia Pacific. In A. De Mestral, P.P. Fitzgerald & M.T. Ahmad (Eds.), Sustainable development, international aviation, and treaty implementation (pp. 133 153). Cambridge:CambridgeUniversityPress.
[192] Wu, H.C., Cheng, C.C., & Ai, C.H. (2018). An empirical analysis of green switching intentions in the airline industry. Journal of Environmental Planning and Management, 61(8), 1438 1468. https://doi.org/10.1080/09640568.2017.1352495
[193] Wu, X., Hu, S., & Mo, S. (2013). Carbon footprint model for evaluating the global warming impact of food transport refrigeration systems. Journal of Cleaner Production, 54, 115 124.https://doi.org/10.1016/j.jclepro.2013.04.045
[194] Xie, J.Y., Suh, D.H., & Joo, S.K. (2021). A dynamic analysis of air pollution: Implications of economic growth and renewable energy consumption. International Journal of Environmental Research and Public Health, 18(18), 9906.https://doi.org/10.3390/ijerph18189906
[195] Yim, S.H.L., Lee, G.L., Lee, I.H., Allroggen, F., Ashok, A., Caiazzo, F., Eastham, S.D., Malina, R., & Barrett, S.R.H.(2015).Global,regional,andlocalhealthimpactsof civil aviation emissions. Environmental Research Letters, 10(3),034001.
[196] Yin, K.S., Dargusch, P., & Halog, A. (2015). An analysis of the greenhouse gas emissions profile of airlines flying the Australian international market. Journal of Air Transport Management, 47, 218 229. https://doi.org/10.1016/j.jairtraman.2015.06.005
[197] Yin, R.K. (2018). Case study research and applications (6thed.).ThousandOaks:SAGEPublications.
[198] Young, T.M. (2018). Performance of the jet transport airplane: Analysis methods, flight operations, and regulations.Hoboken:JohnWiley&Sons.
[199] Zhang, A., & Zhang, Y. (2018). Airline economics and finance. In N. Halpern &A. Graham (Eds.), The Routledge companion to air transport management (pp. 171 188). Abingdon:Routledge.
[200] Zhang, B., Ritchie, B. & Mair, J. (2019). Is the airline trustworthy? The impact of source credibility on voluntary carbon offsetting. Journal of Travel Research, 58(5), 715 731.https://doi.org/10.1177%2F0047287518775781
ISSN: 2456 1878 (Int. J. Environ. Agric. Biotech.)
https://dx.doi.org/10.22161/ijeab.75.9
[201] Zou,B,Kwan,I,Hansen,M,Rutherford,D,&Kafle,N. (2016).Airlinefuelefficiency:Assessmentmethodologies andapplicationsintheU.S.domesticairlineindustry.In J.D.Bitzan.,J.Peoples&W.W.Wilson(Eds.), Airline efficiency (pp.317 352).Bingley:EmeraldGroup Publishing.