Journal Home Page Available: https://ijeab.com/ Journal DOI: 10.22161/ijeab

Journal Home Page Available: https://ijeab.com/ Journal DOI: 10.22161/ijeab
Liping Zhang1*, Tianyu Sun1, Kai Fei1, Longzhou Deng1, Naiping Song2, Xing Wang 2 , Xinguo Yang2, Lei Wang2, Lin Chen2
1Institute of Soil and Water and Environmental Sciences, College of Environment and Resource Sciences, Zhejiang University, Hangzhou 310058, PR China;
2Breeding Base for State Key Laboratory of Land Degradation and Ecological Restoration in Northwest China, Ningxia University, Yinchuan 750021, China
Correspondence
Received: 07 Sep 2022; Received in revised form: 27 Sep 2022; Accepted: 02 Oct 2022; Available online: 06 Oct 2022 ©2022 The Author(s). Published by Infogain Publication. This is an open access article under the CC BY license (https://creativecommons.org/licenses/by/4.0/).
Abstract Desert wetland is a special ecological environment as water is fundamental to maintaining existence. The soil water of sandy wetland links surficial water and groundwater. This study Takes Habahu National Wetland Nature Reserve as the research area and the water movement characteristics of soil profile as the research purpose. According to the altitude and topographic characteristics, the main focus is monitoring soil moisture in different layers at specific sites. The results show that: (1) In the core area of sandy wetland, the water movement of the soil profile is slow with lower infiltration and evaporation; (2) On the slopes around the wetland, the surface water is recharged by rapid leakage along with the underlying impermeable layer after precipitation due to the sand coverage; (3) In the desert hinterland outside the wetland, the water rapidly infiltrates after precipitation and flows into different groundwater systems along the structural characteristics of the underlying stratum to supplement the nearby wetlands. Based on these characteristics, we put forward the unique viewpoints of environmental protection in sandy wetlands: (1) focus on the protection of surface organisms in the core area of sandy wetland to reduce evaporation and improvethe soil water holding capacity; (2) Appropriate engineering and biological measures should be applied to the slope outside the core area to reduce surface evaporation and plant transpiration and improve the soil moisture; (3) In the periphery area of the wetland, infiltration should be promoted to ensure the source of water supply to wetlands, which would maintain the existence of wetlands and give full play to their ecological functions. In addition, this study analyzed the relationship between soil moisture and plant diversity of 35 species. 16 plants are considered to be suitable for planting in core area of sandy wetland and 9 plants for planting in the desert hinterland outside the wetland.
Keywords Desert area; Sandy wetland; soil moisture; Zoning protection; Protect the catchment desert.
Wetland is the kidney of the earth, and sand wetland is the main landscape type to maintain the ecosystem of the sand area [1 2]. Wetlands in sandy areas are mainly distributed along both river banks and low lying areas, which is the ecological front to prevent desert invasion. Studying the source of water and the characteristics of soil water movement is the top priority in studying the
ISSN: 2456 1878 (Int. J. Environ. Agric. Biotech.) https://dx.doi.org/10.22161/ijeab.75.5

sustainable existence of the ecosystem and the function of preventing sand invasion in the sand area [3].
Over the years, researchers have conducted experimental studies on the existence of wetlands in sandy areas, the ecological functions of wetlands and the movement of soil water in wetlands from different angles. Most studies focus on ecological and hydrological processes in sandy areas, and the large scale research is
carried out from the hydrological process characteristics of groundwater and surface water. The conclusions are relatively consistent, vegetation is considered in arid areas to have a role in water accumulation [4], and the scale of landscape ecology significantly impacts ecological hydrology in semi arid regions [5 6]. For instance, Chen [7] indicated that the existence of Tamarix changed the process of precipitation redistribution, which promoted the precipitation infiltration and maintained a high soil moisture. The critical value of ecological water demand in arid areas and the relationship between natural vegetation and groundwater are also studied through experiments [8 10]. The development and utilization of water resources in arid regions of Northwest China are expounded from the levels and zones of river hydrology and ecosystem [11 12]. Heihe River Basin in Northwest China has the most extended history, the most profound depth and the most investment in the study of human development of water resources and its impact on local ecology in arid areas which suffers severe ecological problems [13 15].
The study on the environmental and hydrological coupling of wetlands in the core area of arid desert is different from the hydrological and ecological characteristics of desert edge areas and desertification areas. Taking Ningxia as an example, researchers analyzed the environmental evolution process of the reduction of surface water area and soil moisture in the Aeolian sand area of Ningxia Hui Autonomous Region from the perspective of geological history 264 towns are ecological divided for hydrological regionalization and the results showed that the environmental water shortage in the middle and north of Ningxia is severe [16 17]. The above studies have been carried out from the overall aspects of ecology and hydrology and less from soil moisture variation in desert areas. Some researchers have done some research on relevant factors, studied the correlation and response ability between soil moisture and shrub in the desert area [18 22], while discussing the interaction between nitrogen fertilizer and soil moisture in desert area [23 24]. The role of desert shrubs in soil water replenishment and their significance in hydrology and earth system science have also been studied [25].
In summary, studying the sandy wetland is inseparable from water resources. However, the sandy wetland is a unique ecosystem in the desert with relatively isolated eco hydrologic characteristics, so the hydrologic process and ecological characteristics are different from other wetlands and watersheds. Habahu National Wetland Nature Reserve of Ningxia Hui Autonomous Region is selected as the research area to study the water movement characteristics of the soil profile. Firstly, the catchment area of the wetland is divided according to the catchment area of the wetland. Starting from the overall arrangement and taking the poster height and topographic characteristics as the layout basis, the special method of arranging monitoring points by elevations is implemented, which adopts the method of assimilating extensive data and establishing a large number of monitoring points. On this basis, utilizing microcosmic monitoring, stratified sampling is carried out on the typical soil profile of special parts to test the difference in soil moisture and then study the characteristics of soil water movement at different altitudes and topographic positions in the wetland area. This study would provide a scientific basis for the ecological protection of wetland and the differential protection of other regions.
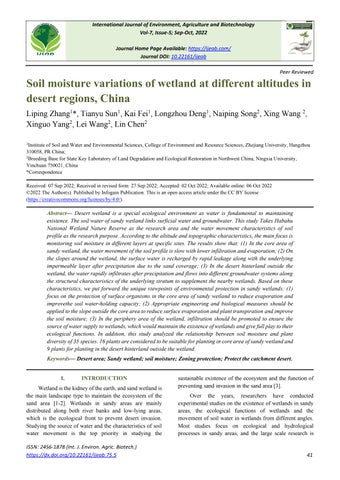
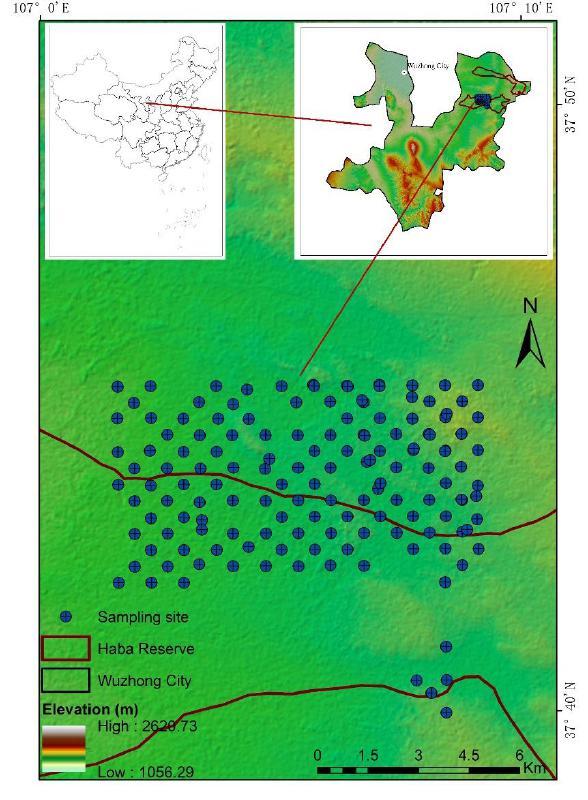
In August 2021, the soil sampling sites were arranged in Haba Lake Nature Reserve, Yanchi County, Ningxia Hui Autonomous Region (Fig. 1).The selected area is about 144 km2. The selected sampling sites are based on different altitude gradients, the lowest site is 1424 m, and the highest site is 1591 m above sea level. The landscape sections existing in various ecosystems were taken as the research object. Combined with traditional statistics, geostatistics and GIS, the selected study area was put in a unified latitude and longitude grid, and the 418 selected sampling sites were regularly laid out based on GPS. The altitude interval is 10 m, and the interval of sampling sites at the same altitude is 1 km. The soil samples are collected and tested for moisture. A total of 155 effective soil samling sites were obtained (Table. 1, Fig. 2). Meanwhile, we identified plant species at each effective soil samling site.
ISSN: 2456 1878 (Int. J. Environ. Agric. Biotech.)
https://dx.doi.org/10.22161/ijeab.75.5
to the local quicksand coverage thickness, geomorphic morphology and the characteristics of the underlying terrain, the depth of the soil profile sampled by this research is 120 cm from the surface. Soil samples are collected every 20 cm from 0 120 cm depth for 6 samples in each soil profile. Seal the sample after sampling to avoid moisture evaporation during transportation. After drying in
oven with a design temperature of 105 ° C for more than 1 day, the soil moisture is calculated by weighing. Among the 155 monitored points, 930 soil samples should be collected theoretically. Due to the limitation of soil layer thickness at some sampling points, a total of 837 soil samples were finally collected.
1534
1545
1556 1566
1567 1577
1578 1588
1589
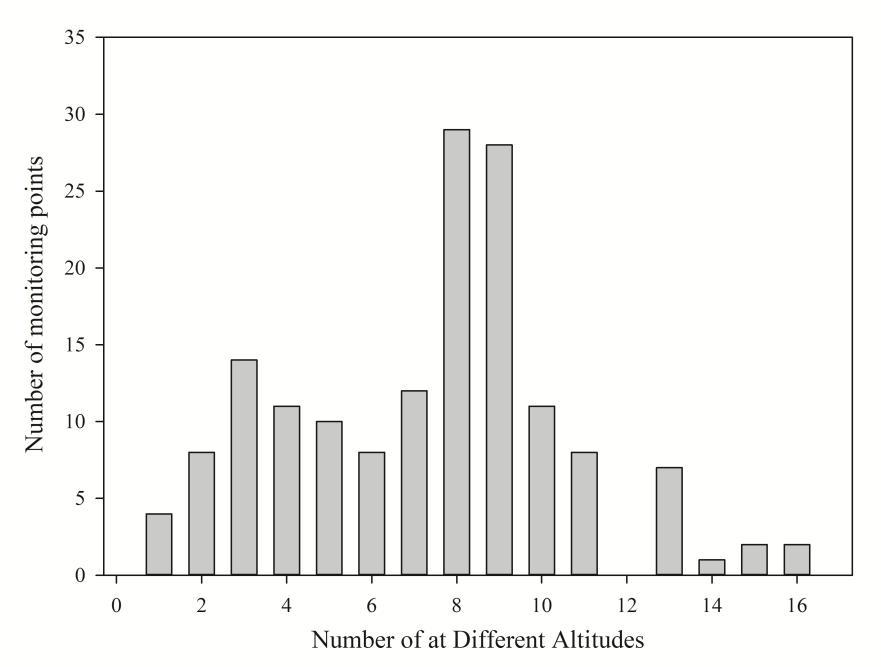
A site with the full collection of soil profile samples was selected in each altitude range to draw a curve of soil moisture distribution along the profile, with a total of 15 curves. The soil profile moisture distribution characteristics at the 15 sampling sites can be divided into rapid evaporation and slow infiltration types (Fig. 3, Fig. 4). And Table 2, Table 3 show the mathematical fitting models.
When the altitude is below 1500 m, soil profile moisture evaporates slowly in the surface layer and then rapid infiltration (Fig. 3). The surface soil moisture is the largest, the maximum value is 23.72%, and the minimum value is at the 100 120 cm layer, which is only 5.85%. 7 fitted models of soil profile moisture under 1500 m are in Table 2. Among the seven soil profiles, the changing trends of soil moisture at different layers of five soil profiles are similar, with an obvious inflexion point between 20 cm and 40 cm. Only two curves show abnormal changes. The soil profile moisture evaporates rapidly on the surface while the soil moisture increases when the soil depth is below 40 cm at the lowest elevation site. This sampling site is in a typical wetland area, with high surface soil moisture and good biological growth. A dry soil layer appears between 20 40 cm depth, which is the typicaldevelopment characteristic of soil profile of wetland in the sandy area. Soil water sources comes from two parts in sandy area, surface catchment and groundwater supply, with the boundary depth between 20 cm and 40 cm.
From 1490 to 1500 m altitude, the change of soil profile moisture belongs to thecharacteristics of rapid water infiltration where covering large sand thickness. This site is in the transition area of typical wetlands to sand covered slopes. The precipitation recharge is rapid infiltration and cannot absorb groundwater recharge due to the slope gradient, so its curve is more similar to soil profile moisture distribution characteristics of sandy soil At the transition zone of1490 1500m altitudes,the three step coefficients of the fitting model are negative, and it is a seeping type curve. At the elevation of 1424 1434 m, because it is located at the lowest altitude site in the wetland, the soil moisture of the surface soil is very high. The terrain position determines it, so the three step coefficient of the fitting model is negative as well
Altitude
Fig. 3 Variation curve of soil profile moisture with depth from 0 20 to 100 120 cm at the 1424 1500 m altitude
Table 2 Fitting models of soil profile moisture with depth at different altitudes (1424 1500 m)
Fitting models R2
1424 1434 h= 0.347w3 +4.115w2 14.27w+23.42 0.852
1435 1445 h=0.024w3 0.745w2 +3.808w+4.854 0.902
1446 1456 h=0.198w3 2.151w2 +5.830w+7.618 0.891
1457 1467 h=0176w3 1940w2 +5724w+5524 0.908
1468 1478 h=0287w3 2911w2 +8136w+4552 0.842
1479 1489 h=0306w3 3376w2 +9493w+6598 0.954
1490 1500 h= 0544w3 +6859w2 2718w+4438 0.992
Note: h represents soil depth, and w represents soil moisture.
ISSN: 2456 1878 (Int. J. Environ. Agric. Biotech.)
https://dx.doi.org/10.22161/ijeab.75.5
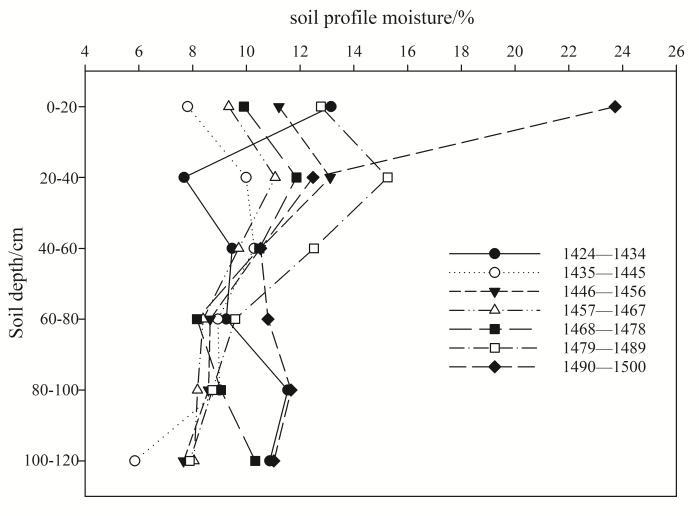
The eight soil profile moisture changing curves in Figure 4 belong to the rapid evaporation type. The water infiltration are stable. Except for an abnormal point of surface soil moisture is 24.77 %, the minimum value is only 4.14%, and most values are below 10 %, while the soil moisture in the 30 % of the layers is below 6%. The soil moisture changing process of the 8 soil profiles shows a tremendous decline rate. The soil moisture decline rate of the topsoil layer to the bottom layer can reach more than 10%. The eight curves show obvious boundary inflexions at 60 80 cm depth. The layer above the inflexion point is dominated by rapid evaporation, while below the inflexion point is dominated by stable infiltration. According to the moisture content coefficients of the various curves in Table 3 curve, it is also fully in line with the characteristics of rapid evaporation and stable leakage. the laws of the fitting coefficients of the six curves are basically the same except for 1534 1544 m and 1567 1577 m curves.
Compare Figure 3 and the curve fitting model of Table 2 with Figure 4 and Table 3, the variation trend of soil moisture with depth is obviously different. The curves in Fig. 3 show the sandy soil moisture characteristics of the
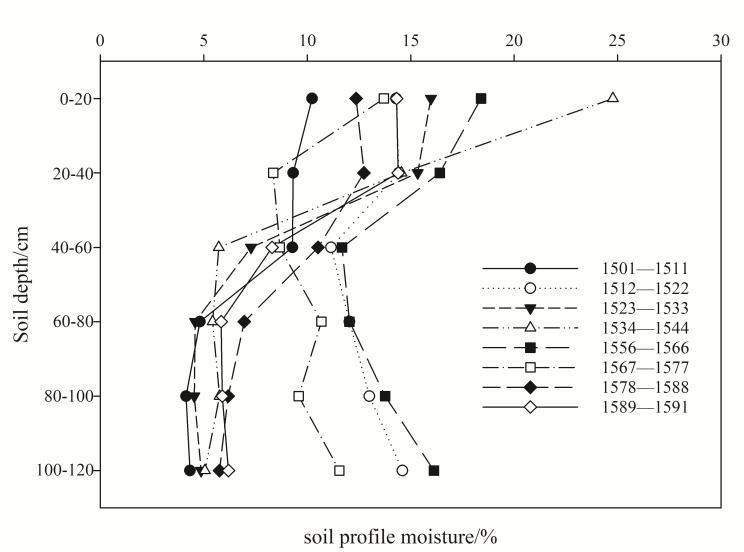
desert wetland with slow evaporation at thesurface and then rapid infiltration below the depth of 40 cm. The curve in Figure 4 shows the soil moisture characteristics that rapid evaporation and rapid infiltration occur at the same time.
Fig. 4 Variation curve of soil profile moisture with depth from 0 20 to 100 120 cm at the 1501 1591 m altitude
Table. 2 Fitting models of soil profile moisture with depth at different altitudes (1501 1591 m)
Altitude (m)
Fitting models R2
1501 1511 h=0228w3 2345w2 +5453w+6711 0.936
1512 1522 h=0073w3 0341w2 0747w+1562 0.725
1523 1533 h=0286w3 2347w2 +1869w+1677 0.938
1534 1544 h= 0332w3 +4993w2 2463w+4514 0.995
1556 1566 h=0053w3 +0287w2 4794w+2321 0.904
1567 1577 h= 0253w3 +3215w2 1205w+2247 0.789
1578 1588 h=0252w3 2617w2 +6161w+866 0.983
1589 1591 h=0265w3 2330w2 +3247w+1360 0.935
3.3 Different soil depth soil water content distribution characteristics
According to the root extension depth and the actual data of each monitoring and sampling site, the depth of the soil 0 60 cm is analyzed in three layers (Fig 5 a, Fig 5 b, Fig 5 c). The soil moisture in the research area is mainly
ISSN: 2456 1878 (Int. J. Environ. Agric. Biotech.) https://dx.doi.org/10.22161/ijeab.75.5
concentrated on the surface layer of 0 20 cm, and the average value is 14.12 %. The linear regression curve in Figure 5 a show growing trends. The soil moisture at a depth of 20 40 cm mainly revolves around 11.92 %. The linear regression curve shows a decreased trend as the altitude increases in the 20 40 cm layer. At the soil depth of 40 60 cm, that is, the bottom part of the plant root
system, the soil mosisture of all monitoring samples has decreased significantly, mainly distributed at about 9.75 %. The depth of 60 cm is a critical division of the surface water and groundwater supply. From a c in Figure 5, the soil
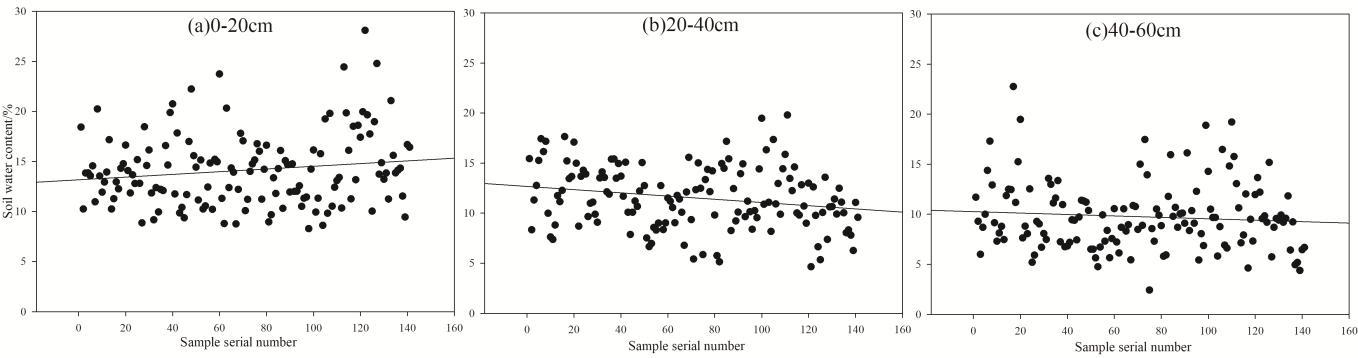
moisture on the three sides of the soil is decreasing with the increase in soil depth, and the decreasing rate is larger at low elevations.
Fig. 5 The distribution map of soil moisture in the soil depth of 0 20cm(a), 20 40cm(b), 40 60cm(c)
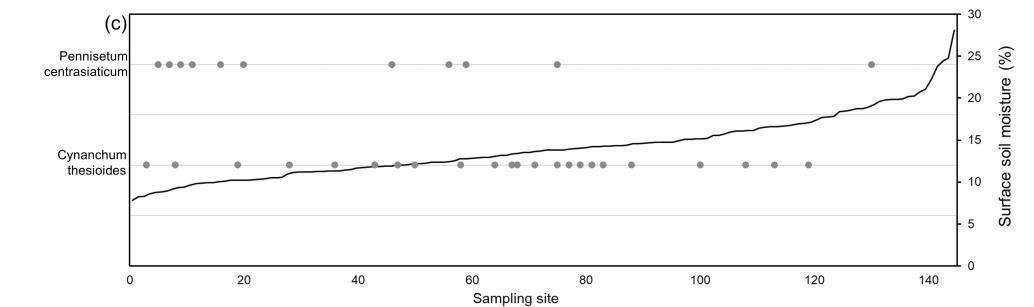
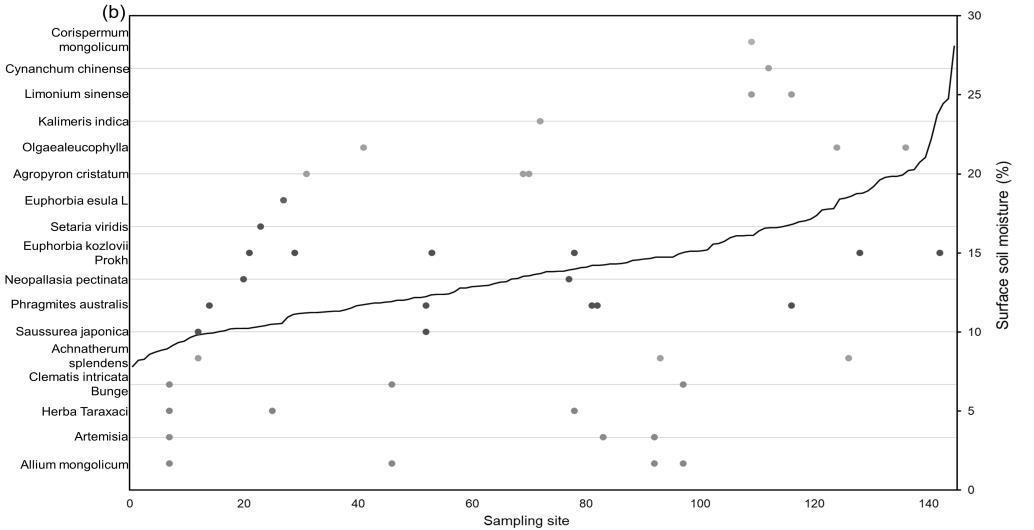
A total of 35 plant species were identified at the sampling sites, of which 9 species were evenly distributed and grew at the soil moisture of 7 28% (Fig. 6 a). 17 plant species are facing degradation problems, these plant species were only collected at less than 6 sampling sites (Fig. 6 b). Pennisetum centrasiaticum and Cynanchum thesioides are suitable for planting in in the desert hinterland, which are mostly distributed in the area the water soil moisture was lower than 14.26% (Fig. 6 c). In addition, 7 plant species were suitable for growing in areas with high soil moisture, but the growth of Heteropappus altaicus and Leymus secalinus were limited when the soil moisture was higher than 19% (Fig.6 d).
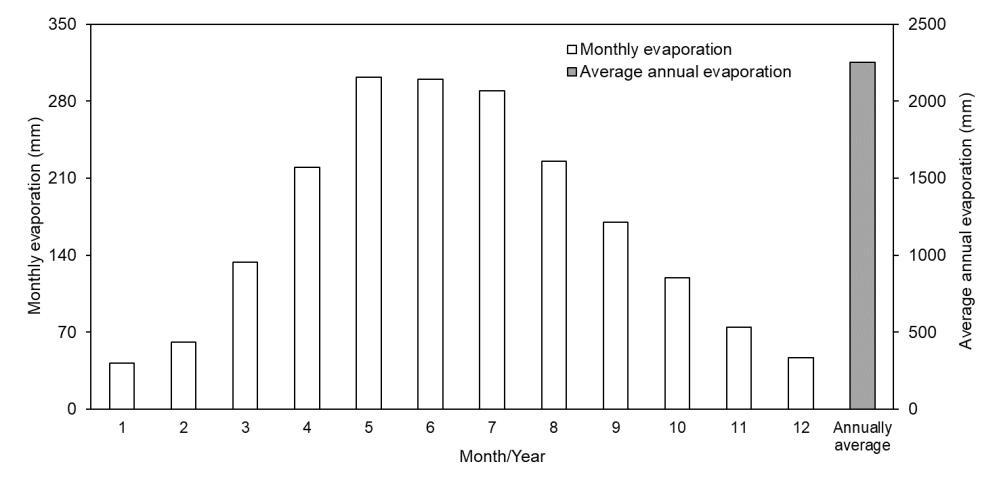
The annual average precipitation of Haba Lake National Wetland Nature Reserve in Ningxia is 296 mm, which decreases from southeast to northwest with a significant variability rate. More than 80% of the precipitation is concentrated in May September. Annual
evaporation is 2131.7 mm, 6 7 times of precipitation. Figure 7 is the variation of monthly evaporation in Haba Lake National Nature Reserve from 1981 to 2010. In such a severely arid area, the existence of surface wetland and the soil moisture characteristics mainly depends on two aspects: the first is the geological structure, which affects the characteristics of groundwater recharge; The second is the catchment characteristics of the ground and the ability of surface plants to reduce evaporation [26 27]. Therefore, the distribution of soil moisture in soil profiles can be divided into two types: rapid evaporation and rapid infiltration. Desert catchment recharge over a large area is one of the primary wetland sources because of little rainfall and large evaporation capacity on the surface of the wetland. In the transition zone of slope land around the wetland, the thickness of sand cover on the slope surface gradually decreases from the top to bottom, and precipitation rapidly seeps down. The change of soil moisture in Figure 4 at 1534 1544 m altitude is a typical rapid seepage process curve in desert area.
ISSN: 2456 1878 (Int. J. Environ. Agric. Biotech.)
https://dx.doi.org/10.22161/ijeab.75.5
Fig. 6 Plant diversity at different surface soil moisture

ISSN: 2456 1878 (Int. J. Environ. Agric. Biotech.) https://dx.doi.org/10.22161/ijeab.75.5
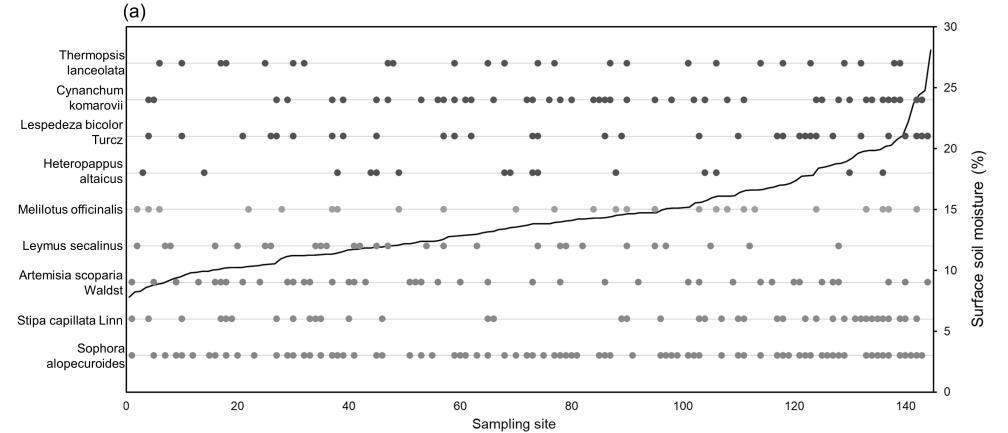
Fig. 7 Variation of monthly evaporation in Haba Lake National Nature Reserve
Wetland hydrology has always been considered an essential driving force for shaping the structure and function of wetland systems [28]. As an important factor affecting the wetland environment, the hydrological process controls wetland functions by affecting physical, chemical and biological processes within wetlands, making wetland systems different from terrestrial systems with good drainage conditions and deepwater aquatic system. Wetlands located in the Delta and other coastal areas have a better ability to withstand storms and typhoons. Wetlands located beside rivers play a more significant role in maintaining the water quality of rivers and controlling floods downstream. Desert wetlands can better regulate groundwater and maintain regional water balance [29 31]. The hydrological landscape is classified according to different hydrogeographic conditions Soil water transport in wetlands at arid and semi arid areas mainly focuses on hydro ecology, including ecological environment effects and Simulation of the hydro ecological process of wetlands [32 33]. Soil water transport of wetlands in desert areas is obviously different from the wetlands in other ecological environment areas [34].
This study revealed the characteristics of water movements in the soil profile in a small ecological environment of wetland in the sandy area with different surface material composition, terrain and vegetation composition, and other . Basically, the study area can be divided into three regions [35 36]: the first is the typical core wetland area, with slow infiltration and evaporation as the main water transport modes in soil profile; The second type is sloping land around the wetland, with different sand cover thicknesses. After precipitation, the water quickly flows down the impervious layer to the bottom of the slope to make up the wetland soil moisture. The third type is a large area of desert around the wetland. The water soon seeps underground after precipitation, along with the
ISSN: 2456 1878 (Int. J. Environ. Agric. Biotech.) https://dx.doi.org/10.22161/ijeab.75.5
structural characteristics of the underlying stratum, into different groundwater systems or relatively low lying adjacent wetlands.
The water supply of wetland in the sandy area comes from precipitation and groundwater. However, there is little surface precipitation in the sand area. In order to maintain the existence of wetlands, there must be sufficient catchment areas, which are the deserts in the hinterland of the periphery of wetlands. The precipitation in the arid area is far less than the evaporation capacity. The rapid infiltration of precipitation in the desert area is not only the specific ecological function of preserving water and reducing evaporation in the sand area, but also the main role of wetland in the sand area.
Based on the analysis of the monitoring results of this study, we concluded that the water drop down surface is mainly gathered in the core area of the wetland in the sandy area. In terms of ecological maintenance, it should focus on surface biological protection to reduce evaporation and improve the water holding capacity of the soil. In the sloping areas, engineering and biological measures should be taken to reduce surface evaporation and plant transpiration, and maintain the normal infiltration of soil and confluence to the soil bottom. In the hinterland of the periphery of wetlands, instead of blindly afforestation, the sand fixation and infiltration promotion should be focused on ensuring the source of water supply to the wetland and thus maintain the existence of the wetland and giving full play to its ecological function. This conclusion is a unique view put forward by this study.
Through the analysis of the relationship between soil moisture andplant diversity, 16 plant species are considered to be suitable for planting in the for planting in core area of
sandy wetland and 9 plants for planting in the desert hinterland outside the wetland. 7 kinds of plant species are suitable for planting in whole Habahu National Wetland Nature Reserve.
Liping Zhang wrote the main part of the manuscript. Tianyu Sun, Kai Fei and Longzhou participated in the coordination of the study and reviewed the manuscript, wrote parts of the manuscript. Naiping Song planned and carried out part of the experiments, analyzed the results. Xing Wang, Xinguo Yang, Lei Wang and Lin Chen participated in the coordination of the study and reviewed the manuscript. All authors have read and agreed to the published version of the manuscript.
The study was financed by the Key R & D plan of Ningxia Hui Autonomous Region (2019BFG02022).
The authors declare no conflict of interest. The funders had no role in the design of the study; in the collection, analyses, or interpretation of data; in the writing of the manuscript, or in the decision to publish the results.
[1] Bai, J., Cui, B., Cao, H., Li, A., Zhang, B., 2013. Wetland degradation and ecological restoration. Hindawi.
[2] Podhade, D. et al., 2020. Evaluating the impact of wetland health on wildlife health by soil and water quality analysis. Int. J. Curr. Microbiol. App. Sci, 9(9): 839 849.
[3] Menbere, I.P., Menbere, T.P., 2018. Wetland ecosystems in Ethiopia and their implications in ecotourism and biodiversity conservation. Journal of Ecology and The Natural Environment, 10(6): 80 96.
[4] Mu, S. et al., 2020. Monitoring the spatio temporal dynamics of the wetland vegetation in Poyang Lake by Landsat and MODIS observations. Science of The Total Environment, 725: 138096.
[5] Wu, Z., Lei, S., Lu, Q., Bian, Z., 2019. Impacts of large scale open pit coal base on the landscape ecological health of semi arid grasslands. Remote Sensing, 11(15): 1820.
[6] Wu, Z. et al., 2019. Assessment of landscape ecological health: A case study of a mining city in a semi arid steppe. International Journal of Environmental Research and Public Health, 16(5): 752.
[7] Chen, H. et al., 2019. The evapotranspiration of Tamarix and its response to environmental factors in Coastal Saline Land of China. Water, 11(11): 2273.
[8] Ding, Y., Nie, Y., Chen, H., Wang, K., Querejeta, J.I., 2021. Water uptake depth is coordinated with leaf water potential, water‐use efficiency and drought vulnerability in karst vegetation. New Phytologist, 229(3): 1339 1353.
[9] Han, Z. et al., 2020. Effects of vegetation restoration on groundwater drought in the Loess Plateau, China. Journal of Hydrology, 591: 125566.
[10] Huang, F., Zhang, Y., Zhang, D., Chen, X., 2019. Environmental groundwater depth for groundwater dependent terrestrial ecosystems in arid/semi arid regions: A review. International journal of environmental research and public health, 16(5): 763.
[11] Chen, Y. et al., 2020. Potential risks and challenges of climate change in the arid region of northwestern China. Regional Sustainability, 1(1): 20 30.
[12] Yang, G. et al., 2019. Assessment of changes in oasis scale and water management in the arid Manas River Basin, north western China. Science of The Total Environment, 691: 506 515.
[13] Wang, C. et al., 2019. Ecological environment assessment based on land use simulation: A case study in the Heihe River Basin. Science of the Total Environment, 697: 133928.
[14] Liu, M. et al., 2018. An integrated hydrological model for the restoration of ecosystems in arid regions: Application in Zhangye Basin of the Middle Heihe River Basin, Northwest China. Journal of Geophysical Research: Atmospheres, 123(22): 12,564 12,582.
[15] Li, X. et al., 2018. Hydrological cycle in the Heihe River Basin and its implication for water resource management in endorheic basins. Journal of Geophysical Research: Atmospheres, 123(2): 890 914.
[16] Fang, Y., Qian, H., Chen, J., Xu, H., 2018. Characteristicsof spatial temporal evolution of meteorological drought in the ningxia hui autonomous region of northwest China. Water, 10(8): 992.
[17] Li, M. et al., 2020. Spatial distribution of endemic fluorosis caused by drinking water in a high fluorine area in Ningxia, China. Environmental Science and Pollution Research, 27(16): 20281 20291.
[18] Filazzola, A., Liczner, A.R., Westphal, M., Lortie, C.J., 2019. Shrubs indirectly increase desert seedbanks through facilitation of the plant community. PloS one, 14(4): e0215988.
[19] Filazzola, A., Liczner, A.R., Westphal, M., Lortie, C.J., 2019. Shrubs indirectly increase desert seedbanks through facilitation of the plant community. PloS one, 14(4): e0215988.
[20] Liczner, A.R., Filazzola, A., Westphal, M., Lortie, C.J., 2019. Shrubs facilitate native forb re establishment in an invaded arid shrubland. Journal of Arid Environments, 170: 103998.
[21] Ishizuka, M., Mikami, M., Yamada, Y., Zeng, F., Gao, W., 2005. An observational study of soil moisture effects on
ISSN: 2456 1878 (Int. J. Environ. Agric. Biotech.) https://dx.doi.org/10.22161/ijeab.75.5
wind erosion at agobi sitein the Taklimakan Desert. Journal of Geophysical Research: Atmospheres, 110(D18).
[22] Ma, X., Chen, Y., Zhu, C., Li, W., 2011. The variation in soil moisture and the appropriate groundwater table for desert riparian forest along the Lower Tarim River. Journal of Geographical Sciences, 21(1): 150 162.
[23] Fisher, F., Parker, L., Anderson, J., Whitford, W., 1987. Nitrogen mineralization in a desert soil: interacting effects of soil moisture and nitrogen fertilizer. Soil Science Society of America Journal, 51(4): 1033 1041.
[24] Fisher, F., Whitford, W.G., 1995. Field simulation of wet and dry years in the Chihuahuan desert: soil moisture, N mineralization and ion exchange resin bags. Biology and Fertility of Soils, 20(2): 137 146.
[25] Wang, X. P., Wang, Z. N., Berndtsson, R., Zhang, Y. F., Pan, Y. X., 2011. Desert shrub stemflow and its significance in soil moisture replenishment. Hydrology and Earth System Sciences, 15(2): 561 567.
[26] Boesch, D.F. et al., 1994. Scientific assessment of coastal wetland loss, restoration and management in Louisiana. Journal of Coastal Research: i 103.
[27] Holland, M., 2017. Wetlands and environmental gradients, Wetlands. CRC Press, pp. 19 43.
[28] Jiang, P., Cheng, L., Li, M., Zhao, R., Huang, Q., 2014. Analysis of landscape fragmentation processes and driving forces in wetlands in arid areas: A case study of the middle reaches of the Heihe River, China. Ecological Indicators, 46: 240 252.
[29] Day Jr, J.W., Martin, J.F., Cardoch, L., Templet, P.H., 1997. System functioning as a basis for sustainable management of deltaic ecosystems. Coastal Management, 25(2): 115 153.
[30] Fan, Y., Miguez Macho, G., 2011. A simple hydrologic framework for simulating wetlands in climate and earth system models. Climate dynamics, 37(1): 253 278.
[31] Patten, D.T., 1998. Riparian ecosytems of semi arid North America: Diversity and human impacts. Wetlands, 18(4): 498 512.
[32] Murray Hudson, M., Wolski, P., Ringrose, S., 2006. Scenarios of the impact of local and upstream changes in climate and water use on hydro ecology in the Okavango Delta, Botswana. Journal of Hydrology, 331(1 2): 73 84.
[33] Greco, M., Arbia, F., Giampietro, R., 2021. Definition of Ecological Flow Using IHA and IARI as an Operative Procedure for Water Management. Environments, 8(8): 77.
[34] Wang, J., Wang, W., Hu, Y., Tian, S., Liu, D., 2021. Soil moisture and salinity inversion based on new remote sensing index and neural network at a salina alkaline wetland. Water, 13(19): 2762.
[35] Furlan, L.M., Rosolen, V., Moreira, C.A., Bueno, G.T., Ferreira, M.E., 2021. The interactive pedological hydrological processes and environmental sensitivity of a tropical isolated wetland in the Brazilian Cerrado. SN Applied Sciences, 3(2): 1 15.
[36] Parker, A. et al., 2010. Use of terrain attributes as a tool to explore the interaction of vertic soils and surface hydrology in South Texas playa wetland systems. Journal of Arid Environments, 74(11): 1487 1493.
ISSN: 2456 1878 (Int. J. Environ. Agric. Biotech.)
https://dx.doi.org/10.22161/ijeab.75.5