Journal Home Page Available: https://ijeab.com/ Journal DOI: 10.22161/ijeab

Journal Home Page Available: https://ijeab.com/ Journal DOI: 10.22161/ijeab
Received: 29 Oct 2022; Received in revised form: 15 Nov 2022; Accepted: 21 Nov 2022; Availableonline: 27 Nov 2022 ©2022 The Author(s). Published by Infogain Publication. This is an open access article under the CC BY license (https://creativecommons.org/licenses/by/4.0/).
Abstract Selected of Tai Nguyen Cho Dao (TNCD)rice varieties tolerant to drought, high yielding and good quality is very essential demands has raised to provide poor farmers in coastlines conditions as lowland in Long An ,VietNam. The purpose of this experiment is to selected of 22 lines from TNCD rice varieties tolerant to drought on the basis of a combination of two methods by molecular markers and evaluated phenotype. Evaluating drought tolerance of 22 lines from TNCD on the basis in the field of drought conditions to select promising lines to meet for farmers applying into production. Methods: selection of drought tolerant alleles for landrace rice at Long An by SSR( simple sequence repeated) markers and evaluated phenotype. Results: Some high yielding and good drought tolerant lines as lines: (TNCD 01, TNCD 15 and TNCD 22), however, also many lines failed due to many reasons: expansion of growth day, high rate of unfilled grain, not good for grain quality Three lines (TNCD01, TNCD15, TNCD22) good for three characters such as high yield, and tolerance with drought Based on morphological and SSR marker the line TNCD 01, TNCD 22 was identified as good quality which was further confirmed through molecular characterization techniques using RM201, HATRI13D, RM328, RM316, RM 5353, RM3480 primers. Sequence of TNCD01; TNCD22 were submitted to GenBank with accession number MT992254 and MW917241 respectively. Tolerant lines from Tai Nguyen Cho Dao have high yielding rice varieties. This is a opportunity to improve good landrace rice varieties for condition of selected drought landrace rice varieties in Long An ,Vietnam.
Keywords high yielding, grain quality, drought tolerance, landrace, SSR molecular marker.
Landraces have been shown to be excellent sources of genes for novel alleles (Loresto et al., 2000). In VietNam, rice is the major agricultural export, especially Tai Nguyen Cho Dao( TNCD) rice is landrace varieties . The cooked kernels of TNCD rice have a highly prized scent and texture. Tai Nguyen Cho Dao rice(TNCD) is normally grown in the Souther of VietNam , based on rain with limited irrigation and acid sufate soild at Long An. Therefore, it is always affected by drought stress, leading to the reduction in growth and yield. Drought stress affects plant morphology, physiology, and molecular mechanisms. Upon drought stress, cell turgor pressure is decreased due
ISSN: 2456 1878 (Int. J. Environ. Agric. Biotech.) https://dx.doi.org/10.22161/ijeab.76.4
to low water potential in cells. This causes a decrease in the relative water content, leaf water potential, stomatal conductance, and transpiration rate (Siddique et al 2001) Drought resistant rice plants consume less water indicative of increased root biomass events under conditions of re irrigation. The HDR gene with AP2/ERF transcoding factor, isolated in the mutant lineage of Arabidopsis (functionally attached), controls root strength trait, branching, epidermal cells, leaf thickness with elevated chloroplast proportions in mesophyll cells, promoting photosynthesis assimilation and photosynthesis performance (Karaba et al. 2007) Simple sequence repeat is an important tool for genetic variation identification of

germplasm (Ma et al., 2011). SSR marker have some merits such a quickness, simplicity, rich polymorphism and stability, thus being widely applied in genetic diversity analysis, molecular map construction and gene mapping (Ma et al., 2011), construction of fingerprints ( Ma et al., 2011), genetic purity test (Ma et al., 2011), analysis of germplasm diversity (Ma et al., 2011, Lang et al 2021) utilization of heterosis, especially in identification of species with closer genetic relationship. A total of 18,828 Class 1 di , tri and tetra nucleotide SSRs, representing 47 distinctive motif families, were identified and annotated on the rice genome. An abundance of microsatellite markers is now available through the published high density linkage map; there was an average of 51 hyper variable SSRs per Mb, with the highest density of markers occurring on chromosome 3 (55.8 SSRMb 1) and the lowest occurring on chromosome 4 (41.0 SSRMb 1) (IRGSP 2005).In particular, Wang et al. (2007) compared gene expression between water and shallow rice varieties under drought stress, using cDNA microarray. Shallow rice varieties IRAT109, Haogelao, Han 297 and water rice varieties Zhongzuo 93, Yuefu, Nipponbare were used. After reading the DNA sequence, there were 64 unique ESTs expressed at high levels in shallow rice varieties and 79 in water rice varieties. The author predicts that the expression of high levels of target genes in shallow rice may improve drought stress tolerance in rice and other closely related crops (Wang et al. 2007).This study is also need further selection and identification of drought tolerant varieties, good shape and high yield which need attention for TNCD at VietNam.
The experiment is carried out parents from 22 different lines from Tai Nguyen Cho Dao The yield of all the 22 lines were similar to the yield of the standard checks
A field experiment was transplanted to an irrigated lowland field in a randomized complete block design in three replications in the field of High Agricultural Technology Research Institute for Mekong delta Vietnam (HATRI) at Binh Thuy, Can Tho. One
hundred lines TNCD selectd with 22 lines from TNCD with KhaoDawMali 105, Tau Binh ( Checked) were used to evaluated agronomic characteristics and drought detection through sensory test and genotypic analysis using SSR markers in lab of HATRI. Data on important agronomic traits like plant height, panicle length, filled grains/panicle, unfiled grain/panicle, 1000 grain weight, harvest index and yield were recorded.
Ten randomly selected plants of each genotype were used for agronomic data analysis. Data on plant height (cm), number of effective tillers/plants, panicle length (cm), number of filled grains/panicle, 1000 grain weight (g), days to maturity and grain yield/plant (g) were recorded and subjected to statistical analyses using SAS software. After harvesting, the seeds of each genotype were dehulled for evaluation of the grain quality. The grains were classified into different types based on their dimension according to ( Lang et al, 2018)
Phenotyping: Evaluation of 22 lines for drought tolerance
Screening at seeding stage
Screening of 22 lines for drought tolerance was done under controlled environment condition. Rapid screening method was used. Two pre germinated seed were planted field . After three days, For drought treatment, the seeds were sown in pots containing vermiculite and nutritional soil, and seedlings were watered with tap water until they reached the three leaf stage. The seedlings were used as experimental materials. The control seedlings continued to be watered, while water was withdrawn from the drought treatment seedlings for 30 days. Three replicates were performed for each treatment. All experiments were carried out in a greenhouse; the seedlings were harvested prior to measuring the physiological and biochemical indicators. The measured physiological and biochemical traits included leaf dying score and leaf death score . The drought resistance indices of the physiological and biochemical indicators were calculated as:Modified standard evaluation score (Table 1) was used in rating the symptoms of drought . Scoring was done 30 days. At this period, 22 lines and checked for tolerance (Khoa DawMali 105) scored 1 3 and susceptible ( Tau Binh ) scored 9.
ISSN: 2456 1878 (Int. J. Environ. Agric. Biotech.) https://dx.doi.org/10.22161/ijeab.76.4
Score Observation 1 Normal growth, no leaf symptom
Nearly normal growth, but leaf tips or few leaves whitish and rolled
Growth severely retarded; most leaves rolled; only a few are elongating
Complete cessation of growth; most leaves dry; some plants dying
Almost all plants dead or dying
The 22 lines/varieties( TNCD) were grown in pots, maximum protection was employed to ensure healthy and disease free seedlings. The leaves were collected 2 3 weeks after planting for DNA extraction.Standard molecular grade chemicals and general techniques for preparing stock solutions, buffers, reagents, and equipment were followed according to (Sambrook et al.,1989). Molecular work was conducted at the Genetics and Plant Breeding Department of the High Agricultural Technology Research Institute for Mekong delta,Vietnam (HATRI)
DNA suitable for PCR analysis was prepared using a simplified procedure (McCouch et al., 1988). A piece of a young rice leaf (2 cm) was collected and placed in a labeled 1.5 ml centrifuge tube in ice. The leaf was ground using a polished glass rod in a well of a spot test plate (Thomas Scientific) after adding 400 μl of extraction buffer. Grinding was done until the buffer turned green, an indication of cell breakage and release of chloroplasts and cell contents. Another 400 μl of extraction buffer was added into the well by pipetting. Around 400 μl of the lysate was transferred to the original tube of the leaf sample. The lysate was deproteinized using 400 μl of chloroform. The aqueous supernatant was transferred to a new 1.5 ml tube and DNA was precipitated using absolute
ethanol. DNA was air dried and re suspended in 50 μl of TE buffer (Lang, 2002).
DNA quality checks used 1% agarose by melting 3 g of agarose in 300 ml of TAE buffer. The mixture was heated in a microwave for 5 6 min and then cooled to around 55 60 0C. This was then poured on a previously prepared electrophoresis box with combs. Gels were prepared and the combs removed after about 45 min. Seven microliters of DNA sample plus 3 μl of loading buffer (Tris 1 M pH = 8.0, glycerol, EDTA 0.5 M pH = 8.0, xylene cyanol 0.2%, bromophenol blue 0.2%, and distilled water) was run at 70 80 v, 60 mA for 45 min or until the loading buffer dye moved far away from the wells. The gel was then taken out and stained with ethidium bromide, after which it was observed under UV light.( Lang et al 2015)
The whole microsatellite analysis included PCR assay, polyacrylamide gel electrophoresis, and band detection and scoring.
Microsatellite primers were used to survey polymorphism on the samples. These were randomly selected from the 6 microsatellite primer pairs currently available for rice such (Table 2). The PCR reaction was as follows:
Table 2 SSR marker on chromosome 9 and 8 used in the present study
ISSN: 2456 1878 (Int. J. Environ. Agric. Biotech.) https://dx.doi.org/10.22161/ijeab.76.4
SSR markers Chromosome
Forward primer sequence Reverse primer sequence
RM201 9 F 5'CTCGTTTATTACCTACAGTACC 3' R 5'CTACCTCCTTTCTAGACCGATA 3 '
RM328 9 F 5’AAGTTTGTACACATCGTATACA 3′ R 5’CGCGACCAGTACTACTACTA 3′ HATRI 13D 9 F 5' caccacacacccattttcac 3' R 5' cgcgagtggtgtcttctgt 3'
RM316 9 F 5’ CTAGTTGGGCATACGATGGC 3’ R 5’ ACGCTTATATGTTACGTCAAC 3′ RM5353 8 F 5’ ACCCTCGATCTCCTAGGCTG 3’ R 5’TCTACTCCAAACCCATTGCC 3’
RM3480 8 F 5’GTGCCAAGGAGATTGGATTG 3’ R 5’ATGGTCTGCAACTCTGCAT G 3’
Reactions were overlaid with mineral oil and processed in a programmable thermal controller set for 35 cycles of 1 min at 94 0C, 1 min at 55 0C, and 2 min at 72 0C, with a final extension at 75 0C for 5 min. After amplification, 10 μl of stop solution was added to the PCR product, which was then denatured at 94 0C for 2 min. Eight microliters of each reaction were run on polyacrylamide gel.
Analysis of variance: The agro morphological data collected were initially analyzed through analysis of variance to verify genetic variation in the traits measured. The few traits with in significant genetic variation, based on the F test, were not considered for further analyses
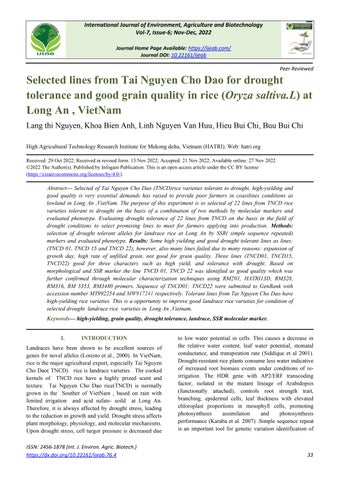
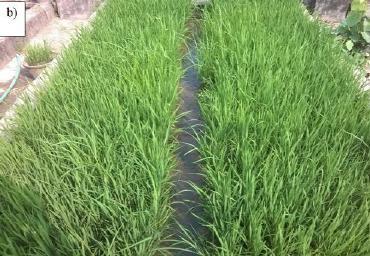
Evaluation of physiological responses of 22 lines TNCD under drought stressconditions Selected 22 lines and two checked ( KDM 105 and Tau Binh ) , were evaluated for drought tolerance by growing the seedlings in soil with 100% or in normal growth conditions all of the lines were similar (Figure 1A,B), but they differed
under drought field capacity. 22 lines from NTCD displayed the most drought tolerant phenotype, with the lowest leaf dying score. This was similar to the performance of KDM105(the drought tolerant line chected ). The highest leaf death score was detected in lines TNCD under drought stress. These data suggest that lines : 1, 3 is the most drought tolerant line, while some lines are the most susceptible( 5 9 score) The 22 lines are selected through continuous seasons in 2022 and selected under drought to select the stages of 22 lines to evaluate this generation the plant shapes which are relatively uniform were recorded. Through reviews with 22 lines tolernce to drought in the period recorded 1 lines for tolerance to drought such as line TNCD01, TNCD 15, TNCD 22 . Score tolerance numbers 3 such as TNCD 02 , TNCD 03, TNCD 11, TNCD 12, TNCD 13, TNCD 14, TNCD 16 and TNCD 20 the same with KDM 105( cheched). Remain lines are supceptible ( Tau Binh Cheked) Continued assessment and analysis of yield and yield components. Response to drought stress in TNCD lines and KDML105, TauBinh , were compared for leaf death and leaf dying score) normal and drought stress conditions. The mean + 1 standard error (SE) was derived from four replicates. ( Table3). Table 3
tolerance score, of leaf of the extreme tails identified by screening drought ( 30 days)
ISSN: 2456 1878 (Int. J. Environ. Agric. Biotech.) https://dx.doi.org/10.22161/ijeab.76.4
9
TNCD07 5 1.745 2.43 10 TNCD08 5 1.669 2.12 11 TNCD09 7 5.756 5.02 12 TNCD 10 5 2.563 2.16 13 TNCD 11 3 0.75 2.32 14 TNCD 12 3 0.85 0.32 15 TNCD 13 3 0.17 0.32 16 TNCD 14 3 0.532 0.51 17 TNCD 15 1 0.062 0.05 18 TNCD 16 3 0.96 0.32 19 TNCD 17 5 0.612 2.96 20 TNCD 18 7 5.69 4.98 21 TNCD 19 5 1.422 3.89 22 TNCD 20 3 0.745 2.59 23 TNCD 21 7 7.632 4.62 24 TNCD 22 1 0.045 0.01
Line of 22 TNCD there are several applications in which DNA marker data may be useful for breeding, such as cultivar identity, assessment of genetic diversity (Collard and Mackill 2008). Screening drought gene is based on molecular marker (Lang et al 2015). Molecular values are assessed based on polymorphism targets and codominant genome on the varieties. To be based on information of genetic map of (Mackill et al 2006) recorded with the respective molecular marker with marker on chromsome 9. With 5 respective 22 lines have noted (Table 2) the difference between the recorded molecular markers with groups of SSR markers as follow: The line ( 3:TNCD01, 14:TNCD12, 15:TNCD13, 16:TNCD14, and TNCD22 ) has polymorphic with molecular markers of HATRI13D , RM201( figure 2A, 2B) The more sensitive method of QTL detection is the simultaneous analysis of the effects of markers binding in the same interval of chromosomes when studying genetic resistance to dry conditions. The effect of different regions on each chromosome on the 3 target traits (selection criteria) associated with drought resistance is shown in the relevant tables. Four drought SSR markers : RM 201 RM 328 and RM 155 RM 511 have a very significant influence on the two target traits DR, YG and DF. Most target traits showed meaningful influence on defined regions of the genome but DR and DF traits showed influence within a distance of the genetic map (Lang et al, 2012.b) This article is the first report on SSR based marker using TNCD landrace rice detected for
ISSN: 2456 1878 (Int. J. Environ. Agric. Biotech.) https://dx.doi.org/10.22161/ijeab.76.4
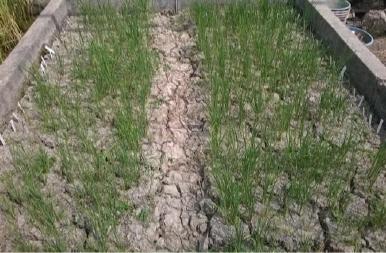
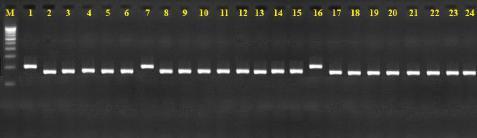
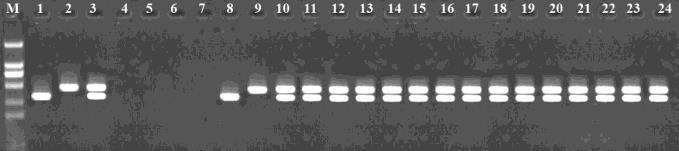
drought tolerance. In the present study, 22 TNCD germplasms tested for genetic diversity were arbitrarily selected, therefore there is a possibility that they have a similar genetic backgrounds, which can result in relatively low genetic polymorphism. However, the fact that most of the primer sets produced normal PCR products is considered, SSR based molecular markers developed in the present study could provide useful genetic information and materials for future rice drought tolerance breeding programs and genetic diversity study. The PCR product will be amplified with primer RM201, RM 328 , HATRI 13D, RM316 on chromosome 9( Lang et al., 2012.a) and RM5353, RM3480 ( on chromosome 8 (Kanjoo et al.,2012) with the genetic code on 22 lines and drought sets to view polymorphisms of these lines (figure 2 and figure 3). TNCD lines evaluated with RM201 markers associated with DC( drought score) traits and for polymorphisms with bands of 210 bp 1:Tau Binh ( Suceptible checked) and 225bp it's the same band as 2: KDM 105( drought cheked) Similary , HATRI 13D to selectd plant homozygous for drought . Only 3: TNCD 01; 14:TNCD 12; 15:TNCD 13;16: TNCD 14 and 24:TNCD 22 give the same banding pattern ás KDM 105( 190bp) and Tau Binh ( 210bp).
Figure 2A
Figure 2B
Figure 2C
Figure 2D
Fig 2 PCR product of the line at RM 201(A) HATRI 13D (B) RM328 (C) RM316(D), the gene associated with tolerance to drought in chromosome number 9 position on the agarose gel 3% With reference to the banding patterns of 1:Tau Binh( Susceptible) and 2:KDM 105 ( resistance). 3 24 lines of TNCD
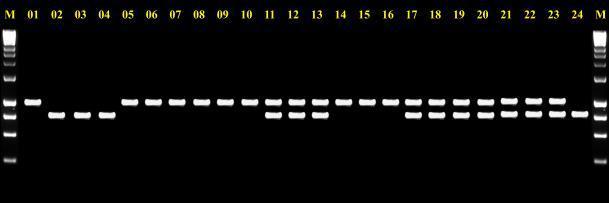
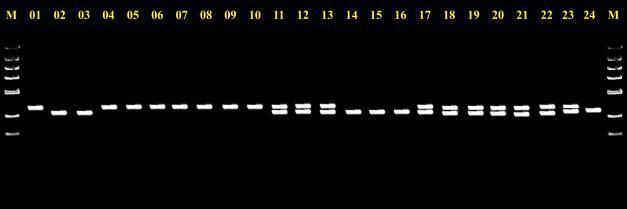
The maker RM5353 RM3480 linked with drought on chromosome 8 (Kanjoo et al .,2012) The selectd the plants with two markers in homozygous condition is shown in figure 3. A and figure 3 B
Figure 3A
ISSN: 2456 1878 (Int. J. Environ. Agric. Biotech.) https://dx.doi.org/10.22161/ijeab.76.4
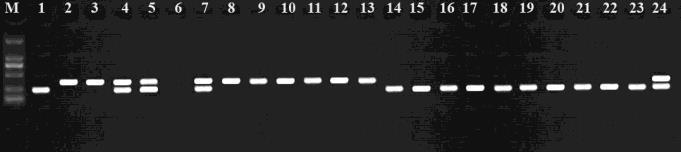
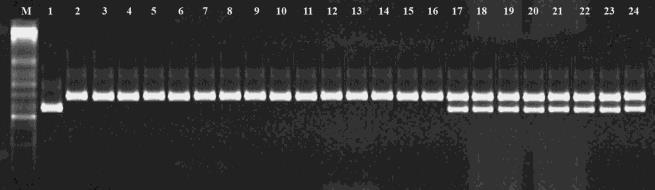
Figure 3B
Fig 3 PCR product of the line at RM5353( A), RM3480 ( B) , the gene associated with tolerance to drought in chromosome number 8 position on the agarose gel 3%. With reference to the banding patterns of 1:Tau Binh( Susceptible) and 2:KDM 105 ( resistance). 3 24 lines ofTNCD
The promising lines of the TNCD variety are planted and assess the yield and yield components. The results showed that these lines had more equal and evener length panicle than the opposition, the lines were quite good panicle , the number of tilling / hill was quite good, and the ratio of panicle was average.Rice yield of grains,and 1000 grain weight . Most lines cultivars had more than 100 grains per panicle, and this character is desirable for breeding program. The 1,000 grain weight ranged from 25.21 to 28.78 g (Table 4). This is very important for farmers choise some size large and bold such as lines TNCD 01, TNCD0 6, TNCD 11 and TNCD 22 In terms of recorded productivity in the present study, yield grain from TNCD 01, TNCD 02, TNCD 11, TNCD 12, TNCD 15, TNCD 16 and TNCD 22 gives the highest yield over compare with KDM 105 and Tau Binh are (59.42 g/plant and 38.17g/ plant respectively), of which lines TNCD 01, TNCD 02, TNCD 11, TNCD 12, TNCD 15, TNCD 16 and TNCD 22 gives the highest yield (67.33;66.23; 66.48 ,63.60, 62.24, 65,73 and 86.03 g/plant) respectively. Through reviews with 22 lines tolerance to drought in the period recorded 6 lines for resistant to drought score 1 such as line TNCD 01, TNCD 15, TNCD 22, the same with KDM 105( cheched) Through evaluation results of hight plant recorded only 4 lines TNCD 07, TNCD 10, TNCD 16, TNCD 18 had hight plant less than 140 cm. The number of grains per panicle is usually highly proportional to the spikelet number, such as TNCD 07 , TNCD 09 give good for spikelet / panicle ( 165.22;162.33 grain/panicle ) respectively
Table 4: yield and components yield of 22 lines from TNCD with two rice checked acession lines Hight plant (cm) Tilling/(H ill ) Weight of 1000 grain(g)
Filling/ panicle) unfilling (%) Length panicle (cm)
Biomass (g) yield (g/ plant)
HI
Tau BInh Tau Binh 169.33a 19.00d 26.69c 97.23f 17.95c 24.28 86.67c 38.17e 0.226c KDM KDM105 161.67a 16.33g 28.51a 127.67e 10.85e 24.22 65.67e 59.42c 0.316b
3 TNCD01 162.67a 19.12d 26.8c 140.44c 23.23b 24.94 86.67c 67.33b 0.401a
5 TNCD02 159.23b 16.67g 26.17c 145.56c 21.41b 27.44b 85.25c 66.23b 0.474a 16 TNCD03 158.67b 13.67h 27.23b 130.11d 27.22a 26.22c 61.67e 46.9d 0.278c 17 TNCD04 136.67d 17.27f 25.43d 100.78f 28.74a 25.46d 50.33f 41.14d 0.291c
18
TNCD05 160.67a 13.62h 25.32d 127.33e 26.79a 28.14a 53.33f 46.58d 0.335b 20 TNCD06 156.68b 17.11f 26.54c 115.23f 18.26c 27.32b 56.23f 32.25e 0.336b 25 TNCD07 162.23a 19.33d 26.25c 165.22a 12.83e 25.89d 57.67f 40.38d 0.350b 31 TNCD08 158.33b 19.67d 26.45c 108.44f 25.5a 26.25c 43.33g 27.5f 0.288c 32 TNCD09 166.33a 19.33d 26.31c 162.33a 16.01c 27.44b 46.67g 34.91e 0.277c 33 TNCD 10 132.33d 17.00f 26.44c 59.05g 20.45b 26.06c 45.67g 28.72 0.253c 34 TNCD 11 147.33c 20.67c 26.63c 137.89 24.97c 26.44c 85.12c 66.48b 0.450a 35 TNCD 12 154.25b 25.22a 25.22d 119.89f 19.01c 26.17c 100.00a 63.6b 0.238c 56 TNCD 13 152.14b 18.01e 25.72d 102.78f 26.92a 26.56c 83.33c 46.16d 0.214c 57 TNCD 14 153.67b 17.33f 26.23c 109.78f 22.91b 25.67c 80.00c 37.08e 0.202c 58 TNCD 15 150.33b 20.33c 26.24c 136.62d 12.71d 26.78c 81.67 62.24b 0.405a 59 TNCD 16 139.67d 21.67b 25.59d 155.44b 14.84d 25.33d 91.67b 65.73b 0.282c 65 TNCD 17 142.25c 19.33d 25.57d 133.44d 14.17d 25.17d 65.00e 39.04e 0.246c 69 TNCD 18 136.33d 19.32d 25.93d 67.67g 26.49a 25.06d 61.67e 19.08 0.147d 75 TNCD 19 148.33c 19.67d 25.32d 136.11d 11.76e 26.78c 76.67d 59.42c 0.279c
76 TNCD 20 154.16b 18.32e 25.41d 136.2d 15.21d 26.22c 62.23e 56.23c 0.254c
77 TNCD 21 152.23b 17.62f 25.21d 110.32f 14.25d 26.52c 62.54e 58.24c 0.321b
79 TNCD 22 155.32b 25.33a 26.06c 154.56b 14.82d 26.61c 90.56b 86.03a 0.421a
Evaluation of rice quality appearance TNCD in physical characteristics, such as the length and width of the rice sample can play an important role in the willingness of consumers to pay for rice. When analyzing the size of rice grains is evaluated according to the IRRI standard scale. Tai Nguyen Cho Dao seed record size has a long rice grain size of 7.24 7.50mm rice grains . This is a very medium group of rice grains. Analysis of the chalkiness ratio of Tai Nguyen Cho Dao lines noted: most lines have chalkiness and chalkiness ratio in order (Table5).
Twenty two advanced lines along after checked with KhaoDawMali 105 and Tau Binh to quality analysis. Grain quality of rice consists of several components: the
ISSN: 2456 1878 (Int. J. Environ. Agric. Biotech.) https://dx.doi.org/10.22161/ijeab.76.4
milling quality such as head rice (Lang et al 2005,Lang et al 2012b). Cooking and eating qualities are mostly determined by amylose content (AC), gelatinization temperature (GT), of the grain starch (Lang et al 2005). Appearance quality is mainly specified by grain shape as defined by grain length, grain width, the length width ratio, and the translucency or chalkiness of the endosperm ( Tang et al 1986). These traits are considered important for the ideal texture of cooked rice, especially for many rice consumers in South and Southeast Asia (Wand et al 2007). Brown rice percentage varied from 77.07 80.52%. The head rice percentage of lines ranged from 41.67 50.23%.Most of the lines were found to give chalkiness. Most consumers prefer rice with intermediate amylose
content ranged between 20 24%, compared to (KDM 105= 18.12%) (Table 5).
Table 5. Quality of 22 lines TNCD from Mua season 2022 at Can Duoc(Long An province)
Acession lines % brown rice %white rice % head rice Length (mm) L/W gelatinizati on temperatur e (GT) (Score)
Chakiness (% score 9)
%Amylose
Tau Binh Tau Binh 78.34d 75.39 c 41.73g 8.06 a 3.27c 3 6.67 e 24.63b KDM KDM105 77.07d 74.62 d 41.90g 8.86a 3.38b 7 0.00f 18.12e
3 TNCD01 79.38d 76.72 b 49.84b 7.19b 3.34b 3 8.33c 24.98b
5 TNCD02 79.32d 74.06 ef 49.47b 6.93c 3.46a 3 7.67d 25.67 a
16 TNCD03 79.38d 77.52a 44.15 f 7.60 b 3.34b 3 12.00b 24.63b 17 TNCD04 80.04a 77.65a 41.67g 7.19 b 3.33b 3 13.00 b 24.98b 18 TNCD05 78.04ab 73.72 f 43.19bc 7.15 b 3.32b 3 7.33 d 22.01d 20 TNCD06 77.63d 75.42c 47.38c 6.99c 3.26c 3 6.33 e 24.28b 25 TNCD07 79.86d 77.69a 44.55g 7.56b 3.20c 3 11.33 bc 24.00b 31 TNCD08 79.51d 74.84d 49.33b 7.32 b 3.44a 3 17.67a 23.35c 32 TNCD09 81.26b 76.32b 46.65d 6.96c 3.38b 3 8.00 c 22.12 f 33 TNCD 10 79.32d 75.62c 45.62e 7.19 a 3.34b 3 8.33c 24.98b 34 TNCD 11 78.23d 76.23b 49.23b 7.93 b 3.47a 3 7.67 d 25.67 a 35 TNCD 12 80.52c 76.25b 46.35d 7.30 b 3.34b 3 10.00 b 24.63b
56 TNCD 13 81.23b 76.77b 46.05d 7.09 b 3.33bb 3 13.00 a 24.98b 57 TNCD 14 79.23ab 75.73c 42.77g 7.05b 3.32b 3 7.33 de 22.01d 58 TNCD 15 80.21c 78.26a 50.23a 6.86 c 3.30b 3 7.00d 22.12d
59 TNCD 16 82.23a 76.25b 46.23d 7.19 b 3.31b 3 8.33c 24.98b
65 TNCD 17 80.15c 76.28b 46.95d 6.93c 3.35b 3 7.67d 25.67 a 69 TNCD 18 79.23d 75.73c 42.77g 7.80 b 3.34b 3 10.00b 24.63b
75 TNCD 19 82.20a 77.30a 42.80 7.09b 3.33bb 3 13.00 a 24.98 b
76 TNCD 20 80.14c 76.23b 45.62 7.05b 3.32b 3 7.33 d 22.01d
77 TNCD 21 80.23c 75.56c 46.23 7.12b 3.11d 3 7.23 d 22.17d
79 TNCD 22 82.15a 76.26b 50.23a 7.79b 3.23c 3 7.62d 23.12c
The result of the amplification of the TNCD01 lines TNCD22 with RM 223 tershows the read able DNA bands measuring around 900 1250 bp. The success of amplification with PCR is evidenced by the process of sequencing the of DNA product with good quality CLUSTAL 2.1 multiple sequence ( https://www.genome.jp › tools bin › clustalw) alignment
ISSN: 2456 1878 (Int. J. Environ. Agric. Biotech.) https://dx.doi.org/10.22161/ijeab.76.4
compared MW917241( NTCD 22) with MT992254( Lang. 2021) with 84.295% . According to Miller et al. (1990) and Claveri and Notredame (2003), the higher score obtained the higher the homology of the two sequences, while the query coverage is a percentage of the long nucleotide aligned with the database in the BLASTn analysis(https://blast.ncbi.nlm.nih.gov/Blast.cgi). The E value that gives statistically significant to both sequences.
The E value indicates the homologous level between the lower sequences, whereas the lower of the E value indicates that the two sequences are identical(MT992254(TNCD01) and accession number MW917241( TNCD 22). The similarity value of the Lines TNCD 22 cultivars is 92.27% which is similar to sequence, namely Rice in GenBank sequences of TNCD 01 have been registered in GenBank with accession number MT992254
Drought and molecular markers were used to marker on 22 lines at screening phase. An important aim may be to fix alleles in their homozygous state as early as possible. For example, pure lines landrace methods, screening is often performed at the TNCD01, TNCD 22 when most loci are homozygous. Using co dominant DNA markers, it is possible to fix specific alleles in their homozygous state. However, this may require large population sizes; thus, in practical terms, a small number of loci may be fixed at each generation (Koebner & Summers 2003). An alternative strategy is to ‘enrich’ rather than fix alleles by selecting homozygotes and heterozygotes for a target locus within a population in order to reduce the size of the breeding populations required. For these results throught 4 markers with the homozygote the same with KDM 105 varieties and some allelels give heterozygote for contamination.To find the target breeding tolerant to drought and high yield The rice varieties are grown and observed growth period of rice varieties. In the rice varieties evaluation recorded the varieties remained 8 lines good for drought . Grain yield in rice is a complex trait multiplicatively determined by its three component traits: number of panicles, number of grains per panicle, and grain weight, all of which are typical quantitative traits Yongzhong et al 2010
Table 3 : Evaluated yield and yield component of the varieties recorded 22 lines. Through evaluation results of yield and yield component recorded only 5 lines had high yield were line number TNCD 07, TNCD 10, TNCD 16, TNCD 18 and had hight plant day less than 140 cm ( 132.33;136.67,139.67, and 136.33 respectvitive). The number of grains per panicle is usually highly proportional to the spikelet number. To understand the making of the number of grains per panicle, it is essential to understand the basic biological processes of panicle development, as well as the differentiation of meristems into spikelet’s at salinity in rice. From an agronomic perspective, the number of spikelet per panicle can be attributed to two components: the duration of panicle differentiation and the rate of spikelet differentiation (Huang Y et al 2006). This
ISSN: 2456 1878 (Int. J. Environ. Agric. Biotech.) https://dx.doi.org/10.22161/ijeab.76.4
result gives 22 lines are selected through continuous seasons in 2022 and selected under drought to select the stages of 22 lines to evaluate this generation the plant shapes which are relatively uniform were recorded. Luo and Zhang 2001 divided drought resistance into 4 types including drought tolerance, drought escape, drought avoidance and drought recovery. Our experiment results indicated that leaf dying score and leaf death score, and traits associated with drought avoidance.Therefore, the inheritance of drought tolerance and drought avoidance is closely correlated and interact with one another; they are not separated(Liguo et al 2016) Through reviews with 22 lines drought to drought in the period recorded 1 for tolerance to drought such as line TNCD01, TNCD 15, TNCD 22 . Score tolerance numbers 3 such TNCD 02 , TNCD 03, TNCD 11, TNCD 12, TNCD 13, TNCD 14, TNCD 16 and TNCD 20 the same with KDM 105( cheched)( table 3) These lines also give good survival during 30 days with drought tolerance As discussed above, there are PCR product of the line at RM 201,HATRI 13D, RM328 , RM3252 on chromosoe 9 and RM5353, RM3480 on chromosome 8 , the gene associated with tolerance to drought in chromosome number 9 and 8 for ladrace rice TNCD , Thís ís now over whelming evidence for the existence of extensive regions of conserved colinearity among cereal species at genetic map level. This knowledge can be exploited to advance marker studies on all grass species and to extend our knowledge of key syntenic agronomic genes as they are placed on pure lines in rice landrace
Evaluating SSR on 22 different lines TNCD recorded different polymorphisms focus on chromosome 9, and 8 but difference group through screening 22 lines recorded a line tolerant to drought conditions during 30 days rate of survival of 95% which is 3 lines good for drought (TNCD 01, TNCD 15 and TNCD 22) . Some promising lines having good grain such as TNCD 01, TNCD 02, TNCD 11, TNCD 12, TNCD 15, TNCD 16 and TNCD 22 gives the highest yield (67.33;66.23; 66.48,63.60,62.24, 65,73 and 86.03 ; g/plant) respectively . Howver give good the high yield and drought tolerance with three lines ( TNCD 01, TNCD 15, and TNCD 22) good for three characters such as high yield, and tolerance with drought and showing tolerance and seed multiplication is on going.
The authors are grateful to People's Committee of Long An province , Science and Technology Long An, People's
Committee of Can Duoc District, Can Duoc District Agriculture Department. Appreciation is expressed for the HATRI provided for the project, and to our colleagues in Genetics and Plant Breeding Division (HATRI) for their support and valuable suggestions.
[1] Claverie JM, Notredama C. 2003. Bioinformatics for Dummies Volume 5. Wiley Publishing, Indianapolis
[2] Huang Y, Zhang L, Zhang J, Yuan D, Xu C, (2006). Heterosis and polymorphisms of gene expression in an elite rice hybrid as revealed by a microarray analysis of 9198 unique ESTs. PlantMol.Biol. 62: 579 91.
[3] IRRI (International Rice Research Institute) (1967), Annuals reportfor1967. IRRI, Los Banos, Philippines.
[4] Kanjoo V., Punyawaew K., Siangliw J.L., Jearakongman S., Vanavichit A., Toojinda T. Evaluation of agronomic traits in chromosome segment substitution lines of KDML105 containing drought tolerance QTL under drought stress. Rice Sci. 2012;19:117 124
[5] Karaba A, S Dixit, R Greco, A Aharoni, KR Trijatmiko, N Marsch Martinez, A Krishnan, KN Nataraja, M Udayakumar, A Pereira. 2007. Improvement of water use efficiency in rice by expression of HARDY, an Arabidopsis drought and salt tolerance gene. PNAS 1 6
[6] Koebner, R. M. D. & Summers, R. W. (2003). 21st century wheat breeding: plot selection or plate detection? Trends Biotech. 21, 59 63. (doi: 10.1016/S0167 7799 (02) 00036 7) Mackill DJ, (2007). Molecular marker and marker assited selection in rice. Book_Varshney&Tuberosa_9781402062964_Proof2_July 12, 2007.
[7] Lang NT (2002). Protocol for basics of biotechnology. Agricultural Publishing House, Ho Chi Minh, Vietnam.
[8] Lang thi Nguyen 2012a, Final report for development new varieties with drought and submerence at An Giang province. 250 paper Vietnamese.
[9] Lang NT, Luy TT, Buu BC (2012)b Analysis of amylose content on hybrid combination on Oryza sativa L. J Agri Sc TechViet33:24531.
[10] Lang NT, Dong VTH, Buu BC (2005) Microsatellite marker linked to genes controlling total protein content on chromosome7ofOryzasativaL. JBiotech2:231 6.
[11] LangN.T, BC Bui; Bao, B.Chi.2015. Genetic engineering in biotechnology. Vietnam Education Publishing House, 2015
[12] LangN T, Linh. HNV , Buu. B Chi .2018. QUALITY RICE BREEDING RESULTS THANKS TO A HYBRID OF JAPONICA AND INDICA RICE COMBINED WITH MOLECULAR INDICATORS. Journal of Agriculture and Rural Development. no. 13. Pages: 1 10.
[13] Lang NT, Le Hoang Phuong, Bui Chi Hieu, Bui Chi Buu .2021Analysis of Quality of Landrace Rice: AG4 variety in An Giang, Vietnam. International Journal of Environment, Agriculture and Biotechnology Vol 6, Issue 3; May Jun, 2021.
[14] Lang.NT .2021. Analysis of the landraced of rice diversity has good qualities by microsatellite SSR techniques. NCBI
[15] Loresto GC, Guevarra E, Jackson MT. 2000. Use of conserved rice germplasm. Plant Genetic Resources Newsletter, 124: 51 56.
[16] Liguo Zhou, Zaochang Liu, Yunhua Liu, Deyan Kong, Tianfei Li, Shunwu Yu, Hanwei Mei, Xiaoyan Xu, Hongyan Liu, Liang Chen &Lijun Luo 2016. A novel gene OsAHL1 improves both drought avoidance and drought tolerance in rice.Scientific Reports volume 6, Article number: 30264 (2016)
[17] Luo, L. J. & Zhang, Q. F.2001. The status and strategy on drought resistance of rice (Oryza sativa L.). Chinese J. Rice Sci. 15, 209 214 (2001)
[18] Ma H, Yin Y, Guo ZF, Cheng LJ, Zhang L, Zhong M, Shao GJ. 2011. Establishment of DNA fingerprinting of Liaojing series of japonica rice. Middle East Journal of Scientific research, 8(2): 384 392.
[19] Mackill DJ (2006). Breeding for resistance to abiotic stresses in rice: the value of quantitative traitloci. In: Lamkey KR, Lee M (eds) Plant breeding: The Arnel R Hallauer international symposium. Blackwell Pub, Ames, IA, pp 201 212.
[20] McCouch SR (1988). Molecular mapping of rice chromosomes. Theor. Appl. Genet. 76: 815 829.Neeraja C, Maghirang Rodriguez R, Pamplona A, Heuer S, Collard B, Septiningsih E, et al 2007. A marker assisted backcross approach for developing submergence tolerant rice cultivars. Theoretical and Applied Genetics 115: 767 776.
[21] Miller G, Beckwith R, Fellbaum C, Gross D, Miller K. 1990. Introduction to WordNet: An On line Lexical Database. Int J Lexicograph 3 (4): 235 244
[22] Siddique M.R.B., Hamid A., Islam M.S. Drought stress effects on water relations of wheat. Bot. Bull. Acad. Sin. 2001;41:35 39. [GoogleScholar]
[23] Tang SX, Khush GS, Julianino BO (1989) Variation and correlation of four cooking and eating indices of rice. Philipp JCropSci14:45 9.
[24] Yongzhong Xing and Qifa Zhang (2010). Genetic and Molecular Bases of Rice Yield. ANRV410 PP61 11 ARI 22 January 2010 10: 37
[25] Yoshida (1981), Scientific Basis rice. Can Tho: International Rice Research Institute (IRRI) Can Tho University.Abrol IP (1986), Salt affected soil: Problems and prospects in developing countries. In: Global Aspects of Food production. Oxford, 1986, pp. 283 305
[26] Wang H, H Zhang, F Gao, J Li, Z Li. 2007. Comparision of gene expression between upland rice cultivars under water stress using cDNA microarray. TAG115:1109 1126.
[27] Wand LQ, Liu WJ, Xu Y, He YQ, Luo LJ, et al.(2007) Genetic basis of 17 traits and viscosity parameters characterizing the eating and cooking quality of rice grain. Theore Appl Genet. 115: 464 76.
[28] https://blast.ncbi.nlm.nih.gov/Blast.cgi
[29] https://www.genome.jp › tools bin › clustalw
ISSN: 2456 1878 (Int. J. Environ. Agric. Biotech.) https://dx.doi.org/10.22161/ijeab.76.4