Peer Reviewed
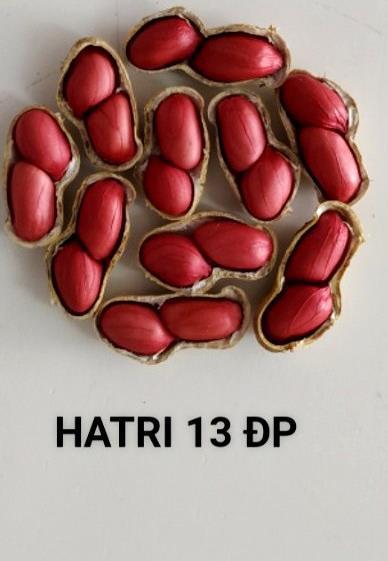
Abstract The new advances are applied to production, especially by the method of marker assisted selection (MAS) in collaboration with by improved method are made to the same breeder together many desirable genes from Yuanza 9102 / ICG 12625 From the crossed Yuanza 9102 / ICG 12625 give selected one line order named HATRI 13 ĐP .The time has grown HATRI 13ĐP (95 100 days ). Height plants from 60 65 cm and compared to parents Genotype HATRI 13ĐP exhibited significantly the highest pod number (78.0/plant), Hence, these traits can be selected to improve the yield potential of pole type peanut genotypes. Weigt of 100 seeds reached 42 1 g compared with their parents (Yuanza 9102 =40.9 g ; ICG 12625 =36.8 g) . Grain quality with red color grain protein and total fat. Productivity of HATRI 13 ĐP has great potential in the winter spring season, but often for low productivity in the summer, The yield 4.2 tonnes/ha of winter spring season and 3.5 ton/ha in Wet season This is just like having wide adaptability, stable yield, should it be production in the Mekong delta ( An Giang, Can tho and Tra Vinh)
Journal Home Page Available: https://ijeab.com/ Journal DOI: 10.22161/ijeab
Keywords Arachis hypogaea L, genetic, plant breeding, marker assisted selection, Microsatellite I. INTRODUCTION Arachis hypogaea L., with the common name peanut, is an important oil, food and fodder crop grown worldwide with an annual yield of 66.3 million tons and grown on 34.1 Mha (FAOSTAT, 2021). Chromosomal peanuts (AABB, 2n = 4x = 40), with a recent and unique polypoid origin, occurred 5 to 10 thousand years ago (Bertioli et al., 2019, 2020). This narrow genetic base and limited gene flow with its genetically diverse diploid wild relatives lead to a lack of alen strong alleles are resistant to pests in the main group of genes. However, the genetic basis underlying pod and kernel related traits in the peanut remained largely unknown, which hampered the improvement of peanut through marker assisted selection. To understand the genetic basis underlying pod and kernel related traits in the peanut and provide more useful information for marker assisted breeding( Weigang et al ., 2016) .Another limitation to recognizing yield potential is the low level of input in crop management. [World 2007]. The use of fertilizers for all crops since 2000 has averaged 11.1 kg/ha, which is not surprising enough [Hollinger et al. 2015]. However, important factors, such as phosphorus and calcium, proved to be the leading limiting nutrients for peanut production, with only 4% and 16% of farmers using chemical fertilizers or compost, respectively, in peanut production, resulting in very low yields [World 2007].Therefore, it is recommended to develop cultivars that tolerate deficiencies of both calcium and P in order to keep good crop yields. Soils in the Mekong Delta with an optimal pH of 6.0 to 6.5 for peanut growth ( Tran et al 2021) often result in adequate availability of calcium and manganese However, it is necessary to consider the acidic pH in the breeding program to predict increasing soil acidification in some areas of the country [Coulibaly et al. 2018] so yields are low. QTLs for productivity related characteristics were observed and 29 QTL were identified( Yuning et al. 2017). The current QTL will contribute to a better understanding of the yield ingredients and linkage markers that will facilitate MAS breeding in peanuts. The genetic basis of the yield composition has been studied, and characteristics related to pods and seeds are highly valued in peanuts (Liu
International Journal of Environment, Agriculture and Biotechnology Vol 7, Issue 4; Jul Aug, 2022
Development of Hatri 13ĐP Peanut Varieties for the Mekong Delta, Vietnam Lang Thi Nguyen, Tran Nguyen Thi Khanh, Hieu Bui Chi, Phuong Le Hoang, Khang Le Minh, Phuoc Nguyen Trong, Buu Bui Chi
ISSN: 2456 1878 (Int. J. Environ. Agric. https://dx.doi.org/10.22161/ijeab.74.2Biotech.)3 205
High Agricultural Technology Research Institute for Mekong delta, Vietnam
Received: 27 Jul 2022; Received in revised form: 20 Aug 2022; Accepted: 25 Aug 2022; Available online: 31 Aug 2022
©2022 The Author(s). Published by Infogain Publication. This is an open access article under the CC BY license (https://creativecommons.org/licenses/by/4.0/).


International Journal of Environment, Agriculture and Biotechnology, 7(4)
HATRI 13DP crossed was started to breed in 2017 Spring Summer 2017 season for F1 breeding, Wet sesson crop 2017 F2, Winter Spring crop 2017 2018 F3, Spring Summer season 2017: F4, Summer autumn season for self absorption F5, Winter Spring crop 2018 2019 self absorption F6 continues to test Summer Autumn 2018 self absorption F7, Winter Spring 2018 2019. Summer Autumn 2019 for Assay in Can Tho. The Seeds are harvested from F8 generation lines, for F9 self absorption of the 2020 rainy season. Yields harvested in the first week of October 2020 were sown in the third week of February 2021. The experiment was conducted in farmers' fields in three provinces of An Giang (in Phu Tan); Can Tho (Binh Thuy) in which in Tra Vinh has three points (Tra Cu, ..All materials were grown in the field in accordance with the local legislation. The RIL population and its parental lines were planted in the experimental fields in Can Tho City .The field experiments followed a randomized block design with three replications according to a previous study with a few modifications ( Huang et al 2015). For each plot, 10 plants from each RIL line were grown 15 cm apart within a row, and an 85 cm gap was given between RILs. The parental lines were planted after every 20 rows as controls. Standard agricultural practices were applied for field management. Each plant was harvested individually at its maturity to prevent loss from over ripening. Only eight plants in the middle of each row were used for trait measurement. Mature seeds determined by full size pods carp color from each plant were measured for 100 seed weight, seed length, seed width and length to width ratio. The seed length and seed width were measured by using a parallel rule. The seed weight was taken on an electrical scale. The length to width ratio was calculated by dividing seed length by seed width. Number of leaves and number of branches: calculated at the end of the harvest period, using samples of 10 plants per test. Factors constituting yield and yield: The number of pod per plant , the number of seeds per pod are determined by counting the hull and seeds of 10 plants selected from each experiment.: Grain yield: Weigh the seed mass of the plant, collect m2. After harvesting, data is collected on each plot of 3m2 area and weighs .The mean values of each measured trait were used for phenotypic characterization.
2.2.DNA extraction
ISSN: 2456 1878 (Int. J. Environ. Agric. https://dx.doi.org/10.22161/ijeab.74.2Biotech.)3
2.1.Plant materials and phenotyping Handling Crosses of Groundnut
Nguyen et al. 2022
206 et al. 2015; Shi et al. 2015) indicates that productivity characteristics depend on each other; Research objectives Choose to create a variety of peanuts for hight yield and very ease to growing II.
An F1 2:6 8 9 population of RIL lines was derived from a cross between Yuanza 9102/ICG 12625 The crossed seeds are grown along with their parents to identify hybrids. Plants in the F1 generation resembling the female parent (selfed) should be removed. The plant materials (including the parents and the RILs) used in this study were originally created by our laboratory and we have all the relevant rights to the materials. The ICG 12625 variety is hardy, well branched, stable high yielding with a red color .
The 100 lines F3 were grown in pots. Maximum protection was employed to ensure healthy and disease free seedlings. The leaves were collected 2 3 weeks after planting for DNA Standardextraction.molecular grade chemicals and general techniques for preparing stock solutions, buffers, reagents, and equipment were followed according (Lang et al 2015) DNA suitable for PCR analysis was prepared using a simplified procedure (McCouch et al., 1988). A piece of a young rice leaf (2 cm) was collected and placed in a labeled 1.5 ml centrifuge tube in ice. The leaf was ground using a polished glass rod in a well of a spot test plate (Thomas Scientific) after adding 400 μl of extraction buffer. Grinding was done until the buffer turned green, an indication of cell breakage and release of chloroplasts and cell contents. Another 400 μl of extraction buffer was added into the well by pipetting. Around 400 μl of the lysate was transferred to the original tube of the leaf sample. The lysate was deproteinized using 400 μl of chloroform. The aqueous supernatant was transferred to a new 1.5 ml tube and DNA was precipitated using absolute ethanol. DNA was air dried and re suspended in 50 μl of TE buffer (Lang, 2002).
DNA quality checks used 1% agarose by melting 3 g of agarose in 300 ml of TAE buffer. The mixture was heated in a microwave for 5 6 min and then cooled to around 55 60 0C. This was then poured on a previously prepared electrophoresis box with combs. Gels were prepared and the combs removed after about 45 min. Seven microliters of DNA sample plus 3 μl of loading buffer (Tris 1 M pH = 8.0, glycerol, EDTA 0.5 M pH = 8.0, xylene cyanol 0.2%, bromophenol blue 0.2%, and distilled water) was run at 70 80 v, 60 mA for 45 min or until the loading buffer dye moved far away from the wells. The gel was then taken out and stained with ethidium bromide, after which it was observed under UV light. Microsatellite analysis
MATERIAL AND METHODS
ISSN: 2456 1878 (Int. J. Environ. Agric. https://dx.doi.org/10.22161/ijeab.74.2Biotech.)3
The PCR reaction was as follows: Reactions were overlaid with mineral oil and processed in a programmable thermal controller set for 35 cycles of 1 min at 94 0C, 1 min at 55 0C, and 2 min at 72 0C, with a final extension at 75 0C for 5 min. After amplification, 10 μl of stop solution was added to the PCR product, which was then denatured at 94 0C for 2 min. Eight microliters of each reaction were run on polyacrylamide gel.
2.3.Data Analysis Analysis of variance: The agro morphological data collected were initially analyzed through analysis of variance to verify genetic variation in the traits measured. The few traits with insignificant genetic variation, based on the F test, were not considered for further analysises.
207 The whole microsatellite analysis included PCR assay, polyacrylamide gel electrophoresis, and band detection and scoring. PCR assay Microsatellite primers were used to survey polymorphism on the samples. These were randomly selected from the 3 microsatellite primer pairs currently available for Peanut (SSR: GM 1494 (Guo và ctv 2012) :F’cttcgaagaaaagtgcatcg R’gaagacagaagacgaagagcgta and TTGCTAATCA(Aradu_A07_1148327:FSNPs
III. RESULTS AND DISCUSSION
Qualtility and nutritional of peanut of HATRI 13 ĐP and parents Protein content was analyzed by the combustion method (Leco FP 528, 601500, Leco Corporation, St. Joseph, MI, USA) with a nitrogen conversion factor of 5.46. Moisture, oil, fiber, ash, and carbohydrate Foods 2020, 9, 942 3 of 14 contents were quantified according to the method of the Association of Official Analytical Chemists (AOAC.2000) . Disease assessment Ten plants (third leaf on the main stem of each plant was sampled) in a single plot were scored for disease resistant parameter evaluation based on 1 9 scale (1 = no symptoms, 2 = 1 5% leaf infection, 3 = 6 10% leaf infection, 4 = 11 20% leaf infection, 5 = 21 30 leaf infection leaf infection, 6 = 31 40% leaf infection, 7 = 41 60% leaf infection, 8 = 61 80% leaf infection, 9 = 81 100% leaf infection) at day 100 after seed planting (Subrahmanyam et al., 1995). Disease incidence (percentage of infected plants), number and size of leaf spots (early and late blight leaf spots), %CLS leaf area of infected leaf, and defoliation were recorded for the incidence and severity of CLS in the plot.
Environment, Agriculture and Biotechnology,
G/A AAAGAAA(G/A)CCTTCCCCGA)TTGTTGGTTT(G/A);R(Mounirou et al., 2020). enzyme Hinf1 felowing Lang et al 2015.)
3.1. PCR-based MAS( maker assisted selection) in peanut breeing DNA amplification by PCR SSR method with GM 1494 marker In the Yuanza 9102/ICG 12625 population recorded P1 position corresponding to DNA of and P2: corresponding to GM 1494 shows that Yuanza 9102's DNA position is 200bp and the molecular size of ICG 12625 is 220bp. F3 were developmed from the crosses Yuanza 9102/ICG 12625 , F3 individuals of the band pattern both parents . Line 1 gives the same size allele as the father (Select this line as HATRI 13DP). Demonstrated that on this population GM 1494 gives polymorphism.
Nguyen et al. International of 7(4) 2022
Journal
The experiments were arranged in a completely random block style, 3 times repeated. The assay kit is performed by transplantation method (15 x 20 cm). Fertilizer : (35 60 60+150kg Ca and 40kg Mg). The seed set compares yields on a large scale according to farmers' farming techniques, applied pruning technique 20x20cm distance Agronomic indicators: Plant height: determined by cm ruler at the end of the harvest cycle (90 days) from the soil surface to the end of the main stem of 10 plants in each experiment.

ISSN: 2456 1878 (Int. J. Environ. Agric. https://dx.doi.org/10.22161/ijeab.74.2Biotech.)3
208
Fig 1. PCR product of the segregating population were generated by DNA amplication with primers for GM 1494 locus, on chromosome A07, positioned two the banding patterns of the parents , 220bp (ICG 12625) and 200bp (Yuanza 9102), on 3% agarose gel. The banding patterns on the gel are the marker genotypes from which we can predict the genotypec of the plants. In MAS , DNA is extracted from segregating population derived from the cross of two parents. Digest PCR products with an enzymers to detecht a polymorphism between the PCR products from patrents DNAs F3 position carries both parents. The tightly linked gene on chromosome A07 is marked by the molecular marker Aradu A07 1148327. This gene is associated with the particle size group according to (Mounirou et al. (2020). Aradu A07 1148327 molecular indicator was used on F3 populations to evaluate and select the high yield of peanuts. Markers associated with yield locus in Yuanza 9102/ICG 12625 were detected in parent Yuanza 9102/ICG 12625 for polymorphism with directive Aradu A07 1148327. The Aradu A07 1148327 marker is used as a marker, this marker has a size of (200 210bp) and is used as a DNA mold to establish specific primer pairs. In the recorded population with 50 plants (Fig. 3) The results showed that there were 13 lines of heterozygous form. Heterozygous carrier currents from lines 44,45,46)16,17,18,19,20,21,22,23,24,25,26,27,28,29,30,31,32,(2,3,4,5,6,7.10,11,12,13,14,(62%),appearingwithtwobandsofsize200bp210bpcorrespondingtotheparents
very good
12625; 1 50 is a hybrid F3 3.2. Characters of gowth and Morphology Assays at HATRI Institute: In general, through provincial productivity assays in terms of yield agronomic characteristics and yield composition, the results show that HATRI 13 is an elite peanut line, promising, short days, high
Nguyen et 2022
from resistance to rust disease. Table 1. Some agronomical features of HATRI 13 DP No. Parameter Offspring HATRI 13 DP Female parent Yuanza 9102 Male parent ICG 12625 1 Origin Yuanza 9102 / ICG 12625 China China 2 Growth duration (day) 85 90 80 85 80 3 Plant height (cm) 62 68 70 72 60 65 4 No. of first branch per plant 6 6.3 0 4 0 5 0 5 5 6 0 5 Plant type Determinant Determinant Determinant 6 Leaf shape Ovate Ovate Ovate 7 Leaf color Medium green Pale green Dark green 8 Flower color Purple Purple Purple 9 Mature pot color Yellow Yellow Yellow 210 200
al. International Journal of Environment, Agriculture and Biotechnology, 7(4)
Fig 2 : PCR product of the segregating population were generated by DNA amplication with primers for Aradu A07 1148327 locus, on chromosome A07, positioned two the banding patterns of the parents , 200bp (ICG 12625) and 210bp (Yuanza 9102), on 3% agarose gel. Digest PCR products with Hinf1 enzyme Note: P1: Yuanza 9102 P2 : ICG yield, response

ISSN: 2456 1878 (Int. J. Environ. Agric. https://dx.doi.org/10.22161/ijeab.74.2Biotech.)3 color Diseases (score 1 9)* spot 1 3 1 Brown spot 0 1 3 Lodging resistance (score 1 3) 1 2 1 2,4 6,9 Rate of two seed per pod (%) 77.7 68.5 58.9 100 grain wgt (g) 42 1 40.9 36.8 Yield ( ton/ha) ( dry Wet Season) 4.19 3.5 3.8 3.5 2.7 2.3
Rust 1 3 1 Black
209 10 Mature seed coat color Light Yellow Yellow Light Yellow 11 Seed
13
Nguyen et al. International Journal of Environment, Agriculture and Biotechnology, 7(4) 2022
Characters of gowth and Morphology: HATRI 13 ĐP variety belongs to short duration group (85 90 days), equiveleant to its parents; growing type of determinate, erect type of plant, ovate leaf shape, medium plant hight (62 68 cm) and high number of first branch (2,3 3,0 braches) which is middle of parents; HATRI 13 DP has purple flower, big light yellow seed and brown hilum color of Abilityseed...toresist biotic and abiotic stress: HATRI 13 ĐP has performed wide adatability. It can be cultivated in 3 crop season per year (Spring, Summer and Fall Winter); well resistant to drought (this trait was received from its female parent, Yuanza 9102 ) and quite well resistant to drought, heat (this trait was received from its male parent, (ICG 12625). HATRI 13 ĐP has good resistant to Rust (score 1), black spot (score 1), Brown spot (score 1 3)... ; good lodging resistance (score 1 2). Yield components: HATRI 13 ĐP has more number of pod per plant than that of Yuanza 9102 (27 40 pods) and high P100 seed (42.1 g ) equivalent to Yuanza 9102 (40.9g) and higher than that of ICG 12625 (36.8); HATRI 13 ĐP has rate of two seed per pod higher than that of Yuanza 9102 (68.6%) and ICG 12625(58.95).( Table 2) Table 2. Some agronomic properties (height plants and duration) of winter spring peanut varieties 2021 no lines Plants(cm)height Firstdateflowering(days) Finaldateflowering(days) duration(days) Branch 1 Yuanza 9102 68.5b 38a 45a 100a 4.99c 2 ICG 12625 69.6b 37b 44b 96b 5.67b 3 HATRI 13ĐP 68.1b 37b 44b 90c 6.50a 4 MD7 ( Checked ) 72.0a 36c 44b 95b 5.8b Ngày ra hoa đầu tiên
16
Peanuts: most varieties have an average growth time in this summer autumn crop of 95 100 days, lasting longer than the winter spring crop, possibly due to prolonged rains and waterlogging suitable for monoculture areas or intercropping with other crops. Flowering varieties concentrate 35 38 days after sowing, the flowers bloom profusely during the 1st flowering Table 2 The present study concluded that there are no significant differences on plant height with HATRI 13 ĐP with their parents , but there is significant difference in the weight of pods, % pods 3,2 and 1 seeds , number of yield provide by ANOVA test ( Table 3) Table 3: Yield and yield of components of peanut varieties dry season 2021 at Tra Cu , Tra Vinh No Lines Yield ( ha)ton/ % pods 3 4seeds % pods 2 seeds %1seedspods % unfillingpods podsP100(g) seedsP100(g)
1 Yuanza 9102 6.06a 0.00b 83.4a 10.6c 5.96c 105.8b 40.9b 2 ICG 12625 3.42c 21.5a 58.5c 12.9b 7.07b 102.8bc 36.8c
Red color Dark brown Red color 12
15
14
ISSN: 2456 1878 (Int. J. Environ. Agric. https://dx.doi.org/10.22161/ijeab.74.2Biotech.)3
HATRI15ĐP 3.29 7.18 5.42 5.92 6.2 5.62
Assessing the genotype and environmental interactions of peanut lines on the yield of peanut varieties in the Winter Spring 2021 crop Normally a newly recognized variety must have high stability and adaptation to different environments along with high yield factors and good agronomic properties to improve variety reliability. When grown in various locations to assess their stability and adaptation, some of their agronomic characteristics and yields are likely to change. The main cause of differences in adaptability and stability between breeds is the interaction between genotype and environment. This causes a lot of difficulties in proving the superiority of a breed. The phenotype of a body is regulated through the control of the genotype and environment. The variability of the phenotype in the environment is not the same in all genotypes, the result of phenotypic variation depends on the environment.Incases where there are multiple types of interactions, then theoretically there is only one type of interaction in which the same genotype becomes the best genotype across all environments (Chahal and Gosal, 2002). In fact, such genotypes may not be present, or can hardly develop and identify. Interference type interactions become more realistic. Such an interaction will indicate which genotype is adapted to the environment. Non interferometric interaction patterns affect the nature and importance of genetic variance components, on the other hand they are related to parameters such as: genetic coefficient [h2], selective efficiency [GA]. Such genotypic complexity makes improving crop yields dependent not only on the artistic ingenuity of the breeder, but also requires a full scientific understanding of biological statistical analysis through seed assays across various sites, for rice in particular and all crops in general according to ( Lang et al 2016 Experiments) evaluating adaptability and stability are usually conducted in environmental conditions other than space (place) or time (season) or both space and time. This allows us to apply the Eberhart and Russell, 1966 model to understand the interaction between genotype (G) and environment (E). Experiments evaluating gene and environmental interactions of prospective hybrid lines were conducted on a large scale. The experiment was conducted at six sites representing rice regions in the Mekong Delta: An Giang, Can Tho, Tra Vinh (three sites : Tra Cu, cau Ngang and Duyen Hai), and the experiment was conducted in two Winter Spring 2020 2021 crops. The results of rice yield assessment across 5 locations: An Giang, Can Tho, Tra Vinh, of the peanut seed/line in the Winter Spring 2021 2022 season are presented through Table 4. The results of the productivity movements showed that the F test was statistically significant at 1% in terms of the linear hypothesis of the environment, like, interacting with the environment. This allows us to use the environmental index (Ij) symbol for each place, on the interaction diagram between the genotype and the environment with the order from unfavorable to favorable as follows: Can Tho , Tra Cu, Duyen Hai,An Giang , Cau Ngang is on the Ij axis with the value in: 0.103; 0 003; 0.022; 0.017; 0.08 respectively . Table 4: Yield (ton/ha) of peanut seed/line at 5 sites at winter spring 2021 Lines Cantho CuTra Duyen Hải GiangAn NgangCau Yield(ton/ha HATRI01ĐP 4.32 7.21 5.45 5.95 4.2 5.43
HATRI 13ĐP 4.94 7.81 6.06 6.56 7.8 6.63
HATRI 20ĐP 3.2 7.08 5.32 5.82 4.6 5.21
International Journal of Environment, Agriculture and Biotechnology,
HATRI03ĐP 3.69 7.58 5.82 6.32 5.1 5.7 HATRI06ĐP 3.91 7.79 6.04 6.54 7.5 6.35
Nguyen et al. 7(4) 2022
210 3 HATRI 13ĐP 6.19a 0.00b 77.7b 13.9a 4.48d 95.9cdef 42.1a 4 (CheckeMD7d) 5.97b 0.00b 77.5b 13.9a 8.79a 92.3defg 40.2b point assay
HATRI14ĐP 4.5 7.38 5.62 6.12 7.5 6.22
HATRI 8ĐP 3.19 7.06 5.31 5.81 5.8 5.41
3.3.Multi
HATRI02ĐP 4.71 7.59 5.84 6.34 5.6 6.01
Brown spot (Cercospora arachidicola), black spot (phaeoisariopsis personala).Brown spot and black spot disease appear earlier than rust spot disease from the start of flowering causing severe harm at the 90 day period from points 1 5 points for brown spots, 3 5 points for black spots. The MD 7 variety suffers from the most severe brown and black spot disease after 90 days . Table 5: Resistance categories for reactions of peanut genotypes to diseases. ICG 12625 HATRI 13ĐP Qualtility and nutritional of peanut of HATRI 13 ĐP and parents Peanuts have a strong nutritional. They are an excellent source of plant based protein, fiber, and many key vitamins and Resultsminerals.ofanalyzing seed quality indicated that in Fall Winter crop 2021, HATRI 13 DP has good quality
ISSN: 2456 1878 (Int. J. Environ. Agric. https://dx.doi.org/10.22161/ijeab.74.2Biotech.)3
IJ (Envicroments Index) 0.103 0 003 0 022 0.017 0.08
0 0 1 0 0 0 0 0 1 3.5.
3.4. Reaction to disease
Lines / Desease Rust dease brown spot black spot Times 30 60 90 30 60 90 30 60 90 (MD7checked) 0 2 5 0 0 3 0 0 5 Yuanza 9102 0 1 4 0 0 2 0 0 4
0 1 1 0 1 3 0 1 1
Results of analyzing seed quality indicated that in Fall
.The proximate composition of defatted peanuts is shown in Table 6. The largest fraction in both peanut meals was protein content, ranging from protein content of 24.5 g
The main causes of peanut damage are rust disease is an economically important biotic stress that significantly reduces the pod and fodder yield and oil quality. It is caused by the basidiomycete fungus Puccinia arachidis Speg. which belongs to class Pucciniomycetes like other rust fungus but has fewer occurrences in teliospore form. The P. arachidis predominantly spreads by the repeated cycle of uredospores in the field. The disease is prevalent in most of the countries where peanut is cultivated and favored by warm and humid climatic conditions such as Tra Vinh province. Despite its economic importance, very limited work has been carried out on host fungus interaction, fungal genetic diversity, and physiological specialization. Rust disease appears only at the end of the growth and development of peanuts. In the early stages, it is rare and the disease develops very strongly in the late stages. Peanut varieties participating in the experiment suffered from iron disease from points 1 2 points at this stage 60 after sowing, points 2 5 points 90 days after sowing.
.Protein HATRI 13 ĐP was significantly higher than in Yuanza 9102( 22.3 g). Carbohydrate was the second largest fraction, found in the range of 16.13 g lower to Yuanza 9102 (17.2g) higher than ICG12625 and MD7.The total fat and crude fiber in HATRI 13 ĐP (43.43 and 8.4, respectively) were significantly different to those in Yuanza 9102 (39.2 and 7.8 respectively) (p < 0.05).
International Journal of Environment, Agriculture and Biotechnology,
Nguyen et al. 7(4) 2022
211 MD7 2.56 7.44 5.69 5.19 6.6 5.45 Mean 3.83 7.41 5.65 6.07 6.09 5.49
In terms of rice varieties, most hybrids have an average yield higher than the control MD 7 variety (5.87 tons/ha). The difference in the yield of the varieties is significant at 5% based on a scale that evaluates productivity through multi point analysis. The yield at Tra Cu (7.41) next Cau Ngang (6.09ton / ha), followed by An Giang (6.07). Analyzing ANOVA yields of 14 rice varieties 5 environments, the difference in the yield of varieties is very statistically significant at 1%, but the level of stability in yield, as well as adaptability manifests itself very differently, through GxE (linear) interaction is very significant. The results of the ANOVA analysis allow to consider the interaction between the breed and the environment here to be linear. In the Winter Spring 2021 season, it is clear that the yield of the lines compared to the control variety is superior such as the HATRI 13 DP line (Yield 6.63 tons / ha).
Minerals and vitamine content can be reduced by the re extraction process, increased contact time, or adjustment of the solid liquid ratio. ( Table 6 ). Minerals : postassium lower mother (Yuanza 9102)but hight father(ICG 12625)
ISSN: 2456 1878 (Int. J. Environ. Agric. https://dx.doi.org/10.22161/ijeab.74.2Biotech.)3
Nguyen et al. International Journal of Environment, Agriculture and Biotechnology, 7(4) 2022
212 Winter crop 2021, HATRI 13 DP has good quality (protein content of 24.5g and lipid of43.43 g).( Table 6) Table 6: Nutritional value per 100 g of HATRI 13 ĐP and Parents Information Contents HATRI 13 ĐP Yuanza 9102 ICG 12625 MD7 macronutrients protein(g) 24.5 22.3 25.2 23.2 carbohydrate(g) 16.13 17.2 15.7 16.1 fiber(g) 8.4 7.8 7.7 8.1 sugars(g) 4.72 4.1 4.2 3.85 fats Total Fat (g) 43.43 39.2 43.05 39.56 minerals potassium(mg) 702 712 623 625 phosphorous(mg) 356 320 378 256 magnesium(mg) 160 152 161 153 calcium(mg) 95 90 96 79 sodium(mg) 17 15 17 13 iron(mg) 4.58 5.26 5.74 3.56 zinc(mg) 3.77 3.56 3.02 3.52 Copper(mg) 1.356 1.421 1.253 1.461 vitamins vitamin B 3 (niacin)(mg) 11.89 12.1 10.52 11.23 vitamin E (alpha tocopherol)Mg) 8.33 7.56 8.23 8.12 vitamin B 1 (thiamine)mg 0.64 0.55 0.62 0.6 vitamin B 6 (pyridoxine)(mg) 0.35 0.44 0.32 0.021 riboflavin (vitamin B 2)(mg) 0.16 0.08 0.1 0.12 folate (vitamin B 9)(mcg) 245 215 245 241 Vitamin C 0 0 0 0 folate (vitamin B 9)(mcg) 245 215 245 241 Vitamin C 0 0 0 0
Fig.3. HATRI 13ĐP growing at Tra Cu (Tra Vinh province) IV. DISCUSSION
Nguyen et
al. International Journal of Environment, Agriculture and Biotechnology, 7(4) 2022
213
HATRI 13DP variety has significant value in height, number of branches/trees, number of seeds/trees, volume of 100 seeds, number of nodules/tree. Yield and kernel yield as well as particle size are both higher than MD 7. In addition, HATRI 13DP is a large seed cultivar, so it needs more fertilizer application than MD7. The traits of the number of seed pods per plant observed in this study confirm the findings and report significantly significant variable traits in terms of the number of seed pods per plant as reported by (Waghmode et al., 2017). the loci control the traits that determine productivity distributed across the entire genome, which also indicates a complex genetic basis of the traits that determine productivity. It is also possible to replicate QTLs with moderate phenotypic changes for seed size and weight in peanuts as well as in soybeans (Xie et al. 2014). Single locus markers have many advantages in molecular genetics and breeding studies compared with multi locus markers (Jin et al.,2010). The alleles of single locus markers can be assigned to particular genomic loci in diversity analyses, preventing problems of extensive genome duplication and homology within and between different genomes caused by multi locus markers of polyploidy ( Li et al 2013).In this study, Use PCR product of the segregating population were generated by DNA amplication with primers for GM 1494 locus, on chromosome A07, positioned two the banding patterns of the parents , 220bp (ICG 12625) and 200bp (Yuanza 9102) at F3 popluation.
ISSN: 2456 1878 (Int. J. Environ. Agric. https://dx.doi.org/10.22161/ijeab.74.2Biotech.)3
We also investigated whether the motif type, repeat length and repeat number influence the polymorphism locus SNP markers for Aradu A07 1148327 locus, on chromosome A07 . With 4 peanut genotypes were detected showing different levels of resistance to Brown spot caused by Cercospora arachidicola and P. personata. Genotypes ranging from brown spot resistant to brown spot susceptible were observed in a field study. Differences in infected leaf area percentage among peanut genotypes provided useful information. A differential response to infection by the fungal causal agents of early and late blight existed among peanut genotypes with different inherent levels of resistance. The resistance parameters including the number of rust , brown spot and black spot , size of leaf spots, and infected leaf area percentage could differentiate genotypes into resistant and susceptible from pearence and . The results of this study indicated that genotypes HATRI 13 ĐP , and ICG 12625 were consistently tolerant to CLS under field conditions . Peanut is an important crop grown worldwide. Commercially it is used mainly for oil production but apart from oil, the by products of peanut contains many other functional compounds like proteins, fibers, polyphenols, antioxidants, vitamins and minerals which can be added as a functional ingredient into many processed foods(Shalini et al.,2016) . Results of analyzing seed quality indicated that in Winter crop 2021, HATRI 13 DP has good quality (protein content of 24.5g and lipid of 43.43 g) and were

[18] Mounirou Hachim Alyr, Justine Pallu, Aissatou Sambou, Joel Nguepjop, Maguette Seye, Hodo Abalo Tossim, Yvette Djiboune, Djibril Sane, Jean François Rami, Daniel Fonceka2020.Fine Mapping of a Wild Genomic Region Involved in Pod and Seed Size Reduction on Chromosome A07 in Peanut (Arachis hypogaea L.). Genes, MDPI, 2020, 11 (12), 10.3390/genes11121402.
[19] McCouch S. R. , G. Kochert, Z. H. Yu, Z. Y. Wang, G. S. Khush, W. R. Coffman &S. D. Tanksley 1988. Molecular mapping of rice chromosomes.TheoreticalandApplied Genetics volume 76, pages815 829 (1988).
[21] Subrahmanyam, P., McDonald, D., Waliyar, F., Raddy, L. J., Nigam, S. N., Gibbons, R. W., Rammanatha Rao, V., Singh, A. K., Pande, S., Reddy, P. M. and Subba Rao, P. V. 1995. Screening methods and sources of resistant to rust and late leaf spot of groundnut. ICRISAT Center, Patancheru, India.
[6] FAOSTAT (2021). FAOSTAT Statistical Database. Rome: Food and Agriculture Organization of the United Nations.
The authors are extremely grateful to the Tra Vinh Department of Science and Technology for providing funding to implement this topic. And High Agricultural Technology Research Institute for Mekong delta (HATRI) for all the support and facilities to conduct this experiment and the initiatives to publish the research findings.
[4] Bertioli, D. J., Jenkins, J., Clevenger, J., Dudchenko, O., Gao, D., Seijo, G., et al. (2019). The genome sequence of peanut (Arachishypogaea), a segmental allotetraploid. Nat. Genet. 51, 877 884. doi: 10.1038/s41588 019 0405 z
[10] Janila P, Pandey MK, Shasidhar Y, Variatha MT, Sriswathi M, Khera P, et al. Molecular breeding for introgression of fatty acid desaturase mutant alleles (ahFAD2A and ahFAD2B) enhances oil quality in high and low oil containing peanut genotypes. Plant Sci. 2016; 242:203 213. pmid:26566838.
[14] Lang NT , Bui Chi Buu , Bui Chi Bao 2015 . Genetic engineering in biotechnology. Education Publishing House.
[20] Shi J, Zhan J, Yang Y, Ye J, Huang S, Li R, Wang X, Liu G, Wang H (2015) Linkage and regional association analysis reveal two new tightly linked major QTLs for pod number and seed number per pod in rapeseed (Brassica napus L.). Scientific Reports 5:14481
[7] Huang L, He HY, Chen WG, Ren XP, Chen YN, Zhou XJ, et al. Quantitative trait locus analysis of agronomic and quality related traits in cultivated peanut (Arachis hypogaea L.). Theor Appl Genet. 2015;128:1103 15.
Nguyen et al. International of Biotechnology, 7(4) 2022
Results of production testing for HATRI 13ĐP the Mekong delta provinces showed that HATRI 13ĐP has wide adaptability in many different ecological zones such as :Tra Vinh Province, An Giang Province and Can Tho City
[8] Hollinger,F.;Staatz,J.M.CroissanceAgricoleenAfriquedeL’o uest: FacteursDéterminantsdeMarchéetdePolitique; L’organisation des Nations Unies Pour L’alimentation et L’agriculture: Rome, Italy, 2015
[11] Jin L, Lu Y, Xiao P, Sun M, Corke H, Bao J. Genetic diversity and population structure of a diverse set of rice germplasm for association mapping. Thero Appl Genet. 2010;121:475 87 [12] IRRI.2019.https://irri.org/our work/outcome themes/improving health through safe and nutritionally enhanced rice [13] Lang NT (2002). Protocol for basics of biotechnology. Agricultural Publishing House, Ho Chi Minh, Vietnam.
[15] Lang T N, Xa T.T Thanh, Nguyen Van Hieu, Chau Thanh Nha, Nguyen Ngoc Huong, , Bui Chi Buu .2016.The interaction of quality and productivity on rice varieties in the Mekong Delta. Vietnam Journal of Science and Technology, No. 7. (68)pp. 51 56 [16] Li H, Younas M, Wang X, Li X, Chen L, Zhao B, Chen X, Xu J, Hou F, Hong B, Liu G, Zhao H, Wu X, Du H, Wu J, Liu K. Development of a core set of single locus SSR markers for allotetraploid rapeseed (Brassica napus L.). Theor Appl Genet. 2013;126(4):937 47.
[17] Liu J, Hua W, Hu ZY, Yang HL, Zhang L, Li RJ, Deng LB, Sun XC, Wang XF, Wang HZ (2015) Natural variation in ARF18 gene simultaneously affects seed weight and silique length in polyploid rapeseed. Proc Natl Acad Sci 112:E5123 E5132.
214 significantly different to those in Yuanza 9102 and ICG 12625 ( Table 6) V. CONSLUSIONS Peanut variety, HATRI 13ĐP was bred using cross pollination method from Yuanza 9102/ICG 12625 , growth duration from 85 90 days (in Summer and Fall Winter crop season), hard stem, good growth and development, wide adaptability, and can be cultivated all two seasons per year. HATRI 13ĐP has high yielding potential, high P100 seed (42.1g), with beautiful yellow seed, protein content of 24.5 g and tolat fat of 43.43g
Environment, Agriculture and
Journal
ISSN: 2456 1878 (Int. J. Environ. Agric. https://dx.doi.org/10.22161/ijeab.74.2Biotech.)3
ACKNOWLEDGEMENTS
[5] Coulibaly, P.J.d.A.; Okae Anti, D.; Ouattara, B.; Sawadogo, J.; Sedogo, M.P. Effect of Dry Cropping Season of Sorghum on Selected Physico Chemical Properties in West Africa. Int. J. Agric. Innov. Res. 2018, 7, 192 196.
REFERENCES
[1] AOAC. Official Methods of Analysis of AOAC International, 17th ed.; AOAC: Arlington, VA, USA, 2000. [2] Australian Standard, 2007.Australian StandardGlycemic Index of Food [3] Bertioli, D. J., Abernathy, B., Seijo, G., Clevenger, J., and Cannon, S. B. (2020). Evaluating two different models of peanut’s origin. Nat.Genet. 52, 557 559.
[9] Hu,EA;OAND,Pan, A; MAKIK,V and Sun,Q. 2012. White rice comsumption and risk of type 2 diabetes metaanalysis and systematic review. BM J . 344.1 9.
ISSN: 2456 1878 (Int. J. Environ. Agric. https://dx.doi.org/10.22161/ijeab.74.2Biotech.)3
215 [22] Shalini S. Arya, Akshata R. Salve, and S. Chauhan 2016. Peanuts as functional food: a review, Food Sci Technol. 2016 Jan; 53(1): 31 41. [23] Yuning Chen, Xiaoping Ren, Yanli Zheng, Xiaojing Zhou, Li Huang, Liying Yan, Yongqing Jiao, Weigang Chen, Shunmou Huang,Liyun Wan, Yong Lei, Boshou Liao, Dongxin Huai,Wenhui Wei & Huifang Jiang.2017. Genetic mapping of yield traits using RIL population derived from Fuchuan Dahuasheng and ICG6375 of peanut (Arachis hypogaea L.)Molecular Breeding volume 37, Article number: 17 (2017) [24] Xie FT, Niu Y, Zhang J, Bu SH, Zhang HZ, Geng QC, Feng JY, Zhang YM (2014) Fine mapping of quantitative trait loci for seed size traits in soybean. Mol Breeding 34:2165 2178 [25] Tran Nguyen Thi Khanh , Le Hoang Phuong , Nguyen Trong Phuoc, Nguyen Thi Lang.2021 Journal and Rural Development No. 17. Pp. 45 53. Year 2021 [26] Weigang Chen, Yongqing Jiao, Liangqiang Cheng, Li Huang, Boshou Liao, Mei Tang, Xiaoping Ren,Xiaojing Zhou, Yuning Chen & Huifang Jiang .2016. Quantitative trait locus analysis for pod and kernel related traits in the cultivated peanut (Arachis hypogaea L.).BMC Genetics volume 17, Article number: 25 (2016) [27] World Bank. BurkinaFaso. LeDéfidelaDiversificationdesExportationsDansunPaysEncla vé: ÉtudeDiagnostique sur L’intégration Commerciale Pour le Programme du Cadre Intégré 43134; World Bank: Washington, DC, USA, 2007; p. 172.
Nguyen et al. International Journal of Environment, Agriculture Biotechnology, 7(4) 2022
and