Journal Home Page Available: https://ijeab.com/ Journal DOI: 10.22161/ijeab

Journal Home Page Available: https://ijeab.com/ Journal DOI: 10.22161/ijeab
Yusuf
1,2,3,4DepartmentofCivilEngineering,IskenderunTechnicalUniversity, Iskenderun/Hatay –Turkey 5 DepartmentofCivilEngineering,Bartin University,Bartin/Turkey
Received: 23Nov2022; Received inrevised form: 14 Dec2022;Accepted: 22 Dec2022;Availableonline:29 Dec2022 ©2022 TheAuthor(s).Publishedby InfogainPublication.Thisisan open accessarticleundertheCCBYlicense (https://creativecommons.org/licenses/by/4.0/).
Abstract When water is taken from desired parts of the natural or regulated riverbed, it is necessary to use river regulating structures to prevent slope and bed erosion. The main project criterion used in this type of river regulation structures is the flow discharge and velocity. Submerged vane structures are an effective and alternative method used to control the flow in river regulation studies. In this study, the river regulation study with submerged wane structures was modeled in 3D with computational fluid dynamics programs (CFD). Submerged vane model results obtained using 3D computational fluid dynamics were evaluated by comparing them with flow velocities obtained from previous submerged vane experimental results. In the generated numerical model, nonlinear and continuity, turbulence model equations were used. The k-ε turbulence model was used for turbulent viscosity. When the results of the current model were compared with the previous experimental study, it was seen that the experimental results and the modeling analysis results were compatible.
Keywords Submerged Vane, Experimental model, CFD model, VOF Method, Velocity
It is provided with coastal protection structures for the protection of coasts, river bottoms and slopes. We can call thesestructuresandstudiesmentioned asflowmanagement. Preservation of the structure of streams such as rivers and canals on the bottom and slopes is also done with the application of submerged vanes.
Among the natural accumulation forms of water, the regions where alluvium is most critical are the curved parts of the streams. Problems are seen more here than in other parts. The growth of meanders formed by a stream on its slightly sloping bases, as well as erosions, pose a problem.
Sediment control inrivers may be required to increase the capacity of the channel, to maintain the most favorable and optimal flow depth, to prevent or divert erosion of river and stream beds and coasts. There are different techniques in this regard. In this study, the submerged vanes technique will be used. It is seen that it is a different technique from the previous applications. The cost of this application provides great advantages as it is very economical compared to physical modeling and trial and error techniques. The first studies on submerged vanes began in
ISSN: 2456-1878 (Int. J. Environ. Agric. Biotech.) https://dx.doi.org/10.22161/ijeab.76.21

1982 when Odgaard and Kennedy [1] introduced the performance of the submerged vane for slope protection on the Sacremento River as a new method as a technical note. In the past, there are studies on submerged vane structures and their effects on flow [2-11].
Within the scope of this study, the flow discharge of the water in the channel were measured by changing the angle of the submerged vanes, the cross-sections of the vanes. The experiment modelling was carried out on a main channel and its side channel.
In this experiment; Velocity changes in the channel were measured experimentally as well as computational fluid dynamics (CFD). While measuring and analyzing, parameters such as channel geometry, dimensions of main and side channels (length, width, slope), height of water in the channel were carefully and meticulously specified and used to compare measurements. Thus, the results were compared and the error rates were observed
In this study, the continuity equation, momentum equation and k-ε turbulence model equations given below were used to create the numerical model.
Continuity Equation
Equation
Fig. 1 The occupancy rate of mesh elements

(k) Equation
Turbulence Dissipation Rate Energy (ε) Equation
]+��
(3) ui is the velocity component, the coordinate components are denoted by xi, ρ is the density, µ is the molecular viscosity coefficient. P is the correct pressure, t is the time component, µt is the turbulent viscosity coefficient. The turbulent kinetic energy can be found from the ratios k and turbulent dispersion ���� =������ ��2 �� (5) �� =���� (������ ������ + ������ ������)������ ������ (6) σk and σε are prandtl numbers that are dimensionless. σk =1.0, σε =1.3,C1ε andC2ε,εareconstantsintheequation. C1ε = 1.44, C2ε = 1.92. Cμ=0.09 are constants determined by experimental measurement.
In this study, the volume offluid (VOF) method was used to calculate the water-air interface. The VOF method essentially determines whether the element volumes in the computational mesh are empty, partially filled, or completely filled with water. Representing the volumetric filling ratio of the mesh elements, the mesh element is fully filled for F=1, empty (filled with air) for F=0, and partially filled with water for 0<F<1 [12](Fig. 1) Previously experimentally setup and initial conditions were given Fig 2 and Table I, respectively.
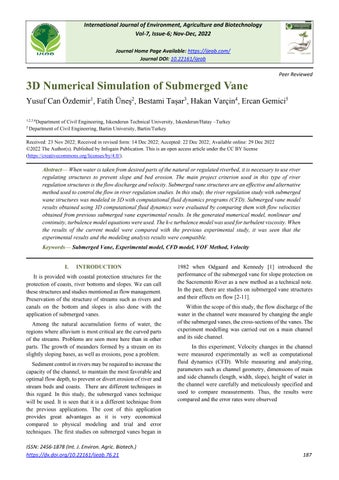
Fig. 2 Submerged vane experiment set-up (top); Submerged vane lined up with 20 degrees (bottom) [13]
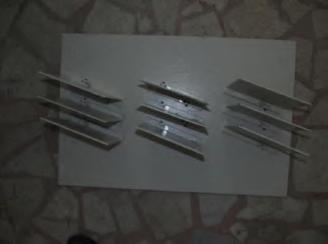
Table 1. Submerged vane initial conditions Velocity Inlet (Vi (m/s)) Water inlet depth (di,m) 0.19 0.23
Since the flow of water in the open channel changes depending on time, the parameters found at the beginning change during the progress of the current modeling. Therefore, the initial values are not very important. The initial values required for the creation of the model are shown in Table 1. The flow rate used during modeling, the flow rate measured in the open channel setup and other boundary conditions were taken from the experimental setup.
The conditions were created by using the model Gambit and Ansys-Fluentmodelingandanalysisprogramsdesigned above, by entering the determined initial and boundary parameters into the program. There are dam reservoir studiescreatedusingtheseprogramsin thepast[14–21].The solution of the analysis was done with the control volume approach. Numerical analysis of the model was made and
ISSN: 2456-1878 (Int. J. Environ. Agric. Biotech.) https://dx.doi.org/10.22161/ijeab.76.21
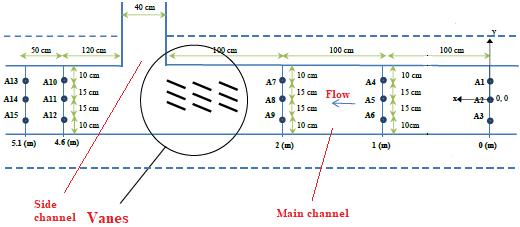
the results were obtained. Submerged vane boundary conditions were given in Fig. 3.
Fig. 3 Submerged vane boundary conditions
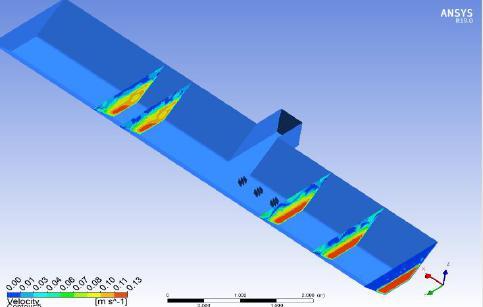
After defining the initial and limit values, the contours representing the velocity values of the open channel CFD are shown in Figure 4. According to Fig. 4, it has been determined that the velocities decrease at the locations where the submerged vanes are located. While the velocity values were around 0.17 m/s at the edge points of the main channel, it was observed that this value gradually decreased towards the vanes. It was determined that the velocity values around the vane were around 0.09 m/s. In Figure 4, the vanes affect the direction and velocity of the flow in the open channel. The flow direction of the water is from the main channel to the side channel. In the measurementsmadewhenthewaterfromthemainchannel passes into the side channel, itis measured that thevelocity of the water decreases.
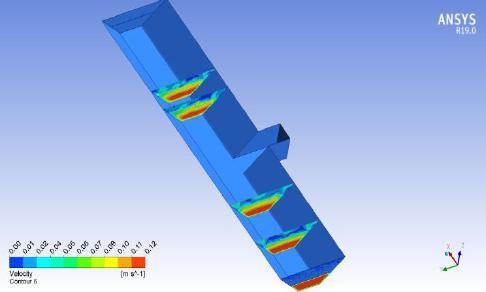
The view in plan sections of the flow velocity variation with and without submerged vanes is given in Figure 5. Table 2 and Table 3 show the experimental and CFD results of vanes placed at an angle of 20° and no vane According to this Table 2 the minimum error rate was 6.47%. The highest error rate was 8.48% at the positions at 0.1- and 2meters distance. After the vane. The error rates were 15.88% and 15.13% at 4.6 and 5.1 meters. Table 2 shows when looking at the data. Also, experimental-CFD velocity results with submerged vane were given in Fig. 6
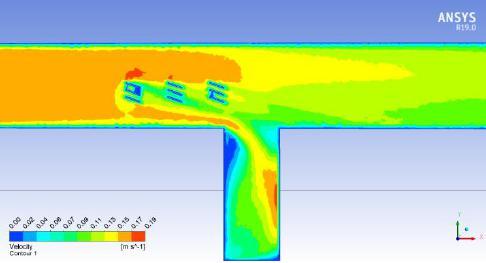
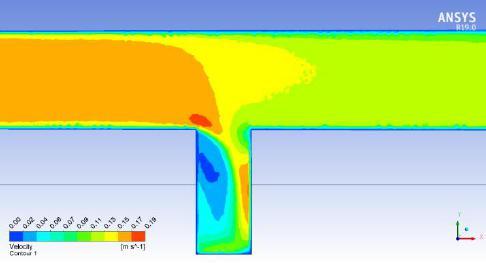
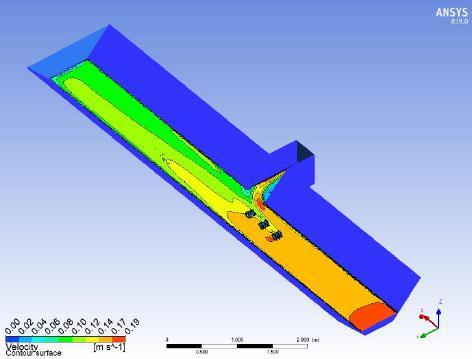
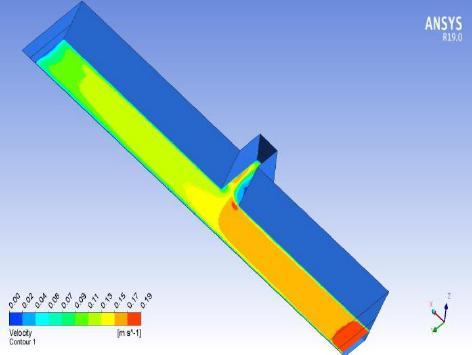
Fig. 4 Velocity contour changes with Submerged vane and no vane
Fig. 5. Flow velocity contour with no vane (top) and submerged vane (bottom)
ISSN: 2456-1878 (Int. J. Environ. Agric. Biotech.) https://dx.doi.org/10.22161/ijeab.76.21
Table 2 CFD and experimental velocity results using no vane
Section No Location at x direction (m)
Location at y direction (m)
Location at z direction (m)
Experiment Results (m/s) Fluent CFD Results (m/s)
Error (%)
1 0.0 0 10 0 13 0 1774 0 1858 4.73 2 1.0 0.10 0.13 0.1737 0.1573 9.44 3 2.0 0.10 0.13 0.1701 0.1528 10.17 4 4.6 0.10 0.13 0.1225 0.1188 3.02 5 5.1 0.10 0.13 0.1182 0.1202 1.69
Table 3 CFD and experimental velocity results using submerged vane
Section No Location at x direction (m)
Location at y direction (m)
Location at z direction (m)
Experiment Results (m/s) Fluent CFD Results (m/s)
Error (%)
1 0.0 0 10 0 13 0 1745 0 1858 6.47 2 1.0 0 10 0 13 0 1709 0 1578 7.66 3 2.0 0 10 0 13 0 1673 0 1531 8.48 4 4.6 0.10 0.13 0.1146 0.0964 15.88 5 5.1 0.10 0.13 0.1117 0.0948 15.13
0.16
0.12
0.08
0.04
0.2 1 2 3 4 5
0
ExperimentResults(m/s) FluentCFDResults(m/s)
Velocity m/s Section no
Fig. 6 Examination of in experimental-CFD velocity change results
The velocity distribution in the cross-sections were given Fig. 7. For the cases with and without the vane, the flow and velocity variations are clearly visible in the figures. It has been obtained from numerical models that in the case of the vane, it directs the flow to the side channel and reduces the flow velocity.
ISSN: 2456-1878 (Int. J. Environ. Agric. Biotech.) https://dx.doi.org/10.22161/ijeab.76.21
Fig. 7 5 cross-sectional velocity changes using with no vane (top) and submerged vane (bottom)
The 3D numerical model of the experimentally studied submerged vane in the open channel was created in this study. The variation of the flow for the cases with and without the Vane was investigated. Numerical model was created for the case with 20° angled Vane in the open channel and compared with the case without Vane. The maximum error between the experiment and the numerical model was found to be between 10-15%. It is seen that the experimental results are compatible with the 3D numerical model. It is thought that such studies can be used in the initial stages of future applications and projects.
[1] Odgaard, A. J., & Kennedy, J. F. (1982). Analysis of Sacramento River bend flows, and development of a new methodforbankprotection.IowaInstOfHydraulicResearch IowaCity.
[2] Baltazar,J.,Alves,E.,Bombar,G.,&Cardoso,A.H.(2021). Effect of a submerged vane-field on the flow pattern of a movable bed channel with a 90 lateral diversion. Water, 13(6),828.
[3] KaramiMoghadam,M.,Amini,A.,&Keshavarzi,A.(2020). Intake design attributes and submerged vanes effects on sedimentation and shear stress. Water and Environment Journal, 34(3),374-380.
[4] Kalathil, S. T., Wuppukondur, A., Balakrishnan, R. K., & Chandra, V. (2018). Control of sediment inflow into a trapezoidal intake canal using submerged vanes. Journal of Waterway, Port, Coastal, and Ocean Engineering, 144(6), 04018020.
[5] Biswas, P., & Barbhuiya, A. K. (2019). Effect of submerged vane on three dimensional flow dynamics and bed morphology in river bend. River Research and Applications, 35(3),301-312.
[6] Bor,A.(2022).Experimentalinvestigationof90°intakeflow patterns with and without submerged vanes under sediment feeding conditions. Canadian Journal of Civil Engineering, 49(3),452-463.
[7] Shabanlou, S., Azimi, H., Ebtehaj, I., & Bonakdari, H. (2018).Determiningthescourdimensionsaroundsubmerged vanes in a 180 bend with the gene expression programming technique. JournalofMarineScienceandApplication, 17(2), 233-240.
[8] Taşar, Bestami & Üneş, Fatih & GEMİCİ, Ercan & Varçin, Hakan.(2021).NumericalSimulationofChannelFlowUsing Submerged Vane in River Arrangements. Aerul şi Apa: Componente ale Mediului. 2021. 119-130. 10.24193/AWC2021_11.
[9] Taşar, Bestami & Üneş, Fatih & GEMİCİ, Ercan. (2023). Laboratory and numerical investigation of the 2-array submergedvanesinmeanderingopenchannel.Mathematical biosciences and engineering: MBE. 20. 3261-3281. 10.3934/mbe.2023153
ISSN: 2456-1878 (Int. J. Environ. Agric. Biotech.) https://dx.doi.org/10.22161/ijeab.76.21
[10] Tajari, M., Dehghani, A. A., Meftah Halaghi, M., & Azamathulla, H. (2020). Use of bottom slots and submerged vanes for controlling sediment upstream of duckbill weirs. WaterSupply, 20(8),3393-3403.
[11] Gumgum, F., & Cardoso, A. H. (2023). Optimizing the Desilting Efficiency of Submerged Vane Fields at Lateral Diversions. Journal of Hydraulic Engineering, 149(1), 04022031.
[12] Hirt, C. W., & Nichols, B. D. (1981). ‘Volume offluid (VOF) method for the dynamics of free boundaries’, Journal of computationalphysics,Vol.39,No.1,201-225.
[13] Gemici, E. (2015). ‘Açık Kanallarda Batık Kanatlarla Akım Yönetimi’, Erciyes University. Graduate School of Natural and AppliedSciences,Ph.D.Thesis.(in Turkish)
[14] Üneş, F., Joksimovic, D., & Kisi, O. (2015). Plunging flow depth estimation in a stratified dam reservoir using neurofuzzy technique. Water resources management, 29(9), 30553077.
[15] Üneş, F., & Varçin, H. (2012). Investigation of Plunging Depth and Density Currents in Eğrekkaya Dam Reservoir. TeknikDergi, 23(1),5725-5750.
[16] Ünes, F., & Varçin, H. (2015). Investigation of seasonal thermal flow in a real dam reservoir using 3-D numerical modeling. JournalofHydrologyandHydromechanics, 63(1), 38.
[17] Unes, F., Agiralioglu, N. (2017). Numerical investigation of temporalvariationofdensityflowandparameters.Journalof Applied Fluid Mechanics, 10(1), 81-94. doi: 10.18869/acadpub.jafm.73.238.25947
[18] Ünes,F.(2010).Predictionofdensityflowplungingdepthin dam reservoirs: an artificial neural network approach. Clean–Soil,Air,Water, 38(3),296-308.
[19] Üneş, F., Demirci, M., & Varçin, H. (2016). 3-D Numerical Simulation of a Real Dam Reservoir: Thermal Stratified Flow. In Advances in Hydroinformatics (pp. 377-394). Springer,Singapore.
[20] Üneş, F. (2008). Analysis of plunging phenomenon in dam reservoirs using three-dimensional density flow simulations. Canadian Journal of Civil Engineering, 35(10), 1138-1151.
[21] Üneş, F., & Varçin, H. (2017). 3-D real dam reservoir model for seasonal thermal density flow. Environmental Engineering&ManagementJournal(EEMJ), 16(9).