Journal Home Page Available: https://ijeab.com/ Journal DOI: 10.22161/ijeab

Journal Home Page Available: https://ijeab.com/ Journal DOI: 10.22161/ijeab
1Environment, Natural Resources and Desertification Research Institute-Khartoum, Sudan 2,3Dresden University of Technology, Photogrammetry and Remote Sensing- Dresden, Germany 4University of Khartoum, Faculty of Forestry, Forest Products and Industries Department-Khartoum, Sudan

Received: 12 Nov 2022; Received in revised form: 08 Dec 2022; Accepted: 16 Dec 2022; Available online: 29 Dec 2022 ©2022 The Author(s). Published by Infogain Publication. This is an open access article under the CC BY license (https://creativecommons.org/licenses/by/4.0/).
Abstract Mapping land use and land cover (LULC) changes at regional scales is essential for a wide range of applications, including landslide, erosion, land planning, global warming etc. LULC alterations (based especially on human activities), negatively affect the patterns of climate, the patterns of natural hazard and socio-economic dynamics in global and local scale. However, LULC change, especially those caused by human activities, is one of the most important component environmental changes (Jensen, 2005). LULC is an important component in understanding the interactions of the human activities with the environment and thus it is necessary to be able to simulate changes. The aim of this study is to identify, evaluate and examines the spatial and temporal change detection of LULC in the study area during the time periods of 1984 to 2018 with emphasis on accuracy assessment to judge the applicability of maximum likelihood classifier (MLC) method in this case of study, and to ensure the accurate change detection. To investigate the (LULCC) changes in the semi-arid of Eastern Sudan from 1984 to 2018, the study has been done through remote sensing and (GIS) approach incorporated with field verifications for extracting information. This was done by downloading free of cloud and processing multi-spectral Landsat satellite imageries covering the study area over successive periods (1984 and 2018). The maximum likelihood classifier (MLC) method applied for mapping of LULC based on pixel-by-pixel and image differencing, which are used to enhance the change assessment. Ground truth observations are also performing to check the accuracy assessment of the classification. The methods employed in this study were, data identification and acquisition, image preprocessing and processing, validation, post classification, matrix of change, interpretation and maps change presentation. The images were classified into five thematic LULC classes which were; Dense trees and shrubs, low dense vegetation, farmland bare/grassland, moving sand and stabilized sand by means of (MLC) based on supervised classification technique with acceptable accuracy assessment Pre-classification and post-classification change detection (CD) methodologies were executed using image change detection (CD) and image differencing by matrix of change respectively. These methods gave different results in term of LULC areas, and it is generally concluding that supervised classification gave the most accurate results with the images of medium spatial resolution. The present study has brought to light that dense trees and shrubs that occupied an area about 27401.7ha (11.27%) of the study area in 1984 has increased to 46614.3ha (19.17%) in 2018. Whereas, the moving sand occupies an area about 38519.2ha (15.85%) in 1984 has increased to 43198ha (17.76%) in 2018 respectively, which are the most dominant classes in the study area. Low dense vegetation, farm, bare, grassland and stabilized sand also have experienced change. Low dense vegetation has decreases from 20.41% to 19.38%, while the farm, bare, grassland has decreases from
ISSN: 2456-1878 (Int. J. Environ. Agric. Biotech.) https://dx.doi.org/10.22161/ijeab.76.20
24.22% in 1984 to 19.75% in 2018, which represented the cultivated land, as well as decreases in stabilized sand from 26.65% in 1984 to 23.84% in 2018 respectively over the 34-year period. Maps of the LULC changes available in GIS platform can be used for enhancement of the available tools for further planning and environmental factor for future in the region.
Keywords Landsat, change detection, remote sensing, semi-arid land, Sudan.
Land is a very important asset and means to sustain livelihood. It is the key and finite resource for most human activities including agriculture, industry, forestry, energy production, settlement, recreation, and water catchments and storage. Land is a fundamental factor of production and through much of the course of human history and has been tightly linked to economic growth. It comprises biophysical qualities such as soil, topography, climate, geology, hydrology, biodiversity and political divisions. Land also defined as consisting of such socioeconomic factors as technology and management.
Land use and land cover in Sudan constrained by a large scale of People and tribal laws and the nature of economic and social activity in the region, such as grazing and agricultural activity and the coal industry and trade activity wood construction. The arable land in Sudan is constitutes aboutonethirdofthetotalareaofthecountry,howeveronly 21% of this arable land is actually cultivated. Over 40% of the total area of Sudan consists of pasture and forests. Natural pasture provides grazing land for nearly all livestock. Forests and woodlands are used to meet the population’s demand for consumption of wood products, which estimated by 16.8 million cubic meters in 1996. Moreover, Forests are exposed to continuous removal and clearance either for agricultural expansion or for fire wood consumption. (High Council for Environment and Natural Resources, 2003). Large area of cultivable lands aresituated in the region between the Blue Nile and the Atbara River in the east, and in the area between the Blue and White Niles in the center of Sudan, and in the narrow Nile valley above Khartoum and in the valleys of the plains region.
LULC are among the most important application of earth observations (EO) satellite sensor data (Giri and Wang 2012, Chowdhury et al, 2017). It provides a comprehensive and a good understanding of ecosystem monitoring and functioning, and responses to environmental factors (Muttitanon and Tripathi (2005) and Baumann et al, 2014) However, LULC change are terms often used interchangeably but the two have different meanings. Some areas are occupied by the population for their specific purposes such as agriculture, inhabitation, cattle farming is called land use (LU) and some areas are covered by natural vegetation are called land cover (LC) (Basnet and Khadka 2020). LUitsresources(Meyer1995).LContheotherhand
ISSN: 2456-1878 (Int. J. Environ. Agric. Biotech.) https://dx.doi.org/10.22161/ijeab.76.20
has also been defined as that which overlays or currently covers the ground, especially vegetation, permanent snow and ice fields, water bodies or structures (USDA Forest Service 1989).
LC describes the natural and anthropogenic features and biophysical condition that can be observed on the earth’s surface. Examples include deciduous forests, wetlands, developed/built areas, grasslands, water, concrete, etc. LU by contrast, describes activities and intention related with the land cover that take place on the land and represented the current use property. Examples include agriculture, cattle, residential homes, shopping centers, tree nurseries, state parks, reservoirs, etc. However, Land use is closely related with the land cover in many forms such as forests are used for both agriculture and animal farming as timber works.
Remote sensing (RS) is the science and to some extent, technology, and art of acquiring information about the Earth’s surface or on objects or any phenomena from a distance without actually being in contact with it (Lillesand, et al., 2010 and Jovanovićet al., 2015). RS systems, in the first place those in the satellite platforms, provide continual and consistent view of the earth making the ability of monitoring the earth’s system and human influence on the earth easier and it allows identification and classification of objects according to type and spatial distribution. Since the early days of satellite remote sensing in the 1950’s, accessibility, quality, and scope of remote sensing image data has been continuously improving, making it a rich data source with a wide range of applications. Since these early days of satellite, remote sensing the availability and quality of image data has been continuously improving. Today, the use of remote sensing techniques and data is commonplace within many disciplines in the natural and environmental sciences and widely acknowledged, which are found in many areas of society. The capacity of remote sensing to identify and monitor the earth’s surface and the natural conditions has increased dramatically in the last few years and the sensed data are going to become the crucial instrumentinnaturalresourcemanagement. Itprovideshigh resolution satellite images with a high accuracy of large areas of land periodically and at various times, which contributes to providing information to assist research and studies on environmental protection, the exploration of natural resources, urban planning, agricultural crop control
and other vital civil and military development areas. RS and GIS technologies are the best tool for researchers from different disciplines (Hoffer, 1978). RS is the main source for several kinds of thematic data critical to GIS analyses; including data of characteristics. Aerial and Landsat satellite images are frequently use to evaluate the LULC distribution and to update existing geospatial features.
In recent years, the applications of RS and GIS have been increasing greatly for the earth surface analysis. The data captured by the sensor set up at the satellite has high capacity to capture in high resolutions, so that the image obtained can give lots of information of the earth’s surface, which are far from us and out of reach.
The remote sensor acquires a response, which is based on many characteristics of the land surface, including natural or artificial cover (Anderson, et al., 1976). Many organizations provide and distribute satellite data free of charge, for example, the Global Land Cover Facility http://glcf.umiacs.umd.edu/index.shtml) and the Swedish national satellite database Saccess (http://saccess.lantmateriet.se/) offer state-of-the-art imagery via open access websites. It is a valuable source for data on vegetation composition, structure, landscape ecology, biology, and physical geography, etc.
changedetection (CD)isthe processdetachingdifference between objects and phenomena, which can be observed in different time breaks (Pathmanandukumar, 2020) It aims to select and put into practice those land uses, which will meet the need of the people by securing resources for future (Singh & Kumar 2012 and Igbal & Igbal 2018). LULC change detection based on remote sensing data is an important source of information for various decision support systems. Information derived from land use and land cover change detection is important to land conservation, sustainable development, and management of waterresources(Tewabe1 & Fentahun,2020).Furthermore, the LULC change of an area is an outcome of natural and socio-economic aspects and their operation by the human in time and space. Nowadays, the advancement of geospatial technology such as RS and GIS present the best efficient tool for analyzing quantitative evaluation and provide a baseline for monitoring the extent, impacts and trend of LULC as demonstrated by many researchers.
LULC changes are mostly influenced by increase and decrease in population growth in the system (Lambin et al., 2003), economic growth, and physical factors including topography, slope condition, soil type, and climate (Setegn et al., 2009; Yalew et al., 2016). LULC change is a matter of historical process as relating to how people use the land. It modifies the availability of different resources including vegetation, soil, and water (Ahmad, 2014). Land use land
ISSN: 2456-1878 (Int. J. Environ. Agric. Biotech.) https://dx.doi.org/10.22161/ijeab.76.20
cover change is an important issue considering global dynamics and their responses to environmental and socioeconomic drivers (Akpoti et al., 2016; Bewket, 2002; Hurni et al., 2005). Land use land cover alterations, negatively affect the patterns of climate, natural hazards and socioeconomic dynamics on a global and local scale (Chakilu & Moges, 2017; Hegazy & Kaloop, 2015; Sewnet, 2015; Tewabe1& Fentahun, 2020).
LULC changes play a major role in the study of global change where LULC and human and natural modifications have largely resulted in deforestation, biodiversity loss, global warming and increase of natural disaster desertification and flooding (Mas et al, 2004 and Dwivedi, et al 2005). The growing population and increasing socioeconomic necessities create a pressure on LULC. This pressure results in unplanned and uncontrolled changes in LULC (Seto et al, 2002) The LULC alterations are generally caused by mismanagement of agricultural, urban, range and forestlands, which lead to severe environmental problems such as landslides, floods etc. The main reason behind the LULC changes includes rapid population growth, rural-to-urban migration, reclassification of rural areas as urban areas, lack of valuation of ecological services, poverty, ignorance of biophysical limitations, and use of ecologically incompatible technologies
Rapid expansions of a human activity are becoming serious issues and challenges for land cover conditions (Zaidi et al., 2017) Its direct impact is felt on the environmental and ecological system of the nature. Therefore, the study of the change scenario on land use and land cover is important work. It is not possible in a short year. Study based on decadal time series givesrealistic information on thechange conditions in a large area rather than a small land use and land cover. Moreover, remote sensing generally enables direct measurements of the earth’s surface and the spatial distribution of its physical objects. Social science is generally more concerned with why things happen than where they happen (Turner, 1998). Determining the effects of land use change on the Earth system especially depends on the understanding of past land use practices, present land use patterns, and prediction of future land use, as affected by human institutions, population size and distribution, economic development, technology, and other factors. Past and present studies conducted by organizations and institutions around the world, mostly has concentrated on the application of LULC changes (Reis, 2008).
RS and GIS are powerful and cost-effective tools for assessing the spatial and temporal change of LULC (Herold et al., 2003; Serra et al., 2008). Nowadays, remote sensing data are applicable and valuable for land use and cover change detection studies (Yuan et al., 2005). Remote
sensing data is the most common source and important benefits of the satellite for observing the earth is certainly the change classification and monitoring for detection, quantification, and mapping of LULC patterns due to its repetitive data acquisition, suitable for processing, and accurate geo- referencing (Chen et al., 2005; Jensen, 1996).
Remote sensing satellite imagery has given scientists a remarkableway todetermine the reasons for LULC changes and the resultant consequences due to human activity (Cardille, Foley, 2003). In the last few years, numerous government agencies all around the world have used the satellite remote sensing to monitor and quantify the changes.
However, in Sudan the increase of population growth rate, led to increase for food crop production with agriculture playingaprominentroleinlivelihoodsecurity.Theincrease use of irrigation and mechanization has brought an increase in demand for agricultural land use, which, lead to the conversion of other land use types, and vegetation for agricultural land use. This has effect and impact on the vegetation and environment of the country highly exposed to the incidence of environmental, social hazards and disasters including drought and desertification, floods, loss of biodiversity, ethnic conflicts and poverty (Elhaja et al, 2017).
The importance of change detection is to determine which LULC class is changing to the other. The most commonly LULC change detection methods include image overlay, classification comparisons of LULC statistics, change vector analysis, principal component analysis, image rationing and the differencing of normalized difference vegetation index (NDVI) (Han et al., 2009). Moreover, Methods of change detection can be classified into three categories: characteristic analysis of spectral type, vector analysis of spectral changes and time series analysis (Shaoqing, Lu, 2008,Jovanović, et al.,2011).Characteristic analysis of spectral type is change detection based on spectral classification and calculations. The vector analysis is done by using strength and direction characteristics, and time series analysis is used to analyze process and trend of changes of monitored ground objects, based on continuously remotely sensed data.
There are two basic ways of change detection: first by direct overlapping of classified vector classes from both images and then visually analyzing the changes and second by direct change detection of one image made of combined images from different epochs (Jovanović, et al., 2011 and Abualgasim, et al., 2017).
The primary purpose of using remote sensing- based change detection is to monitor land cover change very effectively and efficiently. Change detection is the process
ISSN: 2456-1878 (Int. J. Environ. Agric. Biotech.) https://dx.doi.org/10.22161/ijeab.76.20
of detecting and identifying differences in the state of an objects or phenomenon by observing it at different time intervals (Singh, 1989). Remote sensing-based change detection applies comparison of a set of temporal images covering the period of interest using specific change detection algorithms (Yismaw et al, 2014). LULC change analysis using remote sensing techniques gives an opportunity to obtain results with low costs, less time consumption and good accuracy, and GIS allow updating resultswhenevernewdataisavailable (Jovanovic,2015 and Juliev et al, 2018) However, nowadays-remotesensing data are applicable and valuable for land use and cover change detection studies (Yuan et al., 2005).
There are several methods for mapping land cover changes using remotely sensed data, conventional MLC (Langford, Bell, 1997), post-classification, image differencing, and principal components change-detection techniques (Macleod,Congalton, 1998), imagedifferencing,vegetative index differencing, post-classification change differencing, multi-date unsupervised classification (Mas, 1999). Determination of the changes which occurs on the Earth in the context of the digital image processing require different procedures and techniques, some of which are standardized, while many other depend on the applications in which the image processing is being done. In order to compare one image to another it is necessary to compare the pixel of one image to the pixel of another. What is necessary to know before the detection process itself is the value of the change phenomenon, which is very important, i.e. it is necessary to conduct the filtration of the certain changes. This can vary from one user to another, and from the purpose of change detection. Assessment of the trends of LULC dynamics usingRSandindicatorssuchasanthropogenicactivitiesand the socio-demographic information is essential in order to make proper planning for sustainable management
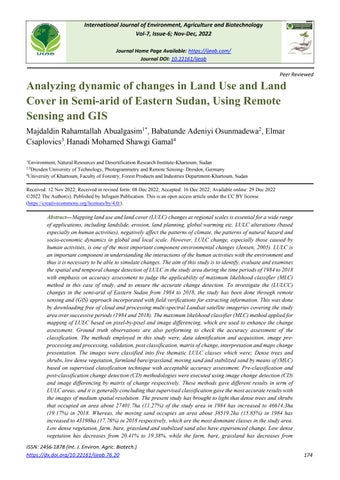
Gash agricultural scheme (GAS) (figure1) is considered the first scheme in Kassala state, eastern Sudan,was established in 1926 as a key anchor for the livelihood for the people of the Gash area to contribute to the rural development particularly towards local population around the Gash River area and population settlement in eastern Sudan. The scheme is located between latitudes 15.3 and 16.3 north and longitude 35.5 and 36.3 east, in the semi-desert region, irrigated by the Gash River, with a total area of approximately 900,000 acres, including 750,000 acres covered by the current irrigation system as shown in figure1. Using cultivation in three years cycle (rotations system) 250.000 acres are cultivated each season. This area may increase or decrease depending on the river flooding,
the report of preparations for the season of irrigation operations and the status of cleaning of mesquite trees and weeds. Some forests, villages and other settlements inside the scheme cover the remaining areas. However, thescheme was constructs for poverty reduction by cash economy improvement through cotton and castor cultivation as cash crops, as well as Sorghum as the main staple and cash crop (Anderson, 2011). The area is characterized by semi-arid climatic conditions with rainfall ranges between 50-200 mm. semi-arid ecosystems with a single rainy season there is usually a short growth period followed by a long dry season with a great reduction for material (Hinderson,
2004). The area endures intensive land-use pressures, which make it highly sensitive to climate fluctuations. Various practices in this region, such as changes in fire regimes; removal of vegetation and over-grazing have been linked to many recognized causes of land degradation (Hielkema et al., 1986; IFAD, 2004). In the last decade, the scheme has undergone serious deterioration, further drought spells have led to increased pressure on meager resources, in addition to invasion of unfavorable Mesquite trees. These factors lead to acceleration of the degradation process in the study area.
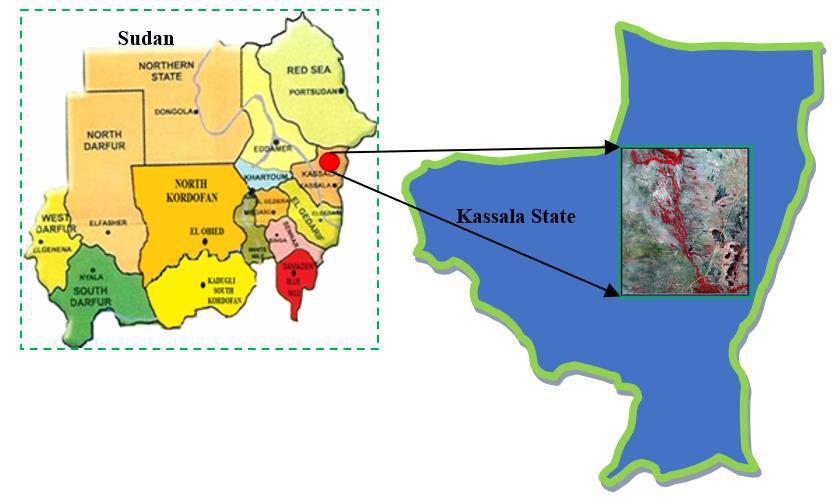
Inthisstudy,differentmethodsofanalyzingsatelliteimages are presented, with the aim to identify changes in LULC in a certain period of time (1984 - 2018). The area observed in this study is the region of (GAS) with its surroundings (approximately 2055 km² is the total area of the image subset). The methods represented in this study are image acquisition, image pre-processing (geo-referencing, image corrections, sub-setting, and enhancements), unsupervised classification, supervised classification and post classification (change detection) as shown in figure 2
The study integrate data from different sources and used different methods and approaches to analyze the long term of LULC changes and trends during the previous four decades in Gash Agricultural Scheme (GAS) area. The studyused imageriesfromdifferentsatellites ofLandsatand different dates (Landsat 1984 and Landsat 2017) acquired in dry season, were acquired in Path and row 171/49 downloaded from United States Geological Survey (USGS) website as shown in table 1 Therefore, to understanding the strengths and weaknesses of different types of sensor data is essential for the selection of suitable remotely sensed data
ISSN: 2456-1878 (Int. J. Environ. Agric. Biotech.) https://dx.doi.org/10.22161/ijeab.76.20
for image classification (Gomez et al., 2016; Lu & Weng, 2007).
Table (1) lists the source and characteristics of each image including year of capture and spatial resolution (m). The imageries were geo-referenced and radiometrically corrected by using ENVI FLAASH software. Anniversary data acquisition dates were maintained in order to avoid biases that are due to the seasonality, this is essential for CD analysis.
Downloading Landsat images of the required years for the study area, random control points, Erdas imagine 10, ENVI 7 and GIS 11 software, Google earth images for further had used in the LULC classification. The imagery data files had downloaded in zipped files from USGS website and extracted to Tiff format files. The imagery is acquired during the dry season in order to avoid the haze and the distortion seasonality. The imagery then converted todigital image format using Arc-GIS and Erdas imagine software in the pre-processing procedure. To perform image classification, the raw data must be pre-processed and
prepared properly so that error due to the geometry of the earth, radiometric and atmospheric effects could be accounted. The general procedure in the pre-processing stage has included the detection and restoration of bad lines, geometric rectification or image registration, radiometric calibration, atmospheric correction, and topographic correction
In this study, the pre-processing included radiometric, atmospheric and geometric corrections of the satellite images in order to remove the systematical mistakes of the sensing devices. Radiometric correction comprised the process of histogram matching of the satellite images from different times, whereas geometric correction meant coregistration of the satellite images, so that the images could overlap in the best possible way to view. This is important because some of the essential methods are based on the
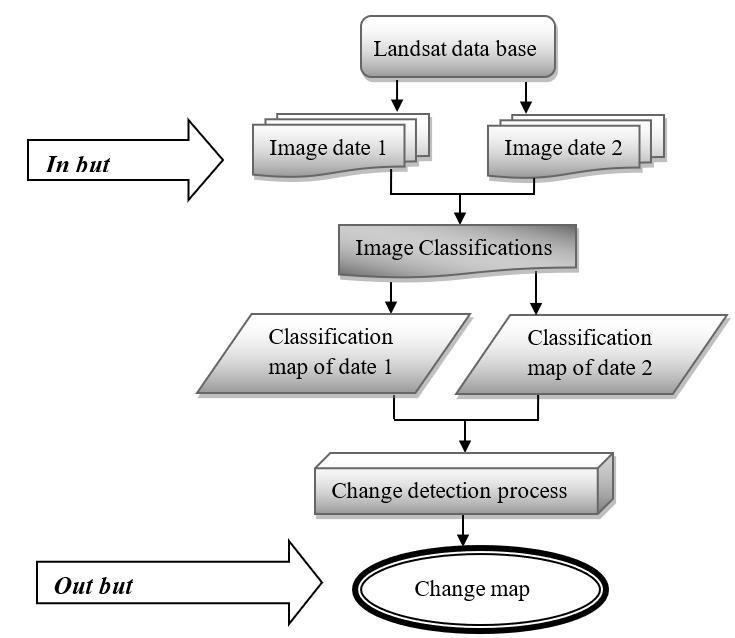
comparison of the two images from different times, e.g. supervised classification. Dark Object Subtraction (DOS) correction used to correct the satellite imagery for atmospheric effects because it is a common simple model, and relies only on scene-derived parameters using thresholds andhistograms of image data for implementation (Chavez 1996). The basic assumption is that within the image, at least some pixels should have zero reflectance and any non-zero radiance received at the satellite for these least-value pixels is due to atmospheric scattering (Chavez 1996). In remote sensing studies, representative ground truth data is a pre-requisite to associate this reflectance property to the object and the train classifiers and facilitate accurate automatic classification (Muzein, 2006). Investigate the trend changes in each LULC type, the entire image has classified by supervised classification method using (MLC algorithm) environment.
RS is one of the tools which is very important for the production of LULC change maps through a process called image classification. For the image classification process to be successfully, several factors should be considered including availability of quality Landsat imagery and secondary data, a precise classification process and user’s experiences and expertise of the procedures.
Image classification of six reflective bands of the Landsat images was carried out by using MLC method with the aid
of ground truth data obtained from aerial images dated 1984 and 2018 as shown in figure 2. The second part focused on LULC change by using change detection comparison (pixel by pixel) and matrix of change
In this study, for change detection, classification comparisonsofLULCstatisticshad used.Theareascovered by each land cover type for the various periods had compared. Then the directions of the changes (positive or negative) in each land cover type had determined.
ISSN: 2456-1878 (Int. J. Environ. Agric. Biotech.) https://dx.doi.org/10.22161/ijeab.76.20
Satellite type Acquisition date Spectral bands Resolution Source
Landsat 1984 4 bands 5 7 m
United States Geological Survey (USGS)
Landsat 2018 7 bands 15 m United States Geological Survey (USGS)
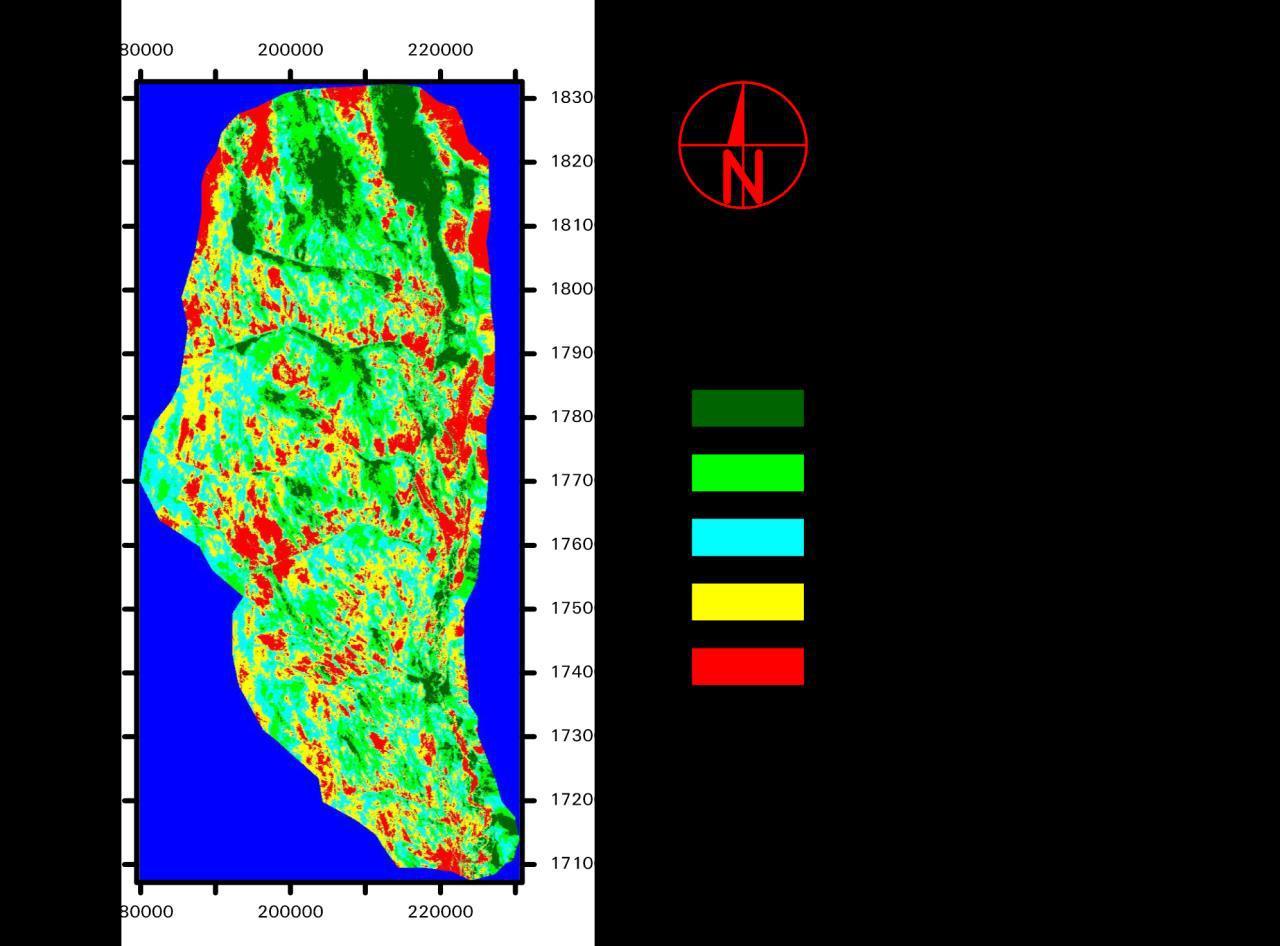
The main purpose of this study is to detect, analysis, and assess the dynamic of changes in LULC in semi-arid land of eastern Sudan. Landsat images for 1984 and 2018 a 34year period were processed and the particular years analyzedforlanduse and landcover changes were 1984and 2018. The study area was classified into five land use and land cover classes namely; Dense trees and shrubs, Low dense vegetation, Farmland bare/grassland, Moving sand and Stabilized sand as illustrated in Table (2).
2
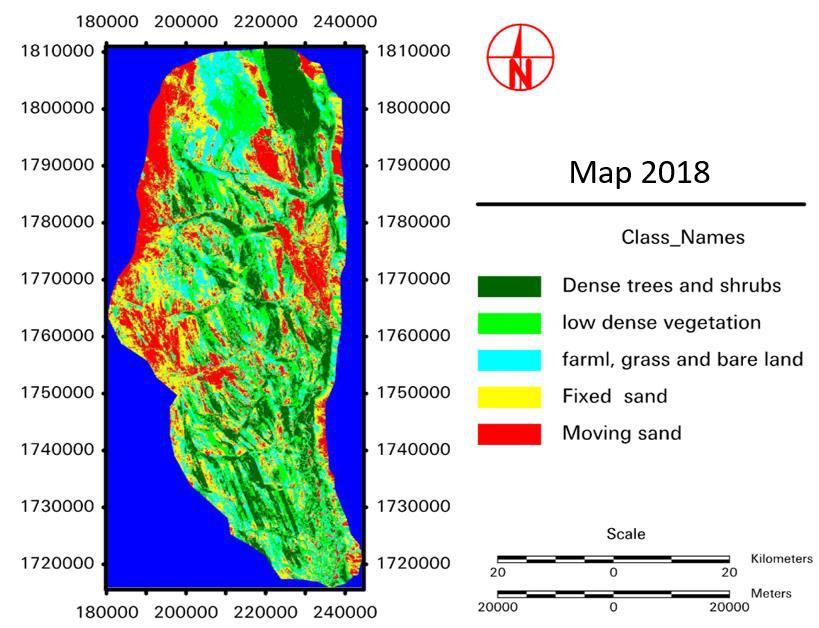
The spatial distributions of LULC classes illustrated in Figures 3 and 4. The cover area and percentage that each LULC classes are show in Table 2. Figures 3 and 4 shows the percentages of each class cover in the study area. According to the results obtained from the classified images dated 1984 and 2018, the results observed that the distribution of dense trees and shrubs covered an area of 27401.7ha (11.27%) in 1984 and 46614.3ha (19 17%) in 2018. Whereas, the moving sand occupies an area from 38519.2ha (15.85%) to 43198ha (17.76%) of the total area in 1984 and 2018respectively,which are the most dominant classes in the study area, they extremely affect the agricultural and residential areas as well as threaten the Gash River course during the wet and dry seasons together According to the analysis of the LULC changes the results revealed that, the dense trees and shrubs as well as moving sand areas and their effects on the farm and cultivated areas over time are the focal point of attention in the study area. The visual comparison between the Landsat imageries 1984 and 2018 shows that there has been a significant change in LULC classes over the years with transformation occurring fromoneclasstoanother. Theresultsrevealedthat;adrastic change occurred during the period of study, showing rapid increase of (dense trees and shrubs) which represented an invasion of invasive species (Mesquite trees) from 11.27% to 19.17%, mobile sand (moving sand) from 15.85% to 17.76%. While the farm, bare, grassland decreases from 24.22% to 19.75%, which represented the cultivated land. Decreases in stabilized sand from 26.65% to 23.84% was also observed during the study period.
ISSN: 2456-1878 (Int. J. Environ. Agric. Biotech.) https://dx.doi.org/10.22161/ijeab.76.20
The result obtained from this study (that is; increase in dense trees “forest cover”) is in-line with that of Askar et al., 2019 where increase in forest cover was observed in the study area over the period of sixteen years as a resultant effect of successional recovery after forest fire (Askar et al., 2019). The study by Juliev et al., 2019 also revealed increase in forest area of about 5.7% over the 28 years of study in Bostanlik District, Uzbekistan because of reforestation project within the study period. Similarly, the study by Gozdowski et al., 2020 revealed an increase in forested area over the 34 years studied period in Lithuania, though the type of forest species is not mentioned in their studies. The result of our study also observed that the increase of invasive species (mesquite trees) is as a result of miss-use of irrigation water and management. The results also, observed that there is increase of sand area and invasion of mesquite trees at the expense of cultivated land (clay soil), this means a decreased in cultivated land, which leads to decrease the productivity over time The results observed also the class of farm, bare, grassland area has been greatly converting either to the dense trees and shrubs class or to moving sand class over the period of the study
Dense trees and shrubs areas have increased from 27401.7 ha in 1984 to 46614.3 ha in 2018 from the total area of the study Table (2). Moreover, in table (2) the results, also shows that the three classes ((low dense vegetation), (Farm, bare, grassland) and (stabilized sand)) respectively were decreased from an areas of ((49627.2 ha in 1984 to 47127.3 ha in 2018), (62756.4 ha in 1984 to 48024.1 ha in 2018) and (64798.4 ha in 1984 to 57957 ha in 2018)) respectively, which is due to an expansion of mesquite trees colonies areas or due to encouragement of sand moving towards the cultivated land in the study area during the period of the study
The results observed that, during the classification of Landsat images data, the residential areas it does not appear in the class’s classification program and it was impossible to detect the small residential places because the people were builds their houses from the trees products (branches) and the local materials. Therefore, it is too difficult to distinguish between the houses and the vegetation cover in the study area during the period of the study
To compare the land cover percentage during the period of 34 years from 1984 to 2018, Figure 3 was generated and showed that from 1984 to 2018 there were increments in percentage cover of the dense trees and shrubs and moving sand classifications while low dense vegetation, Farm, bare,
ISSN: 2456-1878 (Int. J. Environ. Agric. Biotech.) https://dx.doi.org/10.22161/ijeab.76.20
grassland,andstabilizedsand wentdown.Theclassification that showed a big percentage cover change was the dense trees and shrubs which increased by slightly over 170% followed by moving sand with about 112%. Low dense vegetation decreased by about 96% from 1984 to 2018
while Farm, bare, grassland and stabilized sand also went down by about 76% and 89% respectively within the same time as shown in figure 5.
Increase in moving sand at the expense of other land cover were observed within the study period, which is an indication of desert encroachment as revealed by the study
of Kempf 2021 where extensive expansion of sand land was observed in his study in northern China and Mongolia. Other study such as that of Zang et al., 2020, Turk and Aljughaiman, 2020 linked expansion of bare surface to desertification which has consequential effect on endemic species and biodiversity.
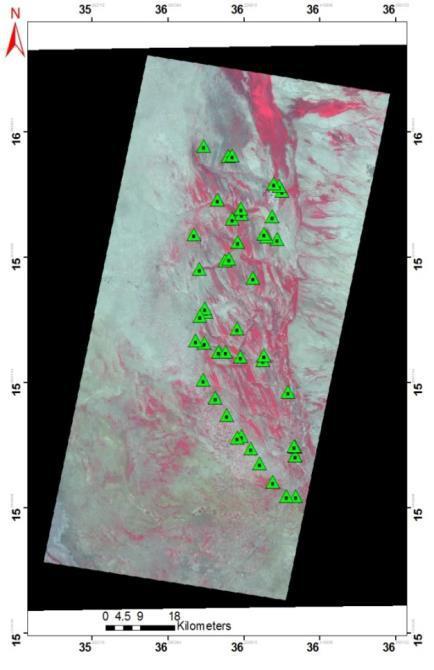
Fig. 4: Classification of LULC based on MLC for image 2018 (Gash Agricultural Scheme)
Change in the global environment affected by various changes in land use and land cover (Qian et al. 2007) Urbanization, population growth, land scarcity and expansion of agricultural land are among the many drivers of LULC change in the world. Therefore, the use of remotely sensed data and applying the analysis techniques provide accurate, timely and detailed information for detecting and monitoring changes in land cover and land use.
In this study, there were five categories of classifications: Dense trees and shrubs, low dense vegetation, farmland bare/grassland, moving sand and stabilized sand. The dense trees and shrubs had a difference in percentage cover of about 8% from 1984 to 2018, while the low dense vegetation had a negative difference in percentage cover -
1.03% over the same period. The farmland bare/grassland had a negative percentage cover difference of -6.06% as well as stabilized sand (fixed)had also a negative difference in percentage cover- 2.81% as an indication of decrease, while on the other hand moving sand had a positive increased by about 2% in 2018 as illustrated in figure 5 Masek et al., 2000) reported that, land use and land cover changesrespondtoforces,whicharelargelyassociatedwith the high human population such as socioeconomic, political, cultural, demographic and environmental. With the current increase in population, the current rates, extents and intensities of LULCC may also increase and as a result, land resources in Kenya will be strained given that approximately 75% of the population engages in agriculture but only 20% of its land is arable.
ISSN: 2456-1878 (Int. J. Environ. Agric. Biotech.)
https://dx.doi.org/10.22161/ijeab.76.20
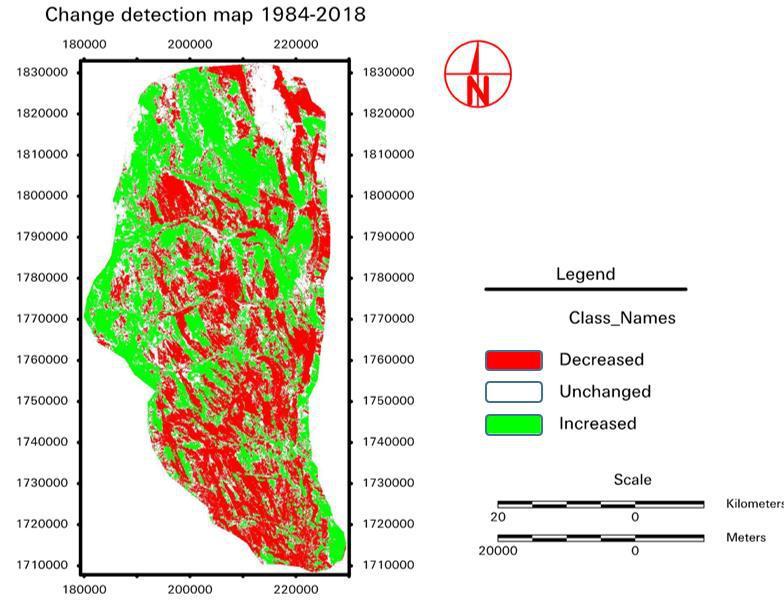
Fig 5: Change detection between 1984 and 2018
The 1984-2018, a 34-year period saw a change in the land use in the area with the following classifications increasing: dense trees and shrubs from 11.27% to 19.17%, and moving sand from 15.85% to 17.76%. The classifications that realized a reduction were: low dense vegetation from 20.41% to 19.38%, Farm, bare, grassland from 25.81% to 19.75% and stabilized sand from 26.65% to 23.84%. Therefore, land use and land cover were detected in the area over the 34-year period under review.
The use of satellite imageries and other data sources manipulated and integrated a GIS environment provides an essential valuable information base from which the cause and future environmental change can extracted.
Monitoring the trends to which ecosystem is changing by the use of indicators such as LULC and socio-demographic information will be essential in order to make proper planning for sustainable ecosystem management.
Application of spectral land sat satellite imageries of remote sensing data offered an effective opportunity for changes detection and mapping of LULC in the eastern Sudan as well as in semi-arid lands at a relatively low-cost.
ISSN: 2456-1878 (Int. J. Environ. Agric. Biotech.) https://dx.doi.org/10.22161/ijeab.76.20
Based on the above-mentioned findings, the study recommends in the future need for more studies to evaluate, monitor and mapping the LU/LC dynamics to understand the interaction between the land cover, climate derivers and the human activities in semi-arid region using remote sensing techniques and GIS as an effective, accurate and low-cost techniques. The outcome of this type of studies represents valuable resources for decision makers to guard the environmental changes, and for future development projects in Sudan.
[1] Jensen J.R. Introductory Digital Image Processing. A remote Sensing Perspective. Pearson Education, Inc, New Jersey, 2005.
[2] HCENR Sudan’s First National Communication under United Nations Framework Convention on Climate Change (UNFCCC), Khartoum, Sudan, 2003.
[3] Giri C., Wang Y. Remote Sensing of Land Use and Land Cover;Giri,C.,Ed.;CRCPress:BocaRaton,FL,USA, 2012.
[4] Chowdhury S., Chao D.K., Shipman T.C., Wulder M.A. Utilization of Landsat data to quantify land-use and landcover changes related to oil and gas activities in West-Central Alberta from 2005 to 2013. GISci. Remote Sens., 54, 700–720. 2017.
[5] Muttitanon W., Tripathi N. K. Land use/land cover changes in the coastal zone of Ban Don Bay, Thailand using Landsat
5 TM data. International Journal of Remote Sensing,26 (11),2311-2323, 2005 DOI: 10.1080/0143116051233132666
[6] Baumann M., Ozdogan M., Wolter PT., Krylov A., Vladimirova N., Radeloff VC. Landsat remote sensing of forest windfall dis-turbance. Remote Sens Environ, 143,171–179,2014 https://doi.org/10.1016/j.rse.2013.12.020
[7] Basnet A., Khadka D.B. FATE OF AGRICULTURAL LAND OF TRIYUGA MUNICIPALITY OFNEPAL:LULC STUDYUSING LANDSAT IMAGERY ON ERDAS 2014. Global Scientific Journal (GSJ), Vol. 8,(11),2020. Online: ISSN 2320-9186. www.globalscientificjournal.com.
[8] Meyer W. B. Past and Present Land-use and Land-cover in the U.S.A. Consequences. P,24-33,1995.
[9] USDA Forest Service. RPA Assessment of the Forest and Rangeland Situation, Forest Resource Report 26. Washington, D.C, 1989.
[10] Lillesand T., Kiefer R., Chipman J. Remote sensing and image interpretation Wiley, New York, 7th edition, 2015.
[11] Jovanović D., Govedarica M., Filip S. F., Bugarinović Z., Novović O., TeoBeker T., Lauter M. Land Cover change detection by using Remote Sensing: A Case Study of Zlatibor (Serbia). Geographica Pannonica, V. 19 (4), Pp.162-173, 2015.
[12] Hoffer R.M.” Biological and Physical consideration in applying computer aided analysis technique to remote sensor data. In Remote Sensing: a quantitative approach” edited by P.H. Swam et .el, McGraw-Hill, 1978.
[13] Anderson J. R., Hardy E. E., Roach J. T., Witmer R. E. A Land Use and Land Cover Classification System for use with Remote Sensor Data. Geological Survey Professional Paper No. 964, U.S. Government Printing Office, Washington, D.C, 1976.
[14] Pathmanandukumar V. A study of Land use Change Detection in Oddusuddan DS Division of Mullaitivu District inSeriLankaBasedonGISand RSTechnology,World News of Natural Science Journal, Vol. 29(3),Pp.198-211,2020.
[15] Singh R.B., Kumar D. “Remote Sensing and GIS for Land use and Land cover mapping and integrated land management: Case for the middle Ganga Plain”. Journal of Font. Earth Sci.: (Springer), Vol. 6(2),2012.
[16] Igbal M.Z., Igbal M.J. Land use detection using Remote Sensing and GIS: (A case study of Rawal Pindi Division). American Journal of Remote Sensing, Vol. 6(1),Pp39-51, 2018.
[17] Tewabe D., Fentahun T. Assessing land use and land cover change detection using remote sensing in the Lake Tana Basin, Northwest Ethiopia, Cogent Environmental Science, 6,1,1778998,2020. DOI: 10.1080/23311843.2020.1778998.
[18] Lambin E. F., Geist H. J., Lepers E. Dynamics of land-use and land-cover change in tropical regions. Annual Review of Environment and Resources, 28, 205–241, 2003 https://doi.org/10.1146/annurev.energy
[19] Setegn S. G., Srinivasan R., Dargahi B., & Melesse A. M. Spatial delineation of soil erosion vulnerability in the Lake Tana Basin, Ethiopia. Hydrological Processes: An International Journal, 23, 3738–3750, 2009 https://doi.org/10.1002/hyp.7476
ISSN: 2456-1878 (Int. J. Environ. Agric. Biotech.) https://dx.doi.org/10.22161/ijeab.76.20
[20] Yalew S. G., Mul M. L., Van Griensven A., Teferi E., Priess J., Schweitzer C., Van Der Zaag P. Land-use change modelling in the Upper Blue NileBasin. Environments, 3(4), 21,2016. https://doi.org/10. 3390/environments3030021.
[21] Ahmad S. Land use change detection using remote sensing and artificial neural network. Application to Birjand, Iran. Computational Ecology and Software, 4, 276, 2014. http://www.iaees.org/publications/journals/ces/onlineversion .asp
[22] Akpoti K., Antwi E. O., Kabo-Bah A. T. Impacts of rainfall variability, land use and land cover change on stream flow of the Black Volta Basin, West Africa. Hydrology, 3(3),26, 2016. https://doi.org/10.3390/ hydrology 3030026.
[23] BewketW. Land coverdynamicssincethe1950sin Chemoga watershed, Blue Nile basin, Ethiopia. Mountain Research and Development, 22(3), 263–269, 2002 https://doi.org/10.1659/0276-4741
[24] Hurni H., Tato K., Zeleke G. The implications of changes in population, land use, and land management for surface runoff in the upper Nile basin area of Ethiopia. Mountain Research and Development, 25 (2), 147–154, 2005 https://doi.org/10.1659/0276-4741
[25] ChakiluG.,MogesM.Assessingthelanduse/coverdynamics and its impact on the low flow of Gumara Watershed, Upper Blue Nile Basin, Ethiopia. Hydrol Current Res, 7,2,2017 doi: 10.4172/2157-7587.1000268.
[26] Hegazy I. R., Kaloop M. R. Monitoring urban growth and land use change detection with GIS and remote sensing techniques in Daqahlia governorate Egypt. International Journal of Sustainable Built Environment, 4(1), 117–124, 2015 https://doi.org/10.1016/j.ijsbe.2015.02.005
[27] Sewnet A. Land use/cover change at in fraz Watershed, Northwestern Ethiopia. Journal of Landscape Ecology,8(1), 69–83,2015. https://doi.org/10. 1515/jlecol-2015-0005.
[28] Mas J.F., Velazquez A., Gallegos J.R.D., Saucedo R.M., Alcantare C., Bocco G., Castro R., Fernandez T., Vega A.P. Assessing land use/cover changes: a nationwide multidate spatial database for Mexico. International Journal of Applied Earth Observation and Geoinformation, 5,249-261.2004.
[29] Dwivedi R.S., Sreenivas K., Ramana K.V. Land-use/landcover change analysis in part of Ethiopia using Landsat Thematic Mapper data. International Journal of Remote Sensing, 26(7),1285-1287,2005.
[30] Seto K.C., Woodcock C.E., Song C., Huang X., Lu J., Kaufmann R.K. Monitoring land use change in the Pearl River Delta using Landsat TM. International Journal of Remote Sensing, 23,(10),1985-2004,2002.
[31] 31-ZAIDI S.M., AKBARI A., SAMAH A.A., KONG N.S., GISEN J. I. A. Landsat-5 Time Series Analysis for Land Use/Land Cover Change Detection Using NDVI and SemiSupervised Classification Techniques.Pol. J. Environ. Stud. Vol. 26, No. 6 (2017), 2833-2840. DOI: 10.15244/pjoes/68878.
[32] TurnerB.L. II.FrontiersofExploration:RemoteSensing and Social Science Research, Pecora 13 Symposium, Humannteaction with the Environment: Perspectives from Space, (August 20-22, 1996, Souix Falls, SD), pp.15-19, 1998
[33] Reis S. Analyzing Land Use/Land Cover Changes Using Remote Sensing and GIS in Rize, North-East Turkey. Sensors, 8,6188-6202,2008. DOI. 10.3390/s8106188, ISSN 1424-8220. www.mdpi.org/sensors.
[34] Herold M., Goldstein, N.C. and Clarke, K.C. The spatiotemporal form of urban growth: measurement, analysis and modeling. J. Remote Sensing of Environ, 86,286-302, 2003.
[35] Serra P., Pons, X, and Sauri, D. Land-cover and land-use change in a Mediterranean landscape: a spatial analysis of driving forces integrating biophysical and human factors. Applied Geograph 28(3),189-209,2008.
[36] Yuan F., Sawaya K. E., Loeffelholz B. C., Bauer M. E. Land cover classification and change analysis of the Twin Cities (Minnesota) Metropolitan Area by multitemporal Landsat remote sensing. Remote Sensing of Environment, 98(2–3), 317–328,2005. https://doi.org/10.1016/j.rse.2005.08.006
[37] Chen X., Vierling, L., Deering, D. A simple and effective radiometric correction method to improve landscape change detection across sensors and across time. Remote Sensing of Environment, 98(1), 63–79, 2005 https://doi.org/10.1016/j.rse.2005.05.021
[38] Jensen J. R. Introductory digital image processing: A remote sensing perspective. New Jersey, USA, Prentice-Hall Inc, 401, 1996
[39] Cardille F. J. A. Agricultural land-use change in Brazilian Amazonia between 1980 and 1995: evidence from integrated satellite and censusdata. RemoteSensing ofEnvironment 87, 4,551-562.2003.
[40] Elhaja M, E., Csaplovics E., Abdelkareem O, A, A., Adam H, E., Khalifa A, S,O., Ibrahim K, A., Eltahir M, E, S. Land Use Land Cover Changes Detection in WhiteNile State, Sudan Using Remote Sensing and GISTechniques, International Journal of Environmental Monitoring and Protection, 4(3), 14-19, 2017 http://www.openscienceonline.com/journal/ijemp
[41] Han J., Hayashi Y., Cao X., Imura H. Evaluating land-use change in rapidly urbanizing China: Case study of Shanghai. Journal of Urban Planning and Development, 135(4),166–171, 2009. https://doi.org/10.1061/(ASCE)07339488(2009)135:4(166).
[42] ShaoqingZ.,LuX.TheComparativeStudyofThreeMethods of Remote Sensing Image Change Detection. School of Resource and Environment Science, Wuhan University, 129 Luoyu Road, Wuhan, China, 430079,2008.
[43] Jovanović D., Govedarica M., Badnjarević M. Presenting and Comparing the Object Based Image Analysis and Standard Image Analysis for Change Detection of Forest Areas, Using Low-Resolution Satellite Imagery. SGEM, 2(11),329-336, 2011.
[44] Abualgasim M.R. Mapping and Assessing Impacts of Land Use and Land Cover Change by Means of an Advanced Remote Sensing Approach: A case Study of Gash Agricultural Scheme, Eastern Sudan. Ph.d published thesis 2016, Dresden University of Technology, Institute of Photogrammetry and Remote Sensing, Dresden, Germany, 2017
[45] Singh A. Digital change detection techniques using remotely sensed data. International Journal of Remote Sensing, Vol. (10),Pp.989-1003,1989.
[46] Yismaw A., Gedif B., Addisu S., Zewudu F. Forest Cover Change Detection using Remoe Sensing and GIS in Banja District, Amhara Region, Ethiopia. International Journal of Environmental Monitoring and Analysis, 2(6,354),2014.
[47] 47-JULIEV M., PULATOV A., FUCHS S., HUBL J. Analysis of Land Use and Land Cover Change Detection of Bostanlik District, Uzbekistan. Pol. J. Environ. Stud. Vol. 28, No.5,3235-3242,2019. DOI: 10.15244/pjoes/94216.
[48] 48- Langford M., and Bell W. Land cover mapping in a tropical hillsides environment: a case study in the Cauca regionofColombia,InternationalJournalofRemoteSensing, 18(6),1289-1306,1997.
[49] 49- MACLEOD R. D., and CONGALTON R. G. A quantitative comparison of change-detection algorithms for monitoring eelgrass from remotely sensed data. Photogrammetric Engineering and Remote Sensing, 64,207–216,1998.
[50] 50- MAS J. F. monitoring land-cover changes: a comparison of change detection techniques. International Journal of Remote Sensing, 20,139–152,1999.
[51] 51- Anderson I.M. Technical paper on Main findings and Recommendations. The Eastern Sudan Rehabilitation and Development Fund, (2011).
[52] Description (From Volume 1 of Appraisal Report 1462-SD), 2004.
[53] Hinderson T. Analysing environmental change in semi-arid areas in Kordofan, Sudan. Seminar series no 109, Geobiosphere Science Centre, Lund University. pp 58, 2004.
[54] Hielkema J.U., Prince S.D., Astle W.L. Rainfall and vegetation monitoring in the savannah zone of the democratic-republic of Sudan using the NOAA advanced very high-resolution radiometer. International Journal of Remote Sensing 7,1499–1513,1986
[55] IFAD, the International Fund for Agricultural Development near East and North Africa Division Project Management Department, REPUBLIC OF THE SUDAN GASH SUSTAINABLE LIVELIHOODS REGENERATION PROJECT Target Group and Project Description (From Volume 1 of Appraisal Report 1462-SD), 2004.
[56] Gomez C., White J. C., Wulder M. A. Optical remotely sensed time series data for land cover classification: A review. ISPRS Journal of Photogrammetry and Remote Sensing, 116, 55–72, 2016. https://doi.org/10.1016/j.isprsjprs.2016.03.008
[57] Lu D.,WengQ.Asurveyofimageclassification methodsand techniques for improving classification performance. International Journal of Remote Sensing, 28(5),823–870, 2007. https://doi.org/10.1080/ 01431160600746456.
[58] Chavez P.S. Image-based atmospheric corrections-revisited and improved. Photogrammetric Engineering and Remote Sensing 62(9),1025-1036,1996.
[59] Muzein B. S. Remote sensing & GIS for land cover, land use change detection and analysis in the semi- natural ecosystems and agriculture landscapes of the central Ethiopian Rift Valley. 2006
ISSN: 2456-1878 (Int. J. Environ. Agric. Biotech.) https://dx.doi.org/10.22161/ijeab.76.20
[60] ASKAR A., NUTHAMMACHOT N., SAYEKTININGSIH. T., HERMUDANANTO. Assessing Land cover Changes and CO2Emmisions in Tropical Forests, 1998-2016: A Case Study of the Sungai Wain Protection Forest. Pol. J. Environ. Stud. Vol. 28, No. 5 2019, 3597-3604. DOI: 10.15244/pjoes/94845.
[61] GOZDOWSKI D., ŽUKOVSKIS J., KAZIUKONYTĖ K., RAZINKOVAS-BAZIUKAS A. Evaluation of Land Cover Changes in Southwestern Lithuania from 1984 to 2018 Using MediumSpatialResolutionSatelliteImagery.Pol. J.Environ. Stud. Vol. 29, No. 6 2020, 4041-4051. DOI: 10.15244/pjoes/118745.
[62] KEMPF M.Monitoring landcover change and desertification processes in northern China and Mongolia using historical written sources and vegetation indices, Clim. Past Discuss. [preprint], https://doi.org/10.5194/cp-2021-5, 2021
[63] ZHANG R., ZHAO X., ZHANG C., LI J. Impact of Rapid and Intensive Land Use/Land Cover Change on Soil Properties in Arid Regions: A Case Study of Lanzhou New Area, China. Sustainability 2020, 12, 9226. DOI:10.3390/su12219226.
[64] TURK K G B., ALJUGHAIMAN A S. Land use/land cover assessment as related to soil and irrigation water salinity over an oasis in arid environment. Open Geosciences 2020; 12: 220–231. https://doi.org/10.1515/geo-2020-0103.
[65] Qian J., Zhou Q., Hou Q. Comparison of pixel-based and object oriented classification methods for extracting built-up areas in arid zone. In ISPRS workshop on updating Geospatial databases with imagery & the 5th ISPRS workshop on DM GISs, Vol. 36,Pp.163-171,2007.
[66] Masek J.G., Lindsay F.E., Goward S.N. Dynamics of urban growth in the Washington DC metropolitan area, 1973-1996, from Landsat observations. International Journal of Remote Sensing, 21,3473-3486,2000.
ISSN: 2456-1878 (Int. J. Environ. Agric. Biotech.) https://dx.doi.org/10.22161/ijeab.76.20