Journal Home Page Available: https://ijeab.com/ Journal DOI: 10.22161/ijeab

Journal Home Page Available: https://ijeab.com/ Journal DOI: 10.22161/ijeab
Himani
Chand*, Preeti Kayastha, Barsha KC, Biddhya Pandey, Bimal Roka Magar, Janak Bhandari, Pawan Lamichhane, Prakash Baduwal, Mukti Ram PoudelDepartmentofPlantBreeding,TribhuvanUniversity,Kathmandu,Nepal
*Correspondingauthor
Received:17Nov2022;Received inrevisedform: 04 Dec2022;Accepted:10 Dec2022;Availableonline:16 Dec2022 ©2022TheAuthor(s).PublishedbyInfogainPublication.ThisisanopenaccessarticleundertheCCBYlicense (https://creativecommons.org/licenses/by/4.0/).
Abstract Heat stress is the major constraint for wheat production causing significant drops in the yield and potential productivity making it difficult to achieve the target yield by 2030, increasing food insecurity in Nepal. The main aim of the study is to help plant breeders to select appropriate heat stress-tolerant indices for increasing wheat yield by coping with the major problem of heat stress. The experiment holds the study for three years at the Institute of Agriculture and Animal Science (IAAS), Paklihawa campus. The experimental trial was of alpha-lattice design with 5 blocks and 4 plots. There were in total of 2 replications each of 20 genotypes. MP (Mean Productivity) had the highest strong correlation with the stress tolerance indices followed by STI (Stress Tolerance Index) for all three years, whereas YSI (Yield Stability Index) had the lowest tolerance index with a negative correlation for the years 2019 and 2021. The selection of MP and STI is encouraged for the production of heat-stress-tolerant varieties for high-yielding with tolerance
Keywords Genotype, heat stress, tolerant, wheat.
Wheat is the most important food crop in the world and Nepal in terms of both area coverage and productivity. As of 2021, wheat is grown on 708,000 hectares which produced 218,500 metric tons in Nepal which represents an almost six-fold increase in yield from the same amount of land since 1960. Asia is the largest import region, followed by Africa, South America, Central America, and Europe (M. R. Poudel et al., 2020) But wheat in Nepal still faces consequences of climate change, in the form of extreme weather events like increasing temperatures, and erratic rainfall patterns, which threatens to reduce wheat yield by 30% by 2030.
Heat stress is a key abiotic stress affecting crop and cereal production in all regions of Nepal. The ability of wheat to adapt to a wide range of ecological conditions has made it one of the most important crops worldwide, but heat stress
ISSN: 2456-1878 (Int. J. Environ. Agric. Biotech.) https://dx.doi.org/10.22161/ijeab.76.16
has severe negative effects on yield, especially when associated with other stress factors.
Crop output around the world will be severely hampered by global climate change (Bishwas et al., 2021). An increase in the Earth’s near-surface temperatures is one of the most critical aspects of global climate change (P. B. Poudel et al., 2021a). This rise in temperature is frequently linked to rising levels of carbon dioxide (CO2) and other heattrapping greenhouse gases including methane, nitrous oxide, ozone, and water vapor in the atmosphere. At the current rate of greenhouse gas emissions, atmospheric CO2 levels are expected to double by the end of the century, raising surface temperatures by 1.8–5.8°C (Farooq et al., 2011). Cereals are the primary source of our diet. Heat and drought stress have a substantial impact on their output (Wasaya et al., 2021). Climate change will have a huge impact on the yield of essential food crops like wheat in different parts of the world (Hossain, A. et al., 2012).
Wheat (Triticum aestivum L.) is one of the world’s most important cereal crops, belonging to the Poaceae family (M. R. Poudel et al., 2020). It is a strategic crop that plays an important role in the economies of developing countries (Yassin et al., 2019). Wheat (Triticum aestivum L.) cultivation dates back to 10000 years ago, when the huntergatherersocietytransitionedtoagriculture.Wheatisamajor human food crop that ranks among the world’s top three cereal bowls due to its versatility, nutritional content, and high yield potential (Reynolds et al., 2007). 35 developed cultivars, 540 landraces, and 10 wild cousins exist in Nepal (Bishwas et al., 2021). It feeds about 35 percent of the world’s population in more than 40 nations, including Nepal, and supplies over 20% of calories and protein for human nutrition (Al-Naggar et al., 2020). Wheat is planted on 754243 hectares in Nepal, accounting for 20.13 percent of total cereal production and yielding 2.29 tons per hectare (P. B. Poudel et al., 2020). Arid and semiarid regions are home to the majority of wheat-growing areas (Rahman & Riad, 2020). Due to its importance as a staple crop in many nations, durum wheat accounts for more than half of the total wheat-growing area in the Mediterranean region (El-Rawy & Hassan, 2014). The durum grain is used to make a variety of foods, including bread, couscous, freekeh, bulgur, and, most notably, pasta (Mehmood et al., 2020). Pasta is widely acknowledged as a healthy addition to a well-balanced diet, and consumer demand is reflected in rising pasta production (Guzmán et al., 2016). In 2014, the global wheat trade recorded 153.0 million tons, while wheat use was 711.7 million tonnes. Asia is the biggest import region, followed by Africa, South America, Central America and Europe (M. R. Poudel et al., 2020) Wheat’s growth and development are governed by specific abiotic and biotic needs. Temperature is a crucial abiotic element that influences crop growth and development (Li et al., 2011). Heat stress, however, is a severe threat to agricultural output around the world due to high ambient temperatures (El-Esawi et al., 2019). The worldwide mean ambient temperature is expected to rise by6degrees Celsius by the end of the twenty-first century. Wheat is extremely susceptible to heat stress. It was estimated that a 1°C increase in temperature would result in a 6% decrease in global wheat yield (P. B. Poudel et al., 2021b). Drought (water stress) and heat stress (increases in above-optimal air temperatures) sometimes occur together, but theirimpacton wheat’s physiological, biological, and biochemical processes can be vastly different. Grain filling time, photosynthetic ability, and pace of assimilating translocation are all affected by high temperatures (Hossain et al., 2017). Drought is the most common abiotic stress that impacts wheat production, lowering grain yields by roughly 30%. (H.R. Balouchi, 2010). Furthermore, both genetic and
ISSN: 2456-1878 (Int. J. Environ. Agric. Biotech.) https://dx.doi.org/10.22161/ijeab.76.16
environmental factors have a direct impact on wheat quality (El Gataa et al., 2021). Drought stress influences the quantity of seeds per spike and kernel weight, two critical components of grain yield, during flowering and grain filling (H.R. Balouchi, 2010). Such heat occurrences can diminish both grain number and individual size, lowering yield (Farooqet al.,2011).Forexample,yield losses of15% were related to every day above 30°C during or around floweringin acorrelation study basedondatafromover600 field experiments in southern Australia (Shirdelmoghanloo et al., 2016).
High temperatures and drought stress at the same time shorten the grain-filling period, especially in dry land and rain-fed farming areas (Prasad & Staggenborg, 2008). Wheat breeders’ key difficulty in these places is selecting genotypes that can endure heat stress and water scarcity conditionsatthesametime(Tahmasebietal.,n.d).Breeders frequently utilize indirect selection and use well-correlated qualities with grain yield to improve grain output in dry conditions since grain yield is a complicated trait influenced by many genes (Bashyal et al., 2021). Plant height, days to heading, days to maturity, spike length, number of spikelets per spike, number of grains per spike, thousand kernel weight, grain yield per spike, grain yield, biological yield, and harvest index are some of the yield traits that breeders have used to assess drought stress on wheat plants (Hossain, A. et al., 2012). Due to changes in various edaphic and climatic conditions, several high-yielding cultivars that were previously recommended are now losing their yield capacity (P. B. Poudel et al., 2020). Despite the fact that drought and heat stress have been widely researched separately, little is known about how they interact to effect agricultural output (Telfer et al., 2018). The few studies that looked at the combined impacts of drought and heat stress found that the combination of drought and heat stress had a much more negative impact on crop growth and productivity than when each stress was applied separately (Mkhabela et al., 2019). Furthermore, it was discovered that the combination of drought and heat stress alters physiological processes like as photosynthesis, lipid accumulation, and transcript expression (Prasad & Staggenborg, 2008). The negative effects of temperature could be reduced by altering planting time to an optimal date and employing various genetic techniques to generate crop plants with enhanced thermo-tolerance (Taheri et al., 2011). However, a detailed understanding of plant physiological reactions to high temperatures, heat tolerance mechanisms, and potential solutions for enhancing crop thermo- resistance is required for this. This study was carried out to discover heat-tolerant and susceptible wheat types for future breeding initiatives in this environment (Ahmed & Fayyaz-Ul-Hassan, 2015).
2.1 Experimental material, design, site, and entries of genotypes
20 entries of wheat genotypes as given in Table 1 were grown at the agronomy field of IAAS, Paklihawa (27.4809414 °N, 83.4468789 ° E) in Bhairahawa of
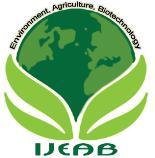
Rupandehi district. Rupandehi is a major wheat production district of Nepal with suitable weather conditions, favorable monsoons, and enough irrigation availability. National Wheat Research Program (NWRP) is also located in Bhairahawa, Rupandehi, promoting research on wheat. The experimental site area is depicted in Figure 1, which is prepared via ArcGIS software.
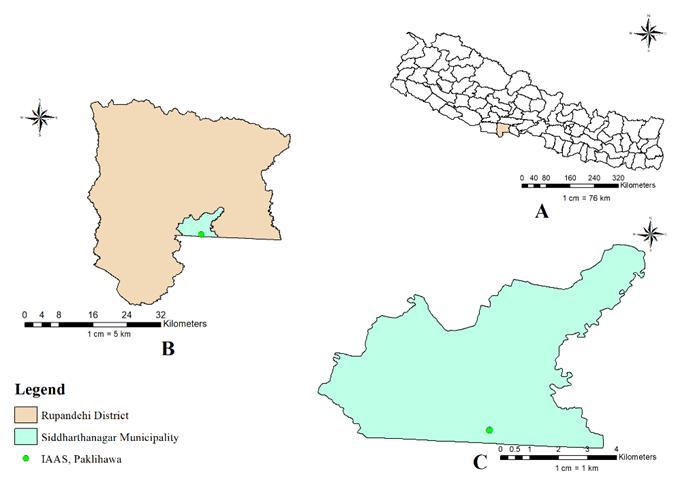
Fig 1. A. Map of Nepal showing Rupandehi district in pink color B. Map of Rupandehi district showing Siddharthanagar municipality in blue color C. Map of Siddharthanagar municipality with a green dot representing IAAS, Paklihawa
Table 1: List of wheat genotypes grown in the experimental plots along with their origin. S.N. Name of wheat genotypes Origin 1. Gautam Nepal 2. BL 4669 Nepal 3. NL 1412 CIMMYT, Mexico 4. BL 4407 Nepal 5. NL 1368 CIMMYT, Mexico 6. NL 1417 CIMMYT, Mexico 7. Bhirkuti CIMMYT, Mexico 8. BL 4919 Nepal 9. NL 1376 CIMMYT, Mexico 10. NL 1179 CIMMYT, Mexico 11. NL 1350 CIMMYT, Mexico 12. NL 1387 CIMMYT, Mexico 13. NL 1350 CIMMYT, Mexico 14. NL 1420 CIMMYT, Mexico 15. NL 1384 CIMMYT, Mexico 16. NL 1346 CIMMYT, Mexico
ISSN: 2456-1878 (Int. J. Environ. Agric. Biotech.) https://dx.doi.org/10.22161/ijeab.76.16
17. NL 1404
CIMMYT, Mexico
18. NL 1413 CIMMYT, Mexico
19. NL 1386 CIMMYT, Mexico
20. NL 1381 CIMMYT, Mexico
Each entry was sown in 26th December, 2021 on a plot surface of 10 m2 per genotype. A single plot consisted of 10 rows at a spacing of 25 cm where the seeds were sown following continuous sowing method. Recommended dose of 50:50:20 kg NPK/ ha fertilizer was applied as basal application. Weeds were controlled manually. This same arrangement was followed in adjacent field to implement the irrigated condition. Irrigation was provided via pipes.
The experiment was conducted on alpha lattice design with two replications as shown in Figure 2. The replications were separated at a distance of 1m. 4 plots were arranged in a single block, resulting in 5 blocks per replication.
DataentryandprocessingwasconductedthroughMicrosoft OfficeExcel2016. TheentereddatawereanalyzedviaIBM SPSS Statistics 25 Version 25 to compute Pearson’s correlation among variables at 5 and 1% levels of significance. Path coefficient analysis was performed using Microsoft Office Excel 2016.
The stress tolerance indices were calculated by the following relationships:
1. Tolerance Index (TOL)TOL = Yp – Ys (Ramirez-Vallejo et. al., 1998)
2. Stress Susceptibility Index (SSI) = (Hossain et.al., 1990)
3. Yield Stability Index (YSI)YSI = Ys/Yp (Fischer et.al., 1978)
4. Mean Productivity (MP)= (����+����) 2 (Bouslama et.al., 1984)
5. Geometric Mean Productivity (GMP) = √����+���� (Khan et.al., 2014)
6. Stress Tolerance Index (STI) = �������� ����2 (Khan et.al., 2014)

Where, Yp and Ys are the grain yield of genotypes under normal and heat stress conditions respectively. Whereas, Yp and Ys are mean yield of all genotypes under normal and heat stress conditions respectively. The grain yield was measured in term of kilogram per hectare.
Fig 2: Experimental layout of the plots under drought and irrigated conditions
Ten sample plants were selected randomly from each plot to collect data. Grain yield and Yield attributing traits like Plant height (PH), Spike length (SL), Spike weight (SW), Spike per m² area (S/m²), Number of grains per spike (NGPS), Number of spikelets per spike (NSPS), and 1000 kernels weight or Test weight were noted.
2.3. Statistical analysis
ISSN: 2456-1878 (Int. J. Environ. Agric. Biotech.) https://dx.doi.org/10.22161/ijeab.76.16
The experimental data were processed using Microsoft Excel 2010 and analysis of variance was conducted using ADEL-R (Analysis and design of experiments with R for Windows) developed by CIMMYT, Mexico. Stat Graphics software was used to perform correlation, principal component and biplot analysis.
3.1. Correlation among Yp, Ys, and stress tolerance indices:
Correlation analysis showed low, positive, and insignificant relations between grain yields under normal and stress conditions i.e. 0.331 and 0.199 in 2018 and 2021 respectively.(Khan and Kabir 2015), (Puri et al., 2020) and (Nouri et al. 2011) also reported the same result. Thus, it is not accurate to select heat-tolerant genotypes on the basis of
their performance in normal conditions In 2021, Yp and Ys showed positive and highly significant relationships with each other (1.000). It implies that the selection of heattolerant genotypes on basis of their performance under normal conditions is applicable. TOL positively associated with Yp in 2018 while it has a positive and highly significant association with Yp in 2019 and 2021 While TOL has a negative association with Ys in the years 2018 and 2021. Similar results were reported by (Tahir et al., 2022).It was in accordance with results reported by (Puri and Gautam 2015) (Nouri et al. 2011) suggested that a lower value of TOL is favorable for the selection of highyielding genotypes under stress conditions.
YSI has a positive and highly significant relation with grain yield under stress conditions in 2018 Furthermore, YSI has a negative and highly significant association with Yp in 2019 In 2018 and 2021, SSI shows a negative association with grain yield under stress conditions in accordance with the result of (Puri et al. 2020). MP, GMP, and STI have possessed a positive correlation with grain yield at normal andstressconditionsduringallthreeyears Theseresultsare in conformity with those obtained by (Kamrani, Hoseini, and Ebadollahi 2018), (Sareen, Tyagi, and Sharma 2012) and (Puri and Gautam 2015) Hence, MP,GMP and STI shouldbeconsidered whileselectingthehighyieldpotential genotypes under both normal and stress condition.
Table 1: Correlation coefficient between grain yield of wheat genotypes and heat stress indices under normal and heat stress conditions in 2018
Correlations-2018
Yp Ys TOL YSI SSI MP GMP STI
Yp 1 0.331 0.295 0.008 -0.008 .711** .552* .584** Ys 0.331 1 -.804** .945** -.945** .899** .965** .958**
TOL 0.295 -.804** 1 -.952** .952** -.463* -.629** -.602** YSI 0.008 .945** -.952** 1 -1.000** .708** .831** .810**
SSI -0.008 -.945** .952** -1.000** 1 -.708** -.831** -.810** MP .711** .899** -.463* .708** -.708** 1 .975** .985** GMP .552* .965** -.629** .831** -.831** .975** 1 .994** STI .584** .958** -.602** .810** -.810** .985** .994** 1
Table 2: Correlation coefficient between grain yield of wheat genotypes and heat stress indices under normal and heat stress conditions in 2019
Correlations- 2019
Yp Ys TOL YSI SSI MP GMP STI
Yp 1 1.000** 1.000** -.987** .987** 1.000** 1.000** .998** Ys 1.000** 1 1.000** -.987** .987** 1.000** 1.000** .998** TOL 1.000** 1.000** 1 -.987** .987** 1.000** 1.000** .998** YSI -.987** -.987** -.987** 1 -1.000** -.987** -.988** -.976** SSI .987** .987** .987** -1.000** 1 .987** .988** .976**
MP 1.000** 1.000** 1.000** -.987** .987** 1 1.000** .998**
GMP 1.000** 1.000** 1.000** -.988** .988** 1.000** 1 .998**
STI .998** .998** .998** -.976** .976** .998** .998** 1
ISSN: 2456-1878 (Int. J. Environ. Agric. Biotech.) https://dx.doi.org/10.22161/ijeab.76.16
Table 3. Correlation coefficient between grain yield of wheat genotypes and heat stress indices under normal and heat stress conditions in 2021
Correlation 2021
Yp Ys TOL YSI SSI MP GMP STI
Yp 1 0.199 .847** -.723** .723** .894** .836** .854**
Ys 0.199 1 -0.352 .522* -.522* .616** .703** .678**
TOL .847** -0.352 1 -.974** .974** .520* 0.417 .448* YSI -.723** .522* -.974** 1 -1.000** -0.343 -0.234 -0.266 SSI .723** -.522* .974** -1.000** 1 0.343 0.234 0.266
MP .894** .616** .520* -0.343 0.343 1 .993** .996** GMP .836** .703** 0.417 -0.234 0.234 .993** 1 .998**
STI .854** .678** .448* -0.266 0.266 .996** .998** 1
**. Correlation is significant at the 0.01 level (2-tailed).
*. Correlation is significant at the 0.05 level (2-tailed).
Under theobservationof threeyears dataof stress tolerance, MP seems to have the highest strong correlation with the Yp and Ys followed by STI in all those years accordingly. Therefore, these indices are found suitable for selection of high yielding genotypes under both conditions. It can be recommended that for future research, these results could contribute to the development of varieties with better heat tolerance. It is clear that wider genetic diversity should be explored if greater heat stress resilience is to be achieved in wheat breeding programmes to cultivate in the heat prone areas of Nepal.
The authors declare that they have no known competing financial interests or personal relationships that could have appeared to influence the work reported in this paper.
WewouldliketoacknowledgePaklihawaCampus,Institute of Agriculture and Animal Science, Tribhuvan University, Nepal for providing research support and facilities for conducting this experiment.
[1] A.A.Khan,M.R.Kabir. Evaluation of spring wheat genotypes (Triticum aestivum L.) for heat stress tolerance usingdifferentstresstoleranceindicesCercetariAgronomice in Moldova,47 (4)(2014), pp.49-63,10.1515/cerce-20150004
ISSN: 2456-1878 (Int. J. Environ. Agric. Biotech.) https://dx.doi.org/10.22161/ijeab.76.16
[2] Hossain, J.A. Teixeira, M.V. Lozovskaya, and V. P. Zvolinsky(2012).TheEffectofHigh-TemperatureStresson Five Wheat (Triticum aestivum L.) Varieties' Phenology, Growth, and Yield. The Asian and Australasian Journal of Plant Science and Biotechnology.
[3] A., Hossain, M. R. Islam, K. A. M. M. Rahman, M. H. Rashid,andA.Anwari(2017).Underheatstress,threewheat (Triticum aestivum L.) types were compared. 4(43), 16–24, International Journal of Natural and Social Sciences
[4] Sharma,R.Rawat,J.Verma,J.Jaiswal.Correlationandheat susceptibility index analysis for terminal heat tolerance in bread wheat. J. Cent. Eur. Agric., 14 (2) (2013), pp. 57-66, 10.5513/JCEA01/14.2.1233
[5] A.,Wasaya,S.Manzoor,T.A.Yasir,N.Sarwar,K.Mubeen, I.A.Ismail,A.Raza,A.Rehman,A.Hossain,A.Sabagh,A. E. L. Sabagh, A. E. L. Sabagh, A. E. L. Sabagh, A. E. L. Sabagh, A. E. L. Sabagh, A. E (2021). Under drought stress, fourteen bread wheat (Triticum aestivum L.) genotypes were evaluated by observing gas exchange parameters, relative water, chlorophyll content, and yield features. Switzerland (Sustainability),13(9).https://doi.org/10.3390/su13094799
[6] Balouchi, H.R. (2010). Mapping Population Wheat Parents forHeatandDroughtTolerance,DetectionofWheatGenetic Variation The World Academy of Science, Engineering, and Technology is a non-profit organization dedicated to the advancement of science, engineering, and technology. https://citeseerx.ist.psu.edu/viewdoc/download?doi=10.1.1.3 08.9847&rep=rep1&type=pf
[7] H. Shirdelmoghanloo, D. Cozzolino, I. Lohraseb, and N. C. Collins (2016). Grain truncation in wheat (Triticum aestivum) induced by transient heat stress during early grain filling: Relationships with senescence responses and stem reserve losses. 919–930 in Functional Plant Biology,43(10). https://doi.org/10.1071/FP15384
[8] J. Rahman and M. I. Riad. Malaysian Journal of Sustainable Agriculture, vol. 4, no. 1, pp. 34–35, 2020.
https://doi.org/10.26480/mjsa.02.2021
[9] Kamrani, Morteza, Yaser Hoseini, and Asgar Ebadollahi. 2018.“EvaluationforHeatStressToleranceinDurumWheat Genotypes Using Stress Tolerance Indices.” Archives of Agronomy and Soil Science 64 (1): 38–45. https://doi.org/10.1080/03650340.2017.1326104.
[10] K. C. Bishwas, M. R. Poudel, and D. Regmi (2021). Biplot investigation of yield of several elite wheat lines under terminalheatstressandirrigatedconditionsusingAMMIand GGE. Heliyon, vol. 7, no. 6, e07206. https://doi: 10.1016/j.heliyon.2021.e07206
[11] Khan, A.A., and M.R. Kabir. 2015. “Evaluation of Spring Wheat Genotypes (Triticum Aestivum L.) for Heat Stress Tolerance Using Different Stress Tolerance Indices.” Cercetari Agronomice in Moldova 47 (4): 49–63. https://doi.org/10.1515/cerce-2015-0004.
[12] M. Ahmed and Fayyaz-Ul-Hassan (2015). Quality attributes andyieldofspringwheat(Triticumaestivum L.)asafunction of sowing date. PLoS ONE, vol. 10, no. 4, pp. 1–16. https://doi.org/10.1371/journal.pone.0126097
[13] M. Bouslama, W.T. Schapaugh Jr. Stress tolerance in soybeans.I.Evaluationofthreescreeningtechniquesforheat and drought tolerance Crop Sci., 24 (5) (1984), pp. 933-937, 10.2135/cropsci1984.0011183X002400050026x
[14] M.M.Al-Naggar,M.A.E.M.AbdEl-Shafi,M.H.El-Shal, andA.H.Anany(2020).Droughttolerance,agronomic,grain yield, and quality features of Egyptian wheatlandraces (Triticumaestivum L.)wereassessed.PlantArchives,vol.20, no.6,pp.3487–3504.
[15] M. A. El-Esawi, A. A. Al-Ghamdi, H. M. Ali, and M. A. Ahmad (2019). Heat anddroughtstress tolerance in wheat is improved byoverexpression of the atWRKY30 transcription factor(Triticum aestivum L.).Genes,vol.10,no.2,pp.1–13. https://doi.org/10.3390/genes10020163
[16] M. A. El-Rawy and M. I. Hassan (2014). Drought tolerance indicators' effectiveness in identifying tolerant genotypesinbreadwheat(Triticum aestivum L.).255–266in Journal of Crop Science and Biotechnology. https://doi.org/10.1007/s12892-014-0080-7
[17] M. Farooq, H. Bramley, J. A. Palta, and K. H. M. Siddique (2011). Wheat is subjected to heat stress during the reproductive and grain-filling periods. Critical Reviews in Plant Sciences, vol. 30, no. 6, pp. 491–507, doi:10.1080/07352689.2011.615687
[18] Morales-Dorantes, A., Posadas-Romano, G., Crossa, J., Ammar, K., & Pea, R. J. Guzmán, C., Autrique, J. E., Mondal, S., Singh, R. P., Govindan, V., Morales-Dorantes, A., Posadas-Romano, G., Crossa, J., Ammar, K. (2016). Responseofwheatqualitytodroughtandheatstressindurum wheat, with a focus on bread-making quality. 157–165 in Field Crops Research. https://doi.org/10.1016/j.fcr.2015.12.002
[19] M.P.Reynolds,C.SaintPierre,A.S.I.Saad,M.Vargas,and A. G. Condon (2007). Under drought and heat stress, evaluating potential wheat genetic gains linked with stressadaptive trait expression in elite genetic resources. 47, Crop Science (SUPPL. DEC.). https://doi.org/10.2135/cropsci2007.10.0022IPBS
ISSN: 2456-1878 (Int. J. Environ. Agric. Biotech.) https://dx.doi.org/10.22161/ijeab.76.16
[20] M. R. Poudel, S. Ghimire, M. P. Poudel. (2020). Wheat Genotype Yield Stability under Irrigated, Heat Stress, and Drought Conditions. 1–10 in Journal of Biology and Today's World, vol. 9, no. 4. https://www.iomcworld.org/abstract/yield-stability-analysisof- wheat-genotypes-at-irrigated-heat-stress-and-droughtcondition-53403.html
[21] M.Yassin,A.ElSabagh,A.M.M.Mekawy,M.S.Islam,A. Hossain,C.Barutcular,H.Alharby,A.Bamagoos,L.Liu,A. Ueda, and H. Saneoka (2019). Under salinity stress, the performance of two bread wheat (Triticum Aestivum L.) genotypes was compared. 5029–5041 in Applied Ecology and Environmental Research, https://doi.org/10.15666/aeer/170250295041.
[22] Nouri, Atefeh, Alireza Etminan, Jaime A.Teixeira da Silva, and Reza Mohammadi. 2011. “Assessment of Yield, YieldRelated Traits and Drought Tolerance of Durum Wheat Genotypes (Triticum Turjidum Var. Durum Desf.).” Australian Journal of Crop Science 5(1):8–6.
[23] Poudel, M. R., Ghimire, S., P, M. P., ey, Dhakal, K., Thapa, D. B., & Poudel, H. K. (2020). Yield Stability Analysis of Wheat Genotypes at Irrigated, Heat Stress and Drought Condition. Journal of Biology and Today’s World, 9(4), 1–10.
[24] P. B. Poudel, U. K. Jaishi, L. Poudel, and M. R. Poudel (2020).WheatGenotypesaretestedunderbothearlyandlate sowing conditions. 8(2), 161–169, International Journal of Applied Sciences and Biotechnology. https://doi.org/10.3126/ijasbt.v8i2.29593
[25] P. B. Poudel, M. R. Poudel, and R. R. Puri (2021a). In the western part of Nepal, stress tolerance indices were used to assess heat stress tolerance in spring wheat (Triticum aestivum L.) genotypes. 100179, Journal of Agriculture and FoodResearch. https://doi.org/10.1016/j.jafr.2021.100179
[26] P. B. Poudel, M. R. Poudel, and R. R. Puri (2021b). In the western part of Nepal, stress tolerance indices were used to assess heat stress tolerance in spring wheat (Triticum aestivum L.) genotypes. https://doi.org/10.1016/j.jafr.2021.100179 Journal of Agriculture and Food Research, 5, https://doi.org/10.1016/j.jafr.2021.100179
[27] P. Bashyal, S. Pandey, B. Tharu, P. Gurung, and R. Koirala. Bashyal, S. Pandey, S. Pandey, S. Pandey, S. Pandey, S. Pandey, S. Pandey, S. Pandey, S. (2021). A Review of the Effects of Terminal Heat Stress and the Mechanisms that Respond in Elite Wheat Genotypes. 40–45 in Plant Physiology and Soil Chemistry, vol. 1, no. 2. https://doi.org/10.26480/ppsc.02.2021.40.45
[28] P. V. V. Prasad and Staggenborg, S. A. (2008). Drought and/or Heat Stress Effects on Crop Plant Physiological, Developmental, Growth, and Yield Processes 301–355 in Advances in Agricultural Systems Modeling, "Response of Crops to Limited Water: Understanding and Modeling Water Stress Effects on Plant Growth Processes."
[29] P. Li, J. Chen, and P. Wu (2011). Drought stress and nonstress agronomic features and grain yield of 30 spring wheat genotypes. Agronomy Journal, vol. 103, no. 6, pp. 1619–
1628.https://doi.org/10.2134/agronj2011.0013
[30] Puri, Ramesh Raj, and Nutan Raj Gautam. 2015. “Performance Analysis of Spring Wheat Genotypes under Rain-Fed Conditions in Warm Humid Environment of Nepal.” International Journal of Environment 4(2):289–95. https://doi.org/10.3126/ije.v4i2.12649.
[31] Puri, Ramesh Raj, Santosh Tripathi, Rudra Bhattarai, Sangharash Raj Dangi, and Deepak Pandey. 2020. “Wheat Variety Improvement for Climate Resilience.” Asian Journal of Research in Agriculture and Forestry 6 (2): 21–27. https://doi.org/10.9734/ajraf/2020/v6i230101.
[32] P. Ramirez-Vallejo, J.D. Kelly Traits related to drought resistanceincommonbeanEuphytica,99(2)(1998),pp.127136,10.1023/A:1018353200015
[33] P. Telfer, J. Edwards, D. Bennett,D. Ganesalingam, J. Able, and H. Kuchel. Telfer, P., Edwards, J., Bennett, D., Ganesalingam, D., Able, J., and Kuchel, H. (2018). Wheat (Triticum aestivum) response to heat stress was evaluated in the field and in a controlled environment. 229(August), pp. 55–65 in Field Crops Research. https://doi.org/10.1016/j.fcr.2018.09.013
[34] R.A.Fischer,R.Maurer. Drought resistance in spring wheat cultivars. I. Grain yield responses. Aust. J. Agric. Res.,29(5)(1978),pp.897-912,10.1071/AR9780897
[35] Sareen, S., B. S. Tyagi, and I. Sharma. 2012. “Response EstimationofWheatSyntheticLinestoTerminalHeatStress UsingStressIndices.” JournalofAgriculturalScience 4(10): 97–104.https://doi.org/10.5539/jas.v4n10p97.
[36] S. S. Mkhabela, H. Shimelis, A. O. Odindo, and J. Mashilo (2019). Response of agronomic traits and biochemical markers in drought-tolerant wheat (Triticum aestivum L.) genotypes under drought-stressed and non-stressed circumstances. 674–689 in Acta Agriculturae Scandinavica Section B: Soil and Plant Science. https://doi.org/10.1080/09064710.2019.1641213
[37] S. Taheri, J. Saba, F. Shekari, and T. L. Abdullah (2011). Drought stress has a negative impact on the yield of spring wheat (Triticum aestivum) lines. 18339–18348 in African Journal of Biotechnology, 10(80). https://doi.org/10.5897/AJB11.352
[38] S. Tahmasebi, B. Heidari, H. Pakniyat, and C. L. Mcintyre (n.d.). Under drought and terminal-heat stress conditions in wheat, mapping QTLs linked with agronomic and physiological traits ( Triticum aestivum L .). Running title's Seed and Plant Improvement division is part of theAgriculturalandNaturalResourcesResearchCenter.
[39] Tahir, Iqra, Naqib Ullah Khan, Samrin Gul, Sheraz Ahmed, YusraAndleeb,AminaHabib,SardarAli,SherAslamKhan, Naushad Ali, and Izhar Hussain. 2022. “Late Planting Induced Heat Stress Tolerance in Wheat.” Pakistan Journal of Botany 54(3).https://doi.org/10.30848/pjb2022-3(17).
[40] T.Mehmood,M.Abdullah,S.Ahmar,M.Yasir,M.Iqbal,M. S. Yasir, M. Yasir, M. Yasir, M. Yasir, M. Yasir, M. Yasir, M.Yasir,M.Yasir,M.Yasir,M.Yasir,M.Yasir,M.(2020). Osmotic adjustment plays a huge part in wheat grain yield sustainability when there is a lack of water (Triticum aestivum L.). Plants, vol. 9, no. 9, pp. 1–14. https://doi.org/10.3390/plants9091208
ISSN: 2456-1878 (Int. J. Environ. Agric. Biotech.) https://dx.doi.org/10.22161/ijeab.76.16
[41] Z.ElGataa,S.ElHanafi,K.ElMessoadi,K.Samir,Z.Kehel, W.Tadesse,Z.ElGataa,S.ElHanafi,K.ElMessoadi,K.El Messoadi,K.ElMessoadi,K.ElMessoadi,K.El Messoadi, K. (2021). Agronomic and quality trait association and prediction studies in spring beard wheat (Triticum aestivum L.)growninarain-fedclimatewith terminalmoisturestress. 103278, Journal of Cereal Science, vol. 101, no. 6 (June). https://doi.org/10.1016/j.jcs.2021.103278