The Relationship of Bivalvia Affairs to Mangrove Density in Pt Arutmin Indonesia Kintap Mining Area Mekarsari Village, Tanah Laut Regency South Kalimantan Province
Frans Tony
1Department of Marine Science, Faculty of Fisheries and Marine Science, University of Lambung Mangkurat, South Kalimantan, Indonesia.

2Department of Aquaculture, Faculty of
Received: 29 Sep 2022; Received in
Achmad Yani University, South Kalimantan, Indonesia.
Oct 2022; Accepted: 23 Oct 2022; Available online: 28 Oct 2022
The Author(s). Published by Infogain Publication. This is an open access article under the CC BY license (https://creativecommons.org/licenses/by/4.0/).
Abstract This research was conducted to determine how strong the effect of mangrove density on the bivalves community in particular in abundance. This research was conducted in March 2022 to April 2022. Data collection is carried out at three stations located at upstream, middle and downstream. Each sample station collected is a bivalves sample and data mangrove observation. Bivalve samples using a 1 mx 1 m transect on the plot observation of mangroves 10 m x 10 m. The results of the study showed that the bivalves found there are 8 types of bivalves, namely; Mactra violacea, Perna viridis, Mactra chinensis, Polymesoda erosa, Geloina expansa, Isognomon ephippium, Anadara antiquata and Polymesoda bengalensis. Station 1 with bivalves abundance of 960 ind/m² with mangrove density 1300 ind/ha. Station 2 with an abundance of 680 ind/m² bivalves with a mangrove density 1800 ind/ha. Stations with an abundance of bivalves of 2,360 ind/m² with a density of mangroves 2200 ind/ha. The relationship between bivalves abundance and mangrove density using simple linear regression analysis with weak category results
Keywords Bivalves, Mangrove, Mekarsari Village
I. INTRODUCTION
Mangrove ecosystems along the coast or river estuaries are affected by tides and live in coastal areas that are protected from the waves. Likewise, the mangrove ecosystem in Mekarsari Village, which is located in the Kintap sub district, Tanah Laut district, South Kalimantan Province is an area that has a 1.83 ha mangrove ecosystem (Tony. F, et al 2022). The ecological function of the mangrove ecosystem is as a beach protector from wind, waves and currents from the sea, habitat, foraging areas, nursery areas and spawning areas (Samir and Romy, 2016).
One of the communities found in the mangrove ecosystem is the bivalves community. The bivalve community occupies an important position in the food chain in the mangrove forest area because bivalves are detritus eating organisms and have a role in the decomposition process of
ISSN: 2456 1878 (Int.
Environ.
mangrove litter. In addition, it can also be used as a pollutant indicator because it has a long life cycle, can be identified and its abundance can be calculated (Rosenberg and Resh, 1993).
Research (Defira, 2018) states that mangrove density affects the abundance of individual bivalves. The higher the density of mangroves, the higher the abundance of bivalves because they are able to produce high litter and organic matter needed by bivalves for food sources. So this study was conducted to determine how strong the effect of mangrove density on bivalves communities, especially on their abundance.
Based on the problem formulation, how is the relationship between the abundance of bivalves and the density of mangroves in Mekarsari Village. The purpose of this study was to analyze the relationship between the abundance of bivalves and the density of mangroves in Mekarsari
, Putri Mudhlika Lestarina
, Novreza Dita Yorenagea Ilmy
, Rina Iskandar
Village. This research can be used as a reference for future research.
II. RESEARCH METHODS
This research was conducted in March April 2022 in the PT Arutmin Indonesia Tambang Kintap area, Mekarsari Village, Tanah Laut Regency, South Kalimantan Province. The equipment used during the study were GPS, stationery, camera, bivalve and mangrove identification book, plastic bag, tissue, label paper, meter, pipette, tally sheet, 1 m × 1 m quadrant transect, shovel, arcgis 10.8 and microsoft excel. While the materials used are distilled water, 10% formalin and bivalves samples.
Determination of observation points using purposive sampling method. Purposive sampling is a sampling method based on research considerations to determine the characteristics of a population that has a dominant relationship so that research objectives can be achieved. There are 3 designated observation points, namely station 1 which is located directly opposite the sea or commonly known as open mangrove. Stations 2 and 3 are brackish mangrove areas along the river.

with tree criteria, namely diameter at chest height 10 cm. Mangrove samples found in each observation plot, counted the number of stands of each species.
Bivalve Data Analysis
The number of individuals of a species to the total number of individuals contained in an area in a community, is formulated as follows:
K = × 100
Information:
K = Species Abundance (ind/m2)
ni = Number of individual bivalves (ind)
5 = Number of Sample Plots
100 = Total Sampling Area (m2)
The relative abundance of bivalves was calculated using the Shannon Wienner formula (Odum, 1993), with the following formula:
R = × 100%
Information:
R = Relative Abundance (ind)
ni = Number of individuals of each species (ind)
N = Total Number of Individuals (ind)
Analisis Data Mangrove
Species density is that in a unit area there are the number of stands of species i. standing category based on growth category, namely trees with diameter criteria at chest height > 10 cm. The formula for specific density is as follows:
K =
Fig.2.1. Observation Point
Bivalves sampling was carried out on each 10 m x 10 m mangrove observation point plot. Bivalve sampling was taken at five points to represent the plot area of 10 m x 10 m, four points at the corners of each plot and one point in the center of the plot using a 1 m x 1 m transect. Bivalves are taken by hand for those on the surface and using a shovel for bivalves that are in the substrate by digging 10 15 cm.
Sampling of mangroves determines the mangrove observation path starting with a perpendicular direction from the sea to the land along the existence of mangroves. Transect installation was carried out at three stations with a distance of 50 meters between transects. Make a transect using a 10 m × 10 m rapia rope and observe the mangroves
ISSN: 2456 1878 (Int. J. Environ. Agric. Biotech.)
https://dx.doi.org/10.22161/ijeab.75.16
Information:
K = Specific Density I (ind/m2)
ni = Total Stands of Type I (eng)
A = Total Sampling Area (m2)
The relative density of species is the ratio of the total number of stands of species i to the total number of all stands of species, the following formula is used:
KRi = × 100%
Information:
KRi = Specific Relative Density (%)
ni = Total Number of Stands of Type I (ind)
= Total Number of Stands of all Types (ind)
TonyIII. RESULTS AND DISCUSSION
Based on the results of research that has been carried out, it is known that 8 species of bivalves found in the mangrove area of Mekarsari Village include; Mactra violacea, Perna viridis, Mactra chinensis, Polymesoda erosa, Geloina expansa, Isognomon ephippium, Anadara antiquata and Polymesoda bengalensis. The composition of bivalves can be seen per station in Table 3.1
Table 3.1. Bivalve Type Composition
Species Name Station 1 2 3
Mactra violacea + + + Perna viridis + Mactra chinensis + + Polymesoda erosa + Geloina expansa + + + Isognomon ephippium + Anadara antiquata + Polymesoda bengalensis + + + (Source: Primary Data 2022)
Informationn : + : Found : Not Found
The distribution of bivalves varies or varies at each observation station in general, this is due to differences in habitat characteristics for each type of bivalves, availability of food sources and tolerance to environmental changes..
Abundance
Based on the results of research that has been carried out the abundance of bivalves found at station one can be seen in Table 3.2.
Table 3.2. Data Result of Analysis of Abundance of Bivalves Station 1
Station Species (ind) K (ind/m2) KR (ind)
Perna viridis 3 60 16,67 Mactra chinensis 7 140 38,89
Station Species (ind) K (ind/m2) KR (ind)
Mactra violacea 3 60 21,43
2
Perna viridis 1 20 7,14 Mactra chinensis 3 60 21,43 Geloina expansa 3 60 21,43 Isognomon ephippium 1 20 7,14
Polymesoda bengalensis 3 60 21,43
Mactra violacea 6 120 37,5
3
Perna viridis 2 40 12,5 Mactra chinensis 1 20 6,25 Geloina expansa 2 40 12,5 Isognomon ephippium 1 20 6,25
Polymesoda bengalensis 4 80 25
Total 48 960 300 (Source: Primary Data 2022) Information : K: Abundance KR : Relative Abundance
The abundance value of bivalves at station one is 960 ind/m2 which is the second highest value after station three. The relative abundance with the highest percentage at station one was found in the type of Mactra chinensis with a percentage of 38.89%. This means that Mactra chinensis is a type of bivalves that contributes the greatest abundance value at station one. According to Kurniawan (2007) abundant species are species that can adapt to life more than other species. Mactra chinensis has a thick shell, so it can protect itself from predators or environmental conditions.
1 1
Isognomon ephippium 4 80 22,22
Polymesoda bengalensis 4 80 22,22
ISSN: 2456 1878 (Int. J. Environ. Agric. Biotech.) https://dx.doi.org/10.22161/ijeab.75.16
The lowest relative abundance was found in Isognomon ephippium with a percentage of 6.25%. Ephippium isognomon can attach to rocks and other hard substrates in sea and brackish water and attach to mangrove roots in estuaries and mangrove areas (Carpenter & Niem, 1998).
Tony etBased on the habitat characteristics of Isognomon ephippium, it is suspected that this species is not abundant because the mangrove area of station one has a substrate, namely muddy sand.
Mangrove density at this station is in the medium category but has the second highest abundance of bivalves among other stations. This is influenced by the habitat characteristics of the bivalves.
At station two the abundance and relative abundance of bivalves showed the lowest results from the other stations. Can be seen in Table 3.3.
Table 3.3. Data from Analysis of Abundance of Bivalves Station 2
so on). The litter is broken down by organisms so that it provides an energy source for bivalves (Akhrianti et al, 2014). In addition to requiring an energy source, bivalves also need a suitable habitat to live in an area, but station two is an area between the confluence of seawater and fresh water, this area has extreme and changing environmental conditions that require bivalves to adapt more extra.
At station three the abundance and relative abundance of bivalves showed the highest results from other stations. Can be seen in Table 3.4.
Table 3.4. Data Result of Analysis of Abundance of Bivalves Station 3
Station Species (ind) K (ind/m2) KR (ind)
Mactra violacea 8 160 20,51
Mactra violacea 1 20 8,33
1
Mactra chinensis 5 100 41,67 Geloina expansa 1 20 8,33 Polymesoda bengalensis 5 100 41,67
Mactra violacea 4 80 30,76
Mactra chinensis 2 40 15,38
Station Species (ind) K (ind/m2) KR (ind) 2
2
Geloina expansa 2 40 15,38 Polymesoda bengalensis 5 100 38,46
Mactra violacea 2 100 22,22
3
1
Polymesoda erosa 10 200 25,64
Geloina expansa 9 180 23,07
Anadara antiquata 6 120 15,38
Polymesoda bengalensis 6 120 15,38
Mactra violacea 7 140 18,42
Polymesoda erosa 10 160 26,31
3
Geloina expansa 2 40 22,22 Polymesoda bengalensis 5 40 55,55
Total 34 680 300 (Source: Primary Data 2022)
The abundance value at station two is 680 ind/m2. The relative abundance with the highest percentage was found in Polymesoda bengalensis at 55.55%. This means that Polymesoda bengalensis is a type of bivalves that contributes the greatest abundance value at station two. Where environmental factors and differences in the characteristics of each station can affect the abundance of Polymesoda bengalensis species. This species is known to live on relatively smooth substrates (Dwiono, 2003). While the relatively low abundance was found in two species, namely Mactra violacea and Geloina expansa.
Station two has a dense mangrove density. Mangrove density affects the litter produced. Litter that comes from mangroves is (leaves, stems, fruit, twigs and
ISSN: 2456 1878 (Int. J. Environ. Agric. Biotech.)
https://dx.doi.org/10.22161/ijeab.75.16
2
Geloina expansa 8 200 21,05 Anadara antiquata 7 140 18,42
Polymesoda bengalensis 6 120 15,78
Mactra violacea 8 160 19,51
Polymesoda erosa 9 180 21,95
3
Geloina expansa 10 200 24,39 Anadara antiquata
7 140 17,07
Polymesoda bengalensis 7 140 17,07
Total 118 2.360 300 (Source: Primary Data 2022)
Can be seen in Table 3.3. abundance value at station three is 2.360 ind/m2. The relative abundance with the highest percentage was found in the Polymesoda erosa species at
Tony26.31%. This means that the Bivalves Polymesoda erosa contributed the greatest abundance value at station three. Polymesoda erosa is a type of bivalves that mostly live in mangrove forest areas by immersing themselves in muddy substrates (Peter and Sivatoshi, 2001). Where the muddy substrate with the highest percentage yield was found at station three of 75.2% mud with the dominant mangrove species being Avicennia alba. Avicennia alba mangroves have roots that grow scattered (Arief, 2003). Avicennia alba root can help bind sediment. According to Buckman and Brady (1982) sediment or bottom substrate contains organic matter. Organic matter is a source of nutrients that are needed by marine organisms (Riniasih, 2015).
The density at station three is included in the very dense category, where the high density of mangroves will produce high litter and organic matter needed by bivalves as a food source. This is one factor in the high abundance of bivalves at this station.
Mangrove Type and Density
Based on the results of observations of mangroves at the research site, three types of mangrove trees were found, namely: Avicennia alba, Rhizophora mucronata and Sonneratia alba.
Table 3.6. Mangrove Tree Density
Station Mangrove Type
1
2
3
(ind/ha)
Avicennia alba 667
Rhizophora mucronata 400
Sonneratia alba 233 18
Total 1300
Avicennia alba 800
Rhizophora mucronata
Total 1800
Avicennia alba 1467
Rhizophora mucronata 733
Total 2200
Source: Primary Data 2022
The highest mangrove density is found at station three with a density of 2200 ind/ha and includes the criteria for very dense or very dense. At station two, the mangrove density is 1800 ind/ha and includes very dense criteria. Station one, the density of mangrove trees is 1300
ISSN: 2456 1878 (Int. J. Environ. Agric. Biotech.)
https://dx.doi.org/10.22161/ijeab.75.16
ind/ha and includes the medium criteria based on KEPMEN LH No. 51 of 2003.
The value of mangrove density describes the condition of the mangrove ecosystem, the condition of the mangrove ecosystem is influenced by several factors, namely community activities, land function shifts and environmental conditions in the surrounding area (Lestarina, et al 2020). Mangroves are a source of food, which comes from mangrove litter (leaves, twigs, fruit, stems, etc.) which are decomposed by bacteria and some of the litter becomes detritus particles that are used as food for bivalves (Bengen, 2001)
Relationship between Mangrove Density and Bivalves Abundance
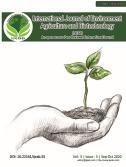
The results of the regression analysis showed that the R2 value indicated that the effect of mangrove density on the abundance of bivalves was in the low category, namely 0.2771. This is reinforced by the statement (Akhrianti et al., 2014) that the abundance of bivalves is influenced by biotic and abiotic factors, namely environmental conditions with the carrying capacity of physical parameters (temperature, brightness, current velocity and substrate), chemical parameters (salinity pH and DO), and environmental parameters. biology (plankton). In addition to water quality, the presence, abundance and diversity of bivalves is influenced by predator predation, competition and the composition of food availability. Differences in the number of species and structure of bivalves can also be caused by pressure and natural changes. The results of simple linear regression can be seen in Figure 2.
Fig 3 1 Simple Linear Regression
IV. CONCLUSION
The bivalve community in the mangrove area consists of eight species of bivalves, namely, Mactra violacea, Perna viridis, Mactra chinensis, Polymesoda erosa, Geloina expansa, Isognomon ephippium, Anadara antiquata and Polymesoda bengalensis.
The relationship between mangrove density and bivalves abundance shows that the two relationships have a
relationship in the low category, but still have an influence in the low category and the rest is influenced by other environmental factors such as temperature, salinity, pH, DO and substrate.
ACKNOWLEDGEMENTS
The author would like to thank PT. Arutmin Indonesia's Kintap Mine, Kintap District, Tanah Laut Regency, South Kalimantan Province who have supported and facilitated this research. The authors also thank the Dean of the Faculty of Fisheries and Marine Affairs, Lambung Mangkurat University, Dean of the Faculty of Agriculture, Ahmad Yani University, the Regional Government of Tanah Laut Regency, Indonesia, and as friends all who have supported so that this research can be completed.
REFERENCES
[1] Akhrianti, I,. Bengen, D, G. and Setyobudiandi, I. 2014. Spatial Distribution and Habitat Preference of Bivalvia in Coastal Waters, Simpang Pesak District, East Belitung Regency. Journal of Tropical Marine Science and Technology, Vol. 6, No. 1, Pg. 171 185.
[2] Arief, A. 2003. Mangrove Forest: Functions and Benefits. Canisius Yogyakarta. 47 p.
[3] Bengen, D. G. 2001. Technical Guidelines: Introduction and Management of Mangrove Ecosystems. Center for the Study of Coastal and Ocean Resources. Bogor. 60 p.
[4] Brotowidjoyo, M.D., 1993. Basic Zoology. Erlangga: Jakarta.
[5] Buckman, H.D. & N.C. Brady. 1982. The Natural and Properties of Soil. The Macmilan Company, New York.
[6] Carpenter, K. E., & Niem, V. H. (Eds.). (1998). FAO species identification guide for fisheries purpose. The living marine resources of the Western Central Pacific. Volume 1. Seaweeds, corals, bivalves and gastropods. Rome: FAO.
[7] Defira, Y., Adriman., and Fauzi, M. 2018. Structure of the Bivalve Community in the Mangrove Ecosystem in Mengapan Village, Sungai Apit District, Siak Regency, Riau Province. (Thesis)
[8] Dwiono SAP. 2003. Introduction of Mangrove clams, Geloina erosa and Geloina expansa. [LIPI] Research and Development of Marine Resources Oceanographic Research Center. Jakarta (IDN): Oceana. 31 38.
[9] [KEPMENLH] Decree of the Minister of the Environment. 2004. Number: 51. Criteria for Water Quality Standards for Biota. Jakarta.
[10] [KEPMENLH]. 2004. Number: 201. Standard Criteria and Guidelines for Determining Mangrove Damage. Jakarta.
[11] Kurniawan. 2007. Functions and Roles of Gastropods in Mangrove Ecosystems. Faculty of Postgraduate University of Indonesia. Jakarta.
[12] Lestarina, P.M., and Dharmaji, D. 2020. Secondary Productivity of the Macrozoobenthos Community in the
ISSN: 2456 1878 (Int. J. Environ. Agric. Biotech.) https://dx.doi.org/10.22161/ijeab.75.16
Mangrove Ecosystem of Kuala Tambangan Village, Takisung District. Proceedings of the National Wetland Environment Seminar, Vol, 5, No, 2.
[13] Lestarina, P.M., Salim, D., and Selviani. 2020. Analysis of Mangrove Litter Productivity in Muara Pagatan Village, Tanah Bumbu, South Kalimantan. Fish Scientiae, Vol, 10, No, 2.
[14] Levinton, J. S. 1982. Marine Biology. Prentice Hall Inc. New Jersey. USA.
[15] Odum, E.P. 1993. Fundamentals of Ecology. Tjahjono Samingan's translation. Third Edition. Yogyakarta: Gadjah Mada University Press.
[16] Odum, E, P., 1994. Fundamentals of Ecology. Gadjah Mada.
[17] Peter, K.L.N, and N. Sivatoshi. 2001. A Guide to Mangroves of Singapore. Singapore Science Center, Singapore.
[18] Riniasih, I. 2015. Distribution of Suspended Solids Load (MPT) in Seagrass Fields in the waters of Teluk Awur and Prawean Beach, Jepara. Tropical Marine Journal.
[19] Rosenberg, D.M. and V. H. Resh. 1993. Freshwater Biomonitoring and Benthic Macroinvertebrates. Chapman and Hall. New York. London. hlm. 125 127.
[20] Sahami, F. 2003. Bivalve Community Structure in the Donan River and Sapuregel River Estuary Areas of Cilacap. Scientific Journal of Tropical Agroscience Vol 2 No. 3
[21] Salim, D., Lestarina, P.M., and Fitriana, Rr.B. 2020. Diversity of Gastropods in Mangrove Forests in Muara Pagatan Village, South Kalimantan. Proceedings of the National Wetland Environment Seminar, Vol, 5, No, 3.
[22] Silulu P.F, et al. 2013. Biodiversity of Oyster Shellfish (Mollusca, Bivalvia) in the Intertidal Area of West Halmahera, North Maluku. Platax Scientific Journal, Vol. I 2, January 2013, ISSN: 2302 3589, pages 67 73.
[23] Suryanto and Utojo. 2002. Oyster Growth at Different Spreads. Journal of Coastal Aquaculture Research.
[24] Suwondo, E. Febrita, and F. Sumati. 2005. Gastropod Community Structure in Mangrove Forest, Mentawai Islands, West Sumatra. Journal of Biogenesis Vol. 2, No.1.
[25] Taqwa, R. N., M. R. Muskananfala., Ruswahyuni. 2014. Study of Relationship between Base Substrate and Organic Matter Content in Sediment with Macrozoobenthos abundance in the Sayung River Estuary, Demak Regency. Journal of Maquares Management Of Aquatic Resources.
[26] Tony. F., Lestarina, P. M., Putra. A., Iskandar R. 2022. Amount Stock of Blue Carbon in Mangrove on the Area of Pt Arutmin Indonesia Kintap Mine Mekarsari Village, Tanah Laut Regency, South Kalimantan. International Journal of Environment, Agriculture, and Biotechnology (IJEAB). ISSN: 2456 1878, CrossRef DOI: 10.22161/ijeab.
[27] Tony, F., Soemarno, Wiadnya, D.G.R., and Hakim, L. 2020. Diversity of reef fish in Halang Melingkau Island, South Kalimantan, Indonesia. Biodiversity, Vol, 21, No, 10.
[28] Wilhm, J. L., and T. C. Doris. 1986. Biological Parameters for water quality Criteria. Bio. Science: 18.