Effect of elevated carbon dioxide on growth and development of Santalum album L. seedlings inoculated with plant growth promoting microorganisms in Open Top Chambers
Vipin Parkash
1Forest Pathology Section, Forest Protection Division, 2Forest Ecology Division, Forest Research Institute (Indian Council of Forestry Research & Education, Autonomous Council under Ministry of Environment, Forest & Climate Change, Government of India), Dehradun 248006, Uttarakhand, India.
*Corresponding author; ORCID https://orcid.org/0000 0001 7248 2430
Received: 22Sep2022; Receivedin revised form: 14Oct 2022; Accepted: 22 Oct 2022; Available online:28Oct 2022 ©2022 TheAuthor(s).Publishedby Infogain Publication. This is an open accessarticle under theCC BY license (https://creativecommons.org/licenses/by/4.0/).
Abstract Rising carbon dioxide (CO2) concentrations in atmosphere have a significant impact on plant growth and metabolism. Many plant growth promoting microbes play an important role in maintaining plant growth and vitality by facilitating nutrient translocation under adverse conditions. This study was carried out to investigate the effects of elevated CO2 on growth parameters (height of the seedlings, increment in height, collar diameter and number of leaves) in sandalwood (Santalum album L.) seedlings inoculated with beneficial microorganisms (Pseudomonas putida, Bacillus subtilis and Trichoderma harzianum) in the Open Top Chambers (OTCs). Sandalwood seedlings inoculated with P. putida, B. subtilis, T. harzianum were grown in OTCs at 600 ppm, 800ppm, 1000ppm and 1200ppm elevated concentrations of CO2 As compared to the non inoculated (untreated/control) plants, inoculated one shows a high growth and development rate but non inoculated plants were not able to handle stress at higher/elevated CO2 concentration (1000 & 1200ppm) and ultimately died after 60 days. P putida showed a high growth rate on all growth and development parameters taken up to 1000 ppm concentration of CO2 followed by Bacillus subtilis It is also observed that T. harzianum treatment could not withstand the elevated concentration of CO2 beyond 1000 to 1200 ppm whereas P. putida treatment was found to be effective at even at 1200 ppm of CO2. Through these experiments under OTCs at different elevated concentrations of CO2, we can predict the possibility of climate change and global warming effect on beneficial microbes and vis a vis their effect on growth, development and yield on crops. Hence, other plant growth microbes including mycorrhizal fungi can be analyzed for future research and bio prospect under OTCs experimentation
Keywords elevated carbon dioxide; open top chambers; plant growth microbes; sandalwood.
I. INTRODUCTION
Santalum album or tropical Indian sandalwood and it is one of the members of genus, Santalum, comprises of 16 species which are economically important and distributed globally (Shea et al. 1998) S album is immensely famous
ISSN: 2456 1878 (Int. J. Environ. Agric. Biotech.)

for its essential oil having santalol content but due to lack of sizeable trees, it is no longer used for fine woodworking as before (Srinivasan et al. 1992; Radomiljac and McComb 1999) The wood is commercially known as “East Indian Sandalwood” and internationally reflects as

Kumari Hunney
Hukum Singh
“Dollar earning parasite" (Durairaj and Kamaraj 2013). It has a history of more than 5000 years and India has been a hub for production and use of sandalwood in its different forms particularly sandalwood oil for medicine, cosmetics and perfumery (Hansda 2009).
Santalum album is a partial root parasite which requires a host for nutritional fulfillment The growth is severely affected in absence of a proper host. The Santalum roots produce a specialized structure called ‘haustoria’ for deriving the nutrients such as nitrogen and phosphorous from the soil (Teixeira da Silva et al. 2016), although, it is able to absorb calcium and potassium in a good manner (Iyengar 1965). Anthropogenic activities and emissions enhance the atmospheric carbon dioxide level which would result in global warming (Beardall and Raven 2004). Increased carbon dioxide (CO2) level also have an impact on S album growth parameters such as collar diameter, seedling height, number of leaves, photosynthetic rate and transpiration rate The rising CO2 concentration has a direct and indirect link with the growth and metabolism of plants and rhizospheric microbes as CO2 is a primary raw material in the process of photosynthesis. Many strains of bacteria and fungi enhance plant growth through bio inoculation, a method of introducing a microbial culture into the rhizosphere of the plants to maintain vitality and healthy growth. Hence, Plant Growth Promoting Rhizobacteria (PGPR) hold a special place whenever there is a talk of ‘bio fertilizers’ in general and particular But due to the increasing amount of carbon dioxide in atmosphere, there is a need to study the effect caused in the microbiota/microflora due to this factor Open Top Chambers (OTCs) offers micro environment surroundings, lower light intensity, higher relative humidity and a constant wind velocity (Leadley and Drake 1993) Hence, OTCs can be used to detect carbon dioxide and its effect on beneficial microbes and plants to predict the climatic change effect going to happen in near future Therefore, a study was carried out to see the effect of elevated carbon dioxide on growth and development of S. album seedlings inoculated with plant growth promoting microorganisms in OTCs.
II. MATERIAL AND METHODS
2.1. Study area:
The area for study was ‘New Forest Campus’, Forest Research Institute (FRI), Dehradun, Uttarakhand, India It is situated in Doon valley and this area is surrounded by west Himalayan ranges in north and Shiwalik ranges in south running parallel to it. This campus covers an area of 4.45 km2. It lies at an elevation of 660 m above sea level. The annual rainfall is over 200 cm, bulk of which falls as
ISSN: 2456 1878 (Int. J. Environ. Agric. Biotech.)
south west monsoon from June to September. The temperature ranges between 1 to 42° Celsius in winters to summers. The annual mean temperature stabilizes to 20 degree Celsius.
2.2. Collection of plants:
The sandalwood plants/seedlings were grown and collected from the Central Nursery, FRI, Dehradun. The seedlings were checked for any infection which was already either present in root trainers or plastic bags. The soil was also collected from the Central Nursery and used in sterilized condition in the plantation of seedlings in the OTCs.
2.3. Culturing of microorganisms for bio-inoculation:
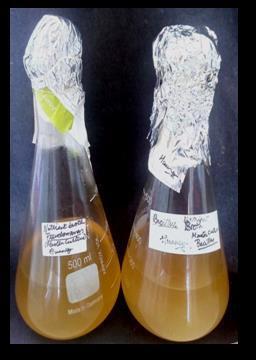
Two bacterial strains i.e. Pseudomonas putida (Pp 1), Bacillus subtilis (Bs I) and one fungal strain/species i.e. Trichoderma harzianum (Th I) were taken to study the response of plants/seedlings inoculated with them as these microbes are found in rhizosphere and help in nutrient mobilization in the rhizpspheric region (Figure 4)
Serial dilution method was adopted for isolation of bacteria (Johnson and Curl 1972) and fungi (Waksman 1927) from soil samples collected from the rhizosphere The fungal and bacterial species were identified based on several biochemical tests and their morphological features (Bergey et al. 1934; Rifai 1969; ABIS online Bacterial identification ABIS online respectively.
2.4. Mass multiplication of microbial cultures: 2.4.1. Pseudomonas putida and Bacillus subtilis
The culture was mass multiplied in Nutrient Broth (NB) medium (Figure 5). The designated amount of nutrient broth was dissolved fully in 300 ml of distilled water. The nutrient media was then autoclaved under high pressure for 20 25 minutes. This process must ensure that the media is free of any contamination. A master culture was prepared by inoculating them under the Laminar Air Flow (LAF) chamber and incubating the culture for a couple of days. Also for checking the maximum growth period, 9 ml of autoclaved NB medium was taken in test tubes. These were inoculated with 1ml of target bacterial culture. The test tubes were then kept in B.O.D. shaker cum incubator. Each test tube was then monitored every hour with the growth of the inoculation. For this process, absorbance of each test tube solution was taken every hour through a UV VIS Spectrophotometer at 600 nm. Results indicated that maximum growth for Bacillus subtilis was found at 10:30 hours and that of Pseudomonas putida at 11:30 hours of duration. This step also helped to know the incubation period for mass culture of these bacteria for further experiments.
Parkash2.4.2. Trichoderma harzianum multiplication
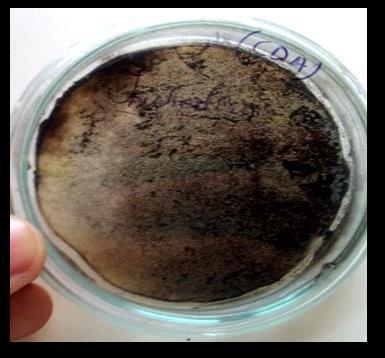
A mixture of saw dust, wheat bran and sterilized distilled water was made in the ratio of 1: 3: 4. The circular pieces of inoculum so isolated were then placed into each of the bag of mixture. The culture was then put in a B.O.D. (Biological Oxygen Demand) incubator at a temperature of 27º C ± 2º C for three to four days to obtain the mass culture for Trichoderma harzianum. The CFUs (Colony Forming Units) analysis for the saw dust mixture revealed that the mixture has 3.4×10⁷ colony forming units per gram in it (Figures 5 & 6)
2.5. Inoculation of microbes into the rhizosphere of Sandalwood seedlings:
Three healthy seedlings of same height were planted safely along with the host (Alternanthera species) in poly bags (12 × 12 inch). The soil so used was first autoclaved. For bacterial inoculations, which are in liquid state, the inoculation so used was ten percent of the soil used. For each seedling 50 ml of inoculum was used in 500 g soil. For Trichoderma inoculation the inoculum was weighed to ten percent of soil. The sawdust mixture was mixed with the soil in each poly bag to help in the inoculation of the fungus in the rhizosphere of the plants
2.6 Experimental design and statistical analysis:
The OTCs were already been adjusted to provide a desired concentration of carbon dioxide in the chamber (size, L×W×H; 3×3×4 m with 40 50% humidity and 27 29 ºC temperature ) which can be adjusted as well and can alters the microenvironment of the plants. The optimum concentration of CO2 in Doon valley was found to be 440 ppm (Dehradun, Uttarakhand, India). These chambers were provided/fixed with elevated 600, 800, 1000, 1200 ppm concentrations, hence, seedlings may respond to the altered microclimate in these chambers through various mechanisms like morphological, anatomical or physiological changes. The growth parameters taken under consideration were increment in height, collar diameter, number of leaves and microbial rhizospheric colonization/population in CFUml 1 The experimental design opted for the purpose was CRD (Completely Randomized Design) with three replicates. The data were statistically analyzed.
III. RESULTS AND DISCUSSION
Sandalwood seedlings were kept in the carbon dioxide rich atmosphere i.e. OTCs and different growth parameters were studied under various inoculated treatments till 90 days.
The comparison of collar diameter (mm) of sandalwood seedlings
ISSN: 2456 1878 (Int. J. Environ. Agric. Biotech.)
Parkashdiameter in P putida treatment was maximum at 800, 1000, and 1200 ppm of CO2 concentrations than other treatments after 30 days (Fig. 1).
The most important finding after 60 days of observations was that the collar diameter in Pseudomonas putida treatment was greater at different concentrations i.e. 600 ppm, 800 ppm, 1000 ppm, and 1200 ppm of CO2 than other treatments. In this finding, except for the 600ppm concentration of CO2, all the concentrations of CO2 in P putida treatment showed the increased collar diameter as compared to other treatments; however, the untreated/control seedlings have lesser collar diameter as compared to other treatments. The same finding was found after 90 days of observation (Fig. 1).
After 90 days of inoculation, there has been a significant increase in collar diameter of the seedlings with inoculation than control (untreated) seedlings. The maximum enhancement in collar diameter growth is shown by the sandalwood seedlings inoculated with Pseudomonas putida at 1000 ppm of CO2 concentration. The seedlings inoculated with Bacillus subtilis also showed a good increasing trend in collar diameter measurement. Out of the all treatments, Pseudomonas putida also showed a good expansion in diameter at 1200 ppm of CO2 concentration which is not seen so pronounced in the other treatments. The untreated (control) seedlings have the minimum collar diameter (1.8 2.2 mm) than other treatments (Fig. 1).
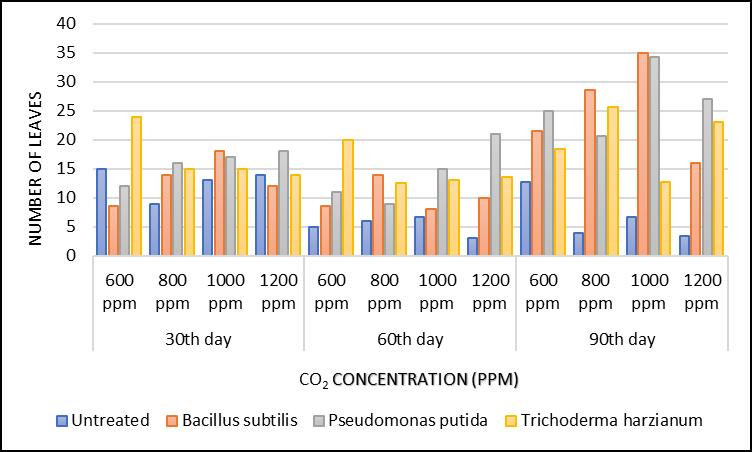
Although, Trichoderma harzianum treatment showed more number of leaves per plant at 600 ppm CO2 concentration after 30 days of inoculation but Bacillus subtilis and Pseudomonas putida treatments produced lower numbers of leaves per plant than the control seedlings at 600 ppm CO2 concentration after 30 days of inoculation. At 1200 ppm CO2 concentrations, Pseudomonas putida treatment showed more number of leaves per plant than other treatments
After 60 days of inoculation, Trichoderma harzianum treatment had more number of leaves, whereas Pseudomonas putida treatment had maximum number of
ISSN: 2456 1878 (Int. J. Environ. Agric. Biotech.)
https://dx.doi.org/10.22161/ijeab.75.15
leaves at 1200 ppm, concentrations than other treatments. The control seedlings have less number of leaves than other treatments (Fig.2)
Bacillus subtilis and Pseudomonas putida treatments exhibited the same number of leaves at 1000 ppm CO2 concentration after 90 days of observation. Whatsoever, these findings have revealed that when we compared the data with the control or other treatments then P putida treatment seedlings were growing at their fastest rate at 1000 ppm and 1200 ppm of CO2 concentrations The inoculated seedlings showed an enhanced resilience to stresses which is exhibited through an increase in growth
ParkashThe comparison of number of leaves in sandalwood seedlingsFig 2. A histogram graphical representation of comparison of number of leaves of sandalwood seedlings after 30th, 60th and 90th day under different treatments
parameters. Each type of microorganisms has its own ‘niche’ of performance. Trichoderma harzianum treatment performs best at 800 ppm and those of both bacterial
strains in treatments perform best at 600ppm and 1000 ppm of CO2 concentration respectively (Fig. 2)
The comparison of increment in height of sandalwood seedlings
Fig 3. A histogram graphical representation of comparison of increase in height of sandalwood seedlings after 30th, 60th and 90th day under different treatments. The data was analysed statistically for analysis of variance. There was a significant growth effect of all bioinoculants on seedlings at P <0.05 for different time intervals (F=4.94; p=0.027).
After 30 days of observation, the increment in seedling height at 600 ppm, 1000 ppm, and 1200 ppm of CO2 concentrations was maximum in the control/untreated treatment as compared to the other treatments, but at 800 ppm CO2 concentration, the Bacillus subtilis treatment exceeded the control in height increment After 60 and 90 days of inoculation period, the Pseudomonas putida treatment showed increment in height of seedlings as compared to control treatment (Fig. 3). Increment in height of sandalwood seedlings inoculated with Pseudomonas putida showed preeminent results in comparison to other treatments as far as increment in height is concerned followed by Bacillus subtilis treatment
Bacillus subtilis also showed good effect on height in comparison to control/untreated treatment
Inoculation with Trichoderma harzianum treatment also exihibited height increment than the untreated sandalwood seedlings but pace of growth was rather slow as compared to Pseudomonas putida treatment (Figure 6)
Effect on microbial bioagents population due to high CO2 concentration in OTCs after 45 days, the CFUml 1 count varies at different concentrations of CO2. At different concentrations of CO2 (i.e. 600ppm, 800ppm, 1000ppm, and 1200ppm), the highest CFUml 1 count was seen in Pseudomonas putida treatment than Bacillus subtillis treatment where the CFU.ml 1count was higher than in Trichoderma harzianum treatment
ISSN: 2456 1878 (Int. J. Environ. Agric. Biotech.)
ParkashColony Forming
90 days of inoculation, the number of bacterial colonies have grown slightly but this is due to the fact that the bacteria exhibited
Although,
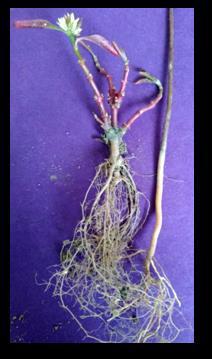
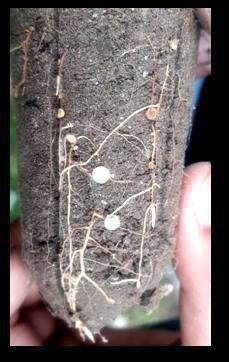
phase which indicates that they haven't divided but are still metabolically active in the rhizosphere of inoculated seedlings The houstoria were also seen in the roots association of both host and Santalum album seedlings (Figure 5). The control/untreated seedlings do not have any bacterial and fungal colony as no bioagents was put into the control set in sterilized soil condition (Tables 1&2).
on microbial bioagents population due to elevated CO2 concentration in OTCs after 45 and 90 days are shown in following Tables 1 & 2
exposed to elevated CO2 often show increased growth and water use efficiency (Rogers and Dahlman 1993; Allen and Amthor 1995; Wittwer 1995) and increased rates of photosynthesis (Long and Drake 1992; Amthor 1995). Plants exposed to elevated atmospheric CO2 are almost always larger than those grown in ambient CO2. The magnitude of growth stimulation is typically dependent upon photosynthetic pathway, sink strength, phenotypic plasticity and plant life history strategies (Hunt et al. 1991). Elevated CO2 also increased the photosynthesis rates of young and fully expanded leaves by 35 46% and of whole plants by more than 50% (Ryle et al., 1992) The most surprising feature of the experimental results was that the observed increases in rates of leaf and whole plant photosynthesis in elevated CO2 had, relatively, a very small effect on plant growth (Ryle et al. 1992). Elevated CO2 affected plant weight in the first 10 20 days but development constrained the branch numbers In this study also, when we compared the data with the control or other treatments then P putida treatment seedlings were growing at the fastest rate at higher 1000 ppm and 1200 ppm of CO2 concentrations Subsequently, according to Ryle et al. (1992) when mature leaf axils provide a potential increase in tillers, it might be expected that plant weight would have accelerated even faster in elevated CO2. This never occurred, for tiller
numbers from both CO2 concentrations increased. This imposed a severe restriction on potential growth in elevated CO2 because the weight increases which can be achieved on a single axis are constrained by the environmental and ontogenetic control of leaf length and width and ability to store unused carbohydrate
Growth analysis of two Eucalyptus species (e.g. Eucalyptus macrorhyncha and Eucalyptus rossii) indicated that increased CO2 may allow Eucalyptus species to perform better during conditions of low soil moisture. Tissue et al. (1993) observed down regulation of photosynthetic capacity in seedlings grown in elevated CO2 when well watered but not when water stressed. The down regulation of photosynthesis of plants grown in elevated CO2 is often associated with starch accumulation (Tissue et al., 1993). Plants grown in elevated CO2 had greater leaf, stem and total biomass than plants grown in ambient CO2 Similar findings are observed in this experiment where Trichoderma harzianum treated seedlings had more number of leaves in general, whereas Pseudomonas putida treated seedlings had maximum number of leaves at 1200 ppm, concentrations respectively. The control seedlings have less number of leaves than other treatments.
Although, there is a report on elevated CO2 that it had had no effect on the vegetative attributes of Cardamine hirsuta, Spergula arvensis and Poa annua whereas Senecio vulgaris produced longer leaves and greater biomass. Both Senecio and Poa species had faster maturation times. The vegetative response of Senecio vulgaris was not translated into increased seed output, although, seed mass and carbon: nitrogen ratios were significantly increased. By contrast, Poa species showed no vegetative response to elevated CO2, but had significantly increased seed production. Maximum biomass may be achieved under elevated CO2 when other resources are not limiting, the relative enhancement of biomass owing to elevated CO2 may be greatest under conditions of low resources, such as light (Zangerl and
Bazzaz 1984; Bazzaz and Miao 1993). None of the above four plant species showed responses to elevated CO2 during germination and early growth (up to 16 days after sowing).There were no differences in the early growth (16 days post sowing) responses of the four plant species to elevated CO2. Carbon dioxide concentrations near the soil surface may not be well correlated with canopy or atmospheric concentrations. The CO2 concentrations near the soil surface being far higher because of soil microbial activity than at greater heights in the canopy (Bazzaz and Williams 1991) and hence, elevated CO2 significantly increased the total biomass of the seedlings. The combined effect of the elevated CO2 and temperature treatments further increased the total biomass, but not significantly. There are reports that the content of nitrogen and water decreased, while some secondary compounds (such as condensed tannins and flavanols glycosides) increased in leaves subjected to CO2 enrichment (Kuokkanen et al. 2001)
The total biomass of the seedlings was increased by CO2 enrichment but not by the temperature (Kellomäki and Wang 1998). The seedling biomass in the field control was significantly smaller than that in the control chambers. The nitrogen and water content were significantly decreased by CO2 enrichment, but not by increased temperature or an increase in both factors. The greatest amount of biomass was produced in the elevated CO2 and elevated temperature combination. However, this result supports the widely held prediction that the growth of forest trees in the boreal zone will be enhanced by the “fertilization effect” of CO2 and lengthening of the growth season as result of higher air temperatures (2 4° C) (Kellomäki and Väisänen 1997; Kellomäki and Wang
1998) A doubling of the atmospheric CO2 concentration enhanced plant growth and significantly increased stomatal index also. However, there was no significant change in relative stomatal density in Alnus glutinosa plants grown in the elevated CO2 concentration showed an overall general increase in growth of the measured parameters relative to those grown at ambient CO2. There was a significant increase in the number of branches and a decrease in specific leaf area with elevated CO2, but no significant increase in plant height, number of leaves and absolute leaf area. This supports the general observation that an increase in atmospheric CO2 concentration enhances overall plant growth (McKee et al. 1995; Long et al. 1996; Mulholland et al. 1998). In this study also, it is found that the higher concentration of CO2 in control chambers suppressed the plant height and development than inoculated one but only Psedomanas putida and Bacillus subtilis treatments withstand the higher concentration of CO2 and resulted in the good growth of inoculated seedlings. Whereas, the Trichoderma harzianum inoculated seedlings had lower growth effect due to elevated CO2 level (1000 1200ppm) concentration. It is also evident from the microbial population study from the rhizosphere of inoculated seedlings after 90 days of inoculation that the bacteria especially P. putida is more resistant to elevated CO2 concentration followed by B. subtilis. Whereas, the fungal bioagent i.e. T. harzianum is vulnerable at higher concentration of elevated CO2 (1000 1200 ppm) than bacterial bioagents i.e. P. putida and B. subtilis It might be due to endospore formation in bacterial bioagents than fungal bioagent as a result of elevated CO2 concentration stress.

2456 1878 (Int.

Environ.


IV. CONCLUSION

In the present study, Pseudomonas putida treatment showed a high growth rate on growth parameters up to the increased concentration of 1000 ppm of CO2 in comparison to another treatments and untreated control. But further increment in CO2 concentration up to 1200 ppm, the growth of seedlings is enhanced, but the pace of growth slowed down a little bit. The seedlings without any inoculation showed an increment in growth till 30 days only after which stagnation in growth of the seedlings has


been seen. The plants were not able to handle stress at higher CO2 concentration and ultimately they die after 60 days in control/untreated set But the seedlings inoculated with microbial inoculants withstood the stress of higher concentration of CO2 and showed good growth and development. The study can also be used to predict the effect of increasing carbon dioxide concentration in the atmosphere on the growth and development of plants. This can also help to know the saturation effect of carbon dioxide on vegetation also Although, it is indicating that


‘
CO2 chamber fertilization effect’ does not always hold true. In the wake of climate change phenomenon, there is a talk of adaptive and mitigation strategies to enhance the resilience of a plant species to reduce its vulnerability. ‘Bio fertilization’ can help us on this front by serving the dual purpose of enhancing the growth as well as resilience of a plant species. Nevertheless, this type of study has been less conducted in forestry plant species/crops and it is only a small step taken in the direction to measure the effect of microbial bio fertilization on this aspect.
ACKNOWLEDGEMENT
The senior author is particularly thankful to the Director, Forest Research Institute, Dehradun and Indian Council of Forestry Research & Education (ICFRE), Dehradun, Uttarakhand, India for providing funding and facilitating the research activities in laboratories under Forest Pathology Section.
REFERENCES
[1] Allen Jr. L. H., Amthor J. S. 1995. Plant physiological responses to elevated CO2, temperature, air pollution and UV B radiation. Biotic feedbacks in the global climatic system: Will thewarming feedthewarming, pp.51 84.
[2] Amthor J. S. 1995. Terrestrial higher‐plant response to increasing atmospheric (CO2) in relation to the global carbon cycle. GlobalChangeBiology, 1(4):243 274.
[3] Bazzaz F. A., Miao S. L. 1993. Successional status, seed size, and responses of tree seedlings to CO2, light, and nutrients. Ecology,74(1):104 112.
[4] Bazzaz F. A., Williams W. E. 1991. Atmospheric CO2 Concentrations within a mixed forest: Implications for seedlinggrowth. Ecology, 72(1):12 16.
[5] Beardall J., Raven J.A. 2004. The potential effect of global climate change on photosynthesis , growth and ecology. Phycologia,43(1): 26 40
[6] Bergey D.H., Breed R.S., Murray E.G.D., Harrison F.C (eds.) 1934. Bergey’s manual of systematic bacteriology. International JournalofSystematicBacteriology,pp.408.
[7] Durairaj P., Kamaraj M. 2013. Assessment and conservation strategies for Santalum album in Manmalai RF of Thuraiyur range at Tiruchirappalli district. International Journal of Humanities, Arts, Medicineand Sciences, 1(1):1 12.
[8] Hansda R. 2009. The outlook for non wood forest products in Asia and the Pacific, Working Paper No. APFSOS II/WP/2009/18, Food and Agriculture Organizations Regional Office, Bangkok, pp. 89.
[9] Hunt R., Hand D. W., Hannah M. A., Neal A. M. 1991. Response to CO2 enrichment in 27 herbaceous species. FunctionalEcology, 410 421.
[10] Iyengar A. 1965. The Physiology of Root parasitism in Sandal (Santalum album Linn.) Part II. Indian Forester, 91(5): 341 355.
[11] Johnson L.F., Curl E.A. 1972. Methods for research on the ecology of soil borne plant pathogens. Burgess Pub. Co., Sixth St. Minnneapolis, Minnesota, USA, pp.247.
ISSN: 2456 1878 (Int. J. Environ. Agric. Biotech.) https://dx.doi.org/10.22161/ijeab.75.15
[12] Kellomäki S., Wang K. Y. 1998. Sap flow in Scots pines growing under conditions of year‐round carbon dioxide enrichment and temperature elevation. Plant, Cell & Environment, 21(10):969 981.
[13] Kellomäki S., Väisänen H. 1997. Modelling thedynamics of the forest ecosystem for climate change studies in the boreal conditions. Ecological Modelling,97(1 2):121 140.
[14] Kuokkanen K., Julkunen Tiitto R., Keinänen M., Niemelä P., Tahvanainen J. 2001. The effect of elevated CO2 and temperature on the secondary chemistry of Betula pendula seedlings.Trees, 15(6):378 384.
[15] Leadley P.W., Drake B.G. 1993. Open top chambers for exposing plant canopies to elevated CO2 concentration and for measuring net gas exchange. Vegetation, 104 105(1): 3 15.
[16] Long S. P., Drake B. G. 1992. Photosynthetic CO2 assimilation and rising atmospheric CO2 concentrations. Topics in photosynthesis. Crop Photosynthesis: Spatial and Temporal Determinants, (eds.) Baker N R , H Thomas, Amsterdam: Elsevier Sci., 2: 69 107.
[17] Long S. P., Osborne C. P., Humphries S. W. 1996. Photosynthesis, rising atmospheric carbon dioxide concentration and climate change. Scope scientific committee on problems of the environment international councilof scientific unions,56:121 159.
[18] McKee I. F., Farage P. K., Long S. P. 1995. The interactive effects of elevated CO2 and O3 concentration on photosynthesis in spring wheat. Photosynthesis Research, 45(2):111 119.
[19] Mulholland B. J., Craigon J., Black C. R., Colls J. J., Atherton J., Landon G. 1998. Growth, light interception and yield responses of spring wheat (Triticum aestivum L.) grown under elevated CO2 and O3 in open‐top chambers. Global ChangeBiology, 4(2):121 130.
[20] Radomiljac A. M., Mc Comb J. A. 1999. Intermediate host influences on the root hemiparasite Santalum album L. biomass partitioning. Forest Ecology Management, 113(3): 143 153.
[21] Rifai M. 1969. A Revision of Genus Trichoderma. Mycol. Path., 116:1 56.
[22] Rogers H. H., Dahlman R. C. 1993. Crop responses to CO2 enrichment. In: CO2 and Biosphere, Springer, Dordrecht., pp.117 131.
[23] Ryle G. J. A., Powell C. E., Tewson V. 1992. Effect of elevated CO2 on the photosynthesis, respiration and growth of perennial ryegrass. Journal of Experimental Botany, 43(6): 811 818.
[24] Shea S. R., Radomiljac A. M., Brand J., Jones P. 1998. An overview of sandalwood and the development of sandal in farm forestry in Western Australia. Sandal and its Products. Edited by A. M. Radomiljac, H. S. Ananthapadmanabha, R. M. Welbourn, and K.Satyanarayana Rao. Proc. of ACIAR. No. 84. ACIAR,Canberra, Australia, pp.915.
[25] Srinivasan V. V., Sivaramakrishnan V. R., Rangaswamy C. R., Ananthapadmanabha H. S., Shankaranarayana K. H. 1992. Sandal (Santalum album L.), Indian Council of Forestry Research and Education Publications, Bangalore, pp:223.
[26] Teixeira de Silva, J. A. Mafatlal, K. M. Deepak, S. Tony, P. Xinhua, Z. Nataraj, M. Guohua, M. 2016 Sandalwood:
basic biology, tissue culture, and genetic transformation. Planta,243(4):847 887.
[27] Tissue D. T., Thomas R. B., Strain B. R. 1993. Long‐term effects of elevated CO2 and nutrients on photosynthesis and rubisco in loblolly pine seedlings. Plant, Cell & Environment, 16(7): 859 865.
[28] Waksman S.A. 1927. Principal of soil microbiology, Williams &Wilkins, Waltimore,Md. USA.
[29] Wittwer S. H. 1995 Food, climate, and carbon dioxide: the global environment and world food production. CRC press, FL
[30] Zangerl A. R., Bazzaz, F. A. 1984. The response of plants to elevated CO2 Oecologia, 62(3): 412 417.
ISSN: 2456 1878 (Int. J. Environ. Agric. Biotech.) https://dx.doi.org/10.22161/ijeab.75.15
Parkash et al. International Journal of Environment, Agriculture and Biotechnology, 7(5)