Year
2008
2009
2010
2011
2012
2013
total
2,046,898
2,050,671
2,055,004
2,058,539
2,061,044
2,064,032
122,757
0-4
112,825
112,671
113,866
114,994
115,578
116,116
143,184
5-9
121,202
119,468
117,156
114,407
113,143
112,634
160,339
10-14
139,813
134,704
130,214
126,947
123,721
121,033
Year
1981
1981
1994
2002
total
1,909,136
2,033,964
1,945,932
2,022,547
0-4
191,642
154,549
152,456
5-9
184,854
167,433
163,546
10-14
178,681
165,970
167,921
Population according to age \ Censuses
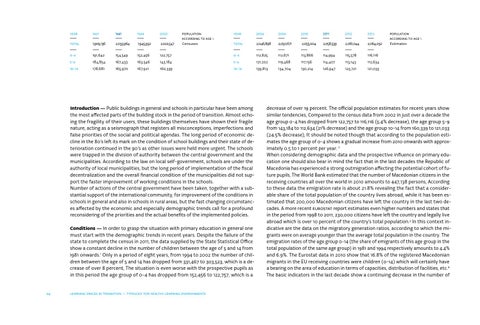
Introduction — Public buildings in general and schools in particular have been among the most affected parts of the building stock in the period of transition. Almost echoing the fragility of their users, these buildings themselves have shown their fragile nature, acting as a seismograph that registers all misconceptions, imperfections and false priorities of the social and political agendas. The long period of economic decline in the 80’s left its mark on the condition of school buildings and their state of deterioration continued in the 90’s as other issues were held more urgent. The schools were trapped in the division of authority between the central government and the municipalities. According to the law on local self-government, schools are under the authority of local municipalities, but the long period of implementation of the fiscal decentralization and the overall financial condition of the municipalities did not support the faster improvement of working conditions in the schools. Number of actions of the central government have been taken, together with a substantial support of the international community, for improvement of the conditions in schools in general and also in schools in rural areas, but the fast changing circumstances affected by the economic and especially demographic trends call for a profound reconsidering of the priorities and the actual benefits of the implemented policies. Conditions — In order to grasp the situation with primary education in general one must start with the demographic trends in recent years. Despite the failure of the state to complete the census in 2011, the data supplied by the State Statistical Office show a constant decline in the number of children between the age of 5 and 14 from 1981 onwards.1 Only in a period of eight years, from 1994 to 2002 the number of children between the age of 5 and 14 has dropped from 331,467 to 303,523, which is a decrease of over 8 percent, The situation is even worse with the prospective pupils as in this period the age group of 0-4 has dropped from 152,456 to 122,757, which is a
24
learning spaces in transition \ TYPOLOGY FOR HEALTHY LEARNING ENVIRONMENTS
Population according to age \ Estimates
decrease of over 19 percent. The official population estimates for recent years show similar tendencies, Compared to the census data from 2002 in just over a decade the age group 0-4 has dropped from 122,757 to 116,116 (5.4% decrease), the age group 5-9 from 143,184 to 112,634 (21% decrease) and the age group 10-14 from 160,339 to 121,033 (24.5% decrease), It should be noted though that according to the population estimates the age group of 0-4 shows a gradual increase from 2010 onwards with approximately 0.5 to 1 percent per year. 2 When considering demographic data and the prospective influence on primary education one should also bear in mind the fact that in the last decades the Republic of Macedonia has experienced a strong outmigration affecting the potential cohort of future pupils, The World Bank estimated that the number of Macedonian citizens in the receiving countries all over the world in 2010 amounts to 447,138 persons, According to these data the emigration rate is about 21.8% revealing the fact that a considerable share of the total population of the country lives abroad, while it has been estimated that 200,000 Macedonian citizens have left the country in the last two decades. A more recent EUROSTAT report estimates even higher numbers and states that in the period from 1998 to 2011, 230,000 citizens have left the country and legally live abroad which is over 10 percent of the country’s total population.3 In this context indicative are the data on the migratory generation ratios, according to which the migrants were on average younger than the average total population in the country. The emigration rates of the age group 0-14 (the share of emigrants of this age group in the total population of the same age group) in 1981 and 1994 respectively amounts to 4.4% and 6.9%. The Eurostat data in 2010 show that 16.8% of the registered Macedonian migrants in the EU receiving countries were children (0-14) which will certainly have a bearing on the area of education in terms of capacities, distribution of facilities, etc. 4 The basic indicators in the last decade show a continuing decrease in the number of