
2023
ANNUAL REPORT

Building What Matters to Enable Future Generations to Thrive
2023 was a transformational year driven by key transactions that allowed Aecon to capture unlocked value, de-risk its portfolio, partner with respected institutions with significant experience to help Aecon grow, and strengthen Aecon’s balance sheet and capital position.
Cover Photo: Gordie Howe International Bridge Project –Windsor, ON and Detroit, MI
2023 Annual Report
This Page: Sir Adam Beck II Generating Station Transmission Line Replacement Project – Niagara Falls, ON
Dear Shareholders,
This past year was transformational for Aecon. Year-end 2023 results were underscored by revenue of $4.6 billion, backlog of $6.2 billion diversified across operating sectors, and robust recurring revenue programs. While overall profitability was impacted by four legacy projects,1 the year was marked by positive profitability trends in the balance of Aecon’s business, the successful completion of key strategic transactions, and contract awards linked to the energy transition.
Three strategic transactions allowed Aecon to capture unlocked value, de-risk its portfolio, partner with respected institutions with significant experience to help Aecon grow, and strengthen Aecon’s balance sheet and capital position:
• A strategic investment by Oaktree Capital Management, L.P. in 27.5% of Aecon Utilities Group Inc., through a net $150 million convertible preferred equity investment;
• The sale of a 49.9% interest in the L.F. Wade Bermuda International Airport concessionaire, Bermuda Skyport Corporation Limited, to Connor, Clark & Lunn Infrastructure for US$120 million; and
• The sale of Aecon Transportation East, a roadbuilding, aggregates and materials business in Ontario, to Green Infrastructure Partners for $235 million.
Aecon repaid in full the $184 million principal amount owed under its 5.0% unsecured convertible debentures at year-end, which were due on December 31, 2023.
Aecon was pleased to be awarded contracts for projects delivered under more collaborative models and which are also linked to decarbonization and the energy transition, including the Fuel Channel and Feeder Replacement contract for four units at the Bruce Nuclear Generating Station, Aecon’s partnership to deliver North America’s first grid-scale Small Modular Reactor at the Darlington nuclear site, and the Oneida Energy Storage project in Ontario. Aecon was also awarded a contract by Dominion Energy for the replacement of Condensers and Feedwater Heaters at the North Anna Power Station in Virginia.
Subsequent to year-end, Aecon executed a contract for the Contrecœur Terminal Expansion project in-water works under a progressive design-build approach in Québec and was awarded a contract for the Clayton J. Lloyd International Airport Redevelopment project in Anguilla. An Aecon-led consortium was also selected to redevelop the Cyril E. King Airport and the Henry E. Rohlsen Airport in the U.S. Virgin Islands under a collaborative design, build, finance, operate and maintain Public-Private Partnership model. Aecon Concessions is the development lead and will hold an equity interest in the project’s 40-year concession, and Aecon is the design-build lead. Financial close is expected following a nine-month transition period.
Building on these positive developments, Aecon was pleased to launch its renewed Forward Together 2024–2027 Strategic Plan, focusing on Building What Matters to Enable Future Generations to Thrive. The plan outlines:
• Where to play: Aecon has identified where it will focus and how it will engage in priority markets to ensure a de-risked portfolio while pursuing significant growth. While Aecon’s growth within Canada remains its primary focus, the U.S. and international infrastructure development and construction markets provide an opportunity to continue to diversify the business over time.
• How we win: Aecon is dedicated to three key focus areas – outstanding teams, execution excellence, and balancing between risk and opportunity – which will continue to be developed to secure a leading position, and more predictable and increased profitability in priority markets. Aecon remains committed to achieving its greenhouse gas emissions reduction goals, including achieving a 30% reduction in Scope 1 and 2 emissions by 2030 as compared to 2020 and net-zero by 2050. Aecon looks forward to publishing its 2023 Sustainability Report in April 2024, celebrating ongoing progress in Environmental, Social and Governance (ESG) practices.
Engaging with communities while supporting economic and community prosperity is an important part of Aecon’s ESG strategy. Building on Aecon’s inaugural Reconciliation Action Plan, Aecon was proud to achieve Silver Certification in Progressive Aboriginal Relations from the Canadian Council for Aboriginal Business, demonstrating progress in continuously working collaboratively with Indigenous Peoples to advance reconciliation. Aecon was also pleased to establish three key Indigenous-led joint ventures including Aecon Makhos Power Seven Generations (AMP7G), Aecon Cambium Indigenous Professional Services Seven Generations (AC7G) and Wicehtowak Aecon Industrial LP.
Moving forward, Aecon is dedicated to a Safety Always culture and the disciplined pursuit of operational excellence and profitable growth. Aecon’s goal is to build a resilient company through a balanced and diversified work portfolio across operating sectors, markets, geographies, project types, sizes and delivery models while enhancing critical execution capabilities and project selection to play to its strengths. Aecon is steadfast in leveraging self-perform capabilities and a One Aecon approach with a goal to maximize value for clients across its broad range of infrastructure services with improved schedule and cost certainty.
The completion and satisfactory resolution of claims on the four legacy projects remains a critical focus, while the remainder of the business continues to perform as expected, supported by the strong level of backlog and new awards during 2023, and the strong demand environment for Aecon’s services, including recurring revenue programs.
Thank you for your continued support.
Sincerely,
 John M. Beck
 Jean-Louis Servranckx Chairman President and Chief Executive Officer
1 For more information on the four large fixed-price legacy projects, see Section 5 “Recent Developments”, Section 10.2 “Contingencies” and Section 13 “Risk Factors” of the Company’s Management’s Discussion and Analysis for the fiscal year ended December 31, 2023 (the “2023 MD&A”).
1 2023 Annual Report
CO2
2023 Sustainability Highlights: Advancing the Energy Transition
Aecon Group Inc. 2
Aecon’s Purpose and Impact
Aecon’s purpose is to build what matters to enable future generations to thrive. Aecon builds and operates infrastructure that meets today’s needs while addressing tomorrow’s complex challenges, including the imperative to rapidly advance the energy transition. While performing this essential work, Aecon is committed to acting responsibly in every area of its business.
Aecon’s Sustainability Strategy is focused on two key areas:
• What we Build: From clean energy assets to sustainable transportation and water management infrastructure, Aecon is working with its clients to advance the energy transition and lay the foundations for thriving and sustainable communities.
• How we Build: Aecon is working with researchers, innovators, suppliers, leading public and private sector clients, and local and Indigenous communities to drive progress in sustainable construction.
2023 Performance Highlights
• 64% of revenue tied to sustainability projects*
• 75% share of backlog tied to sustainability projects*
• 20% cumulative reduction in Scope 1 and 2 emissions since 2020 based on revenue intensity
• in procurement of goods and services from the Indigenous economy
$275 million
• 0.89 total Recordable Injury Frequency
Awards and Recognition
In 2023, Aecon received the following sustainability awards and recognition:
• Silver Certification for Progressive Aboriginal Relations
Canadian Council for Aboriginal Business
• Sustainable Infrastructure Company of the Year
North American Business Awards
• Canada’s Top Contractors
On-Site Magazine
• Platinum Status
ReNew Canada (recognizing Aecon’s role in 6 of Canada’s 10 largest infrastructure projects)
• Best ESG Reporting (small cap)
IR Magazine Awards – Canada
• ESG Gold Award – Gordie Howe International Bridge Project
Canadian Council for Public-Private Partnerships
Sustainability Report
Aecon’s 2023 Sustainability Report, Advancing the Energy Transition , will be released in April 2024. To read the latest Sustainability Report and discover more about Aecon’s ESG performance, please visit aecon.com/sustainability.
* Sustainability projects help to preserve and protect the environment, but also help to preserve the ability of society to sustain itself. Including but not limited to projects that: reduce emissions, support the transition to a net-zero economy, support clean water use and conservation, and reduce/recycle waste. The definition of sustainability projects is based on the Sustainability Accounting Standards Board’s (“SASB”) definition of renewable energy projects and the Federal Government’s definition of Green Infrastructure under the Investing in Canada Infrastructure Program.
3 2023 Annual Report
Aecon Group Inc.
Management’s Discussion and Analysis of Operating Results and Financial Condition
December 31, 2023
Aecon Group Inc. 4
Management’s Discussion and Analysis of Operating Results and Financial Condition
December 31, 2023 TABLE
OF CONTENTS 2023 Annual Report 5 1. INTRODUCTION 6 2. FORWARD-LOOKING INFORMATION ...................................................................7 3. FINANCIAL REPORTING STANDARDS .................................................................8 4. NON-GAAP AND SUPPLEMENTARY FINANCIAL MEASURES ............................8 5. RECENT DEVELOPMENTS ................................................................................. 11 6. BUSINESS STRATEGY ........................................................................................13 7. CONSOLIDATED FINANCIAL HIGHLIGHTS ........................................................18 8. REPORTABLE SEGMENTS FINANCIAL HIGHLIGHTS .......................................22 8.1. CONSTRUCTION ..........................................................................................22 8.2. CONCESSIONS 24 9. QUARTERLY FINANCIAL DATA 25 10. FINANCIAL CONDITION, LIQUIDITY AND CAPITAL RESOURCES 30 10.1 INTRODUCTION 30 10.2. CONTINGENCIES 30 10.3. CASH AND DEBT BALANCES ....................................................................32 10.4. SUMMARY OF CASH FLOWS ....................................................................34 10.5. CAPITAL MANAGEMENT ............................................................................36 10.6. FINANCIAL INSTRUMENTS .......................................................................37 11. NEW ACCOUNTING STANDARDS ....................................................................38 12. SUPPLEMENTAL DISCLOSURES .....................................................................38 13. RISK FACTORS 40 14. OUTSTANDING SHARE DATA 61 15. OUTLOOK 62
Management’s Discussion and Analysis of Operating Results and Financial Condition (“MD&A”)
The following discussion and analysis of the consolidated results of operations and financial condition of Aecon Group Inc. (“Aecon” or the “Company”) should be read in conjunction with the Company’s audited consolidated financial statements and accompanying notes for the year ended December 31, 2023. This MD&A has been prepared as at March 5, 2024, when the Company’s Board of Directors approved this document. Additional information on Aecon is available through the System for Electronic Document Analysis and Retrieval+ (“SEDAR+”) at www.sedarplus.com and includes the Company’s Annual Information Form and other securities and continuous disclosure filings.
1. INTRODUCTION
Aecon currently operates in two principal segments within the infrastructure development industry: Construction and Concessions.
The Construction segment includes all aspects of the construction of both public and private infrastructure, primarily in Canada and, on a selected basis, internationally, and focuses primarily on the following market sectors:
• Civil Infrastructure;
• Urban Transportation Solutions;
• Nuclear Power Infrastructure;
• Utility Infrastructure; and
• Industrial Infrastructure.
Activities within the Concessions segment include the development, financing, build, and operation of construction projects, primarily by way of public-private partnership contract structures, as well as integrating the services of all project participants, and harnessing the strengths and capabilities of Aecon. The Concessions segment focuses primarily on providing the following services:
• Development of domestic and international Public-Private Partnership (“P3”) projects;
• Private finance solutions;
• Developing strategic partnerships;
• Leading and/or actively participating in development teams; and
• Operations and maintenance of infrastructure assets.
The infrastructure development industry in Canada is seasonal in nature for companies like Aecon that perform a significant portion of their work outdoors, particularly road construction and utilities work. As a result, less work is performed in the winter and early spring months than in the summer and fall months. Accordingly, Aecon has historically experienced a seasonal pattern in its operating results, with the first half of the year, and particularly the first quarter, typically generating lower revenue and profit than the second half of the year. Therefore, results in any one quarter are not necessarily indicative of results in any other quarter, or for the year as a whole.
Aecon Group Inc. 6
FORWARD-LOOKING INFORMATION
The information in this Management’s Discussion and Analysis includes certain forward-looking statements which may constitute forward-looking information under applicable securities laws. These forward-looking statements are based on currently available competitive, financial, and economic data and operating plans but are subject to risks and uncertainties. Forward-looking statements may include, without limitation, statements regarding the operations, business, financial condition, expected financial results, performance, prospects, ongoing objectives, strategies, and outlook for Aecon, including statements regarding: expectations regarding the impact of the four fixed price legacy projects and expected timelines of such projects; backlog and estimated duration; the impact of certain contingencies on Aecon (see: Section 10.2 “Contingencies”); the uncertainties related to the unpredictability of global economic conditions; its belief regarding the sufficiency of its current liquidity position including sufficiency of its cash position, unused credit capacity, and cash generated from its operations; its strategy of seeking to differentiate its service offering and execution capability and the expected results therefrom; its efforts to maintain a conservative capital position; expectations regarding the pipeline of opportunities available to Aecon; statements regarding the various phases of projects for Aecon; its strategic focus on projects linked to decarbonization, energy transition and sustainability, and the opportunities arising therefrom; expectations regarding ongoing recovery in travel through Bermuda International Airport in 2024 and opportunities to add to the existing portfolio of Canadian and international concessions in the next 12 to 24 months; Oaktree’s (defined below) minority investment in Aecon Utilities (defined below), the expected benefits thereof and results therefrom, including the acceleration of growth of Aecon Utilities in Canada and the U.S.; the anticipated use of proceeds from the investment; and the expansion of Aecon Utilities’ geographic reach and range of services in the U.S. Forward-looking statements may in some cases be identified by words such as “will,” “plans,” “schedule,” “forecast,” “outlook,” “potential,” “seek,” “strategy,” “may,” “could,” “might,” “can,” “believes,” “expects,” “anticipates,” “estimates,” “projects,” “intends,” “prospects,” “targets,” “occur,” “continue,” “should” or the negative of these terms, or similar expressions. In addition to events beyond Aecon’s control, there are factors which could cause actual or future results, performance or achievements to differ materially from those expressed or inferred herein including, but not limited to: the risk of not being able to drive a higher margin mix of business by participating in more complex projects, achieving operational efficiencies and synergies, and improving margins; the risk of not being able to meet contractual schedules and other performance requirements on large, fixed priced contracts; the risk of not being able to meet its labour needs at reasonable costs; the risk of not being able to address any supply chain issues which may arise and pass on costs of supply increases to customers; the risk of not being able, through its joint ventures, to enter into implementation phases of certain projects following the successful completion of the relevant development phase; the risk of not being able to execute its strategy of building strong partnerships and alliances; the risk of not being able to execute its risk management strategy; the risk of not being able to grow backlog across the organization by winning major projects; the risk of not being able to maintain a number of open, recurring, and repeat contracts; the risk of not being able to accurately assess the risks and opportunities related to its industry’s transition to a lower-carbon economy; the risk of not being able to oversee, and where appropriate, respond to known and unknown environmental and climate change-related risks, including the ability to recognize and adequately respond to climate change concerns or public, governmental, and other stakeholders’ expectations on climate matters; the risk of not being able to meet its commitment to meeting its greenhouse gas emissions reduction targets; the risks associated with the strategy of differentiating its service offerings in key end markets; the risks associated with undertaking initiatives to train employees; the risks associated with the seasonal nature of its business; the risks associated with being able to participate in large projects; the risks associated with legal proceedings to which it is a party; the ability to successfully respond to shareholder activism; the risk that Aecon will not realize the anticipated balance sheet strength while preserving capital for other long-term growth and concession opportunities in connection with the sale of ATE (defined below) and a 49.9% equity interest in Skyport (defined below); the risk that Aecon will not realize the opportunities presented by a transition to a net-zero economy; risks associated with
2.
2023 Annual Report 7
future pandemics and Aecon’s ability to respond to and implement measures to mitigate the impact of such pandemics; the risk that the strategic partnership with Oaktree will not realize the expected results and may negatively impact the existing business of Aecon Utilities; the risk that Aecon Utilities will not realize the anticipated balance sheet flexibility with the completion of the investment; and the risk that Aecon Utilities will not realize opportunities to expand its geographic reach and range of services in the U.S.
These forward-looking statements are based on a variety of factors and assumptions including, but not limited to that: none of the risks identified above materialize, there are no unforeseen changes to economic and market conditions and no significant events occur outside the ordinary course of business. These assumptions are based on information currently available to Aecon, including information obtained from third-party sources. While the Company believes that such third-party sources are reliable sources of information, the Company has not independently verified the information. The Company has not ascertained the validity or accuracy of the underlying economic assumptions contained in such information from thirdparty sources and hereby disclaims any responsibility or liability whatsoever in respect of any information obtained from third-party sources.
Risk factors are discussed in greater detail in the Section 13 - “Risk Factors” in this MD&A which is available on SEDAR+ at www.sedarplus.com. Except as required by applicable securities laws, forward-looking statements speak only as of the date on which they are made and Aecon undertakes no obligation to publicly update or revise any forward-looking statement, whether as a result of new information, future events or otherwise.
3. FINANCIAL REPORTING STANDARDS
The Company’s audited consolidated financial statements and the accompanying notes for the year ended December 31, 2023 were prepared in accordance with International Financial Reporting Standards as issued by the International Accounting Standards Board (“IFRS Accounting Standards”).
All financial information in this MD&A is presented in Canadian dollars, unless otherwise indicated.
4. NON-GAAP AND SUPPLEMENTARY FINANCIAL MEASURES
The MD&A presents certain non-GAAP and supplementary financial measures, as well as non-GAAP ratios to assist readers in understanding the Company’s performance (“GAAP” refers to Generally Accepted Accounting Principles under IFRS Accounting Standards). These measures do not have any standardized meaning and therefore are unlikely to be comparable to similar measures presented by other issuers and should not be considered in isolation or as a substitute for measures of performance prepared in accordance with GAAP.
Throughout this MD&A, the following terms are used, which do not have a standardized meaning under GAAP.
Non-GAAP Financial Measures
A non-GAAP financial measure: (a) depicts the historical or expected future financial performance, financial position or cash flow of the Company; (b) with respect to its composition, excludes an amount that is included in, or includes an amount that is excluded from, the composition of the most comparable financial measure presented in the primary consolidated financial statements; (c) is not presented in the financial statements of the Company; and (d) is not a ratio.
Aecon Group Inc. 8
Non-GAAP financial measures presented and discussed in this MD&A are as follows:
• “Adjusted EBITDA” represents operating profit (loss) adjusted to exclude depreciation and amortization, the gain (loss) on sale of assets and investments, and net income (loss) from projects accounted for using the equity method, but including “Equity Project EBITDA” from projects accounted for using the equity method (refer to Section 9 “Quarterly Financial Data” for a quantitative reconciliation to the most comparable financial measure).
• “Equity Project EBITDA” represents Aecon’s proportionate share of the earnings or losses from projects accounted for using the equity method before depreciation and amortization, finance income, finance cost and income tax expense (recovery) (refer to Section 9 “Quarterly Financial Data” for a quantitative reconciliation to the most comparable financial measure).
Management uses the above non-GAAP financial measures to analyze and evaluate operating performance. Aecon also believes the above financial measures are commonly used by the investment community for valuation purposes, and are useful complementary measures of profitability, and provide metrics useful in the construction industry. The most directly comparable measures calculated in accordance with GAAP are operating profit and profit (loss) attributable to shareholders.
Primary Financial Statements
Primary financial statement means any of the following: the consolidated balance sheets, the consolidated statements of income, the consolidated statements of comprehensive income, the consolidated statements of changes in equity, and the consolidated statements of cash flows.
Key financial measures presented in the primary financial statements of the Company and discussed in this MD&A are as follows:
• “Gross profit” represents revenue less direct costs and expenses. Not included in the calculation of gross profit are marketing, general and administrative expense (“MG&A”), depreciation and amortization, income (loss) from projects accounted for using the equity method, other income (loss), finance income, finance cost, income tax expense (recovery), and non-controlling interests.
• “Operating profit (loss)” represents the profit (loss) from operations, before finance income, finance cost, income tax expense (recovery), and non-controlling interests.
The above measures are presented in the Company’s consolidated statements of income and are not meant to be a substitute for other subtotals or totals presented in accordance with GAAP, but rather should be evaluated in conjunction with such GAAP measures.
• “Backlog” (Remaining Performance Obligations) means the total value of work that has not yet been completed that: (a) has a high certainty of being performed as a result of the existence of an executed contract or work order specifying job scope, value and timing; or (b) has been awarded to Aecon, as evidenced by an executed binding letter of intent or agreement, describing the general job scope, value and timing of such work, and where the finalization of a formal contract in respect of such work is reasonably assured. Operations and maintenance (“O&M”) activities are provided under contracts that can cover a period of up to 30 years. In order to provide information that is comparable to the backlog of other categories of activity, Aecon limits backlog for O&M activities to the earlier of the contract term and the next five years.
2023 Annual Report 9
Remaining Performance Obligations, i.e. Backlog, is presented in the notes to the Company’s annual consolidated financial statements and is not meant to be a substitute for other amounts presented in accordance with GAAP, but rather should be evaluated in conjunction with such GAAP measures.
Non-GAAP Ratios
A non-GAAP ratio is a financial measure presented in the form of a ratio, fraction, percentage or similar representation, and that has a non-GAAP financial measure as one of its components and is not disclosed in the financial statements of the Company.
A non-GAAP ratio presented and discussed in this MD&A is as follows:
• “Adjusted EBITDA margin” represents Adjusted EBITDA as a percentage of revenue.
Management uses the above non-GAAP ratio to analyze and evaluate operating performance. The most directly comparable measures calculated in accordance with GAAP are gross profit margin and operating margin.
Supplementary Financial Measures
A supplementary financial measure: (a) is, or is intended to be, disclosed on a periodic basis to depict the historical or expected future financial performance, financial position or cash flow of the Company; (b) is not presented in the financial statements of the Company; (c) is not a non-GAAP financial measure; and (d) is not a non-GAAP ratio.
Key supplementary financial measures presented in this MD&A are as follows:
• “Gross profit margin” represents gross profit as a percentage of revenue.
• “Operating margin” represents operating profit (loss) as a percentage of revenue.
• “MG&A as a percent of revenue” represents marketing, general and administrative expense as a percentage of revenue.
• “Debt to capitalization percentage” represents total debt (excluding non-recourse debt and drawings on the Company’s credit facilities presented as bank indebtedness) as a percentage of total capitalization. The calculation of debt to capitalization percentage and management’s use of this ratio is described in Section 10.5 “Capital Management” of this MD&A.
Aecon Group Inc. 10
Economic Conditions and Certain Fixed Price Legacy Projects
Within the Construction segment, economic conditions have had varying degrees of impact since 2020 including through to the end of 2023, notably from supply chain disruptions, inflation related to labour and materials, and availability of labour. Although these factors impacted most projects to some extent, in most cases the impact was not significant or has now moderated or been mitigated. However, the impacts on four large fixed price legacy projects being performed by joint ventures in which Aecon is a participant (see Section 10.2 “Contingencies” and Section 13 “Risk Factors” of this MD&A) were more significant. Aecon recognized an operating loss of $40.0 million in the fourth quarter of 2023 (operating loss of $58.9 million in the same period of 2022) and an operating loss of $215.2 million in 2023 (operating loss of $120.0 million in 2022) from these four legacy projects. At December 31, 2023, the remaining backlog to be worked off on these projects was $420 million compared to backlog of $1,079 million at December 31, 2022. One of the four projects reached substantial, or mechanical, completion in the third quarter of 2023 with two of the remaining three projects currently expected to be substantially complete by the end of 2024, and the final one currently expected to be substantially complete during 2025. The four legacy projects comprised 11% and 16%, respectively, of consolidated revenue in the fourth quarter and full year of 2023 and 7% of backlog at December 31, 2023, compared to 15% and 16%, respectively, of consolidated revenue in the fourth quarter and full year of 2022 and 17% of backlog at December 31, 2022.
Aecon and its joint venture partners remain focused on dedicating all necessary resources to drive the four legacy projects to completion and in the meantime continue to pursue fair and reasonable settlement agreements with the respective clients in each case. Based on i) substantial completion achieved or expected to be achieved in the next twelve months on three of these projects as noted above; ii) the most recent interim settlements reached and agreed to between the relevant joint ventures and the respective clients on each of the four projects, including one in the second quarter and two in the third quarter of 2023; and iii) the adjustments to forecasts made on the legacy projects in the second through fourth quarters of 2023 that reflect the additional clarity on schedule, compensation, construction costs, and other potential liabilities that the terms of the most recent interim settlement agreements and full reforecasts that incorporate those agreements and other new information that has arisen bring, Aecon believes its estimates to be reliable. However, downside risk remains in the event that assumptions, estimates, and/or circumstances change. Such downside risks include, among others, the level of compensation for past and future impacts, including through the dispute resolution process where appropriate, productivity not meeting expectations, potential for unforeseen supply chain delays and disruptions, unknown commissioning risks, inflation related risk, and further client changes.
Within the Concessions segment, COVID-19 and related travel restrictions and protocols, as well as the recovery in air traffic since those restrictions were lifted, have impacted operations at the Bermuda International Airport project since March 2020, including through to the end of 2023. Passenger traffic levels, which are the primary driver of Aecon’s results from operations in Bermuda, averaged 31% in 2021, 59% in 2022, and 75% in 2023 of 2019 pre-pandemic traffic levels. These averages reflect generally improving traffic over time as a percentage of pre-pandemic levels. Offsetting this impact on operational volume to some extent were fee increases and a minimum revenue guarantee from the Government of Bermuda to cover any shortfall in cash flow for debt-service requirements related to the Bermuda International Airport project.
5. RECENT
DEVELOPMENTS
2023 Annual Report 11
Aecon Completes Sale of Road Building Business in Ontario to Green Infrastructure Partners
On May 1, 2023, Aecon announced the closing of the previously disclosed definitive purchase agreement with Green Infrastructure Partners Inc. (“GIP”) under which Aecon sold its Aecon Transportation East (“ATE”) roadbuilding, aggregates, and materials businesses in Ontario for $235.0 million. Net cash proceeds received on closing were $155.3 million, net of debt and other closing adjustments. ATE provided roadbuilding infrastructure solutions throughout Ontario to the provincial government, municipalities, and private clients. The financial results of ATE prior to its sale were reported in the construction segment. In 2023, a gain on sale of $36.5 million was included in other income in the consolidated income statements.
Aecon Completes Sale of Partial Interest in Bermuda International Airport Concessionaire
On September 20, 2023, Aecon announced the closing of the previously disclosed agreement with Connor, Clark & Lunn Infrastructure (“CC&L Infrastructure”) to sell a 49.9% interest in the L.F. Wade International Airport (Bermuda International Airport) concessionaire, Bermuda Skyport Corporation Limited (“Skyport”). The final sale price was $162.3 million (US$120.0 million) in cash. Aecon Concessions retains the management contract for the airport and has joint control of Skyport with a 50.1% retained interest.
Skyport is a special-purpose company responsible for the airport’s operations, maintenance, and commercial functions, as well as coordinating the overall delivery of the Bermuda International Airport project over a 30-year concession term that commenced in 2017. Under a Government-to-Government/P3 model, Aecon worked with the Canadian Commercial Corporation and the Government of Bermuda to develop, finance, design, build, operate and maintain the new passenger terminal building, which opened in December of 2020. In 2023, Aecon recorded a gain on sale of $139.0 million, including a fair value remeasurement gain of $80.4 million related to Aecon’s 50.1% retained interest in Skyport, in other income in the consolidated income statements.
Aecon Completes $150 million Strategic Investment in Aecon Utilities Group by Oaktree’s Power Opportunities Fund
On October 23, 2023 Aecon announced a strategic investment by Oaktree Capital Management, L.P. (“Oaktree”) in an Aecon subsidiary, Aecon Utilities Group Inc. (“Aecon Utilities”). The investment subsequently closed on October 24, 2023. Oaktree acquired an interest in Aecon Utilities by way of a net $150 million convertible preferred shares investment (the “Investment”). The Investment was effected through the purchase of newly created convertible preferred shares (the “Preferred Shares”) of Aecon Utilities. The gross subscription amount of the Investment is $154.6 million of Preferred Shares, which represents $150.0 million after upfront fees (“Net Investment Amount”). The Investment is convertible at any time by Oaktree into common equity of Aecon Utilities and is mandatorily convertible upon a qualified initial public offering. Prior to conversion, the Preferred Shares will accrue a 12% annual coupon for the first three years and 14% annual coupon thereafter. At Aecon’s option, the coupon is payable in kind by accreting the principal amount or in cash.
Aecon Group Inc. 12
Aecon Completes Repayment of Convertible Debentures
On December 29, 2023, Aecon announced the cash repayment of the $184 million principal amount owed under its 5.0% unsecured convertible debentures due on December 31, 2023 (the “Debentures”), along with accrued unpaid interest for the month of December 2023.
6. BUSINESS STRATEGY
Aecon’s overall strategic goal is to be the number one Canadian infrastructure company that safely, profitably, and sustainably delivers integrated services, products, and solutions to meet its clients’ needs.
Current Position
For over a decade, Aecon has built scale in core markets, achieved diversity and balance in geographic and end-market sectors, and embedded a culture of operating excellence, enhanced risk management, and consistent performance using a “One Aecon” approach to meeting the needs of its clients. In recent years, this effort has been highlighted by the development of a growing portfolio of concession investments tied to major Canadian and international infrastructure projects, and the selection of Aecon as a partner in consortiums developing several large, collaborative and progressive design build projects. Aecon has also completed a number of strategic tuck-in acquisitions and investments in core operations, while divesting a number of non-core operations, to allow for an increased focus on Aecon’s chosen end-markets.
Aecon’s core strategy is to differentiate its service offering and execution capability to secure higher-return projects with a lower risk profile by increasing the sophistication and efficiency of the work being performed and improving the Company’s competitive advantage through its ability to provide value to its clients. As part of this differentiation, Aecon continues to work with its clients to develop collaborative alternative procurement and contracting models with the goal to reduce risk during construction and accelerate the Company’s growth in long-term recurring revenue programs through related operations and maintenance contracts. Revenue from recurring revenue programs (which comprises revenue earned under maintenance master services agreements and from ongoing operations that do not qualify as backlog) increased to $1,134 million in 2023 from $896 million in 2022 and $679 million in 2021, representing growth in recurring revenue programs of 27% over 2022 and 67% since 2021.
The Company is increasingly focused on integrating sustainability into its business strategy to mitigate environmental, social, and governance (“ESG”) risks and to harness the opportunities that are expected to come from the transition to a net zero economy through decarbonization. The Company is particularly focused on projects that support climate change mitigation and adaptation and the clean-energy transition, including battery storage, solar, hydrogen, nuclear, hydro-electric generation, transmission and distribution, transit, and other technologies to replace fossil fuels through electrification. In addition to undertaking clean energy projects, Aecon is also aiming to mitigate its own climate change impact – in 2021, the Company announced a target to reach net-zero by 2050, with an initial interim target to achieve a 30% reduction in Scope 1 and Scope 2 CO2 emissions by 2030 as compared to 2020. Aecon’s greenhouse gas (“GHG”) emission reduction targets are intensity-based targets based on economic output and represent tonnes of CO2 per million dollars of revenue. In 2023, Aecon achieved an 11% reduction in Scope 1 and Scope 2 GHG emissions per million dollars of revenue (tCO2e/$M) compared to 2022. To-date, Aecon has achieved a 20 percent cumulative reduction since 2020 in Scope 1 and Scope 2 emissions based on intensity-based
2023 Annual Report 13
targets relative to revenue. During 2023, Aecon was named Best Sustainable Infrastructure Construction Company 2023 – Canada by New World Report’s North America Business Awards.
Forward Together 2024 – 2027 Strategic Plan
In 2022, Aecon adopted the Moving Aecon Forward Together 2022 – 2024 Strategic Plan, focusing on its ambition to be the number one Canadian infrastructure company while building what matters to enable future generations to thrive. In 2024, Aecon built upon this plan with the Forward Together 2024 – 2027 Strategic Plan (the “Strategic Plan”), focused on “Where To Play” in the priority markets the Company will focus on to ensure a de-risked portfolio and accelerate its growth, and “How We Win” by identifying three Key Focus areas the Company will continue to develop to secure a leading position and more predictable and increased profitability in these markets. The key elements of the Strategic Plan are outlined below.
Where to Play
Aecon leverages its construction and concessions experience to pursue a wide mix of projects across various market sectors, including new collaborative alternative procurement projects with both government and private clients in Canada and internationally. Building on its experience in the design, build, finance, maintenance, and operations of Canadian and international infrastructure development, Aecon is targeting additional project opportunities and partnerships that require this specialized experience and capability. Aecon is also continuing its focus on construction activities linked to sustainability. In 2023, a consortium in which Aecon Concessions is an equity partner executed an agreement to develop and construct the Oneida Energy Storage Project, the largest battery storage project currently in Canada. Under the agreement, Aecon was also awarded an engineering, procurement and construction contract for the project. Revenue tied to sustainability projects represented 64% of 2023 revenue versus 60% in 2022. Sustainability projects include, but are not limited to, projects that reduce emissions, support the transition to a net-zero economy, support clean water use and conservation, and reduce or recycle waste. The Company’s definition of sustainability projects is based on the Sustainability Accounting Standards Board’s (“SASB”) definition of renewable energy projects and the Federal Government’s definition of Green Infrastructure under the Investing in Canada Infrastructure Program.
In 2023, the Company completed three strategic transactions focused on strengthening its financial position, de-risking its portfolio and accelerating growth in priority markets. Aecon announced a strategic investment by Oaktree in Aecon Utilities, creating an enhanced growth vehicle focused on providing utility infrastructure services across North America. Oaktree acquired an interest in Aecon Utilities by way of a net $150 million convertible preferred shares investment, expected to accelerate growth in Aecon Utilities, further strengthen Aecon’s balance sheet, and unlock value for the Company’s shareholders. Aecon also sold a 49.9% interest in Skyport to CC&L Infrastructure for $162.3 million (US$120 million), highlighting the contribution of the Concessions’ portfolio of projects to Aecon while introducing an experienced infrastructure partner and preserving capital for other growth and concession opportunities. Aecon Concessions retained the management contract for the airport and has joint control of Skyport, owning a 50.1% interest. The Company has also divested of non-core operations, including the sale of ATE, a roadbuilding, aggregates, and materials businesses in Ontario, to Green Infrastructure Partners for $235 million. Net cash proceeds received on closing were $155.3 million, net of debt and other closing adjustments. The sale complements Aecon’s strategic focus on end markets related to the energy transition and sustainability, and is consistent with Aecon’s goal of targeting prudent balance sheet leverage and liquidity while reducing the overall capital intensity of Aecon’s business.
Aecon Group Inc. 14
While the Company’s growth within Canada remains its primary focus, the U.S. and international infrastructure development and construction markets provide an opportunity to continue to diversify the business over time, both organically and through targeted acquisitions. These opportunities are intended over the long term to diversify Aecon’s geographic presence and provide greater growth potential and earnings stability through economic cycles. In 2023, Aecon was awarded a contract by Dominion Energy for the replacement of Condensers and Feedwater Heaters at the North Anna Power Station in Virginia, demonstrating continued progress in its U.S. expansion initiatives. Aecon also continued to advance the Kingstown Port Modernisation project in Saint Vincent and the Grenadines awarded in 2022. Aecon also acquired and integrated a number of small specialty businesses over the last several years in Canada and the U.S., primarily in the Utility Infrastructure sector to enhance its electric transmission and distribution and renewable energy solutions capabilities. Acquisitions of small specialty businesses to complement selfperform capabilities or expand geographic coverage provide opportunities to grow in Aecon’s chosen endmarkets and remain part of the strategic focus going forward. Revenue from U.S. and international markets increased by $161 million or 85% in 2023 versus 2022.
The Company’s growth initiatives are primarily directed towards investment in areas designed to reduce atrisk work and increase activities with lower risk profiles, including recurring revenue opportunities, long-term concessions and related operations and maintenance opportunities, renewable energy and decarbonization, and other projects linked to sustainability initiatives. Revenue from non-fixed price work increased to 58% of total revenue in 2023 from 49% of total revenue in 2022, and reported backlog at December 31, 2023 was comprised of 50% non-fixed price work versus 49% at the end of 2022.
How We Win
Aecon is focused on the following three Key Focus areas designed to provide operational excellence and enable consistently profitable growth across the organization and in support of “How We Win” in its priority markets:
1) Outstanding Teams
Aecon is committed to developing its employees and building on its strong foundation of people and culture. A focus on driving progressive leadership skill development, maximizing career development outcomes, and helping prepare the Company to navigate a competitive labour environment in the industry, are all key to fulfilling Aecon’s growth potential.
Equipping its leaders and workforce with the necessary knowledge, skills, and experience to thrive in the emerging world of infrastructure is key to Aecon’s future success. Developing outstanding leaders and teams capable of managing growth and diversity, fostering innovation, entering new markets, adapting and developing collaborative contract delivery models, and leveraging emerging and sustainable construction practices are critical strategic levers for Aecon. In 2023, the Company made further strategic enhancements to some of its key learning programs including expanding its Project Management Academy and broadening its Champions for Diversity in Leadership program, which resulted in a number of executive appointments in the year.
The Company is committed to taking steps to be seen as a first-choice employer, drawing top talent from within and outside of the construction industry. A focus on equity, diversity, and inclusion, while demonstrating a culture of safety and sustainability, is a competitive differentiator in the construction industry, and Aecon’s approach on these factors is designed to place the Company at the forefront of attracting and retaining
2023 Annual Report 15
the best talent needed to support its strategic goals. In 2023, Aecon introduced professional development opportunities designed to support strategic operational objectives, including BluePrint Essentials – an internally developed and pragmatic management primer course for construction professionals, the Aecon Sustainable Engineering & Construction Certification program developed in partnership with Beyond21 Academy and McMaster University, and a Carbon Literacy Program in partnership with Conestoga College.
2) Execution Excellence
Aecon embraces project complexity and is focused on the safe, on-time, on-budget delivery of its projects. To support operational teams across the Company with shared best practices that aim to increase efficiency and effectiveness on construction projects, eliminate wasteful activities, and ultimately add value for all stakeholders, the Company invested further in its Building Smarter program designed to embed a culture of continuous improvement across the Company.
Building Smarter has become a continuous improvement centre of excellence with a team of experienced professionals supporting projects through lean construction methods and a suite of tools, mobile-accessible platforms, training, and resources tailored to Aecon’s operations. This approach seeks to strengthen the Company’s ability to improve cost certainty and schedule to maximize value for clients, which the Company believes can provide a competitive advantage with respect to bidding and executing certain construction projects. Aecon believes that efficiencies are also derived from the depth and breadth of its capabilities, allowing it to participate in projects beyond the scope of any one discipline or business unit.
3) Risk versus Opportunity Balance
A key pillar of Aecon’s approach to risk management is to seek to maintain balance in terms of sectors, clients, contract models, and geographies with the goal of reducing the risk of being over-exposed in any one of these areas. This approach is complemented by a focus on identifying, mitigating, and managing the risks inherent in every project the Company undertakes. Aecon continues to develop strategies and tools to manage the risk associated with complex construction work, each of which are assessed and refined on an ongoing basis as needed. Building upon the progress made in 2022, the Company developed and implemented a project risk gating assessment tool in 2023 to enhance its approach to disciplined project selection with a view to ensuring project pursuits are aligned with the Company’s strengths and designed to achieve the balance outlined above.
In 2023, Aecon, GE Hitachi and AtkinsRéalis executed a six-year alliance agreement with Ontario Power Generation to deliver North America’s first grid-scale Small Modular Reactor through the Darlington New Nuclear Project in Ontario under an Integrated Project Delivery model. This alliance builds on the momentum established in 2022, when consortiums in which Aecon is a member were awarded projects in Ontario designed to mitigate and manage major project risks through more collaborative procurement models, including the GO Expansion On-Corridor Works project under a progressive design, build, operate, and maintain contract model, and the Scarborough Subway Extension Stations, Rail and Systems project under a progressive design-build model.
Strategic Plan Economic Goals
The Strategic Plan is centred around the goal of creating a framework that motivates a culture of innovation, sustainability, operational excellence, continuous improvement, and risk management towards improving Aecon Group Inc.
16
operating margins, prudent and balanced growth, and discipline in the allocation of capital, all ultimately designed to deliver increased value for shareholders:
• Profit: Seek to achieve best-in-class operating margin in the Construction segment relative to Canadian and international peers;
• Growth Capacity and Risk Management: Target prudent balance sheet leverage and liquidity and a balanced and diversified revenue risk profile;
• Success Sharing: Foster an ownership culture across the Company and a rewarding profit-sharing structure; and
• Shareholder Return: Drive improvements in return on equity and dividend increases over time through growth and more predictable cash flow and earnings.
Particular Focus for 2024 – the Company is focused on a number of programs and key initiatives to advance its overall strategy in 2024, including:
1. advancing the Company’s key Environment, Health and Safety (“EHS”) priority areas of critical risk management, digitization of EHS programs and management systems, and continued strengthening of its environment and safety performance culture;
2. introducing new learning experiences to augment Aecon’s Project Management Academy, including structured on-the-job learning assignments and enhanced leadership development programs, and continuing to drive succession and career development outcomes to strengthen talent pipelines while strategically differentiating Aecon as a first-choice employer in the industry;
3. building on the progress of the Building Smarter program to embed best practices and a culture of continuous improvement across the Company, thereby driving operational excellence to increase efficiency, reduce waste and improve margin;
4. advancing negotiations and resolution of claims related to four large fixed price legacy projects (see Section 10.2 “Contingencies” and Section 13 “Risk Factors” of this MD&A);
5. completing the progressive and collaborative phases of major projects procured under delivery models designed to mitigate and manage execution risks and advancing these projects to the respective construction, operations, and maintenance phases;
6. implementing initiatives to meet the Company’s interim and long-term emissions reduction goals with a focus on adding lower emission construction equipment, piloting low carbon materials and further integrating sustainability into Aecon’s strategy to support its clients’ sustainable infrastructure needs;
7. leveraging the Oaktree investment in and partnership with Aecon Utilities to pursue acquisitions and growth in key utility segments and geographies, primarily the U.S. and Canada; and
8. building on Aecon’s P3 experience in government infrastructure projects to target sustainable and innovative development and concession opportunities in decarbonization and energy transition related markets in which Aecon has existing or growing capability in construction, operations, and maintenance.
2023 Annual Report 17
(1) This is a non-GAAP financial measure. Refer to Section 4 “Non-GAAP and Supplementary Financial Measures” in this MD&A for more information on each non-GAAP financial measure.
(1) This is a non-GAAP financial measure. Refer to Section 4 “Non-GAAP and Supplementary Financial Measures” in this MD&A for more information on each non-GAAP financial measure.
(2) This is a non-GAAP ratio. Refer to Section 4 “Non-GAAP and Supplementary Financial Measures” in this MD&A for more information on each non-GAAP ratio.
(2) This is a non-GAAP ratio. Refer to Section 4 “Non-GAAP and Supplementary Financial Measures” in this MD&A for more information on each non-GAAP ratio.
(3) This is a supplementary financial measure. Refer to Section 4 “Non-GAAP and Supplementary Financial Measures” in this MD&A for more information on each supplementary financial measure.
(3) This is a supplementary financial measure. Refer to Section 4 “Non-GAAP and Supplementary Financial Measures” in this MD&A for more information on each supplementary financial measure.
Revenue for the year ended December 31, 2023 of $4,644 million was $52 million, or 1%, lower compared to 2022. Revenue was lower in the Construction segment ($48 million) driven by lower revenue in civil ($65 million), nuclear ($33 million), industrial ($24 million), and utilities ($5 million), partially offset by higher revenue in urban transportation solutions ($79 million). The lower revenue in civil was driven by a year-overyear decrease of $275 million as a result of the sale of ATE in the second quarter of 2023. In the Concessions segment, revenue was $2 million lower in 2023 compared to the prior year primarily due to the Bermuda International Airport concessionaire. Subsequent to the sale of a 49.9% interest in Skyport on September 20, 2023, the Company’s retained 50.1% interest in Skyport is reported using the equity method of accounting and as such, no amounts are reported in revenue on a prospective basis by Aecon (See Section 5 “Recent Developments” of this MD&A for details of the sale of a 49.9% interest in Skyport and Note 12 “Projects Accounted for Using the Equity Method” in the Company’s audited consolidated financial statements for the year ended December 31, 2023). Inter-segment revenue eliminations increased by $2 million in 2023 compared to the prior year, due to higher revenue between the Concessions and Construction segments.
Revenue for the year ended December 31, 2023 of $4,644 million was $52 million, or 1%, lower compared to 2022. Revenue was lower in the Construction segment ($48 million) driven by lower revenue in civil ($65 million), nuclear ($33 million), industrial ($24 million), and utilities ($5 million), partially offset by higher revenue in urban transportation solutions ($79 million). The lower revenue in civil was driven by a yearover-year decrease of $275 million as a result of the sale of ATE in the second quarter of 2023. In the Concessions segment, revenue was $2 million lower in 2023 compared to the prior year primarily due to the Bermuda International Airport concessionaire. Subsequent to the sale of a 49.9% interest in Skyport on September 20, 2023, the Company’s retained 50.1% interest in Skyport is reported using the equity method of accounting and as such, no amounts are reported in revenue on a prospective basis by Aecon (See Section 5 “Recent Developments” of this MD&A for details of the sale of a 49.9% interest in Skyport and Note 12 “Projects Accounted for Using the Equity Method” in the Company’s audited consolidated financial statements for the year ended December 31, 2023). Inter-segment revenue eliminations increased by $2 million in 2023 compared to the prior year, due to higher revenue between the Concessions and Construction segments.
7. CONSOLIDATED
CONSOLIDATED
Three months ended Year ended $ millions (except per share amounts) December 31 December 31 2023 2022 2023 2022 Revenue $1,130.2 $1,266.8 $4,643.8 $4,696.5 Gross profit 98.0 98.7 255.6 356.0 Marketing, general and administrative expense (51.8) (48.1) (177.8) (196.4) Income from projects accounted for using the equity method 5.5 5.9 18.7 17.7 Other income 2.6 8.1 223.5 14.1 Depreciation and amortization (14.6) (23.9) (79.1) (94.2) Operating profit 39.6 40.7 240.9 97.2 Finance income 2.2 2.0 7.7 2.9 Finance cost (21.4) (16.9) (71.0) (57.1) Profit before income taxes 20.3 25.8 177.5 43.0 Income tax expense (10.7) (6.1) (15.7) (12.6) Profit $9.7 $19.7 $161.9 $30.4 Gross profit margin(3) 8.7% 7.8% 5.5% 7.6% MG&A as a percent of revenue(3) 4.6% 3.8% 3.8% 4.2% Adjusted EBITDA(1) $70.2 $67.5 $143.4 $219.2 Adjusted EBITDA margin(2) 6.2% 5.3% 3.1% 4.7% Operating margin(3) 3.5% 3.2% 5.2% 2.1% Earnings per share – basic $0.16 $0.32 $2.62 $0.50 Earnings per share – diluted $0.15 $0.26 $2.10 $0.47
FINANCIAL HIGHLIGHTS 7.
FINANCIAL HIGHLIGHTS
Backlog (at end of period) $6,157 $6,296
Aecon Group Inc. 18
Operating profit of $240.9 million for the year ended December 31, 2023 improved by $143.7 million compared to operating profit of $97.2 million in 2022. The improvement in year-over-year operating profit was largely due to an increase in other income of $209.4 million. This increase was primarily due to gains related to the sale of a 49.9% interest in Skyport of $139.0 million, including a fair value remeasurement gain of $80.4 million on Aecon’s 50.1% retained interest in the concessionaire and the sale of ATE ($36.5 million). Also contributing to the increase in other income was higher gains on the sale of property, buildings, and equipment ($38.7 million, of which $20.7 million was included in the Construction segment and $18.0 million in Corporate), a higher fair value gain on financial instruments ($0.9 million), and partially offset by lower foreign exchange gains ($1.4 million) and lower gains on other assets ($4.3 million).
The increase in operating profit from the above noted increase in other income was partially offset by lower gross profit in 2023 of $100.4 million. In the Construction segment, gross profit decreased by $101.6 million primarily as a result of negative gross profit related to four fixed price legacy projects in 2023 of $215.2 million, arising from three of the four projects, two of which were in urban transportation solutions and one in the civil sector, compared to negative gross profit on the fixed price legacy projects of $120.0 million in 2022. These four fixed price legacy projects are discussed in Section 5 “Recent Developments”, Section 10.2 “Contingencies”, and Section 13 “Risk Factors” in this MD&A. In addition to the impact of these four fixed price legacy projects in 2023, lower gross profit in the balance of the Construction segment was largely due to lower gross profit in civil operations primarily due to the sale of ATE in the second quarter of 2023, a volume driven decrease in gross profit in utilities, and lower volume and gross profit margin in nuclear operations, partially offset by improved gross profit margin in urban transportation solutions and industrial operations. In the Concessions segment and Corporate, gross profit in 2023 increased by $1.2 million compared to 2022.
MG&A decreased in 2023 by $18.6 million compared to 2022. The decrease in MG&A was primarily due to lower personnel, project pursuit and bid costs, as well as the impact of the sale of ATE in the second quarter of 2023. MG&A as a percentage of revenue decreased from 4.2% in 2022 to 3.8% in 2023.
Aecon’s participation in projects that are classified for accounting purposes as a joint venture or an associate, as opposed to a joint operation, are accounted for using the equity method of accounting. Aecon reported income of $18.7 million in 2023 from projects accounted for using this method of accounting, compared to $17.7 million in 2022. The higher income in 2023 in the Concessions segment ($1.5 million) was driven by an increase in management and development fees and partially offset in the Construction segment ($0.5 million) by lower income from civil projects. For details on Aecon’s interest in these joint ventures, see Note 12 “Projects Accounted for Using the Equity Method” of the Company’s audited consolidated financial statements for the year ended December 31, 2023.
Depreciation and amortization expense of $79.1 million in 2023 was $15.1 million lower than in 2022. Depreciation and amortization expense decreased year-over-year in the Construction segment ($9.8 million) largely related to a decrease in equipment deployed due to the sale of ATE in the second quarter of 2023. In the Concessions segment, depreciation and amortization expense decreased ($4.8 million) due to the sale of a 49.9% interest in Skyport in the third quarter of 2023 and the use of the equity method of accounting on a prospective basis for the Company’s retained 50.1% interest in Skyport.
Net financing expense of $63.3 million in 2023, consisting of finance cost of $71.0 million less finance income of $7.7 million, was $9.1 million higher than in 2022. The increase is primarily related to accrued dividends of $3.6 million, a fair value gain of $2.9 million, and one-time transaction costs of $13.3 million
2023 Annual Report 19
all related to the issuance of Preferred Shares by Aecon Utilities in 2023, increased borrowings and higher interest rates on Aecon’s revolving credit facilities compared to the prior year, partially offset by lower interest expense related to the Bermuda International Airport project following the sale of a 49.9% interest in Skyport in the third quarter of 2023 and the use of the equity of accounting on a prospective basis for Aecon’s retained 50.1 % interest in the project.
issuance of Preferred Shares by Aecon Utilities in 2023, increased borrowings and higher interest rates on Aecon’s revolving credit facilities compared to the prior year, partially offset by lower interest expense related to the Bermuda International Airport project following the sale of a 49.9% interest in Skyport in the third quarter of 2023 and the use of the equity of accounting on a prospective basis for Aecon’s retained 50.1 % interest in the project.
issuance of Preferred Shares by Aecon Utilities in 2023, increased borrowings and higher interest rates on Aecon’s revolving credit facilities compared to the prior year, partially offset by lower interest expense related to the Bermuda International Airport project following the sale of a 49.9% interest in Skyport in the third quarter of 2023 and the use of the equity of accounting on a prospective basis for Aecon’s retained 50.1 % interest in the project.
Set out in Note 22 “Income Taxes” of the Company’s audited consolidated financial statements for the year ended December 31, 2023 is a reconciliation between the expected income tax expense for 2023 and 2022 based on statutory income tax rates and the actual income tax expense reported for both these periods. In 2023, the effective income tax rate was lower than the Canadian statutory income tax rate of 26.4% mainly due to income tax on transactions related to the disposal of subsidiaries and related fair value remeasurement gains. While in 2022, the effective income tax rate was higher than the Canadian statutory income tax rate of 26.4% mainly due to the geographic mix of earnings largely related to the Bermuda International Airport project.
Set out in Note 22 “Income Taxes” of the Company’s audited consolidated financial statements for the year ended December 31, 2023 is a reconciliation between the expected income tax expense for 2023 and 2022 based on statutory income tax rates and the actual income tax expense reported for both these periods. In 2023, the effective income tax rate was lower than the Canadian statutory income tax rate of 26.4% mainly due to income tax on transactions related to the disposal of subsidiaries and related fair value remeasurement gains. While in 2022, the effective income tax rate was higher than the Canadian statutory income tax rate of 26.4% mainly due to the geographic mix of earnings largely related to the Bermuda International Airport project.
Set out in Note 22 “Income Taxes” of the Company’s audited consolidated financial statements for the year ended December 31, 2023 is a reconciliation between the expected income tax expense for 2023 and 2022 based on statutory income tax rates and the actual income tax expense reported for both these periods. In 2023, the effective income tax rate was lower than the Canadian statutory income tax rate of 26.4% mainly due to income tax on transactions related to the disposal of subsidiaries and related fair value remeasurement gains. While in 2022, the effective income tax rate was higher than the Canadian statutory income tax rate of 26.4% mainly due to the geographic mix of earnings largely related to the Bermuda International Airport project.
Reported backlog at December 31, 2023 of $6,157 million compare s to backlog of $6,296 million at December 31, 2022. New contract awards of $4,505 million were b ooked in 2023 compared to $4,795 million in 2022.
Reported backlog at December 31, 2023 of $6,157 million compare s to backlog of $6,296 million at December 31, 2022. New contract awards of $4,505 million were b ooked in 2023 compared to $4,795 million in 2022.
Reported backlog at December 31, 2023 of $6,157 million compares to backlog of $6,296 million at December 31, 2022. New contract awards of $4,505 million were booked in 2023 compared to $4,795 million in 2022.
Backlog
The timing of work to be performed for projects in backlog at December 31, 2023 is based on current project schedules, taking into account the current estimated impacts of supply chain disruptions and availability of labour. It is possible that these estimates could change in the future based on changes in these or other factors impacting the schedule of these projects. The above backlog and estimated backlog duration balances at December 31, 2023 exclude all amounts related to ATE which was sold in the second quarter of 2023 (see Section 5 “Recent Developments” of this MD&A) at which time related backlog of $447 million was removed.
The timing of work to be performed for projects in backlog at December 31, 2023 is based on current project schedules, taking into account the current estimated impacts of supply chain disruptions and availability of labour. It is possible that these estimates could change in the future based on changes in these or other factors impacting the schedule of these projects. The above backlog and estimated backlog duration balances at December 31, 2023 exclude all amounts related to ATE which was sold in the second quarter of 2023 (see Section 5 “Recent Developments” of this MD&A) at which time related backlog of $447 million was removed.
The timing of work to be performed for projects in backlog at December 31, 2023 is based on current project schedules, taking into account the current estimated impacts of supply chain disruptions and availability of labour. It is possible that these estimates could change in the future based on changes in these or other factors impacting the schedule of these projects. The above backlog and estimated backlog duration balances at December 31, 2023 exclude all amounts related to ATE which was sold in the second quarter of 2023 (see Section 5 “Recent Developments” of this MD&A) at which time related backlog of $447 million was removed.
Aecon does not report as backlog contracts and arrangements in hand where the exact amount of work to be performed cannot be reliably quantified or where a minimum number of units at the contract specified price per unit is not guaranteed. Examples include time and material and some cost-plus and unit priced contracts where
Aecon does not report as backlog contracts and arrangements in hand where the exact amount of work to be performed cannot be reliably quantified or where a minimum number of units at the contract specified price per unit is not guaranteed. Examples include time and material and some cost-plus and unit priced contracts where
$ millions At December 31 2023 2022 Construction $6,053 $6,197 Concessions 104 99 Consolidated $6,157 $6,296 Estimated backlog duration $ millions At December 31 2023 2022 Next 12 months $ 2,669 44% $3,035 48% Next 13-24 months 1,309 21% 1,853 29% Beyond 2,179 35% 1,408 23% $6,157 100% $6,296 100%
Backlog $ millions At December 31 2023 2022 Construction $6,053 $6,197 Concessions 104 99 Consolidated $6,157 $6,296 Estimated backlog duration $ millions At December 31 2023 2022 Next 12 months $ 2,669 44% $3,035 48% Next 13-24 months 1,309 21% 1,853 29% Beyond 2,179 35% 1,408 23% $6,157 100% $6,296 100%
Aecon Group Inc. 20
Aecon does not report as backlog contracts and arrangements in hand where the exact amount of work to be performed cannot be reliably quantified or where a minimum number of units at the contract specified price per unit is not guaranteed. Examples include time and material and some cost-plus and unit priced contracts where the extent of services to be provided is undefined or where the number of units cannot be estimated with reasonable certainty. Other examples include the value of construction work managed under construction management advisory contracts, concession agreements, multi-year operating and maintenance service contracts where the value of the work is not specified, supplier of choice arrangements and alliance agreements where the client requests services on an as-needed basis. None of the expected revenue from these types of contracts and arrangements is included in backlog. Therefore, Aecon’s anticipated future work to be performed at any given time is greater than what is reported as backlog.
Further detail for each segment is included in the discussion below under Section 8 “Reportable Segments Financial Highlights”.
2023 Annual Report 21
(1) This is a non-GAAP financial measure. Refer to Section 4 “Non-GAAP and Supplementary Financial Measures” in this MD&A for more information on each non-GAAP financial measure.
(1) This is a non-GAAP financial measure. Refer to Section 4 “Non-GAAP and Supplementary Financial Measures” in this MD&A for more information on each non-GAAP financial measure.
(2) This is a non-GAAP ratio. Refer to Section 4 “Non-GAAP and Supplementary Financial Measures” in this MD&A for more information on each non-GAAP ratio.
(2) This is a non-GAAP ratio. Refer to Section 4 “Non-GAAP and Supplementary Financial Measures” in this MD&A for more information on each non-GAAP ratio.
(3) This is a supplementary financial measure. Refer to Section 4 “Non-GAAP and Supplementary Financial Measures” in this MD&A for more information on each supplementary financial measure.
(3) This is a supplementary financial measure. Refer to Section 4 “Non-GAAP and Supplementary Financial Measures” in this MD&A for more information on each supplementary financial measure.
For the year ended December 31, 2023, revenue in the Construction segment of $4,573 million was $48 million, or 1%, lower than in 2022. The largest decrease in revenue occurred in civil operations ($65 million) driven by a lower volume of roadbuilding construction work in eastern Canada of $275 million as a result of the sale of ATE in the second quarter of 2023, and partially offset by a higher volume of major projects work in both eastern and western Canada. Revenue was also lower in nuclear operations ($33 million) driven by a lower volume of refurbishment work at nuclear generating stations located in Ontario, and in industrial operations ($24 million) driven by a lower volume of field construction work primarily at chemical facilities in eastern Canada and partially offset by increased activity on mainline pipeline work. In utilities operations, lower revenue ($5 million) resulted primarily from a decrease in gas distribution work. Partially offsetting these decreases was higher revenue in urban transportation solutions ($79 million) primarily from an increase in rail expansion and electrification work in Ontario.
For the year ended December 31, 2023, revenue in the Construction segment of $4,573 million was $48 million, or 1%, lower than in 2022. The largest decrease in revenue occurred in civil operations ($65 million) driven by a lower volume of roadbuilding construction work in eastern Canada of $275 million as a result of the sale of ATE in the second quarter of 2023, and partially offset by a higher volume of major projects work in both eastern and western Canada. Revenue was also lower in nuclear operations ($33 million) driven by a lower volume of refurbishment work at nuclear generating stations located in Ontario, and in industrial operations ($24 million) driven by a lower volume of field construction work primarily at chemical facilities in eastern Canada and partially offset by increased activity on mainline pipeline work. In utilities operations, lower revenue ($5 million) resulted primarily from a decrease in gas distribution work. Partially offsetting these decreases was higher revenue in urban transportation solutions ($79 million) primarily from an increase in rail expansion and electrification work in Ontario.
Operating profit in the Construction segment of $59.0 million in 2023 decreased by $61.9 million compared to 2022. The largest driver of the decrease in operating profit was negative gross profit from the four fixed price legacy projects of $215.2 million in 2023 compared to negative gross profit on the four fixed price legacy projects of $120.0 million in 2022 for a net negative year-over-year impact on operating profit of $95.2 million. In civil operations, lower gross profit was driven by a negative gross profit of $75.7 million from one of the four fixed price legacy projects compared to a gross profit of $13.2 million related to the same project in 2022; in urban transportation solutions by a negative gross profit of $139.5 million in 2023 from two of the four fixed price legacy projects versus a negative gross profit of $117.8 million in 2022 from the same projects; and partially offset in industrial operations by gross profit of $nil from one of the four fixed price legacy projects compared to a negative gross profit of $15.4 million related to the same project in 2022. The four fixed price
Operating profit in the Construction segment of $59.0 million in 2023 decreased by $61.9 million compared to 2022. The largest driver of the decrease in operating profit was negative gross profit from the four fixed price legacy projects of $215.2 million in 2023 compared to negative gross profit on the four fixed price legacy projects of $120.0 million in 2022 for a net negative year-over-year impact on operating profit of $95.2 million. In civil operations, lower gross profit was driven by a negative gross profit of $75.7 million from one of the four fixed price legacy projects compared to a gross profit of $13.2 million related to the same project in 2022; in urban transportation solutions by a negative gross profit of $139.5 million in 2023 from two of the four fixed price legacy projects versus a negative gross profit of $117.8 million in 2022 from the same projects; and partially offset in industrial operations by gross profit of $nil from one of the four fixed price legacy projects compared to a negative gross profit of $15.4 million related to the same project in 2022. The four fixed price legacy projects are discussed in Section 5 “Recent Developments”, Section
8. REPORTABLE SEGMENTS FINANCIAL HIGHLIGHTS 8.1. CONSTRUCTION Financial Highlights 8. REPORTABLE SEGMENTS FINANCIAL HIGHLIGHTS
Three months ended Year ended $ millions December 31 December 31 2023 2022 2023 2022 Revenue $1,127.2 $1,246.3 $4,572.5 $4,620.8 Gross profit $97.6 $90.9 $223.4 $325.0 Adjusted EBITDA(1) $65.0 $57.5 $99.4 $192.5 Operating profit $49.1 $43.6 $59.0 $120.9 Gross profit margin(3) 8.7% 7.3% 4.9% 7.0% Adjusted EBITDA margin(2) 5.8% 4.6% 2.2% 4.2% Operating margin(3) 4.4% 3.5% 1.3% 2.6% Backlog (at end of period) $6,053 $6,197
8.1. CONSTRUCTION Financial Highlights
Aecon Group Inc. 22
10.2 “Contingencies”,
and Section 13 “Risk Factors” in this MD&A. Other than the impact of these fixed price legacy projects in 2023, higher operating profit in the balance of the Construction segment was driven by higher volume and gross profit margin in urban transportation solutions, and in industrial operations from higher gross profit margin. These operating profit improvements were partially offset in civil operations primarily by lower operating profit from roadbuilding construction work due to the sale of ATE in the second quarter of 2023 ($23.5 million), in nuclear operations by lower volume and gross profit margin, and in utilities operations from lower gross profit.
Construction backlog at December 31, 2023 was $6,053 million, which was $144 million lower than the same time last year. Backlog decreased year-over-year in civil operations ($311 million), industrial operations ($309 million), urban transportation solutions ($268 million), and utilities operations ($89 million), and increased in nuclear operations ($833 million). Backlog at December 31, 2023 excludes all amounts related to ATE which was sold in the second quarter of 2023 (see Section 5 “Recent Developments” of this MD&A) at which time related backlog of $447 million was removed. New contract awards in 2023 totaled $4,428 million compared to $4,702 million in 2022. In 2023, Aecon was awarded a number of projects including delivery of the Deerfoot Trail Improvements project in Calgary, Alberta; a design-build contract for the Eglinton Crosstown West Extension project’s Elevated Guideway in Toronto, Ontario; the replacement of Condensers and Feedwater Heaters for Dominion Energy at the North Anna Power Station in Mineral, Virgina; and an Aecon joint venture was awarded the Fuel Channel and Feeder Replacement contract for four units at the Bruce Nuclear Generating Station in Tiverton, Ontario.
As discussed in Section 7 “Consolidated Financial Highlights”, the Construction segment’s anticipated future work to be performed at any given time is greater than what is reported as backlog.
2023 Annual Report 23
Financial Highlights
(1) This is a non-GAAP financial measure. Refer to Section 4 “Non-GAAP and Supplementary Financial Measures” in this MD&A for more information on each non-GAAP financial measure.
(1) This is a non-GAAP financial measure. Refer to Section 4 “Non-GAAP and Supplementary Financial Measures” in this MD&A for more information on each non-GAAP financial measure.
On September 20, 2023, Aecon announced the closing of the previously disclosed agreement with CC&L Infrastructure to sell a 49.9% interest in Skyport. Following this transaction, Aecon holds a 50.1% interest in Skyport, the concessionaire responsible for the Bermuda International Airport’s operations, maintenance and commercial functions, and the entity that will manage and coordinate the overall delivery of the Bermuda International Airport project over a 30-year concession term that commenced in 2017. On December 9, 2020, Skyport opened the new passenger terminal building at the L.F. Wade International Airport. Prior to the transaction with CC&L Infrastructure, Aecon’s participation in Skyport was 100% consolidated and, as such, was accounted for in the consolidated financial statements by reflecting, line by line, the assets, liabilities, revenue and expenses of Skyport. Subsequent to the closing of the Skyport transaction during the third quarter of 2023, Aecon’s 50.1% concession participation in the Skyport joint venture is accounted for using the equity method. See Section 5 “Recent Developments” of this MD&A for details of the completed sale of a 49.9% interest in Skyport. Furthermore, Aecon’s concession participat ion in the Eglinton Crosstown light rail transit (“LRT”), Finch West LRT, Gordie Howe International Bridge, Waterloo LRT, and the GO Expansion OnCorridor Works projects are joint ventures that are also accounted for using the equity method.
On September 20, 2023, Aecon announced the closing of the previously disclosed agreement with CC&L Infrastructure to sell a 49.9% interest in Skyport. Following this transaction, Aecon holds a 50.1% interest in Skyport, the concessionaire responsible for the Bermuda International Airport’s operations, maintenance and commercial functions, and the entity that will manage and coordinate the overall delivery of the Bermuda International Airport project over a 30-year concession term that commenced in 2017. On December 9, 2020, Skyport opened the new passenger terminal building at the L.F. Wade International Airport. Prior to the transaction with CC&L Infrastructure, Aecon’s participation in Skyport was 100% consolidated and, as such, was accounted for in the consolidated financial statements by reflecting, line by line, the assets, liabilities, revenue and expenses of Skyport. Subsequent to the closing of the Skyport transaction during the third quarter of 2023, Aecon’s 50.1% concession participation in the Skyport joint venture is accounted for using the equity method. See Section 5 “Recent Developments” of this MD&A for details of the completed sale of a 49.9% interest in Skyport. Furthermore, Aecon’s concession participation in the Eglinton Crosstown light rail transit (“LRT”), Finch West LRT, Gordie Howe International Bridge, Waterloo LRT, and the GO Expansion On-Corridor Works projects are joint ventures that are also accounted for using the equity method.
For the year ended December 31, 2023, revenue in the Concessions segment of $74 million was $2 million lower than in 2022. The decrease was largely due to the Bermuda International Airport where revenue in 2023 was $61 million compared to revenue in 2022 of $69 million. This decrease in revenue was driven by the above noted sale of a 49.9% interest in Skyport and the use of the equity method of accounting on a prospective basis for the Company’s retained 50.1% interest in Skyport. In 2023, passenger traffic levels in Bermuda averaged 75% of 2019 pre-pandemic traffic compared to 58% in 2022.
For the year ended December 31, 2023, revenue in the Concessions segment of $74 million was $2 million lower than in 2022. The decrease was largely due to the Bermuda International Airport where revenue in 2023 was $61 million compared to revenue in 2022 of $69 million. This decrease in revenue was driven by the above noted sale of a 49.9% interest in Skyport and the use of the equity method of accounting on a prospective basis for the Company’s retained 50.1% interest in Skyport. In 2023, passenger traffic levels in Bermuda averaged 75% of 2019 pre-pandemic traffic compared to 58% in 2022.
Operating profit in the Concessions segment of $174.1 million for the year ended December 31, 2023 improved by $152.0 million compared to an operating profit of $22.1 million in 2022. The higher operating profit resulted primarily from gains related to the sale of a 49.9% interest in the Bermuda International Airport concessionaire of $139.0 million, including a fair value remeasurement gain of $80.4 million on Aecon’s 50.1% retained interest in the concessionaire. The balance of the improvement in operating profit was related to higher income from management and development fees and an improvement in operating results at the Bermuda International Airport.
Operating profit in the Concessions segment of $174.1 million for the year ended December 31, 2023 improved by $152.0 million compared to an operating profit of $22.1 million in 2022. The higher operating profit resulted primarily from gains related to the sale of a 49.9% interest in the Bermuda International Airport concessionaire of $139.0 million, including a fair value remeasurement gain of $80.4 million on Aecon’s 50.1% retained interest in the concessionaire. The balance of the improvement in operating profit was related to higher income from management and development fees and an improvement in operating results at the Bermuda International Airport.
8.2. CONCESSIONS
8.2. CONCESSIONS
Financial Highlights
Three months ended Year ended $ millions December 31 December 31 2023 2022 2023 2022 Revenue $ 3.0 $ 20.6 $ 73.5 $ 75.9 Gross profit $ 1.0 $ 8.3 $ 32.4 $ 31.0 Income from projects accounted for using the equity method $ 2.6 $ 4.1 $ 15.8 $ 14.2 Adjusted EBITDA(1) $ 19.7 $ 19.3 $ 89.8 $ 71.0 Operating profit $ 4.6 $ 7.1 $ 174.1 $ 22.1 Backlog (at end of period) $ 104 $ 99
Aecon Group Inc. 24
Except for “O&M” activities under contract for the next five years and that can be readily quantified, Aecon does not include in its reported backlog expected revenue from concession agreements. As such, while Aecon expects future revenue from its concession assets, no concession backlog, other than from such O&M activities for the next five years, is reported.
Except for “O&M” activities under contract for the next five years and that can be readily quantified, Aecon does not include in its reported backlog expected revenue from concession agreements. As such, while Aecon expects future revenue from its concession assets, no concession backlog, other than from such O&M activities for the next five years, is reported.
Except for “O&M” activities under contract for the next five years and that can be readily quantified, Aecon does not include in its reported backlog expected revenue from concession agreements. As such, while Aecon expects future revenue from its concession assets, no concession backlog, other than from such O&M activities for the next five years, is reported.
9. QUARTERLY FINANCIAL DATA
9. QUARTERLY FINANCIAL DATA
9. QUARTERLY FINANCIAL DATA
Set out below is quarterly financial data for the most recent eight quarters:
Set out below is quarterly financial data for the most recent eight quarters:
Set out below is quarterly financial data for the most recent eight quarters:
$ millions (except per share amounts)
$ millions (except per share amounts)
$ millions (except per share amounts)
(1) This is a non-GAAP
(1) This is a non-GAAP financial measure. Refer to Section 4 “Non-GAAP and Supplementary Financial Measures” in this MD&A for more information on each non-GAAP financial measure.
Earnings (loss) per share for each quarter has been computed using the weighted average number of shares issued and outstanding during the respective quarter. Any dilutive securities, which increase the earnings per share or decrease the loss per share, are excluded for purposes of calculating diluted earnings per share. Due to the impacts of dilutive securities, such as convertible debentures, and share issuances and repurchases throughout the periods, the sum of the quarterly earnings (losses) per share will not necessarily equal the total for the year.
Earnings (loss) per share for each quarter has been computed using the weighted average number of shares issued and outstanding during the respective quarter. Any dilutive securities, which increase the earnings per share or decrease the loss per share, are excluded for purposes of calculating diluted earnings per share. Due to the impacts of dilutive securities, such as convertible debentures, and share issuances and repurchases throughout the periods, the sum of the quarterly earnings (losses) per share will not necessarily equal the total for the year.
Earnings (loss) per share for each quarter has been computed using the weighted average number of shares issued and outstanding during the respective quarter. Any dilutive securities, which increase the earnings per share or decrease the loss per share, are excluded for purposes of calculating diluted earnings per share. Due to the impacts of dilutive securities, such as convertible debentures, and share issuances and repurchases throughout the periods, the sum of the quarterly earnings (losses) per share will not necessarily equal the total for the year.
Set out below is the calculation of Adjusted EBITDA for the most recent eight quarters:
Set out below is the calculation of Adjusted EBITDA for the most recent eight quarters:
Set out below is the calculation of Adjusted EBITDA for the most recent eight quarters:
$ millions
(1) This is a non-GAAP financial measure. Refer to Section 4 “Non-GAAP and Supplementary Financial Measures” in this MD&A for more information on each non-GAAP financial measure.
(1) This is a non-GAAP financial measure. Refer to Section 4 “Non-GAAP and Supplementary Financial Measures” in this MD&A for more information on each non-GAAP financial measure.
(1) This is a non-GAAP financial measure. Refer to Section 4 “Non-GAAP and Supplementary Financial Measures” in this MD&A for more information on each non-GAAP financial measure.
2023 Annual Report 25
2023 2022 Quarter 4 Quarter 3 Quarter 2 Quarter 1 Quarter 4 Quarter 3 Quarter 2 Quarter 1 Revenue $ 1,130.2 $ 1,239.6 $ 1,166.9 $ 1,107.2 $ 1,266.8 $ 1,320.5 $ 1,123.2 $ 985.9 Adjusted EBITDA(1) 70.2 32.0 16.7 24.6 67.5 92.6 38.5 20.6 Earnings (loss) before income taxes 20.3 125.8 41.3 (9.9) 25.8 46.5 (8.0) (21.3) Profit (loss) 9.7 133.4 28.2 (9.4) 19.7 34.5 (6.4) (17.4) Earnings (loss) per share: Basic 0.16 2.16 0.46 (0.15) 0.32 0.57 (0.10) (0.29) Diluted 0.15 1.63 0.38 (0.15) 0.26 0.45 (0.10) (0.29)
financial measure. Refer to Section 4 “Non-GAAP and Supplementary Financial Measures” in this MD&A for more information on each non-GAAP financial measure.
$ millions 2023 2022 Quarter 4 Quarter 3 Quarter 2 Quarter 1 Quarter 4 Quarter 3 Quarter 2 Quarter 1 Operating profit (loss) $ 39.6 $ 140.1 $ 55.6 $ 5.6 $ 40.7 $ 61.0 $ 5.1 $ (9.6) Depreciation and amortization 14.6 20.3 21.2 22.9 23.9 23.8 23.6 22.9 (Gain) loss on sale of assets and subsidiaries (1.9) (138.6) (69.6) (12.2) (7.6) (2.5) (0.3) (2.1) (Income) from projects accounted for using the equity method (5.5) (5.2) (4.8) (3.3) (5.9) (5.0) (3.7) (3.0) Equity Project EBITDA(1) 23.4 15.4 14.2 11.6 16.4 15.4 13.8 12.4 Adjusted EBITDA(1) $ 70.2 $ 32.0 $ 16.7 $ 24.6 $ 67.5 $ 92.6 $ 38.5 $ 20.6
2023 2022 Quarter 4 Quarter 3 Quarter 2 Quarter 1 Quarter 4 Quarter 3 Quarter 2 Quarter 1 Revenue $ 1,130.2 $ 1,239.6 $ 1,166.9 $ 1,107.2 $ 1,266.8 $ 1,320.5 $ 1,123.2 $ 985.9 Adjusted EBITDA(1) 70.2 32.0 16.7 24.6 67.5 92.6 38.5 20.6 Earnings (loss) before income taxes 20.3 125.8 41.3 (9.9) 25.8 46.5 (8.0) (21.3) Profit (loss) 9.7 133.4 28.2 (9.4) 19.7 34.5 (6.4) (17.4) Earnings (loss) per share: Basic 0.16 2.16 0.46 (0.15) 0.32 0.57 (0.10) (0.29) Diluted 0.15 1.63 0.38 (0.15) 0.26 0.45 (0.10) (0.29) (1) This
non-GAAP
this
is a
financial measure. Refer to Section 4 “Non-GAAP and Supplementary Financial Measures” in
MD&A for more information on each non-GAAP financial measure.
$ millions 2023 2022 Quarter 4 Quarter 3 Quarter 2 Quarter 1 Quarter 4 Quarter 3 Quarter 2 Quarter 1 Operating profit (loss) $ 39.6 $ 140.1 $ 55.6 $ 5.6 $ 40.7 $ 61.0 $ 5.1 $ (9.6) Depreciation and amortization 14.6 20.3 21.2 22.9 23.9 23.8 23.6 22.9 (Gain) loss on sale of assets and subsidiaries (1.9) (138.6) (69.6) (12.2) (7.6) (2.5) (0.3) (2.1) (Income) from projects accounted for using the equity method (5.5) (5.2) (4.8) (3.3) (5.9) (5.0) (3.7) (3.0) Equity Project EBITDA(1) 23.4 15.4 14.2 11.6 16.4 15.4 13.8 12.4 Adjusted EBITDA(1) $ 70.2 $ 32.0 $ 16.7 $ 24.6 $ 67.5 $ 92.6 $ 38.5 $ 20.6
Set out below is the calculation of Equity Project EBITDA for the most recent eight quarters:
Set out below is the calculation of Equity Project EBITDA for the most recent eight quarters:
Set out below is the calculation of Equity Project EBITDA for the most recent eight quarters:
$ millions
$ millions
$ millions
Set out below is the calculation of Equity Project EBITDA for the most recent eight quarters: $ millions
Aecon's proportionate share of projects accounted for using the equity method (1)
Aecon's proportionate share of projects accounted for using the equity
Aecon's proportionate share of projects accounted for using the
(1) Refer to Note 12 “Projects Accounted for Using the Equity Method” in the Company’s audited consolidated financial statements for the year ended December 31, 2023.
(1) Refer to Note 12 “Projects Accounted for Using the Equity Method” in the Company’s audited consolidated financial statements for the year ended December 31, 2023.
(1) Refer to Note 12 “Projects Accounted for Using the Equity Method” in the Company’s audited consolidated financial statements for the year ended December 31, 2023.
(1) Refer to Note 12 “Projects Accounted for Using the Equity Method” in the Company’s audited consolidated financial statements for the year ended December 31, 2023.
(2) This is a non-GAAP financial measure. Refer to Section 4 “Non-GAAP and Supplementary Financial Measures” in this MD&A for more information on each non-GAAP financial measure.
(2) This is a non-GAAP financial measure. Refer to Section 4 “Non-GAAP and Supplementary Financial Measures” in this MD&A for more information on each non-GAAP financial measure.
(2) This is a non-GAAP financial measure. Refer to Section 4 “Non-GAAP and Supplementary Financial Measures” in this MD&A for more information on each non-GAAP financial measure.
(2) This is a non-GAAP financial measure. Refer to Section 4 “Non-GAAP and Supplementary Financial Measures” in this MD&A for more information on each non-GAAP financial measure.
Set out below is the calculation of Adjusted EBITDA by segment for the three months and years ended December 31, 2023 and 2022:
Set out below is the calculation of Adjusted EBITDA by segment for the three months and years ended December 31, 2023 and 2022:
Set out below is the calculation of Adjusted EBITDA by segment for the three months and years ended December 31, 2023 and 2022:
Set out below is the calculation of Adjusted EBITDA by segment for the three months and years ended December 31, 2023 and 2022:
$ millions
$
$ millions
$ millions
(1) This is a non-GAAP financial measure. Refer to Section 4 “Non-GAAP and Supplementary Financial Measures” in this MD&A for more information on each non-GAAP financial measure.
(1) This is a non-GAAP financial measure. Refer to Section 4 “Non-GAAP and Supplementary Financial Measures” in this MD&A for more information on each non-GAAP financial measure.
(1) This is a non-GAAP financial measure. Refer to Section 4 “Non-GAAP and Supplementary Financial Measures” in this MD&A for more information on each non-GAAP financial measure.
(1) This is a non-GAAP financial measure. Refer to Section 4 “Non-GAAP and Supplementary Financial Measures” in this MD&A for more information on each non-GAAP financial measure.
2023 2022
Quarter 4 Quarter 3 Quarter 2 Quarter 1 Quarter 4 Quarter 3 Quarter 2 Quarter 1 Operating profit $ 19.6 $ 15.4 $ 14.1 $ 11.4 $ 16.2 $ 15.2 $ 13.6 $ 12.2 Depreciation and amortization 3.8 - 0.1 0.2 0.2 0.2 0.2 0.2 Equity Project EBITDA(2) 23.4 15.4 14.2 11.6 16.4 15.4 13.8 12.4
millions Three months ended December 31, 2023 Year ended December 31, 2023 Construction Concessions Other costs and eliminations Consolidated Construction Concessions Other costs and eliminations Consolidated Operating profit (loss) $ 49.1 $ 4.6 $ (14.1) $ 39.6 $ 59.0 $ 174.1 $ 7.8 $ 240.9 Depreciation and amortization 14.9 0.1 (0.4) 14.6 61.1 17.0 1.0 79.1 (Gain) loss on sale of assets (1.8) - (0.1) (1.9) (28.8) (139.0) (54.5) (222.3) (Income) from projects accounted for using the equity method (2.9) (2.6) - (5.5) (2.9) (15.8) - (18.7) Equity Project EBITDA(1) 5.7 17.7 - 23.4 10.9 53.6 - 64.5 Adjusted EBITDA(1) $ 65.0 $ 19.7 $ (14.5) $ 70.2 $ 99.4 $ 89.8 $ (45.8) $ 143.4 $ millions Three months ended December 31, 2022 Year ended December 31, 2022 Construction Concessions Other costs and eliminations Consolidated Construction Concessions Other costs and eliminations Consolidated Operating profit (loss) $ 43.6 $ 7.1 $ (9.9) $ 40.7 $ 120.9 $ 22.1 $ (45.9) $ 97.2 Depreciation and amortization 17.7 5.6 0.5 23.9 70.9 21.7 1.5 94.2 (Gain) on sale of assets (7.6) - - (7.6) (12.6) - - (12.6) (Income) from projects accounted for using the equity method (1.8) (4.1) - (5.9) (3.5) (14.2) - (17.7) Equity Project EBITDA(1) 5.7 10.7 - 16.4 16.7 41.4 - 58.1 Adjusted EBITDA(1) $ 57.5 $ 19.3 $ (9.4) $ 67.5 $ 192.5 $ 71.0 $ (44.3) $ 219.2
$
2023 2022
equity method (1) Quarter 4 Quarter 3 Quarter 2 Quarter 1 Quarter 4 Quarter 3 Quarter 2 Quarter 1 Operating profit $ 19.6 $ 15.4 $ 14.1 $ 11.4 $ 16.2 $ 15.2 $ 13.6 $ 12.2 Depreciation and amortization 3.8 - 0.1 0.2 0.2 0.2 0.2 0.2 Equity Project EBITDA(2) 23.4 15.4 14.2 11.6 16.4 15.4 13.8 12.4
millions Three months ended December 31, 2023 Year ended December 31, 2023 Construction Concessions Other costs and eliminations Consolidated Construction Concessions Other costs and eliminations Consolidated Operating profit (loss) $ 49.1 $ 4.6 $ (14.1) $ 39.6 $ 59.0 $ 174.1 $ 7.8 $ 240.9 Depreciation and amortization 14.9 0.1 (0.4) 14.6 61.1 17.0 1.0 79.1 (Gain) loss on sale of assets (1.8) - (0.1) (1.9) (28.8) (139.0) (54.5) (222.3) (Income) from projects accounted for using the equity method (2.9) (2.6) - (5.5) (2.9) (15.8) - (18.7) Equity Project EBITDA(1) 5.7 17.7 - 23.4 10.9 53.6 - 64.5 Adjusted EBITDA(1) $ 65.0 $ 19.7 $ (14.5) $ 70.2 $ 99.4 $ 89.8 $ (45.8) $ 143.4 $ millions Three months ended December 31, 2022 Year ended December 31, 2022 Construction Concessions Other costs and eliminations Consolidated Construction Concessions Other costs and eliminations Consolidated Operating profit (loss) $ 43.6 $ 7.1 $ (9.9) $ 40.7 $ 120.9 $ 22.1 $ (45.9) $ 97.2 Depreciation and amortization 17.7 5.6 0.5 23.9 70.9 21.7 1.5 94.2 (Gain) on sale of assets (7.6) - - (7.6) (12.6) - - (12.6) (Income) from projects accounted for using the equity method (1.8) (4.1) - (5.9) (3.5) (14.2) - (17.7) Equity Project EBITDA(1) 5.7 10.7 - 16.4 16.7 41.4 - 58.1 Adjusted EBITDA(1) $ 57.5 $ 19.3 $ (9.4) $ 67.5 $ 192.5 $ 71.0 $ (44.3) $ 219.2
2023 2022
method (1) Quarter 4 Quarter 3 Quarter 2 Quarter 1 Quarter 4 Quarter 3 Quarter 2 Quarter 1 Operating profit $ 19.6 $ 15.4 $ 14.1 $ 11.4 $ 16.2 $ 15.2 $ 13.6 $ 12.2 Depreciation and amortization 3.8 - 0.1 0.2 0.2 0.2 0.2 0.2 Equity Project EBITDA(2) 23.4 15.4 14.2 11.6 16.4 15.4 13.8 12.4
Three months ended December 31, 2023 Year ended December 31, 2023 Construction Concessions Other costs and eliminations Consolidated Construction Concessions Other costs and eliminations Consolidated Operating profit (loss) $ 49.1 $ 4.6 $ (14.1) $ 39.6 $ 59.0 $ 174.1 $ 7.8 $ 240.9 Depreciation and amortization 14.9 0.1 (0.4) 14.6 61.1 17.0 1.0 79.1 (Gain) loss on sale of assets (1.8) - (0.1) (1.9) (28.8) (139.0) (54.5) (222.3) (Income) from projects accounted for using the equity method (2.9) (2.6) - (5.5) (2.9) (15.8) - (18.7) Equity Project EBITDA(1) 5.7 17.7 - 23.4 10.9 53.6 - 64.5 Adjusted EBITDA(1) $ 65.0 $ 19.7 $ (14.5) $ 70.2 $ 99.4 $ 89.8 $ (45.8) $ 143.4 $ millions Three months ended December 31, 2022 Year ended December 31, 2022 Construction Concessions Other costs and eliminations Consolidated Construction Concessions Other costs and eliminations Consolidated Operating profit (loss) $ 43.6 $ 7.1 $ (9.9) $ 40.7 $ 120.9 $ 22.1 $ (45.9) $ 97.2 Depreciation and amortization 17.7 5.6 0.5 23.9 70.9 21.7 1.5 94.2 (Gain) on sale of assets (7.6) - - (7.6) (12.6) - - (12.6) (Income) from projects accounted for using the equity method (1.8) (4.1) - (5.9) (3.5) (14.2) - (17.7) Equity Project EBITDA(1) 5.7 10.7 - 16.4 16.7 41.4 - 58.1 Adjusted EBITDA(1) $ 57.5 $ 19.3 $ (9.4) $ 67.5 $ 192.5 $ 71.0 $ (44.3) $ 219.2
Aecon Group Inc. 26
Set out below is the calculation of Equity Project EBITDA by segment for the three months and years ended December 31, 2023 and 2022:
Set out below is the calculation of Equity Project EBITDA by segment for the three months and years ended December 31, 2023 and 2022:
Set out below is the calculation of Equity Project EBITDA by segment for the three months and years ended December 31, 2023 and 2022:
Set out below is the calculation of Equity Project EBITDA by segment for the three months and years ended December 31, 2023 and 2022:
$ millions
$ millions
$ millions
$ millions
Three months ended December 31, 2023
Three months ended December 31, 2023
Year ended December 31, 2023
Year ended December 31, 2023
Aecon's proportionate share of projects accounted for using the equity method (1)
Aecon's proportionate share of projects accounted for using the equity method (1)
Aecon's proportionate share of projects accounted for using the equity method (1)
$ millions
projects
share of projects accounted for using the equity
share of projects accounted for using the equity
using the equity
(1) Refer to Note 12 “Projects Accounted for Using the Equity Method” in the Company’s audited consolidated financial statements for the year ended December 31, 2023.
(1) Refer to Note 12 “Projects Accounted for Using the Equity Method” in the Company’s audited consolidated financial statements for the year ended December 31, 2023.
(1) Refer to Note 12 “Projects Accounted for Using the Equity Method” in the Company’s audited consolidated financial statements for the year ended December 31, 2023.
(1) Refer to Note 12 “Projects Accounted for Using the Equity Method” in the Company’s audited consolidated financial statements for the year ended December 31, 2023.
(2) This is a non-GAAP financial measure. Refer to Section 4 “Non-GAAP and Supplementary Financial Measures” in this MD&A for more information on each non-GAAP financial measure.
(2) This is a non-GAAP financial measure. Refer to Section 4 “Non-GAAP and Supplementary Financial Measures” in this MD&A for more information on each non-GAAP financial measure.
(2) This is a non-GAAP financial measure. Refer to Section 4 “Non-GAAP and Supplementary Financial Measures” in this MD&A for more information on each non-GAAP financial measure.
(2) This is a non-GAAP financial measure. Refer to Section 4 “Non-GAAP and Supplementary Financial Measures” in this MD&A for more information on each non-GAAP financial measure.
Quarterly Financial Highlights
Quarterly Financial Highlights
Quarterly Financial Highlights
Quarterly Financial Highlights
$ millions
$ millions
$ millions
Three months ended December 31
Three months ended December 31
Three months ended December 31
The analysis of operating results for each of the first three quarters of 2023 is included in Management’s Discussion and Analysis included in the Interim Reports to Shareholders for each respective quarter. The construction industry in Canada is seasonal in nature for companies like Aecon that perform a significant portion of their work outdoors, particularly road construction and utilities work. As a result, a larger portion of this work is performed in the summer and fall months than in the winter and early spring months.
The analysis of operating results for each of the first three quarters of 2023 is included in Management’s Discussion and Analysis included in the Interim Reports to Shareholders for each respective quarter. The construction industry in Canada is seasonal in nature for companies like Aecon that perform a significant portion of their work outdoors, particularly road construction and utilities work. As a result, a larger portion of this work is performed in the summer and fall months than in the winter and early spring months.
The analysis of operating results for each of the first three quarters of 2023 is included in Management’s Discussion and Analysis included in the Interim Reports to Shareholders for each respective quarter. The construction industry in Canada is seasonal in nature for companies like Aecon that perform a significant portion of their work outdoors, particularly road construction and utilities work. As a result, a larger portion of this work is performed in the summer and fall months than in the winter and early spring months.
The analysis of operating results for each of the first three quarters of 2023 is included in Management’s Discussion and Analysis included in the Interim Reports to Shareholders for each respective quarter. The construction industry in Canada is seasonal in nature for companies like Aecon that perform a significant portion of their work outdoors, particularly road construction and utilities work. As a result, a larger portion of this work is performed in the summer and fall months than in the winter and early spring months.
For the three months ended December 31, 2023, revenue in the Construction segment of $1,127 million was $119 million, or 10%, lower than the fourth quarter of 2022. Construction segment revenue was lower in industrial operations ($106 million), primarily due to decreased activity on mainline pipeline work in western Canada; in civil operations ($67 million), largely from a lower volume of roadbuilding construction work in eastern Canada of $99 million due to the sale of ATE in the second quarter of 2023, partially offset by an
For the three months ended December 31, 2023, revenue in the Construction segment of $1,127 million was $119 million, or 10%, lower than the fourth quarter of 2022. Construction segment revenue was lower in industrial operations ($106 million), primarily due to decreased activity on mainline pipeline work in western Canada; in civil operations ($67 million), largely from a lower volume of roadbuilding construction work in eastern Canada of $99 million due to the sale of ATE in the second quarter of 2023, partially offset by an
For the three months ended December 31, 2023, revenue in the Construction segment of $1,127 million was $119 million, or 10%, lower than the fourth quarter of 2022. Construction segment revenue was lower in industrial operations ($106 million), primarily due to decreased activity on mainline pipeline work in western Canada; in civil operations ($67 million), largely from a lower volume of roadbuilding construction work in eastern Canada of $99 million due to the sale of ATE in the second quarter of 2023, partially offset by an
For the three months ended December 31, 2023, revenue in the Construction segment of $1,127 million was $119 million, or 10%, lower than the fourth quarter of 2022. Construction segment revenue was lower in industrial operations ($106 million), primarily due to decreased activity on mainline pipeline work in western Canada; in civil operations ($67 million), largely from a lower volume of roadbuilding construction work in eastern Canada of $99 million due to the sale of ATE in the second quarter of 2023, partially offset by an
Year
December 31,
Construction Concessions Other costs and eliminations Consolidated Construction Concessions Other costs and eliminations Consolidated Operating profit $ 5.7 $ 13.9 $ - $ 19.6 $ 10.7 $ 49.8 $ - $ 60.5 Depreciation and amortization - 3.8 - 3.8 0.2 3.8 - 4.0 Equity Project EBITDA(2) $ 5.7 $ 17.7 $ - $ 23.4 $ 10.9 $ 53.6 $ - $ 64.5 $ millions Three months ended December 31, 2022 Year ended December 31, 2022 Aecon's proportionate share of
accounted for
method (1) Construction Concessions Other costs and eliminations Consolidated Construction Concessions Other costs and eliminations Consolidated Operating profit $ 5.5 $ 10.7 $ - $ 16.2 $ 16.0 $ 41.4 $ - $ 57.4 Depreciation and amortization 0.2 - - 0.2 0.7 - - 0.7 Equity Project EBITDA(2) $ 5.7 $ 10.7 $ - $ 16.4 $ 16.7 $ 41.4 $ - $ 58.1
Three months ended December 31, 2023
ended
2023
Revenue Operating profit 2023 2022 2023 2022 Construction $1,127.2 $1,246.3 $49.1 $43.6 Concessions 3.0 20.6 4.6 7.1 Other costs and eliminations - - (14.1) (9.9) Consolidated $1,130.2 $1,266.8 $39.6 $40.7
Construction Concessions Other costs and eliminations Consolidated Construction Concessions Other costs and eliminations Consolidated Operating profit $ 5.7 $ 13.9 $ - $ 19.6 $ 10.7 $ 49.8 $ - $ 60.5 Depreciation and amortization - 3.8 - 3.8 0.2 3.8 - 4.0 Equity Project EBITDA(2) $ 5.7 $ 17.7 $ - $ 23.4 $ 10.9 $ 53.6 $ - $ 64.5 $
Three months ended December 31, 2022 Year ended December 31, 2022 Aecon's proportionate
method (1) Construction Concessions Other costs and eliminations Consolidated Construction Concessions Other costs and eliminations Consolidated Operating profit $ 5.5 $ 10.7 $ - $ 16.2 $ 16.0 $ 41.4 $ - $ 57.4 Depreciation and amortization 0.2 - - 0.2 0.7 - - 0.7 Equity Project EBITDA(2) $ 5.7 $ 10.7 $ - $ 16.4 $ 16.7 $ 41.4 $ - $ 58.1
millions
Revenue Operating profit 2023 2022 2023 2022 Construction $1,127.2 $1,246.3 $49.1 $43.6 Concessions 3.0 20.6 4.6 7.1 Other costs and eliminations - - (14.1) (9.9) Consolidated $1,130.2 $1,266.8 $39.6 $40.7
Construction Concessions Other costs and eliminations Consolidated Construction Concessions Other costs and eliminations Consolidated Operating profit $ 5.7 $ 13.9 $ - $ 19.6 $ 10.7 $ 49.8 $ - $ 60.5 Depreciation and amortization - 3.8 - 3.8 0.2 3.8 - 4.0 Equity Project EBITDA(2) $ 5.7 $ 17.7 $ - $ 23.4 $ 10.9 $ 53.6 $ - $ 64.5
millions Three months ended December 31, 2022 Year ended December 31, 2022 Aecon's
method (1) Construction Concessions Other costs and eliminations Consolidated Construction Concessions Other costs and eliminations Consolidated Operating profit $ 5.5 $ 10.7 $ - $ 16.2 $ 16.0 $ 41.4 $ - $ 57.4 Depreciation and amortization 0.2 - - 0.2 0.7 - - 0.7 Equity Project EBITDA(2) $ 5.7 $ 10.7 $ - $ 16.4 $ 16.7 $ 41.4 $ - $ 58.1
$
proportionate
Revenue Operating profit 2023 2022 2023 2022 Construction $1,127.2 $1,246.3 $49.1 $43.6 Concessions 3.0 20.6 4.6 7.1 Other costs and eliminations - - (14.1) (9.9) Consolidated $1,130.2 $1,266.8 $39.6 $40.7
2023 Annual Report 27
increase in major projects work in western Canada; in utilities operations ($22 million), due to a decreased volume of gas and telecommunications work; and in nuclear operations ($1 million). These decreases were partially offset in urban transportation solutions ($77 million), primarily from an increase in rail expansion and electrification work in Ontario.
Operating profit in the Construction segment of $49.1 million in the fourth quarter of 2023 increased by $5.5 million compared to operating profit of $43.6 million in the fourth quarter of 2022. Higher operating profit in urban transportation solutions was driven by a negative gross profit of $40.0 million in the fourth quarter of 2023 from two of the four fixed price legacy projects compared to a negative gross profit of $62.9 million in the same period in 2022 from the same projects, as well as from higher volume and gross profit margin from the balance of the urban transportation solutions sector. Operating profit was also higher in industrial operations due to higher gross profit margin in the period. Partially offsetting these increases was lower operating profit in civil operations driven by the sale of ATE in the second quarter of 2023 ($10.5 million), gross profit of $nil in the fourth quarter of 2023 from one of the four fixed price legacy projects versus a gross profit of $4.0 million in the same period in 2022 from the same project, as well as lower gross profit margin in the balance of the civil sector. In addition, operating profit was lower in nuclear operations from lower gross profit margin, and lower in utilities due to higher MG&A.
Revenue in the Concessions segment in the fourth quarter of 2023 of $3 million was lower by $18 million when compared to the same period in 2022, primarily due to lower revenue from the Bermuda International Airport following the sale of a 49.9% interest in Skyport on September 20, 2023 and the commencement of equity method accounting for the project. See Section 5 “Recent Developments” of this MD&A for details of the completed sale of a 49.9% interest in Skyport. In the fourth quarter of 2023, passenger traffic levels in Bermuda averaged 77% of fourth quarter 2019 pre-pandemic traffic, compared to 63% in the fourth quarter of 2022.
Concessions segment operating profit of $4.6 million in the fourth quarter of 2023 was $2.5 million lower than the same period in 2022 as a result of lower operating profit from the Bermuda International Airport driven by the sale of a 49.9% interest in the project in the third quarter of 2023, partially offset by higher income from management and development fees related to other projects accounted for using the equity method.
MG&A expense increased in the fourth quarter of 2023 by $3.7 million compared to the same period in 2022, largely due to higher personnel costs. MG&A as a percentage of revenue increased from 3.8% in the fourth quarter of 2022 to 4.6% in the same period in 2023.
Aecon reported income from projects accounted for using the equity method of $5.5 million in the fourth quarter of 2023 compared to $5.9 million in the same period in 2022. The lower income in the fourth quarter of 2023 in the Concessions segment ($1.4 million) was driven by the Skyport operations and partially offset in the Construction segment ($1.0 million) by an increase from civil projects.
Other income of $2.6 million in the fourth quarter of 2023 was $5.5 million lower compared to the same period in 2022, primarily related to lower gains on the sale of equipment and other assets in the Construction segment ($5.7 million) and from lower foreign exchange gains ($0.7 million), partially offset by a higher fair value gain on financial instruments ($0.9 million).
Depreciation and amortization expense of $14.6 million in the fourth quarter of 2023 was $9.3 million lower than the same period in 2022 with decreases in Concessions ($5.6 million) driven by the Bermuda Airport
Aecon Group Inc. 28
project, in Construction ($2.8 million) due to the sale of ATE in the second quarter of 2023, and in Corporate ($0.9 million).
project, in Construction ($2.8 million) due to the sale of ATE in the second quarter of 2023, and in Corporate ($0.9 million).
Net financing expense of $19.2 million in the fourth quarter of 2023, consisting of finance cost of $21.4 million less finance income of $2.2 million, was $4.3 million higher than the same period in 2022. The increase is primarily related to accrued dividends of $3.6 million, a fair value gain of $2.9 million, and one-time transaction costs of $13.3 million all related to the issuance of Preferred Shares by Aecon Utilities in the fourth quarter of 2023, partially offset by lower interest expense related to the Bermuda International Airport project following the commencement of equity of accounting for Aecon’s retained 50.1 % interest in the project, and lower borrowings on Aecon’s revolving credit facilities compared to the same period in 2022.
Net financing expense of $19.2 million in the fourth quarter of 2023, consisting of finance cost of $21.4 million less finance income of $2.2 million, was $4.3 million higher than the same period in 2022. The increase is primarily related to accrued dividends of $3.6 million, a fair value gain of $2.9 million, and one-time transaction costs of $13.3 million all related to the issuance of Preferred Shares by Aecon Utilities in the fourth quarter of 2023, partially offset by lower interest expense related to the Bermuda International Airport project following the commencement of equity of accounting for Aecon’s retained 50.1 % interest in the project, and lower borrowings on Aecon’s revolving credit facilities compared to the same period in 2022.
New contract awards for the three months ended December 31, 2023 were $1,085 million compared to $1,288 million in the same period in 2022.
New contract awards for the three months ended December 31, 2023 were $1,085 million compared to $1,288 million in the same period in 2022.
Selected Annual Information
Selected Annual Information
Set out below is selected annual information for each of the last three years.
Set out below is selected annual information for each of the last three years.
($ millions, except per share amounts) 2023 2022 2021 Total revenue $ 4,643.8 $ 4,696.6 $ 3,977.3 Operating profit 240.9 97.2 118.8 Profit 161.9 30.4 49.7 Per share: Basic 2.62 0.50 0.82 Diluted 2.10 0.47 0.78 Total assets 3,195.6 3,567.0 3,286.8 Non-current financial liabilities at December 31 393.4 778.6 903.7 Cash dividends declared per common share 0.74 0.74 0.70 2023 Annual Report 29
10. FINANCIAL CONDITION, LIQUIDITY AND CAPITAL RESOURCES
10.1. INTRODUCTION
Aecon’s participation in joint arrangements classified as joint operations is accounted for in the Company’s audited consolidated financial statements and the notes thereto for the year ended December 31, 2023 by reflecting, line by line, Aecon’s share of the assets held jointly, liabilities incurred jointly, and revenue and expenses arising from the joint operations.
Aecon’s participation in joint arrangements classified as joint ventures, as well as Aecon’s participation in project entities where Aecon exercises significant influence over the entity but does not control or jointly control the entity (i.e. associates), is accounted for using the equity method.
For further information, see Note 12 “Projects Accounted for Using the Equity Method” to the Company’s audited consolidated financial statements for the year ended December 31, 2023.
10.2. CONTINGENCIES
Coastal GasLink Pipeline, Sections 3 and 4
The project has been delayed and impacted by various events for which SA Energy Group (“SAEG”), a partnership in which the Company holds a 50% interest, asserts Coastal GasLink (“CGL”) is contractually responsible, including, but not limited to, significant scope changes and delays by CGL, unforeseen site conditions, compensable adverse weather impacts and a suspension implemented by CGL as a result of regulatory restrictions imposed due to the COVID-19 pandemic. SAEG asserts that it is entitled to additional compensation for costs associated with those delays and impacts and commenced an arbitration in the second quarter of 2021 pursuant to the terms of the contract to resolve the matter. In the third quarter of 2022, CGL issued a counterclaim, alleging breach of contract and damages arising therefrom; CGL did not articulate the amount of damages it was seeking. In the first quarter of 2023, CGL withdrew its allegations of breach of contract and related damages from its counterclaim. The arbitration hearing is scheduled to commence in the third quarter of 2024. While this commercial dispute could result in a material impact to Aecon’s earnings, cash flow, and financial position if not resolved favourably through ongoing negotiations or arbitration, the ultimate results cannot be predicted at this time.
Kemano Generating Station Second Tunnel Project
During the second quarter of 2020, Rio Tinto issued a notice of termination of contract to the joint venture in which Aecon holds a 40% interest with respect to the Kemano Generating Station Second Tunnel Project. Rio Tinto also issued notice to the joint ventures’ sureties asserting a claim on the 50% performance bonds; the sureties entered into a cooperation agreement with Rio Tinto but have not taken a position on the validity of this claim on the bonds. In the third quarter of 2020, the joint venture issued a notice of civil claim seeking approximately $105 million in damages from Rio Tinto. The joint venture also registered and perfected a builders’ lien against project lands, providing security over approximately $97 million of the claimed damages. In the first quarter of 2021, Rio Tinto issued a counterclaim against the joint venture but did not articulate the amount of damages it may seek from the joint venture; such amount is expected to be material. While it is possible that this commercial dispute could result in a material impact to Aecon’s earnings and cash
Aecon Group Inc. 30
flow if not resolved, the ultimate results cannot be predicted at this time. The aforementioned notice of civil claim was commenced in the Supreme Court of British Columbia between Frontier Kemper Constructors and Frontier Kemper – Aecon Joint Venture as plaintiffs/defendants by counterclaim and Rio Tinto Alcan Inc. and Aluminum Company of Canada Limited/Aluminum Du Canada Limitée as the defendants/plaintiffs by counterclaim.
K+S Potash Canada
During the second quarter of 2018, the Company filed a statement of claim in the Court of King’s Bench for Saskatchewan (the “Court”) against K+S Potash Canada (“KSPC”) and KSPC filed a statement of claim in the Court against the Company. Both actions relate to the Legacy mine project in Bethune, Saskatchewan. The Company is seeking $180 million in payments due to it pursuant to agreements entered into between the Company and KSPC with respect to the project plus approximately $14 million in damages. The Company has recorded $140 million of unbilled revenue and accounts receivable at December 31, 2023. Offsetting this amount to some extent, the Company has accrued $45 million in trade and other payables for potential payments to third parties pending the outcome of the claim against KSPC. KSPC is seeking an order that the Company repay to KSPC approximately $195 million already paid to the Company pursuant to such agreements. The Company has also been brought into two other lawsuits in the same Court between KSPC and various other contractors involved with the Legacy mine project, both relating to matters which the Company believes are materially covered by insurance coverage, to the extent of any liability. In the fourth quarter of 2022, the Court issued a decision allowing an application by Aecon to add KSPC’s parent company K+S Aktiengesellschaft (“KSAG”) as a defendant to the lawsuit arising from KSAG’s conduct in inducing KSPC to breach its contract with Aecon. These claims may not be resolved for several years. While the Company considers KSPC’s claim to be without merit and does not expect that the resolution of these claims will cause a material impact to its financial position, the ultimate results cannot be predicted at this time.
Critical Accounting Estimates – Certain Fixed Price Legacy Projects
Four large fixed price legacy projects being performed by joint ventures in which Aecon is a participant (see Section 13 “Risk Factors” in this MD&A), are being negatively impacted due to additional costs for which the joint ventures assert that the owners are contractually responsible, including for, among other things, unforeseeable site conditions, third party delays, impacts of COVID-19, supply chain disruptions, and inflation related to labour and materials. Revenue and income from these contracts are determined by the percentage of completion method, based on the ratio of costs incurred to date over estimated total costs at completion of the project. The Company has a process whereby progress to completion is reviewed by management on a regular basis and estimated costs to complete are updated as necessary. Claims are amounts in excess of the agreed contract price, or amounts not included in the original contract price, that the relevant joint venture seeks to collect from clients for delays, errors in specifications and designs, contract terminations, change orders in dispute or unapproved as to both scope and price, or other causes of unanticipated additional costs that the Company and the relevant joint venture believes the owner is contractually responsible. Due to unforeseen changes in estimates of the nature or cost of the work to be completed and / or changes in estimates of related revenue, contract profit can differ significantly from earlier estimates (See Section 13 “Risk Factors”: “Large Project Risk”, “Certain Fixed Price Legacy Projects”, “Contractual Factors”, “Litigation Risk and Claims Risk”, “Increases in the Cost of Raw Materials”, “Supply Chain Disruption”, “Risks Related to the COVID-19 Pandemic and Associated Supports under Government Assistance Programs” and “Force Majeure Events” in this MD&A). In 2023 and 2022, due to the factors discussed above that impacted these four fixed price legacy projects during the year, Aecon recognized
2023 Annual Report 31
an operating loss of $215.2 million and $120.0 million, respectively, related to these four projects. See also Section 5 “Recent Developments” in this MD&A.
projects during the year, Aecon recognized an operating loss of $215.2 million and $120.0 million, respectively, related to these four projects. See also Section 5 “Recent Developments” in this MD&A.
projects during the year, Aecon recognized an operating loss of $215.2 million and $120.0 million, respectively, lopments” in this MD&A.
10.3. CASH AND DEBT BALANCES
10.3. CASH AND DEBT BALANCES
Cash balances at December 31, 2023 and 2022 are as follows:
Cash balances at December 31, 2023 and 2022 are as follows:
Cash balances at December 31, 2023 and 2022 are as follows:
$ millions
$ millions
December 31, 2023
Balances
December 31, 2023 Balances
December 31, 2022
December 31, 2022
(1) Cash and cash equivalents include cash on deposit in bank accounts of joint operations which Aecon cannot access directly.
(1) Cash and cash equivalents include cash on deposit in bank accounts of joint operations which Aecon cannot access directly.
(1) Cash and cash equivalents include cash on deposit in bank accounts of joint operations which Aecon cannot access directly.
(2) Restricted cash is cash held by Skyport. At December 31, 2023, Aecon’s 50.1% interest in Skyport is reported using the equity method of accounting (Refer to Note 12, “Projects Accounted For Using The Equity Method” in the Company’s audited consolidated financial statements for the year ended December 31, 2023 and Section 5 “Recent Developments” of this MD&A).
(3) Bank indebtedness represents borrowings on Aecon’s revolving cr edit facilities.
(2) Restricted cash is cash held by Skyport. At December 31, 2023, Aecon’s 50.1% interest in Skyport is reported using the equity method of accounting (Refer to Note 12, “Projects Accounted For Using The Equity Method” in the Company’s audited consolidated financial statements for the year ended December 31, 2023 and Section 5 “Recent Developments” of this MD&A).
(2) Restricted cash is cash held by Skyport. At December 31, 2023, Aecon’s 50.1% interest in Skyport is reported using the equity method of accounting (Refer to Note 12, “Projects Accounted For Using The Equity Method” in the Company’s audited consolidated financial statements for the year ended December 31, 2023 and Section 5 “Recent Developments” of this MD&A).
(3) Bank indebtedness represents borrowings on Aecon’s revolving credit facilities.
(3) Bank indebtedness represents borrowings on Aecon’s revolving cr edit facilities.
Long-term debt balances at December 31, 2023 and 2022 are as follows:
Long-term debt balances at December 31, 2023 and 2022 are as follows:
Long-term debt balances at December 31, 2023 and 2022 are as follows:
Total long-term recourse debt of $149.4 million at December 31, 2023 compares to $409.1 million at December 31, 2022. The $259.7 million net decrease in total long-term recourse debt resulted primarily from the cash repayment of convertible debentures with a principal value of $184.0 million along with accrued and unpaid interest and a decrease in equipment leases of $50.2 million and equipment financing of $30.6 million primarily as a result of the sale of ATE in the second quarter of 2023.
Total long-term recourse debt of $149.4 million at December 31, 2023 compares to $409.1 million at December 31, 2022. The $259.7 million net decrease in total long-term recourse debt resulted primarily from the cash repayment of convertible debentures with a principal value of $184.0 million along with accrued and unpaid interest and a decrease in equipment leases of $50.2 million and equipment financing of $30.6 million primarily as a result of the sale of ATE in the second quarter of 2023.
Total long-term recourse debt of $149.4 million at December 31, 2023 compares to $409.1 million at December 31, 2022. The $259.7 million net decrease in total long-term recourse debt resulted primarily from the cash repayment of convertible debentures with a principal value of $184.0 million along with accrued and unpaid interest and a decrease in equipment leases of $50.2 million and equipment financing of $30.6 million primarily as a result of the sale of ATE in the second quarter of 2023.
The $379.0 million decrease in long-term non-recourse project debt all relates to the financing of the Bermuda
The $379.0 million decrease in long-term non-recourse project debt all relates to the financing of the Bermuda
excluding Joint Operations Joint Operations Consolidated Total Cash and cash equivalents (1) $ 259 $ 387 $ 646 Bank indebtedness (3) (112) - (112)
Balances excluding Joint Operations Joint Operations Consolidated Total Cash and cash equivalents (1) $ 20 $ 357 $ 377 Restricted cash (2) 107 - 107 Bank indebtedness (3) (121) - (121)
$ millions December 31, 2023 December 31, 2022 Current portion of long-term debt – recourse $ 42.6 $ 56.6 Current portion of convertible debentures - 178.9 Long-term debt – recourse 106.8 173.6 Total long-term recourse debt $ 149.4 $ 409.1 Current portion of project debt – non-recourse $ - $ 3.3 Long-term project debt – non-recourse - 375.7 Total project debt – non-recourse $ - $ 379.0 Preferred Shares of Aecon Utilities $ 157.1 $ -
Aecon Group Inc. 32
The $379.0 million decrease in long-term non-recourse project debt all relates to the financing of the Bermuda International Airport project. Subsequent to the sale of a 49.9% interest in the Bermuda International Airport concessionaire in the third quarter of 2023, Aecon’s remaining 50.1% interest in the long-term non-recourse project debt of this project has been included in “Projects Accounted For Using The Equity Method” in the Company’s audited consolidated financial statements and the accompanying notes for the year ended December 31, 2023 (See Section 5 “Recent Developments” of this MD&A and Note 12 “Projects Accounted for Using the Equity Method” to the Company’s audit consolidated financial statements for the year ended December 31, 2023).
The $157.1 million increase in the Preferred Shares of Aecon Utilities resulted primarily from gross proceeds of $154.6 million from a convertible preferred shares investment by Oaktree in Aecon Utilities. The balance of the increase in the Preferred Shares was due to accrued dividends of $3.6 million and net fair value gains totalling $1.1 million in 2023.
On October 24, 2023, following the closing of the Oaktree investment in Aecon Utilities, Aecon replaced its $600 million committed credit facility with a $450 million committed credit facility for Aecon and a new separate $400 million committed credit facility for Aecon Utilities. Both credit facilities mature on October 24, 2027. At December 31, 2023, $112 million was drawn on the facilities and $6 million utilized for letters of credit. At December 31, 2023, cash drawings under the revolving credit facilities bear interest at rates between prime and prime plus 1.85% per annum. The revolving credit facilities, when combined with an additional $900 million performance security guarantee facility to support letters of credit provided by Export Development Canada (“EDC”), brings Aecon’s committed credit facilities for working capital and letter of credit requirements to a total of $1,750 million. On June 30, 2023, the EDC facility was extended to June 30, 2025. On December 29, 2023, convertible debentures with a face value of $184 million were repaid in cash. The Company has no other debt or working capital credit facility maturities until 2027, except equipment and property loans and leases in the normal course. At December 31, 2023, Aecon was in compliance with all debt covenants related to its credit facilities.
Aecon’s financial position, liquidity, and capital resources are subject to the risks and uncertainties described in Section 10.2 “Contingencies” of this MD&A regarding certain pending legal proceedings to which Aecon is a party. Aecon and its joint venture partners also continue to advance negotiations and work towards resolution of claims for additional costs related to the four fixed price legacy projects, and in conjunction strengthen the Company’s balance sheet through reducing working capital related to these projects. While the Company believes each relevant joint venture has a strong claim to recover at least a substantial portion of these costs, the ultimate outcome of these matters cannot be predicted at this time (see Section 13 “Risk Factors”: “Certain Fixed Price Legacy Projects” of the Company’s 2022 Annual MD&A). Aecon’s operations also remain subject to uncertainties related to the unpredictability of future potential impacts related to global economic conditions, notably from supply chain disruptions, inflation related to labour and materials, and availability of labour (see Section 5 “Recent Developments” of this MD&A). As such, while the Company remains subject to risks which individually or in the aggregate, could result in material impacts to Aecon’s earnings, cash flow, liquidity and financial position, the Company believes that its current liquidity position, including its cash position, unused credit capacity, and cash generated from its operations, is sufficient to fund its operations.
In the fourth quarter of 2023, Aecon’s Board of Directors approved a quarterly dividend of $0.185 per share (annual dividend of $0.74 per share), unchanged from the prior year, to be paid to all holders of Aecon common shares. The fourth quarterly dividend payment of $0.185 per share was paid on January 3, 2024.
2023 Annual Report 33
10.4. SUMMARY OF CASH FLOWS
The construction industry in Canada is seasonal in nature for companies like Aecon that perform a significant portion of their work outdoors, particularly civil and utilities work. As a result, a larger portion of this work is performed in the summer and fall months than in the winter and early spring months. Accordingly, Aecon has historically experienced a seasonal pattern in its operating cash flow, with cash balances typically being at their lowest levels in the middle of the year as investments in working capital increase. These seasonal impacts typically result in cash balances peaking near year-end or during the first quarter of the year.
Aecon Group Inc. 34
A summary of sources and uses of cash during the three months ended and year ended December 31, 2023 and 2022 is as follows:
A summary of sources and uses of cash during the three months ended and year ended December 31, 2023 and 2022 is as follows: $
Cash provided by (used in):
Cash provided by (used in):
(increase) in restricted cash balances held by Skyport to finance the Bermuda International Airport project
net of proceeds on property, plant, and equipment
on the sale of subsidiaries (net of cash in subsidiaries disposed)
from projects accounted for using
Financing Activities
Cash provided by (used in): Increase
with
In 2023, Aecon acquired, either through purchase or lease, property, plant, and equipment totaling $46.4 million. Of this amount, $11.8 million was largely related to office and warehouse leases in Ontario and Alberta, with the balance of the investment in property, plant, and equipment primarily related to the purchase or lease of new machinery and construction equipment as part of normal ongoing business operations in the Construction segment. In 2022, Aecon acquired, either through purchase or lease, property, plant, and equipment totaling $79.9 million (excluding property, plant, and equipment acquired from business combinations). Of this amount, $8.6 million related mainly to long-term office property leases in Alberta and
In 2023, Aecon acquired, either through purchase or lease, property, plant, and equipment totaling $46.4 million. Of this amount, $11.8 million was largely related to office and warehouse leases in Ontario and Alberta, with the balance of the investment in property, plant, and equipment primarily related to the purchase or lease of new machinery and construction equipment as part of normal ongoing business operations in the Construction segment. In 2022, Aecon acquired, either through purchase or lease, property, plant, and equipment totaling $79.9 million (excluding property, plant, and equipment acquired from business combinations). Of this amount, $8.6 million related mainly to long-term office property leases in Alberta and Ontario and $4.8 million related
Three months ended Year ended December 31 December 31 2023 2022 2023 2022
millions
Operating Activities
Cash flows from operations before changes in working capital $ 43.5 $29.3 $26.1 $90.2 Lower (higher) investments in working capital 133.1 8.6 25.0 (203.8) Cash provided by (used in) operating activities $ 176.6 $37.9 $51.1 $(113.6)
Investing Activities
Decrease
$ - $(13.2) $2.0
(Expenditures)
intangible assets (4.5) (10.7) 47.1 (28.8) Cash outflow related to
(0.7) - (0.7) (5.8) Proceeds
- - 317.6Cash distributions received
the equity method 13.4 1.2 13.9 3.2 Cash used for investments in long-term financial assets (4.9) (0.8) (19.1) (0.8) Cash provided by (used in) investing activities $ 3.3 $(23.5) $360.8 $(35.1)
$(2.9)
and
acquisitions
(decrease)
$ 81.7 $(89.0) $(9.3) $97.7 Increase in long-term recourse debt borrowings 6.1 4.3 12.8 15.4 Repayments of long-term recourse debt relating primarily to property and equipment financing arrangements (11.9) (27.6) (67.0) (77.5) Repayment of non-recourse project debt of the Bermuda International Airport project - - (3.4) (3.0) Issuance of Preferred Shares by Aecon Utilities 154.6 - 154.6Cash used for dividends paid (11.4) (11.3) (45.6) (44.5) Repayment of convertible debentures (184.0) - (184.0)Cash provided by (used in) financing activities $ 35.1 $(123.6) $(141.9) $(11.9) Increase (decrease) in cash and cash equivalents $ 215.0 $(109.3) $270.0 $(160.7) Effects of foreign exchange on cash balances (1.6) (1.2) (1.4) 5.2 Cash and cash equivalents – beginning of period 432.4 487.7 377.2 532.7 Cash and cash equivalents – end of period $ 645.8 $377.2 $645.8 $377.2
in bank indebtedness associated
borrowings under the Company's revolving credit facilities
2023 Annual Report 35
mainly to the purchase of aggregate property in Saskatchewan, with the balance of the investment in property, plant, and equipment primarily related to the purchase or lease of new machinery and construction equipment as part of normal ongoing business operations in the Construction segment. Offsetting the above capital expenditures were proceeds from the sale of property, plant, and equipment totalling $71.0 million in 2023 compared to $12.5 million in 2022.
10.5. CAPITAL MANAGEMENT
For capital management purposes, the Company defines capital as the aggregate of its shareholders’ equity and debt. Debt includes the current and non-current portions of long-term debt (excluding non-recourse debt), convertible debentures, and Preferred Shares of Aecon Utilities.
The Company’s principal objectives in managing capital are:
• to ensure sufficient liquidity to adequately fund the ongoing operations of the business;
• to provide flexibility to take advantage of contract and growth opportunities that are expected to provide returns to shareholders;
• to maintain a strong capital base;
• to provide a rate of return in excess of its cost of capital to its shareholders; and
• to comply with financial covenants required under its various borrowing facilities.
The Company manages its capital structure and adjusts it in light of changes in economic conditions. In order to maintain or adjust its capital structure, the Company may issue new debt or repay existing debt, issue new shares, issue convertible debt, or adjust the quantum of dividends paid to shareholders. Financing decisions are generally made on a specific transaction basis and depend on such things as the Company’s needs, capital markets, and economic conditions at the time of the transaction.
Although the Company monitors capital on a number of bases, including liquidity and working capital, total debt (excluding non-recourse debt and drawings on the Company’s credit facilities presented as bank indebtedness) as a percentage of total capitalization (debt to capitalization percentage) is considered by the Company to be the most important metric in measuring the strength and flexibility of its consolidated balance sheets. At December 31, 2023, the debt to capitalization percentage including Preferred Shares and convertible debentures as debt was 22% (December 31, 2022 - 30%). If the Preferred Shares in 2023 and convertible debentures in 2022 were to be excluded from debt and added to equity on the basis that they could be converted or redeemed for equity of Aecon Utilities or Aecon as applicable, either at the Company’s option or at the holder’s option, then the adjusted debt to capitalization percentage would be 11% at December 31, 2023 (December 31, 2022 - 17%). While the Company believes these debt to capitalization percentages are acceptable, because of the cyclical nature of its business and the uncertainties described in Section 10.2 “Contingencies”, Section 5 “Recent Developments”, and Section 13 “Risk Factors” in this MD&A, the Company will continue its efforts to maintain a conservative capital position.
Debt to capitalization percentage is presented in Note 32 “Capital Disclosures” of the Company’s audited consolidated financial statements for the year ended December 31, 2023.
Aecon Group Inc. 36
Set out below is the calculation of the Company’s debt to capitalization percentage at December 31, 2023 and December 31, 2022 using the definitions provided in the preceding paragraphs:
Set out below is the calculation of the Company's debt to capitalization percentage at December 31, 2023 and December 31, 2022 using the definitions provided in the preceding paragraphs:
10.6. FINANCIAL INSTRUMENTS
10.6. FINANCIAL INSTRUMENTS
From time to time, the Company enters into forward contracts and other foreign exchange hedging products to manage its exposure to changes in exchange rates related to transactions denominated in currencies other than the Canadian dollar but does not hold or issue such financial instruments for speculative trading purposes. In addition, some of the Company’s investments in projects account ed for using the equity method enter into derivative financial instruments, namely interest rate swaps, to hedge the variability of interest rates related to non-recourse project debt.
From time to time, the Company enters into forward contracts and other foreign exchange hedging products to manage its exposure to changes in exchange rates related to transactions denominated in currencies other than the Canadian dollar but does not hold or issue such financial instruments for speculative trading purposes. In addition, some of the Company’s investments in projects accounted for using the equity method enter into derivative financial instruments, namely interest rate swaps, to hedge the variability of interest rates related to non-recourse project debt.
The Company discloses information on the classification and fair value of its financial instruments, as well as on the nature and extent of risks arising from financial instruments, and related risk management in Note 31 “Financial Instruments” to the Company’s audited consolidated financial statements and the notes thereto for the year ended December 31, 2023.
The Company discloses information on the classification and fair value of its financial instruments, as well as on the nature and extent of risks arising from financial instruments, and related risk management in Note 31 “Financial Instruments” to the Company’s audited consolidated financial statements and the notes thereto for the year ended December 31, 2023.
$ millions December 31, 2023 December 31, 2022 Current portion of long-term debt $ 42.6 $ 56.6 Long-term debt 106.8 173.6 Current portion of convertible debentures - 178.9 Preferred shares of Aecon Utilities 157.1Debt $ 306.5 $ 409.1 Shareholders' equity $ 1,064.3 $ 954.0 Capitalization $ 1,370.8 $ 1,363.1 Debt to capitalization percentage 22% 30% December 31, 2023 December 31, 2022 Current portion of long-term debt $ 42.6 $ 56.6 Long-term debt 106.8 173.6 Debt $ 149.4 $ 230.2 Shareholders' equity $ 1,064.3 $ 954.0 Preferred shares of Aecon Utilities 157.1Convertible debentures - 178.9 Shareholders' equity, Preferred Shares of Aecon Utilities, and convertible debentures $ 1,221.4 $ 1,132.9 Capitalization $ 1,370.8 $ 1,363.1 Debt (excluding Preferred Shares and convertible debentures) to capitalization percentage 11% 17%
2023 Annual Report 37
11. NEW ACCOUNTING STANDARDS
Note 6 “New Accounting Standards” to the Company’s audited consolidated financial statements and the notes thereto for the year ended December 31, 2023 includes new IFRS Accounting Standards that became effective for the Company on January 1, 2023, and Note 7 “Future Accounting Changes” discusses IFRS Accounting Standards and interpretations that are issued, but not yet effective at December 31, 2023.
12. SUPPLEMENTAL DISCLOSURES
Disclosure Controls and Procedures
The Chief Executive Officer (“CEO”) and Chief Financial Officer (“CFO”), together with management, evaluated the design and operating effectiveness of the Company’s disclosure controls and procedures at the financial year ended December 31, 2023. Based on that evaluation, the CEO and the CFO concluded that the design and operation of these disclosure controls and procedures were effective at December 31, 2023 to provide reasonable assurance that material information relating to the Company, including its consolidated subsidiaries, would be made known to them by others within those entities and that information required to be disclosed by the Company in its annual and interim filings and other reports submitted under securities legislation was recorded, processed, summarized, and reported within the periods specified in securities legislation.
Internal Controls over Financial Reporting
The CEO and CFO, together with management, evaluated the design and operating effectiveness of the Company’s internal controls over financial reporting at the financial year ended December 31, 2023. Based on that evaluation, the CEO and the CFO concluded that the design and operation of internal controls over financial reporting were effective at December 31, 2023 to provide reasonable assurance regarding the reliability of financial reporting and the preparation of the Company’s audited consolidated financial statements and the notes thereto for the year ended December 31, 2023 for external purposes in accordance with IFRS Accounting Standards. In designing and implementing such controls, it should be recognized that any system of internal control over financial reporting, no matter how well designed and operated, has inherent limitations. Therefore, even those systems determined to be effective can provide only reasonable assurance with respect to consolidated financial statement preparation and presentation and may not prevent or detect all misstatements due to error or fraud.
See also the section on “Internal and Disclosure Controls” in Section 13 “Risk Factors” in this MD&A.
Changes in Internal Controls over Financial Reporting
There have been no changes in the Company’s internal controls over financial reporting during the year ended December 31, 2023 that have materially affected, or are reasonably likely to materially affect, the Company’s internal controls over financial reporting.
Aecon Group Inc. 38
Contractual Obligations
Contractual Obligations
Contractual Obligations
Aecon has obligations for equipment and premises as follows:
Aecon has obligations for equipment and premises as follows:
Aecon has obligations for equipment and premises as follows:
Contractual obligations related to the Preferred Shares of Aecon Utilities are as follows:
Contractual obligations related to the Preferred Shares of Aecon Utilities are as follows:
(1) The Preferred Shares have no fixed repayment terms (see Note 20 “Preferred Shares of Aecon Utilities” to the Company’s audited consolidated financial statements and the accompanying notes for the year ended December 31, 2023). The Preferred Shares are assumed to have a contractual maturity of 7 years from issuance in this summary.
(1) The Preferred Shares have no fixed repayment terms (see Note 20 “Preferred Shares of Aecon Utilities” to the Company’s audited consolidated financial statements and the accompanying notes for the year ended December 31, 2023). The Preferred Shares are assumed to have a contractual maturity of 7 years from issuance in this summary
(1) The Preferred Shares have no fixed repayment terms (see Note 20 “Preferred Shares of Aecon Utilities” to the Company’s audited consolidated financial statements and the accompanying notes for the year ended December 31, 2023). The Preferred Shares are assumed to have a contractual maturity of 7 years from issuance in this summary.
At December 31, 2023, Aecon had contractual obligations to complete construction contracts that were in progress. The revenue value of these contracts was $6,157 million.
At December 31, 2023, Aecon had contractual obligations to complete construction contracts that were in progress. The revenue value of these contracts was $6,157 million.
At December 31, 2023, Aecon had contractual obligations to complete construction contracts that were in progress. The revenue value of these contracts was $6,157 million.
Defined Benefit Pension Plans
Defined Benefit Pension Plans
Defined Benefit Pension Plans
Aecon’s defined benefit pension plans (the “Pension Plans”) had a combined deficit of $0.3 million at December 31, 2023 (2022 – a combined deficit of $0.9 million). Details relating to Aecon’s defined benefit plans are set out in Note 23 “Employee Benefit Plans” to the Company’s audited consolidated financial statements for the year ended December 31, 2023.
Aecon’s defined benefit pension plans (the “Pension Plans”) had a combined deficit of $0.3 million at December 31, 2023 (2022 – a combined deficit of $0.9 million). Details relating to Aecon’s defined benefit plans are set out in Note 23 “Employee Benefit Plans” to the Company’s audited consolidated financial statements for the year ended December 31, 2023.
Aecon’s defined benefit pension plans (the “Pension Plans”) had a combined deficit of $0.3 million at December 31, 2023 (2022 – a combined deficit of $0.9 million). Details relating to Aecon’s defined benefit plans are set out in Note 23 “Employee Benefit Plans” to the Company’s audited consolidated financial statements for the year ended December 31, 2023.
The latest actuarial valuation of the Pension Plans for statutory and contribution purposes was completed at December 31, 2021. Under current pension benefits regulations, the next actuarial valuation of the Pension Plans must be performed with a valuation date of no later than December 31, 2024. Accordingly, unless an earlier valuation date is adopted, no change in contributions will be required before 2024 and any changes thereafter will reflect December 31, 2024 market conditions.
The latest actuarial valuation of the Pension Plans for statutory and contribution purposes was completed at December 31, 2021. Under current pension benefits regulations, the next actuarial valuation of the Pension Plans must be performed with a valuation date of no later than December 31, 2024. Accordingly, unless an earlier valuation date is adopted, no change in contributions will be required before 2024 and any changes thereafter will reflect December 31, 2024 market conditions.
The latest actuarial valuation of the Pension Plans for statutory and contribution purposes was completed at December 31, 2021. Under current pension benefits regulations, the next actuarial valuation of the Pension Plans must be performed with a valuation date of no later than December 31, 2024. Accordingly, unless an earlier valuation date is adopted, no change in contributions will be required before 2024 and any changes thereafter will reflect December 31, 2024 market conditions.
The defined benefit obligations and benefit cost levels will change as a result of future changes in the actuarial methods and assumptions, the membership data, the plan provisions, and the legislative rules, or as a result of future remeasurement gains or losses, none of which have been anticipated at this time. Emerging experience, differing from the assumptions, will result in gains or losses that will be revealed in future accounting valuations. Consequently, the accounting for Pension Plans involves a number of assumptions including those that are disclosed in Note 23 “Employee Benefit Plans” to the Company’s audited consolidated financial statements for the year ended December 31, 2023. As a result of the uncertainty associated with these estimates, there is no assurance that the Pension Plans will be able to earn the assumed rate of return on plan assets, and
The defined benefit obligations and benefit cost levels will change as a result of future changes in the actuarial methods and assumptions, the membership data, the plan provisions, and the legislative rules, or as a result of future remeasurement gains or losses, none of which have been anticipated at this time. Emerging experience, differing from the assumptions, will result in gains or losses that will be revealed in future accounting valuations. Consequently, the accounting for Pension Plans involves a number of assumptions including those that are disclosed in Note 23 “Employee Benefit Plans” to the Company’s audited consolidated financial statements for the year ended December 31, 2023. As a result of the uncertainty associated with these estimates, there is no assurance that the Pension Plans will be able to earn the assumed rate of return on plan assets, and
The defined benefit obligations and benefit cost levels will change as a result of future changes in the actuarial methods and assumptions, the membership data, the plan provisions, and the legislative rules, or as a result of future remeasurement gains or losses, none of which have been anticipated at this time. Emerging experience, differing from the assumptions, will result in gains or losses that will be revealed in future accounting valuations. Consequently, the accounting for Pension Plans involves a number of assumptions including those that are disclosed in Note 23 “Employee Benefit Plans” to the Company’s audited consolidated financial statements for the year ended December 31, 2023. As a result of the uncertainty associated with these estimates, there is no assurance that the Pension Plans will be able
$ millions Finance lease Equipment and payments other loans 2024 $38.3 $ 10.1 2025 - 2028 83.7 14.9 Beyond 12.7 7.2 $ 134.7 $ 32.2
$ millions Preferred Shares (1) 2024 $2025 - 2028Beyond 381.2 $ 381.2
$ millions Finance lease Equipment and payments other loans 2024 $38.3 $ 10.1 2025 - 2028 83.7 14.9 Beyond 12.7 7.2 $ 134.7 $ 32.2 Contractual obligations related to the Preferred Shares of Aecon Utilities are as follows: $ millions Preferred Shares (1) 2024 $2025 - 2028Beyond 381.2 $ 381.2
2023 Annual Report 39
to earn the assumed rate of return on plan assets, and furthermore, market driven changes may result in changes to discount rates and other variables which would result in Aecon being required to make contributions to the Pension Plans in the future that may differ significantly from estimates. As a result, there is a significant amount of measurement uncertainty involved in the actuarial valuation process. This measurement uncertainty may lead to potential fluctuations in financial results attributable to the selection of actuarial assumptions and other accounting estimates involved in the determination of pension expense and obligations. A significant actuarial and accounting assumption impacting the reporting of Pension Plans is the discount rate assumption. At December 31, 2023, Aecon used a discount rate of 4.5% in its Pension Plan calculations for consolidated financial statement purposes. The impact of a 0.5% decrease in the discount rate assumption would have resulted in an increase in the pension benefit obligation of approximately $1.4 million at December 31, 2023 and an increase in the estimated 2024 pension expense of approximately $0.1 million.
For additional details, see Note 24 “Contingencies”, Note 31 “Financial Instruments” and Note 34 “Remaining Performance Obligations” to the Company’s audited consolidated financial statements and the notes thereto for the year ended December 31, 2023.
Related Party Transactions
Related party transactions are disclosed in Note 35 “Related Parties” to the Company’s audited consolidated financial statements for the year ended December 31, 2023. Other than transactions with certain equity accounted investees as part of the normal course of operations, there were no other significant related party transactions in 2023.
Critical Accounting Estimates and Judgments
The reader is referred to the detailed discussion on critical accounting estimates and judgements found in Note 4 “Critical Accounting Estimates” to the Company’s audited consolidated financial statements for the year ended December 31, 2023.
13. RISK FACTORS
Aecon faces a wide variety of risks across all of its areas of business. Identifying and understanding risks and their impact allows Aecon to critically assess the risk profile of the business and adopt appropriate risk management practices. Defining acceptable levels of risk, and establishing sound principles, policies, and practices for managing risks, is fundamental to achieving consistent and sustainable long-term performance. Investors should carefully consider the risks and uncertainties set out below before investing in Aecon’s securities. Additional risks and/or uncertainties not currently known or that Aecon currently believes are immaterial may also impair its future business, financial condition, and results of operations.
1. Business and Operational Risks
a. Certain Fixed Price Legacy Projects
Four large fixed-price legacy projects entered into in 2018 or earlier by joint ventures in which Aecon is a participant, including the CGL pipeline project, are being negatively impacted due to additional costs for which the joint ventures assert that the owners are contractually responsible, including for, among other
Aecon Group Inc. 40
things, unforeseeable site conditions, third party delays, COVID-19, supply chain disruptions, and inflation related to labour and materials. During 2022 these impacts became more pronounced and have resulted, or are now expected to result, in increased costs to the relevant joint ventures above those originally forecasted, in some cases materially. Each relevant joint venture has submitted claims for compensation for these additional costs. Other than the CGL pipeline project, none are currently in litigation or arbitration. The joint ventures reached interim settlements with the respective owners on each of the four legacy projects in 2023 in respect of certain claims made, and for some of the projects, other claims for additional costs remain to be resolved in the future. While Aecon and its partners continue to work toward resolution of these claims for additional costs with the respective owners of these projects, delayed and/or unfavourable outcomes, whether individually or in the aggregate, could result in material impacts to Aecon’s earnings, cash flow, liquidity, and financial position. The fact that there are four projects experiencing similar impacts concurrently (referred to as the four legacy projects) elevates this risk. While the Company believes each relevant joint venture has a strong claim to recover at least a substantial portion of these costs, the ultimate outcome of these matters cannot be predicted at this time. See Section 10.2. “Contingencies” of this MD&A and other Risk Factors herein including under the headings “Large Projects”, “Contractual Factors”, “Litigation and Claims”, “Increases in the Cost of Raw Materials”, “Ongoing Financing Availability”, “Adjustments in Backlog” and “Force Majeure Events”.
b. Contractual Factors
Aecon performs construction activities under a variety of contract types, including fixed price, unit price, cost reimbursable, progressive design build (“PDB”), target price, and various permutations of design, build, finance, operation, maintenance, and rehabilitation responsibilities. Some forms of construction contracts carry more risk than others. Aecon attempts to maintain a diverse mix of contract types to prevent overexposure to the risk profile of any particular contractual structure; however, conditions influencing both private sector and public authority clients may alter the mix of available projects and contractual structures that Aecon undertakes.
Historically, a substantial portion of Aecon’s revenue is derived from contracts pursuant to which a commitment is provided to the owner to complete the project at a fixed price. In fixed price projects, in addition to the risk factors of a unit price contract (as described below), any errors in quantity estimates, schedule delays or productivity losses, for which contracted relief is not available, must be absorbed within the fixed price, thereby adding a further risk component to the contract. Such contracts, given their inherent risks, may in the future and from time-to-time result in significant losses. The failure to properly assess a wide variety of risks, appropriately execute such contracts, or reach satisfactory resolution to contractual disputes may have a material adverse impact on financial results.
Aecon is also involved in fixed unit price construction contracts under which the Company is committed to provide services and materials at a fixed unit price (e.g. dollars per tonne of asphalt or aggregate). While this shifts the risk of estimating the quantity of units to the contract owner, any increase in Aecon’s cost over the unit price bid, whether due to estimating error, inefficiency in project execution, inclement weather, cost escalation, or other factors, will negatively affect Aecon’s profitability.
In certain instances, Aecon guarantees to a client that it will complete a project by a scheduled date or that a facility will achieve certain performance standards. If the project or facility subsequently fails to meet the schedule or performance standards, Aecon could incur additional costs or penalties commonly referred to as liquidated damages. Although Aecon attempts to negotiate waivers of consequential or liquidated damages, on some contracts the Company is required to undertake such damages for failure to meet certain
2023 Annual Report 41
contractual provisions. Such penalties may be significant and could impact Aecon’s financial position or results of future operations. Furthermore, schedule delays may also reduce profitability because Aecon staff may be prevented from pursuing and working on new projects. Project delays may also reduce customer satisfaction, which could impact future awards.
Aecon is also involved in design-build contracts under which Aecon takes responsibility for the design in addition to the responsibilities and risks of a unit price or fixed price construction contract. This form of contract adds the risk of Aecon’s liability for design errors as well as additional construction costs that might result from such design errors. However, over the last several years, PDB has emerged as a project delivery model in an effort by owners and contractors to mitigate cost and schedule risks during the construction phase. In the PDB model, the contractor is invited to complete, on a cost reimbursable basis, a substantial portion of the design of a project before entering into a fixed price contract for the construction portion of the project. As the PDB model features a collaborative approach between the owner and contractor, Aecon is actively engaged in and pursuing projects procured under this model to facilitate more efficient risk transfer to the party best placed to manage that risk.
Certain of Aecon’s contractual requirements may also involve financing elements, where Aecon is required to provide one or more letters of credit, performance bonds, financial guarantees or equity investments. For greater detail, see “Risk Factors – Access to Bonding, Pre-qualification Rating and Letters of Credit” herein.
Change orders, which modify the nature or scope of the work to be completed, are frequently issued by clients. Final pricing of these change orders is often negotiated after the changes have been started or completed and costs have been incurred. As such, disputes regarding the quantum of unpriced change orders could impact Aecon’s profitability on a particular project, its ability to recover costs or, in a worstcase scenario, result in significant project losses. Until pricing has been agreed, these change orders are referred to as “unpriced change orders”. Revenues from unpriced change orders are recognized to the extent of the costs incurred on executing the change order or, if lower, to the extent to which recovery is probable. Consequently, profit on such change orders is recognized only when pricing is agreed. If, ultimately, there are disputes with clients on the pricing of change orders or disputes regarding additional payments owing as a result of changes in contract specifications, delays, additional work or changed conditions, Aecon’s accounting policy is to record all costs for these changes, but unpriced change orders and claims are recognized in revenue at the amount the Company expects to receive with a high probability that a significant reversal of cumulative revenue recognized will not occur once the uncertainty associated with the variable consideration is resolved. The timing of the resolution of such events can have a material impact on income and liquidity and thus can cause fluctuations in the revenue and income of Aecon in any one reporting period.
Aecon has pursued various contractual entitlement mechanisms to recover increased costs and/or extend timeframes to complete work impacted by the COVID-19 pandemic. While the majority of these claims have been settled, certain claims are still ongoing and whether Aecon succeeds in recovering such increased costs and extending such timeframes may depend on factors that vary on a project-by-project basis, including contract type, contract language, client receptiveness, and the probability of and extent to which the COVID-19 pandemic impacted project execution.
c. Large Projects
A substantial portion of Aecon’s revenue is derived from large projects, some of which are conducted through joint ventures. These projects provide opportunities for significant revenue and profit contributions but, by
Aecon Group Inc. 42
their nature, carry significant risk and, as such, can result and have occasionally resulted in significant losses. Contracts for large projects typically involve a transfer of risks to a contractor beyond those contained in smaller project contracts. As such, a failure to properly execute or complete a large project or a protracted or unsuccessful dispute with a client about entitlement to extra compensation on a large project may subject Aecon to significant losses. The risks associated with such large projects are often proportionate to their size and complexity. For greater detail, see “Risk Factors – Contractual Factors” herein.
The contract price on large projects is based on cost estimates using a number of assumptions. Given the size of these projects, if assumptions prove incorrect, whether due to faulty estimates, unanticipated circumstances, or a failure to properly assess risk, or the contracts do not appropriately reflect such assumptions, profit may be materially lower than anticipated or, in a worst-case scenario, result in a significant loss.
The recording of the results of large project contracts can distort revenues and earnings on both a quarterly and an annual basis and can, in some cases, make it difficult to compare the financial results between reporting periods. For greater detail on the potential impact of contractual factors, including unpriced change orders, see “Risk Factors – Contractual Factors” herein.
Aecon has a number of commitments and contingencies as part of its regular operations. The Company has guarantees, bonds, and letters of credit as assurance that certain conditions and obligations will be fulfilled. If Aecon was called upon to honour these contingent obligations, its financial results could be adversely affected. For additional details, see Note 24 “Contingencies”, Note 31 “Financial Instruments” and Note 34 “Remaining Performance Obligations” to the Company’s audited consolidated financial statements and the notes thereto for the year ended December 31, 2023 filed on Aecon’s SEDAR+ profile at www.sedarplus. com.
d. Failure to Perform by a Third Party
Aecon works with a number of third parties to achieve its strategic objectives and each of these relationships poses a degree of risk of non-performance.
Credit risk of non-payment with private owners under construction contracts is to a certain degree minimized by statutory lien rights, which give contractors a high priority in the event of insolvency proceedings as well as progress payments based on percentage completion. However, there is no guarantee that these measures will in all circumstances mitigate the risk of non-payment from private owners and a significant default or bankruptcy by a private owner may significantly and adversely impact results. A greater incidence or magnitude of default (including cash flow problems) or bankruptcy amongst clients, subcontractors or suppliers related to economic conditions could also impact results. Credit risk is typically less of a concern with public (government) owners, who generally account for a significant portion of Aecon’s business, as funds have generally been appropriated prior to the award or commencement of the project. See “Risk Factors – Dependence on the Public Sector” herein for additional discussion of the risks associated with this type of contract.
Joint ventures are often formed to undertake a specific project, jointly controlled by the partners, and are dissolved upon completion of the project. Aecon selects its joint venture partners based on a variety of criteria, including available resources, relevant expertise, past working relationships, as well as an analysis of prospective partners’ financial capacity and construction capabilities. Joint venture agreements spread risk and responsibility for project delivery between the partners and generally state that companies will
2023 Annual Report 43
supply their proportionate share of operating funds and share profits and losses in accordance with specified percentages. Nevertheless, each participant in a joint venture is usually jointly and severally liable to the client for completion of the entire project in the event of a default by any of its partners. Therefore, in the event that a joint venture partner fails to perform its obligations due to financial or other difficulties or is disallowed from performing or is otherwise unable to perform its obligations as a result of the client’s determination, whether pursuant to the relevant contract or because of modifications to government or agency procurement policies or rules or for any other reason, Aecon may be required to make additional investments or provide additional services which may reduce or eliminate profit, or even subject Aecon to significant losses with respect to the joint venture. As a result of the complexity and size of many of the joint venture projects that Aecon undertakes or is likely to undertake going forward, the failure of a joint venture partner on a large project could have a significant impact on Aecon’s results and financial condition. To mitigate this risk, Aecon typically requires the joint venture partner to provide Aecon with a security instrument (such as a parent company guarantee or cross-indemnity) to guarantee the joint venture partner’s performance of their obligations under the joint venture agreement.
The profitable completion of some contracts depends to a large degree on the satisfactory performance of subcontractors, including design and engineering consultants, who complete different elements of the work. If these subcontractors do not perform to accepted standards, Aecon may be required to hire different subcontractors to complete the tasks, which may impact schedule, add costs to a contract, impact profitability on a specific job and, in certain circumstances, lead to significant losses. Disputes with subcontractors may also result in material litigation. See “Risk Factors – Litigation and Claims” herein. A major subcontractor default or failure to properly manage subcontractor performance could materially impact results.
The development of construction projects requires Aecon’s clients to obtain regulatory and other permits, licences, and approvals from various governmental licencing bodies. Aecon’s clients may not be able to obtain all necessary permits, licences, and approvals required for the development of their projects, in a timely manner or at all. These delays are generally outside Aecon’s control. The major costs associated with these delays are personnel and associated overhead that is designated for the project which cannot be reallocated effectively to other work. If the client’s project is unable to proceed, it may adversely impact the demand for Aecon’s services. Clients may also, from time to time, proceed to award a construction contract while a permit or licence remains pending. Where a client does not obtain a permit or licence as expected or a permit or licence is revoked, the client’s cash flow and project viability may be impacted, which may lead to additional costs or financial loss for Aecon.
e. Litigation and Claims
Disputes are common in the construction industry and, as such, in the normal course of business, Aecon is involved in various legal actions and proceedings (including arbitrations) that arise from time to time, some of which may involve substantial sums of money. There is no assurance that Aecon’s insurance arrangements will be sufficient to cover any particular claim or claims or that a judge or arbitrator will not rule against Aecon in a proceeding with respect to a substantial amount in dispute notwithstanding the Company’s confidence in the merits of its position. Furthermore, Aecon is subject to the risk of: (i) claims and legal actions for various commercial and contractual matters, primarily arising from construction disputes, in respect of which insurance is not available, including, for example, late completion of a project or a disputed termination of a contract, and (ii) litigation or investigations relating to alleged or suspected violations of anti-corruption laws (see “Risk Factors – International/Foreign Jurisdiction Factors” herein).
Aecon Group Inc. 44
There can be no guarantee that litigation or disputes will not arise or will be finally resolved in Aecon’s favour which, depending on the nature of the litigation, could impact Aecon’s results.
Climate change-related litigation continues to evolve in Canada and elsewhere. While most cases have not succeeded due to the difficulty of attributing climate change to one specific emitter and uncertainty about the extent to which climate change-related risks must be considered and disclosed pursuant to existing financial disclosure obligations, the pressure created by climate change-related litigation may affect the regulatory and operating environment of companies, including Aecon.
f. Industry Competition
Aecon operates businesses in highly competitive sectors and geographic markets in Canada, the United States and, on a select basis, internationally. Aecon competes with other major contractors, as well as many mid-size and smaller companies, across a range of industry sectors. In addition, the number of international companies operating in the Canadian marketplace makes the market more competitive. Each competitor has its own advantages and disadvantages relative to Aecon. New contract awards and contract margin are dependent on the level of competition and the general state of the markets in which the Company operates. Fluctuations in demand in the sectors in which the Company operates may impact the degree of competition for work. Competitive position is based on a multitude of factors including pricing, ability to obtain adequate bonding, backlog, financial strength, appetite for risk, reputation for safety, quality, timeliness and experience. Aecon has little control over and cannot otherwise affect what these competitive factors are. If the Company is unable to effectively respond to these competitive factors, results of operations and financial condition will be adversely impacted. In addition, a prolonged economic slump or slower than anticipated recovery may affect one or more of Aecon’s competitors or the markets in which it operates, resulting in increased competition in certain market sectors, price or margin reductions or decreased demand for services, which may adversely affect results.
g. Concessionaire
In addition to providing design, construction, procurement, operation, maintenance, and other services on a given project, Aecon will sometimes invest as a concessionaire in an infrastructure asset. In such instances, Aecon assumes a degree of risk (essentially equity risk) associated with the performance of the asset during the concession period. The Bermuda International Airport is a current example of such an asset. The financing arrangements on concession projects are typically based on a set of projections regarding the cash flow to be generated by the asset during the life of the concession. The ability of the asset to generate the cash flows required to provide a return to the concessionaire can be influenced by a number of factors, some of which are partially beyond the concessionaire’s control, such as, among others, political or legislative changes, traffic demand and thus operating revenues, collection success, and operating cost levels.
While project concession agreements often provide a degree of risk mitigation, and insurance products are available to limit some of the concession risks, the value of Aecon’s investment in these infrastructure assets can be impaired, and certain limited risk guarantees can be called, if the financial performance of the asset does not meet certain requirements.
h. Dependence on the Public Sector
A significant portion of Aecon’s revenue is derived from contracts with various levels of government or their agencies. Consequently, any reduction in demand for Aecon’s services by the public sector, whether
2023 Annual Report 45
from traditional funding constraints, the long-term impact of weak economic conditions (including future budgetary constraints, concerns regarding deficits or an eroding tax base), changing political priorities, change in government, cancellation or delays in projects caused by the election process would likely have an adverse effect on the Company if that business could not be replaced from within the private sector.
Large government-sponsored projects typically have lengthy and often unpredictable lead times associated with the government review and political assessment process. The time delays and pursuit costs incurred as a result of this lengthy process, as well as the often-unknown political considerations that can be part of any final decision, constitute a significant risk to those pursuing such projects.
Moreover, as part of its business dealings with governmental bodies, Aecon must comply, and must take measures to ensure that the companies it partners with comply, with public procurement laws and regulations aimed at ensuring that public sector bodies award contracts in a transparent, competitive, efficient, ethical, and non-discriminatory way. Although Aecon has adopted control measures and implemented policies and procedures to mitigate such risks, these control measures, policies, and procedures may not always be sufficient to protect the Company from the consequences of acts prohibited by public procurement laws and regulations committed by its directors, officers, employees, and agents. For a detailed description of the Company’s exposure to corruption and bribery risks, see “Risk Factors – International/Foreign Jurisdiction Factors” herein. If Aecon fails to comply with these laws and regulations it could be subject to administrative or civil liabilities and to mandatory or discretionary exclusion or suspension, on a permanent or temporary basis, from contracting with governmental bodies in addition to other penalties and sanctions that could be incurred by the Company.
i. Weather Conditions
Unfavourable weather conditions represent one of the most significant uncontrollable risks for Aecon to the extent that such risk is not mitigated through contractual terms, insurance or otherwise. Construction projects are susceptible to delays as a result of extended periods of poor weather, which can have an adverse effect on profitability arising from either late completion penalties imposed by the contract or from the incremental costs arising from loss of productivity, compressed schedules, or from overtime work utilized to offset the time lost due to adverse weather and additional costs to modify means and methods to perform work in different-than-expected weather. See “Risk Factors – Climate Change Factors” herein for the discussion of weather risks related to climate change.
j. Labour Factors
A significant portion of Aecon’s labour force is unionized and, accordingly, Aecon is subject to the detrimental effects of a strike or other labour action, in addition to competitive cost factors.
The Company’s future prospects depend to a significant extent on its ability to attract and retain sufficient skilled workers. The construction industry is from time to time faced with a shortage of skilled labourers in some areas and disciplines. The resulting competition for labour may limit the ability of the Company to take advantage of available opportunities, or alternatively, may impact the profitability of such endeavours. The Company believes that its union relationships, size, and industry reputation will help mitigate this risk, but there can be no assurance that the Company will be successful in identifying, recruiting or retaining a sufficient number of skilled workers.
Aecon Group Inc. 46
k. Insurance
Aecon maintains insurance in order to both satisfy the requirements of its various construction contracts as well as a corporate risk management strategy. Failure to secure adequate insurance coverage could lead to uninsured losses or limit Aecon’s ability to pursue some construction contracts, both of which could impact results. Insurance products from time-to-time experience market fluctuations that can impact pricing and availability. Therefore, senior management, through Aecon’s insurance broker, monitors developments in the insurance markets so that the Company’s insurance needs are met. If any of Aecon’s third-party insurers fail, refuse to renew or revoke coverage, refuse to cover claims, or otherwise cannot satisfy their requirements to Aecon, the Company’s overall risk exposure could be materially increased.
Insurance risk entails inherent unpredictability that can arise from assuming long-term policy liabilities or from uncertainty of future events. Although Aecon has in the past been able to meet its insurance needs, there can be no assurances that Aecon will be able to secure all necessary or appropriate insurance on a going forward basis. Insurance premiums or deductibles may also increase, resulting in higher costs to the Company.
l. Environmental and Safety Factors
During its history, Aecon has experienced a number of incidents, emissions or spills of a non-material nature in the course of its construction activities. Although none of these environmental incidents to date have resulted in a material liability to Aecon, there can be no guarantee that any future incidents will also not be material.
Aecon is subject to, and complies with, federal, provincial, and municipal environmental legislation in all of its operations. Aecon recognizes that it must conduct all of its business in such a manner as to both protect and preserve the environment in accordance with this legislation. At each place where work is performed, Aecon develops and implements a detailed quality control plan as the primary tool to demonstrate and maintain compliance with all environmental regulations and conditions of permits and approvals. Given its more than one-hundred-year history in the construction industry, the large number of companies incorporated into its present structure, and the fact that environmental regulations tend not to have a statute of limitations, there can be no guarantee that a historical claim may not arise on a go forward basis. Management is not aware of any pending environmental legislation that would be likely to have a material impact on any of its operations, capital expenditure requirements or competitive position, although there can be no guarantee that future legislation (including without limitation the introduction of climate change or environmentallyfocused legislation that may impact aspects of Aecon’s business) will not be proposed and, if implemented, might have an impact on the Company and its financial results. Please see “Risk Factors – Climate Change Factors” herein for a discussion of climate-related risks.
Aecon is also subject to, and complies with, health and safety legislation in all of its operations in the jurisdictions in which it operates. The Company recognizes that it must conduct all of its business in such a manner as to ensure the protection of its workforce and the general public. Aecon has developed a health and safety program; nevertheless, given the nature of the industry, accidents will inevitably occur from time to time. Management is not aware of any pending health and safety legislation or prior incidents which would be likely to have a material impact on any of its operations, capital expenditure requirements or competitive position. Nevertheless, there can be no guarantee with respect to the impact of future legislation or accidents. Increasingly across the construction industry, safety standards, records and culture are an integral component of winning new work. Should Aecon fail to maintain its safety standards, such
2023 Annual Report 47
failure may lead to termination of contracts and/or impact future job awards, and could therefore impact financial results.
m. Cyclical Nature of the Construction Industry
Fluctuating demand cycles are common in the construction industry and can have a significant impact on the degree of competition for available projects. As such, fluctuations in the demand for construction services or the ability of the private and/or public sector to fund projects in the current economic climate could adversely affect backlog and margin and thus Aecon’s results.
Given the cyclical nature of the construction industry, the financial results of Aecon, similar to others in the industry, may be impacted in any given period by a wide variety of factors beyond its control (as outlined herein) and, as a result, there may be from time to time, significant and unpredictable variations in Aecon’s quarterly and annual financial results.
n. International/Foreign Jurisdiction Factors
Aecon is from time to time engaged in projects in foreign jurisdictions. International projects can expose Aecon to risks beyond those typical for its activities in its home market, including without limitation, economic, geopolitical, geotechnical, military, repatriation of undistributed profits, currency and foreign exchange risks, adoption of new or expansion of existing tariffs and/or taxes or other restrictions, sanctions risk, partner or third-party intermediary misconduct risks, difficulties in staffing and managing foreign operations, and other risks beyond the Company’s control, including the duration and severity of the impact of global economic downturns.
The Canadian Corruption of Foreign Public Officials Act and similar anti-corruption laws in other jurisdictions generally prohibit companies and their intermediaries from making improper payments to public officials or others for the purpose of obtaining or retaining business. While Aecon’s policies mandate compliance with these anti-corruption laws, Aecon may in the future operate in parts of the world that have experienced corruption to some degree. Aecon trains its employees with respect to anti-corruption issues, and expects its partners, subcontractors, suppliers, vendors, agents, and others who work for Aecon or on its behalf to comply with anti-corruption laws. Aecon has procedures and controls in place to perform appropriate due diligence and monitor compliance. However, there is no assurance that Aecon’s internal controls and procedures will always protect the Company from possible improper payments made by its employees or agents. If Aecon is found to be liable for violating anti-corruption laws, the Company could suffer from criminal or civil penalties or other sanctions, including contract cancellations or debarment and loss of reputation, any of which could have a material adverse effect on its business.
Money laundering and related crimes pose a threat to the stability and integrity of the financial sector and the broader economy. Consequently, the international community is increasingly prioritizing its fight against these illegal activities. Aecon is committed to all anti-money laundering regulatory requirements and has implemented procedures, processes, and controls with respect to due diligence, record keeping, reporting, and training in jurisdictions in which it operates where exposure to such illegal activities is attenuated. However, there are no assurances that Aecon’s procedures, processes, and controls will be sufficient to prevent or detect the occurrence of money laundering and related crimes.
Aecon Group Inc. 48
Aecon continually evaluates its exposure to unusual risks inherent in international projects and, where deemed appropriate in the circumstances, mitigates these risks through specific contract provisions, insurance coverage and forward exchange agreements. However, there are no assurances that such measures would offset or materially reduce the effects of such risks. For additional details on Aecon’s use of forward contracts and other foreign exchange hedging products to manage its exposure to changes in exchange rates see Note 31 “Financial Instruments” to the Company’s audited consolidated financial statements and the accompanying notes for the year ended December 31, 2023.
Transactional foreign exchange risks are actively managed and hedged where possible and considered cost effective, when directly tied to quantifiable contractual cash flows accruing directly to Aecon within periods of one or two years. Operations in foreign jurisdictions, including major projects executed through joint ventures, generally have a longer term and result in foreign exchange translation exposures that Aecon has not hedged. Such translation exposure will have an impact on Aecon’s consolidated financial results. Practical and cost-effective hedging options to fully hedge this longer-term translational exposure are not generally available.
o. Nuclear Liability
Aecon’s Nuclear segment supports clients across various types of Nuclear work, which includes construction and fabrication services, such as reactor new builds and the refurbishment of current nuclear reactors, and decommissioning. Such services can subject Aecon to risks arising out of a nuclear, radiological or criticality incident, whether or not within the Aecon’s control.
Indemnification provisions contained in the domestic legislation of the jurisdictions in which Aecon’s Nuclear segment operates, such as the Nuclear Liability and Compensation Act (Canada) and the Price-Anderson Act (United States), or equivalent protections afforded under international conventions, seek to ensure compensation for the general public, while indemnifying nuclear industry participants against liability arising from nuclear incidents, subject to possible exclusions.
However, these legislative indemnification provisions may not apply to all liabilities incurred while performing services as a contractor for the nuclear industry. If an incident or certain damages resulting therefrom are not covered under applicable legislative indemnification provisions, Aecon could be held liable for damages which could have a material adverse impact on the Aecon’s financial condition and results of operations. In addition to legislative indemnification provisions, the Company seeks to protect itself from liability associated with nuclear incidents and damages resulting therefrom in its contracts, but there can be no assurance that such contractual limitations on liability will be effective in all cases or that Aecon or its clients’ insurance will cover all the liabilities assumed under those contracts. The costs of defending against claims arising out of a nuclear incident, and any damages that could be awarded as a result of such claims, could have a material adverse impact on Aecon’s financial condition and results of operations.
p. Force Majeure Events
The Company is exposed to various risks arising out of extraordinary or force majeure events beyond the Company’s control, such as epidemics or pandemics, acts of war, terrorism, strikes, protests or social or political unrest generally. Such events could disrupt the Company’s operations, result in shortages of materials and equipment, cause supply chain delays or delivery failures, or lead to the realization of or exacerbate the impact of other risk factors. To the extent that such risks are not mitigated contractually through
2023 Annual Report 49
provisions that provide the Company with relief from its schedule obligations and/or cost reimbursement, the Company’s financial condition, results of operations or cash flows may be adversely affected.
Reliance on global networks and supply chains, rates of international travel and the significant number of people living in high-density urban environments increase humanity’s susceptibility to infectious disease. Epidemics occurring in regions in which Aecon operates and pandemics that pose a global threat can negatively impact business operations by disrupting the supply chain and causing high absenteeism across the workforce. Similarly, disasters arising from extraordinary or force majeure events may result in disruptions resulting from the evacuation of personnel, cancellation of contracts, or the loss of workforce, contractors or assets. In addition, a disaster may disrupt public and private infrastructure, including communications and financial services, which could disrupt the Company’s normal business operations.
Aecon has implemented a business continuity plan to assist with preparing for, and managing the impact of, an extraordinary or force majeure event by identifying core services, developing a communications strategy and protecting the health and safety of its employees. While the business continuity plan may mitigate the impact of an extraordinary or force majeure event, minimize recovery time and reduce business losses, the plan cannot account for all possible unexpected events. An extraordinary or force majeure event therefore may have material adverse financial implications for the Company.
q. Internal and Disclosure Controls
Inadequate disclosure controls or ineffective internal controls over financial reporting could result in an increased risk of material misstatements in the financial reporting and public disclosure record of Aecon. Inadequate controls could also result in system downtime, give rise to litigation or regulatory investigation, fraud or the inability of Aecon to continue its business as presently constituted. Restrictions related to a hybrid working model for office-based employees have necessitated modified controls during the consolidation and finalization of financial statements.
Aecon has designed and implemented a system of internal controls and a variety of policies and procedures to provide reasonable assurance that material misstatements in the financial reporting and public disclosures are prevented and detected on a timely basis and other business risks are mitigated. In accordance with the guidelines adopted in Canada, Aecon assesses the effectiveness of its internal and disclosure controls using a top-down, risk-based approach in which both qualitative and quantitative measures are considered. An internal control system, no matter how well conceived and operated, can provide only reasonable – not absolute – assurance to management and the Board regarding achievement of intended results. Aecon’s current system of internal and disclosure controls places reliance on key personnel across the Company to perform a variety of control functions including key reviews, analysis, reconciliations, and monitoring. The failure of individuals to perform such functions or properly implement the controls as designed could adversely impact results.
r. Integration and Acquisition
The integration of any acquisition raises a variety of issues including, without limitation, identification and execution of synergies, elimination of cost duplication, systems integration (including accounting and information technology), execution of the pre-deal business strategy in an uncertain economic market, development of common corporate culture and values, integration and retention of key staff, retention of current clients as well as a variety of issues that may be specific to Aecon and the industry in which it operates. There can be no assurance that Aecon will maximize or realize the full potential of any of its acquisitions. A failure to successfully integrate acquisitions and execute a combined business plan could
Aecon Group Inc. 50
materially impact the future financial results of Aecon. Likewise, a failure to expand the existing client base and achieve sufficient utilization of the assets acquired could also materially impact the future financial results of Aecon.
s. Reputation in the Construction Industry
Reputation and goodwill play an important role in the long-term success of any company in the construction industry. Negative opinion may impact long-term results and can arise from a number of factors including perceived competence, losses on specific projects, questions concerning business ethics and integrity, corporate governance, environmental and climate change awareness, the accuracy and quality of financial reporting and public disclosure as well as the quality and timing of the delivery of key products and services. Aecon has implemented various procedures and policies to help mitigate this risk, including the adoption of Aecon’s Code of Ethics and Business Conduct (the “Code”) which all employees are expected to review and abide by, and an ethical due diligence process to vet prospective partners, international subcontractors and third-party intermediaries. Nevertheless, the adoption of corporate policies, training of employees and vetting of third parties cannot guarantee that a future breach or breaches of the Code or other corporate policies will not occur which may or may not impact the financial results of the Company.
t. Oaktree’s Investment in Aecon’s Utilities Business
In October 2023, Aecon completed a transaction pursuant to which Splice Holdings S.à r.l., an entity managed by the Power Opportunities strategy of Oaktree Capital Management, L.P., (“Oaktree”) acquired 154,640 preferred shares in the capital of Aecon Utilities Group Inc. (“AUGI”), a wholly-owned subsidiary of Aecon which owns Aecon’s utilities business, that if converted would represent a 27.5% ownership interest in AUGI. As discussed under “Three-Year History – Sale of an Interest in Aecon Utilities Group Inc.” in the Company’s Annual Information Form for the year ended December 31, 2023 available on SEDAR+ at www. sedarplus.com, both the terms of Oaktree’s preferred shares and the shareholders’ agreement entered into by Aecon, AUGI and Oaktree provide Oaktree with certain governance and other rights regarding AUGI and its subsidiaries such that Oaktree has the ability to exert influence over many matters affecting AUGI’s business, policies and affairs. Without limiting the foregoing, subject to certain conditions, Oaktree is entitled to two nominees on the board of AUGI, pre-emptive rights, registration rights, liquidity rights, and, in the ordinary course, approval rights over certain activities of AUGI and its subsidiaries, including incurring indebtedness above certain levels or amalgamating, merging with or acquiring another business with an enterprise value in excess of certain thresholds, and, in circumstances in which AUGI is in breach of its obligations under the shareholders’ agreement, Oaktree has additional approval rights, including with respect to the declaration and payment of dividends. In addition, Oaktree has certain liquidity rights that, if exercised, could have an adverse effect on Aecon’s cash flows and debt covenants and, in certain circumstances where Aecon is unable to satisfy the liquidity rights, could lead to a sale of some or all of the utilities business. Furthermore, the interests of Oaktree may differ from the interests of Aecon and its shareholders in material respects. In that regard, Oaktree may from time to time have other investments that are permitted, subject to certain conditions provided in the shareholders’ agreement, to compete with the business of AUGI.
2023 Annual Report 51
2. Liquidity, Capital Resources and Financial Position Risks
a. Ongoing Financing Availability
Aecon’s business strategy involves the selective growth of its operations through internal growth and acquisitions. Aecon requires substantial working capital during its peak busy period. Aecon relies on its cash position and the availability of credit and capital markets to meet these working capital demands. As Aecon’s business grows, Aecon is continually seeking to enhance its access to funding in order to finance the working capital associated with this growth. However, given the expected demand for infrastructure services over the next several years based on announced government infrastructure programs and related investment commitments and the size of many of these projects, Aecon may be constrained in its ability to capitalize on growth opportunities to the extent that financing is either insufficient or unavailable. Further, instability or disruption of capital markets, or a weakening of Aecon’s cash position could restrict its access to or increase the cost of obtaining financing. Aecon cannot guarantee that it will maintain an adequate cash flow to fund its operations and meet its liquidity needs. Additionally, if the terms of Aecon’s credit facilities are not met and compliance with its covenants are not achieved, lenders may terminate Aecon’s right to use its credit facilities or demand repayment of whole or part of all outstanding indebtedness, which could have a material adverse effect on Aecon’s financial position. One or more third parties drawing on letters of credit or guarantees could have a material adverse effect on Aecon’s cash position and operations.
Some of Aecon’s clients also depend on the availability of credit to finance their projects. If clients cannot arrange financing, projects may be delayed or cancelled, which could have a material adverse effect on Aecon’s growth and financial position. A reduction in a client’s access to credit may also affect Aecon’s ability to collect payments, negotiate change orders, and settle claims with clients which could have a material adverse effect on Aecon’s financial position.
b. Access to Bonding, Pre-qualification Rating, and Letters of Credit
Many of Aecon’s construction contracts require sufficient bonding, pre-qualification rating or letters of credit. The issuance of bonds under surety facilities is at the sole discretion of the surety company on a projectby-project basis. As such, even sizeable surety facilities are no guarantee of surety support on any specific individual project. Although the Company believes it will be able to continue to maintain surety capacity adequate to satisfy its requirements, should those requirements be materially greater than anticipated, or should sufficient surety capacity not be available to Aecon or its joint venture partners (see “Risk Factors - Large Projects” herein) for reasons related to an economic downturn, Aecon’s financial performance or otherwise, or should the cost of bonding rise substantially (whether Aecon specific or industry wide), these events may have an adverse effect on the ability of Aecon to operate its business or take advantage of all market opportunities. The Company also believes that it has sufficient capacity with respect to letters of credit to satisfy its requirements, but should these requirements be materially greater than anticipated or should industry capacity be materially impacted by domestic or international conditions unrelated to Aecon, this may have an adverse effect on the ability of Aecon to operate its business.
c. Adjustments in Backlog
There can be no assurance that the revenues projected in Aecon’s backlog at any given time will be realized or, if realized, that they will perform as expected with respect to margin. Projects may from time to time remain
Aecon Group Inc. 52
in backlog for an extended period of time prior to contract commencement, and after commencement may occur unevenly over current and future earnings periods. Project suspensions, terminations or reductions in scope do occur from time to time in the construction industry due to considerations beyond the control of a contractor such as Aecon and may have a material impact on the amount of reported backlog with a corresponding impact on future revenues and profitability. A variety of factors outlined in these “Risk Factors” including, without limitation, the failure to replace the revenue generated from large projects on a going forward basis, conditions in resource related sectors and the impact of economic weakness could lead to project delays, reductions in scope and/or cancellations which could, depending on severity, negatively affect the ability of the Company to replace its existing backlog, which may adversely impact results.
d. Tax Accrual Risks
Aecon is subject to income taxes in Canada and several foreign jurisdictions. Significant judgment is required in determining the Company’s worldwide provision for income taxes. In the ordinary course of business, there are many transactions and calculations where the ultimate tax determination is uncertain. Although Aecon believes its tax estimates are reasonable, there can be no assurance that the final determination of any tax audits and litigation will not be materially different from that reflected in historical income tax provisions and accruals. Although management believes it adequately provides for any additional taxes that may be assessed as a result of an audit or litigation, the occurrence of either of these events could have a material adverse effect on the Company’s current and future results and financial condition.
A significant change in tax laws could also have an adverse effect on Aecon’s profitability. More than 100 foreign jurisdictions have agreed to implement a new global minimum tax regime (“Pillar Two”) based on model rules published by the Organization for Economic Cooperation and Development. The proposed Pillar Two rules are intended to ensure that large multinational enterprises pay a minimum tax of 15% on the income arising in each jurisdiction in which they operate. The impact on Aecon will depend on how each jurisdiction in which Aecon operates implements the model rules, as well as the profitability and local tax liabilities of Aecon’s operations in those jurisdictions. As such, at this time it is unclear if the proposed Pillar Two rules will have a material adverse effect on Aecon’s profitability.
e. Impairment in the Value of Aecon’s Assets
New events or circumstances may lead Aecon to reassess the value of goodwill, property, plant, and equipment, and other non-financial assets, and record a significant impairment loss, which could have a material adverse effect on its financial position. Aecon’s financial assets, other than those accounted for at fair value, are assessed for indicators of impairment quarterly. Financial assets are considered impaired when there is objective evidence that estimated future cash flows of the investment have been affected by one or more events that occurred after the initial recognition of the financial asset. In such a case, Aecon may be required to reduce carrying values to their estimated fair value. Aecon’s estimates of future cash flows are inherently subjective, which could have a significant impact on the analysis. Further, there could be a material adverse effect on Aecon’s financial position and compliance under its credit facilities from any future write-offs or write-downs of Aecon’s projects, assets or in the carrying value of its investments.
2023 Annual Report 53
f. Dependence on Subsidiaries to Help Repay Indebtedness
A significant portion of the Company’s assets is the capital stock of its subsidiaries, and the Company conducts an important portion of its business through its subsidiaries. Consequently, the Company’s cash flow and ability to service its debt obligations are dependent to a great extent upon the earnings of its subsidiaries and the distribution of those earnings to the Company, or upon loans, advances or other payments made by these entities to the Company.
The Company’s subsidiaries are separate and distinct legal entities and may have significant liabilities. The ability of these entities to pay dividends or make other loans, advances or payments to the Company will depend upon their operating results and will be subject to applicable laws and shareholder agreements. In addition, certain other agreements governing certain subsidiaries of the Company contain restrictions on the payment of dividends and distributions, as well as specified liquidity covenants. Also, a number of the Company’s material subsidiaries have provided guarantees of the Company’s primary third-party debt instruments and obligations, including the Company’s Credit Agreements.
The ability of the Company’s subsidiaries to generate sufficient cash flow from operations will depend on their future financial performance, which will be affected by a range of economic, competitive, and business factors, many of which are outside of the control of the Company or its subsidiaries. The cash flow and earnings of the Company’s operating subsidiaries and the amount that they are able to distribute to the Company as dividends or otherwise may be insufficient to satisfy the Company’s debt obligations. Accordingly, the Company may have to undertake alternative financing plans, such as refinancing or restructuring its debt, selling assets, reducing or delaying capital investments or seeking to raise additional capital. The Company cannot assure that any such alternatives would be possible, that any assets could be sold, or, if sold, of the timing of the sales and the amount of proceeds realized from those sales, and that additional financing could be obtained on acceptable terms, if at all. The Company’s inability to generate sufficient cash flow to satisfy its debt obligations, or to refinance its obligations on commercially reasonable terms, would have a material adverse effect on its business, financial condition, and results of operations.
g. Dividends
The declaration and payment of dividends on common shares are at the discretion of the board of directors of the Company. The cash available for dividends is a function of numerous factors, including the Company’s financial performance, dividends and cash flow from subsidiaries, the impact of interest rates, debt covenants, and obligations, working capital requirements and future capital requirements. Accordingly, there is no guarantee that Aecon will be able to pay any cash dividends on the common shares.
3. Risks Related to Information Systems, Technology, and Intellectual Property
a. Cyber Interruption or Failure of Information Systems
Aecon relies extensively on information systems, data, and communication networks to effectively manage its operations. Complete, accurate, available, and secure information is vital to the Company’s operations and any compromise in such information could result in improper decision making, inaccurate or delayed operational and/or financial reporting, delayed resolution to problems, breach of privacy and/or unintended disclosure of confidential materials.
Aecon Group Inc. 54
Aecon has established and continues to enhance security controls which protect its information systems and infrastructure, and which meet or exceed its obligations under applicable law or professional standards. The Company’s Information Services Security Group oversees the cybersecurity and risk mitigation strategy in coordination with Information Services and in consultation with the Board. Aecon is IT general controls (“ITGC”) certified and aligns with the International Organization for Standardization/International Electrotechnical Commission (ISO/IEC) 27001 Framework and continually monitors and reports metrics to the Risk Committee of the Board. Aecon annually conducts a comprehensive assessment with third-party auditors in order to re-certify its compliance with the ITGC principles. While audits occur annually, information security risk reviews and assessments are conducted more frequently in accordance with established processes to confirm that Aecon’s security controls are protecting the Company’s information systems and infrastructure on an ongoing basis. Aecon has also established safeguards so that appropriate physical access controls are in place to protect the Company’s facilities and information technology resources from unauthorized access. The Company has a cyber insurance policy which provides broad coverage of cyber incidents as well as third-party costs as a result of breaches and costs to restore, recreate or recollect electronic data and has retained a cyber incident response firm to assist Aecon in managing cyber incidents.
Aecon relies on information technology systems to manage its operations, including for reporting its results of operations, collection and storage of client data, personal data of employees and other stakeholders, and various other processes and transactions. Some of these systems are managed by third-party service providers that are engaged and given access to, or storage of, Aecon data following a security risk assessment. Aecon has similar exposure to security risks faced by other large companies that have data stored on their information technology systems.
While ransomware remains the most significant cyber threat to Aecon and other organizations online, since the onset of the COVID-19 pandemic in 2020, businesses have also faced increased cyber risks related to employees working remotely. Cyber criminals are adapting their tactics, making remote work a gateway to new forms of data theft, including employees’ personal information, corporate data, client and customer information, intellectual property, and key infrastructure. Aecon has also observed an increase in fraudulent e-mails, spam, and phishing attempts through its corporate e-mail. To reduce ransomware and other cyber risks, Aecon has: (i) provided additional mandatory training to all its employees in respect of phishing, spam and fraudulent e-mails, (ii) instituted an artificial intelligence based phishing detection solution to capture, analyze and quarantine all malicious e-mail at the source prior to reaching employee e-mail inboxes, (iii) increased monitoring of devices and employees to proactively identify and correct mistakes by employees with a view to preventing the loss of corporate data and intellectual property and to address risks of corporate fraud, (iv) implemented a web content filter that blocks malicious websites or corporate policies when Aecon devices access the internet remotely, and (v) required all employees to have two-factor authentication when logging into the Company’s systems. Moreover, network traffic analysis and heuristic malware scanning takes place across the Company’s corporate e-mail system and on all Aecon-owned hardware, including hardware that is used from remote locations, and a third-party security operations centre monitors Aecon’s network traffic in its cloud and data centre for any suspicious activity, isolating such activity until it is assessed and ultimately immobilizing our network if required until risks are assessed and mitigated where appropriate.
Given the rapid evolution and sophisticated level of cyber incidents, all the foregoing security measures and controls may not be sufficient to prevent third-party access of digital data from Aecon’s or its third-party service providers’ systems with the intent to misappropriate information, corrupt data or cause operational disruptions. Such incidents could cause delays in the Company’s operations and construction projects,
2023 Annual Report 55
result in lost revenues due to a disruption of activities, lead to the loss, destruction, inappropriate use or theft of confidential data, or result in theft of confidential information, including the Company’s or its clients’ or joint venture partners’ intellectual property. If any of the foregoing events occurs, the Company may be exposed to a number of consequences, including potential litigation or regulatory actions and reputational damage, which could have a material adverse effect on the Company.
b. Outsourced Software
Aecon relies on third-party providers of software and infrastructure to run critical accounting, project management and financial systems. Discontinuation of development or maintenance of third-party software and infrastructure could cause a disruption in Aecon’s systems.
c. Protection of Intellectual Property and Proprietary Rights
The Company depends, in part, on its ability to protect its intellectual property rights. Aecon relies primarily on patent, copyright, trademark, and trade secret laws to protect its proprietary technologies. The failure of any patents or other intellectual property rights to provide protection to Aecon’s technologies would make it easier for competitors to offer similar products or services, which could result in lower sales or gross margin.
The Company’s trademarks and trade names are registered in Canada and the United States and the Company intends to keep these filings current and seek protection for new trademarks to the extent consistent with business needs. The Company relies on trade secrets and proprietary know-how and confidentiality agreements to protect certain of its technologies and processes.
4. Economic and Strategic Risks
a. Economic Factors
Aecon’s profitability is closely tied to the general state of the economy in those geographic areas in which it operates. More specifically, the demand for construction and infrastructure development services, which is the principal component of Aecon’s operations, would typically be the largest single driver of the Company’s growth and profitability. In periods of strong economic growth and in some cases in periods of economic recovery, there is generally an increase in the number of opportunities available in the construction and infrastructure development industry as capital spending increases. In periods of weak economic growth, the demand for Aecon’s services from private sector and public authority clients may be adversely affected.
Inflation as measured by the Consumer Price Index (CPI) in Canada rose 3.9% on an annual average basis in 2023, following a 40-year high increase of 6.8% in 2022 and a 3.4% increase in 2021. Aside from 2022, the annual average increase in 2023 is the largest since 1991.The increase in inflation resulted in interest rate increases commencing in 2022 and continuing into 2023. Further increases may be implemented until inflation is back to a level deemed appropriate for a stable economy. Such a monetary tightening policy increases Aecon’s borrowing costs and has resulted in increased costs for labour, raw materials, and other inputs to the extent these cannot be passed on to clients. It may also impact the decisions of private and public sector clients when considering whether to proceed with projects that might otherwise have gone ahead.
Aecon Group Inc. 56
In North America, which tends to have relatively sophisticated infrastructure, Aecon’s profitability is dependent both on the development, rehabilitation, and expansion of basic infrastructure (such as, among others, highways, airport terminals, transit systems, and power plants) and on the type of infrastructure that flows from commercial and population growth. Commercial growth demands incremental facilities for the movement of goods within and outside of the community, along with water and sewer systems and heat, light, and power supplies. Population growth creates a need to move people to and from work, schools. and other public facilities, and demands similar services to new homes. Growth in both of these areas, with the possible exception of road maintenance and construction, is directly affected by the general state of the local economy.
The ongoing uncertainties regarding a prolonged economic downturn in the markets in which Aecon operates, related constraints on public sector funding, including as a result of government deficits and the ultimate ability of government action to contribute to an economic rebound may continue to impact Aecon’s clients and its business in 2024 and beyond and may have a significant adverse impact on Aecon’s operations.
b. Increases in the Cost of Raw Materials
The cost of raw materials represents a significant component of Aecon’s operating expenses. As contractors are not always able to pass such risks on to their customers, unexpected increases in the cost of raw materials may negatively impact the Company’s results. Inflation on the cost of raw materials, increased demand for raw materials used in construction, such as metals, cement, and wood products, resulting in periodic supply shortages as well as inflation as well as supply chain disruptions has contributed to an increase in raw material prices with upstream impacts through global supply chains. Tariffs on raw materials between nations may also impact the cost of raw materials from time to time. Unanticipated fluctuations in the costs of raw materials and periodic supply shortages may add a significant risk to many vendors and subcontractors, some of whom may respond by no longer guaranteeing price or availability on long-term contracts, which in turn increases the risk for contractors who are not always able to pass this risk on to their customers.
c. Resources and Commodities Sector
Delays, scope reductions and/or cancellations in previously announced or anticipated projects in the resources and commodities sector could be impacted by a variety of factors. General factors include but are not limited to: the prices of oil, natural gas, and other commodities; market volatility; the impact of global economic conditions affecting demand or the worldwide financial markets; cost overruns on announced projects; efforts by owners to contractually shift risk for cost overruns to contractors; fluctuations in the availability of skilled labour; lack of sufficient governmental investment or infrastructure to support growth; the introduction or repeal of climate change or environmentally-focused legislation (such as a carbon tax); negative perception of the oil sands and gas industry and related potential environmental impact; the need for consent from or consultation with Indigenous peoples impacted by proposed projects; and a shortage of sufficient pipeline and/or transportation infrastructure to transport production to major markets.
The prices of oil, natural gas and other commodities are determined based on world demand, supply, production, speculative activities, and other factors, all of which are beyond the control of the Company. Investment decisions by some of Aecon’s clients are dependent on the clients’ outlook on long-term commodity prices. If that outlook is unfavourable it may cause delay, reduction or cancellation of current and future projects, including pipeline projects. A material reduction in oil and gas development, commodity mining, transportation or distribution activities and capital expenditure plans of some of the Company’s clients due to, among other reasons, the perception that a pandemic, war or other similarly disruptive
2023 Annual Report 57
international crisis may have lasting impacts on the consumption of oil, gas, and other commodities, could have a negative effect on the frequency, number and size of the projects for which the Company would bid (For greater detail, see “Risk Factors – Force Majeure Events” herein.).
Given the volatility of world oil, natural gas, and commodity prices, a sustained period of low prices on a going forward basis for any reason may result in material differences in previously projected resource development projects. Postponements or cancellations of investment in existing and new projects could have an adverse impact on Aecon’s business and financial condition.
5. Risks Related to Climate Change
Global climate change continues to attract considerable public, scientific, and regulatory attention, while climate change policy continues to evolve at regional, national, and international levels. Aecon carefully considers the physical and non-physical impacts of climate change on the company. Transitioning to a sustainable, net-zero economy may entail extensive regulatory, legal, technology, and market changes to our business and reporting obligations. The failure to adequately anticipate and comply with emerging reporting requirements and meet industry, stakeholder and investor expectations may create financial and reputational risks and impact our brand. Risks associated with transitioning to a sustainable economy include the following:
a. Transitioning to a Net-Zero Economy
The transition to a net-zero economy has the potential to be disruptive to traditional business models and investment strategies. Aecon’s private and/or public-sector clients may shift their infrastructure priorities due to changes in project funding, regulatory requirements or public perception. This risk can be mitigated to an extent by identifying changing market demands to offset lower demand in some sectors with opportunities in others (i.e. the energy transition sector, emergency preparedness, and wastewater treatment), forming strategic partnerships and pursuing sustainable innovations.
Government action to address climate change may involve economic instruments such as carbon and energy consumption taxes, restrictions on certain economic sectors using tools such as cap-and-trade, increasing efficiency standards, and more stringent regulation and reporting of greenhouse gas emissions that could also impact Aecon’s current or potential clients operating in industries that extract, distribute, and transport fossil fuels.
b. Financial Impacts
As new climate change measures are introduced or strengthened, Aecon’s cost of business, including insurance premiums, may increase, and the Company may incur expenses related to complying with environmental regulations and policies in countries or regions where it does business. Such costs may include purchasing new equipment and materials to reduce emissions to comply with new regulatory standards or to mitigate the financial impact of different forms of carbon pricing. In addition, Aecon may incur costs related to engaging with governments, regulators, and industry organizations for new mandates on infrastructure projects, proactively and regularly monitoring regulatory trends, and implementing adequate compliance processes. Aecon’s inability to comply with climate change laws and regulations could also result in penalties and lawsuits and reputational damage that may impair Aecon’s future prospects.
Aecon Group Inc. 58
c. Sustainability (ESG) Reporting
Aecon supports key global frameworks that advance transparency and disclosure in sustainability. The Company’s annual Sustainability Report follows the guidelines of several global sustainability disclosure standards and frameworks including the Task Force on Climate-related Financial Disclosures (“TCFD”), Taskforce for Nature Related Financial Disclosures (“TNFD”), the Sustainability Accounting Standards Board (“SASB”), Materiality Assessment aligned to the Global Reporting Initiative (“GRI”) and the UN Sustainable Development Goals (“SDGs”). In the past year, a number of regulators and standard-setting organizations introduced new disclosure frameworks related to ESG risks. Some of these new standards may be adopted in Canada and apply to Aecon in the future. Potential divergence among the regulators in disclosure expectations, coupled with the pace at which the regulatory landscape is changing may pose operational risks to the Company. Aecon will continue to monitor developments and evolve its approach to future disclosure as required.
d. Carbon Transition Technologies
In April 2021, Aecon announced its plan to reach net-zero by 2050, with an initial interim target to achieve a 30% reduction in Scope 1 and Scope 2 CO2 emissions by 2030 as compared to 2020. Aecon’s greenhouse gas (“GHG”) emission reduction targets are intensity-based targets based on economic output and represent tonnes of CO2 per million dollars of revenue. While Aecon is fully committed to reaching these targets by driving operational efficiency and accelerating the adoption of new technology, factors such as an inability to procure lower emission vehicles in accordance with Aecon’s plans due to supply chain constraints or that such vehicles are not available on commercially reasonable terms, delays in the availability of suitable new technology such as low emission construction equipment, reversal of clean fuels standards, and government and client decisions to not allow lower carbon alternatives to conventional construction materials could cause Aecon to fail to meet its commitments in the time frames it has set out or at all.
e. Market and Reputation
Investors and other stakeholders in Canada and worldwide are becoming more attuned to climate change action and sustainability matters, including scrutiny of the efforts made by companies to reduce their carbon footprint. Moreover, stakeholders increasingly have higher expectations of how businesses respond to climate change issues, specifically those that are most material to their business. Companies are navigating evolving “greenwashing” concerns and the expectation that they are transparent about sustainability targets and performance and not overstating their sustainability credentials. Aecon may be subject to a broad range of additional environmental information requests by customers, potential customers, and other stakeholders in certain regions and increasing levels of disclosure regarding climate-related environmental performance. Aecon’s reputation may be harmed if it is not perceived by its stakeholders to be sincere in its sustainability commitment and its long-term results may be impacted as a result. In addition, Aecon’s approach to climate change issues may increasingly influence stakeholders’ views of the Company in relation to its peers and their investment decisions.
f. Climate Change
Many of Aecon’s construction activities are performed outdoors. The probability and unpredictability of extreme weather events and other associated incidents may continue to increase due to climate change
2023 Annual Report 59
and we may continue to see longer-term shifts in climate patterns. Increases in the severity and/or frequency of weather conditions due to climate change such as earthquakes, hurricanes, tornadoes, fires, floods, droughts, and similar events, may cause more regular and severe interruptions in Aecon’s business. Severe weather events may also impact the availability and cost of raw materials and may impact the raw materials supply chain and disrupt key manufacturing facilities. See “Risk Factors – Weather Conditions” herein for further details. Each of these factors may pose a financial risk to Aecon’s business or otherwise have a material adverse effect on its financial position.
6. Social Risks
a. Human Capital
The development, attraction, and retention of employees is a critical success factor for Aecon. The Company’s continued growth and future success depends on its ability to identify, recruit, assimilate, and retain key management, technical, project, and business development personnel. Aecon also continues to emphasize employee development and training to empower its employees to unleash their full potential and has implemented programs to help identify top performers and rising talent. The competition for top talent, particularly during periods of high demand in certain sectors, is intense and there can be no assurance that the Company will be successful in identifying, recruiting or retaining such personnel.
b. Incorporating Diversity and Inclusion
Aecon’s culture is underpinned by its core values, including an unwavering commitment to diversity and inclusion as described in more detail in the Company’s annual Sustainability Report. While Aecon has implemented several measures that focus on making progress in diversity, including initiatives and goals to recruit diverse talent across all leadership and skill areas, the success of these measures will continue to be affected by the Company’s industry and broader market trends. Failure to effectively implement these measures may result in a reputational, recruitment, and retention risk for Aecon.
c. Human Rights
Companies, including Aecon, are under increasing scrutiny to address human rights issues, including social, gender, and racial inequality. Aecon has made efforts to address systemic and institutional racism and other forms of discrimination, including undertaking a diversity census of its workforce, expanding its diversity and inclusion initiatives, introducing mandatory diversity and inclusion training for employees and formalizing a clear process to be followed by Aecon leaders who become aware of an incident of racism or discrimination of any kind. Aecon publicly reports under the Fighting Against Forced Labour and Child Labour in Supply Chains Act (Canada). Failure to effectively implement these initiatives may result in strategic, reputational and regulatory risks for Aecon.
Aecon Group Inc. 60
7. General Risks
7. General Risks
a. Shareholder Activism
a. Shareholder Activism
In recent years, publicly traded companies have been increasingly subject to demands from activist shareholders advocating for changes to corporate governance practices or engaging in certain corporate actions. Responding to challenges from activist shareholders, such as proxy contests, media campaigns or other activities, could be costly and time consuming and could have an adverse effect on the Company’s reputation and divert the attention and resources of the Company’s management and Board of Directors. Additionally, actions of activist shareholders may cause fluctuations in Aecon’s share price based on temporary or speculative market perceptions or other factors that do not necessarily reflect the underlying fundamentals and prospects of the Company.
In recent years, publicly traded companies have been increasingly subject to demands from activist shareholders advocating for changes to corporate governance practices or engaging in certain corporate actions. Responding to challenges from activist shareholders, such as proxy contests, media campaigns or other activities, could be costly and time consuming and could have an adverse effect on the Company’s reputation and divert the attention and resources of the Company’s management and Board of Directors. Additionally, actions of activist shareholders may cause fluctuations in Aecon’s share price based on temporary or speculative market perceptions or other factors that do not necessarily reflect the underlying fundamentals and prospects of the Company.
14. OUTSTANDING SHARE DATA
14. OUTSTANDING SHARE DATA
Aecon is authorized to issue an unlimited number of common shares. The following are details of common shares outstanding and securities that are convertible into common shares of Aecon Group Inc.
Aecon is authorized to issue an unlimited number of common shares. The following are details of common shares outstanding and securities that are convertible into common shares of Aecon Group Inc.
In thousands of dollars (except share amounts)
March 5, 2024
Number of common shares outstanding 62,266,403 Outstanding securities exchangeable or convertible into common shares DSUs and RSUs outstanding under the Long-Term Incentive Plan and the 2014 Director DSU Plan 3,793,609 2023 Annual Report 61
OUTLOOK
2023 was a transformational year for Aecon driven by three significant transactions which allowed the Company to capture unlocked value in these assets, partner with respected institutions with significant experience to help Aecon grow, better align to its strategy, and strengthen Aecon’s balance sheet and capital position.
Moving forward, Aecon’s goal is to build a resilient company through a balanced and diversified work portfolio across sectors, markets, geographies, project types, sizes and delivery models while enhancing critical execution capabilities and project selection to play to its strengths. Aecon will continue to leverage its selfperform capabilities and One Aecon approach with a goal to maximize value for clients through improved cost certainty and schedule, while offering a broad range of infrastructure services from development, engineering, investment, and construction to longer term operations and maintenance. Aecon will continue to pursue and deliver the majority of its work in established markets, while embracing new opportunities to grow in areas linked to decarbonization and energy transition, and in U.S. and international markets. These opportunities are intended over the long term to diversify Aecon’s geographic presence, provide further growth opportunities and deliver more consistent earnings through economic cycles. To complement its priority markets, Aecon is pursuing a balanced portfolio of work delivered through both fixed and non-fixed price contracting models with the goal of reducing fixed price work to balance risk with acceptable returns.
Demand for Aecon’s services across Canada continues to be strong. Revenue from recurring revenue programs increased to $1,134 million in 2023 from $896 million in 2022, representing growth in recurring revenue programs of 27% over 2022. In addition, development phase work is ongoing in consortiums in which Aecon is a participant to deliver the long-term GO Expansion On-Corridor Works project, the Scarborough Subway Extension Stations, Rail and Systems project, and the Darlington New Nuclear Project, all in Ontario. These projects are being delivered using progressive design-build or alliance models and each project is expected to move into the construction phase in 2025. The GO Expansion On-Corridor Works project also includes an operations and maintenance component over a 23-year term commencing January 1, 2025. None of the anticipated work from these three significant long-term progressive designbuild projects is yet reflected in backlog. With backlog of $6.2 billion at the end of 2023, recurring revenue programs continuing to see robust demand, and a strong bid pipeline, Aecon believes it is positioned to achieve further revenue growth over the next few years and is focused on achieving improved profitability and margin predictability.
In the Construction segment, Aecon was awarded a number of projects in 2023 that were added to backlog including delivery of the Deerfoot Trail Improvements project in Calgary, Alberta, the Elevated Guideway for the Eglinton Crosstown West Extension project in Toronto, Ontario, the replacement of Condensers and Feedwater Heaters for Dominion Energy in Mineral, Virginia, and an Aecon joint venture was awarded the Fuel Channel and Feeder Replacement contract for four units at the Bruce Nuclear Generating Station in Tiverton, Ontario. In addition, Oneida LP, a consortium in which Aecon Concessions is an 8.35% equity partner, executed an agreement with the Independent Electricity System Operator for the Oneida Energy Storage Project to deliver a 250 megawatt / 1,000 megawatt-hour energy storage facility near Nanticoke Ontario, with Aecon awarded a $141 million Engineering, Procurement and Construction contract by Oneida LP.
In the Concessions segment, there are a number of opportunities to add to the existing portfolio of Canadian and international concessions in the next 12 to 24 months, including projects with private sector clients that support a collective focus on sustainability and the transition to a net-zero economy as well as private sector
15.
Aecon Group Inc. 62
development expertise and investment to support aging infrastructure, mobility, connectivity and population growth. The GO Expansion On-Corridor Works project and the Oneida Energy Storage project noted above are examples of the role Aecon’s Concessions segment is playing in developing, operating, and maintaining assets related to this transition.
Global and Canadian economic conditions impacting inflation, interest rates, and overall supply chain efficiency have stabilized, and these factors have largely been and will continue to be reflected in the pricing and commercial terms of the Company’s recent and prospective project awards and bids. However, certain ongoing joint venture projects that were bid some years ago have experienced impacts related, in part, to those factors, that will require satisfactory resolution of claims with the respective clients. Results have been negatively impacted by these four legacy projects in recent periods, undermining positive revenue and profitability trends in the balance of Aecon’s business. Until these projects are complete and related claims have been resolved, there is a risk that this could also occur in future periods – see Section 5 “Recent Developments” and Section 10.2 “Contingencies”, and Section 13 “Risk Factors” in this MD&A regarding the risk on four large fixed price legacy projects entered into in 2018 or earlier by joint ventures in which Aecon is a participant.
At December 31, 2023, Aecon held cash and cash equivalents, excluding balances held by joint operations, of $259 million. In addition, at December 31, 2023, Aecon had committed revolving credit facilities of $850 million, of which $112 million was drawn, and $6 million was utilized for letters of credit. On December 29, 2023, Aecon repaid, in cash, convertible debentures with a face value of $184 million. The Company has no debt or working capital credit facility maturities until 2027, except equipment loans and leases in the normal course. Aecon plans to maintain a disciplined capital allocation approach focused on long-term shareholder value through acquisitions and divestitures, organic growth, dividends, and capital investments. Capital expenditures in 2024 are expected to be similar to previous years.
2024 revenue will be impacted by the three strategic transactions completed in 2023, the substantial completion of several large projects in 2023, and the three major projects currently in the development phase by consortiums in which Aecon is a participant being delivered using the progressive design-build models which are expected to move into the construction phase in 2025. The completion and satisfactory resolution of claims on the four legacy projects with the respective clients remains a critical focus for the Company and its partners, while the remainder of the business continues to perform as expected, supported by the strong level of backlog and new awards during 2023, and the strong demand environment for Aecon’s services, including recurring revenue programs.
2023 Annual Report 63
December 31, 2023
AECON GROUP INC. CONSOLIDATED FINANCIAL STATEMENTS
Aecon Group Inc. 64
DECEMBER 31, 2023 AND 2022
CONSOLIDATED FINANCIAL STATEMENTS
OF CONTENTS 2023 Annual Report 65 INDEPENDENT AUDITOR’S REPORT ................................................................................................ 66 CONSOLIDATED BALANCE SHEETS 74 CONSOLIDATED STATEMENTS OF INCOME 75 CONSOLIDATED STATEMENTS OF COMPREHENSIVE INCOME 76 CONSOLIDATED STATEMENTS OF CHANGES IN EQUITY 77 CONSOLIDATED STATEMENTS OF CASH FLOWS 78 NOTES TO THE CONSOLIDATED FINANCIAL STATEMENTS 79 1. CORPORATE INFORMATION ......................................................................................................... 79 2. DATE OF AUTHORIZATION FOR ISSUE 79 3. BASIS OF PRESENTATION 79 4. CRITICAL ACCOUNTING ESTIMATES 79 5. SUMMARY OF MATERIAL ACCOUNTING POLICIES .................................................................... 84 6. NEW ACCOUNTING STANDARDS 98 7. FUTURE ACCOUNTING CHANGES 99 8. CASH AND CASH EQUIVALENTS, AND RESTRICTED CASH 99 9. TRADE AND OTHER RECEIVABLES 100 10. UNBILLED REVENUE AND DEFERRED REVENUE 101 11. INVENTORIES 101 12. PROJECTS ACCOUNTED FOR USING THE EQUITY METHOD ............................................... 102 13. PROPERTY, PLANT AND EQUIPMENT 104 14. INTANGIBLE ASSETS 106 15. BANK INDEBTEDNESS 108 16. TRADE AND OTHER PAYABLES ................................................................................................ 108 17. PROVISIONS 109 18. LONG-TERM DEBT AND NON-RECOURSE PROJECT DEBT 110 19. CONVERTIBLE DEBENTURES 112 20. PREFERRED SHARES OF AECON UTILITIES .......................................................................... 113 21. CONCESSION RELATED DEFERRED REVENUE 114 22. INCOME TAXES 115 23. EMPLOYEE BENEFIT PLANS ..................................................................................................... 117 24. CONTINGENCIES 120 25. CAPITAL STOCK 121 26. EXPENSES 123 27. OTHER INCOME .......................................................................................................................... 124 28. FINANCE COST 125 29. EARNINGS PER SHARE 125 30. SUPPLEMENTARY CASH FLOW INFORMATION 126 31. FINANCIAL INSTRUMENTS ........................................................................................................ 127 32. CAPITAL DISCLOSURES ............................................................................................................132 33. OPERATING SEGMENTS 133 34. REMAINING PERFORMANCE OBLIGATIONS ........................................................................... 136 35. RELATED PARTIES 137
TABLE

Independent auditor’s report INDEPENDENT AUDITOR’S
To the Shareholders of Aecon Group Inc.
Our opinion
In our opinion, the accompanying consolidated financial statements present fairly, in all material respects, the financial position of Aecon Group Inc. and its subsidiaries (together, the Company) as at December 31, 2023 and 2022, and its financial performance and its cash flows for the years then ended in accordance with International Financial Reporting Standards as issued by the International Accounting Standards Board (IFRS Accounting Standards).
What we have audited
The Company’s consolidated financial statements comprise:
the consolidated balance sheets as at December 31, 2023 and 2022;
the consolidated statements of income for the years then ended;
the consolidated statements of comprehensive income for the years then ended;
the consolidated statements of changes in equity for the years then ended;
the consolidated statements of cash flows for the years then ended; and
the notes to the consolidated financial statements, comprising material accounting policy information and other explanatory information.
Basis for opinion
We conducted our audit in accordance with Canadian generally accepted auditing standards. Our responsibilities under those standards are further described in the Auditor’s responsibilities for the audit of the consolidated financial statements section of our report.
We believe that the audit evidence we have obtained is sufficient and appropriate to provide a basis for our opinion.
Independence
We are independent of the Company in accordance with the ethical requirements that are relevant to our audit of the consolidated financial statements in Canada. We have fulfilled our other ethical responsibilities in accordance with these requirements.
PricewaterhouseCoopers LLP PwC Tower, 18 York Street, Suite 2500, Toronto, Ontario, Canada M5J 0B2 T: +1 416 863 1133, F: +1 416 365 8215, ca_toronto_18_york_fax@pwc.com “PwC” refers to PricewaterhouseCoopers LLP, an Ontario limited liability partnership.
REPORT Aecon Group Inc. 66
Key audit matters
Key audit matters are those matters that, in our professional judgment, were of most significance in our audit of the consolidated financial statements for the year ended December 31, 2023. These matters were addressed in the context of our audit of the consolidated financial statements as a whole, and in forming our opinion thereon, and we do not provide a separate opinion on these matters. Key
Our approach to addressing the matter included the following procedures, among others:
Refer to note 4.1 – Major sources of estimation uncertainty – Revenue, gross profit recognition and note 5.1 – Revenue recognition to the consolidated financial statements.
The Company recognized revenue of $4.6 billion for the year ended December 31, 2023. A significant portion of this revenue is generated from long-term construction contracts. The Company typically transfers control of goods or services to the customer by satisfying performance obligations over time and recognizes revenue over time as these performance obligations are satisfied. Revenue is recognized based on the extent of progress towards completion of the performance obligation.
Revenue for fixed-price contracts is generally determined on the percentage of completion method, based on the ratio of costs incurred to date to the total estimated costs at completion of the performance obligation. Revenue is generally recorded proportionally as costs are incurred. Due to the nature of the work required to be performed on many of the performance obligations, management’s estimation of total contract revenue and costs at completion is complex and requires significant judgment. Some of the factors that can change the estimates of total contract revenue and costs at completion include differing site conditions, the availability of skilled contract labour, the performance of major material suppliers to deliver on time, the
Tested how management determined the estimates of total costs at completion for a sample of fixed-price long-term construction contracts:
Agreed key contractual terms back to signed contracts.
Evaluated the reasonableness of the significant assumptions used by management in estimating the total costs at completion and the timely identification by management of circumstances and factors that may warrant a modification to a previous cost estimate, which included the following:
o tested estimates of total costs at completion, such as estimated labour costs, materials and other costs to appropriate supporting documentation, and subcontractor costs to third party agreements;
o performed procedures to compare the estimated costs to complete to actual costs incurred to date; and
o observed progress of performance and inquired with senior management, project managers and internal legal counsel regarding the status of contracts, changes from previous years (if applicable), factors that can change the total contract revenue and costs at completion and any claims.
audit matter How our audit addressed the key audit matter Revenue recognition from long-term construction contracts
2023 Annual Report 67
Key audit matter
How our audit addressed the key audit matter performance of major subcontractors, unusual weather conditions and the accuracy of the original bid estimate.
The Company’s long-term construction contracts may include change orders and claims that impact the transaction price and the measure of progress for the performance obligation to which it relates. Unpriced change orders and claims are recognized in revenue at the amount the Company expects to be entitled to, where it is highly probable that a significant reversal of cumulative revenue recognized will not occur when the uncertainty associated with them is resolved. Management uses significant judgment to determine whether unpriced change orders and claims should be included in the transaction price. Internal and external legal counsels, as well as other claim specialists are often used by management in making those judgments (management’s experts).
We considered this a key audit matter due to the significant judgment applied by management, including the use of management’s experts, in determining the estimate of total contract revenue and costs at completion and the amount to be recognized for unpriced change orders and claims. This in turn led to a high degree of auditor judgment, subjectivity and effort in performing procedures to evaluate evidence relating to revenue recognition from long-term construction contracts.
Accounting for the preferred shares of Aecon Utilities
Refer to note 4 - Critical accounting estimates, note 20 – Preferred shares of Aecon Utilities, and note 31 – Financial instruments
Tested whether costs accrued at year-end and subsequent to year-end were recorded in the correct period by inspecting supporting documents for a sample of transactions.
Tested the costs incurred to date to supporting documents for a sample of transactions.
For a sample of unpriced change orders and claims recognized, evaluated the appropriateness of management’s assessment and tested the reasonableness of the amount the Company was entitled to, which included the following:
inspected signed contract amendments and correspondence with customers, where applicable;
considered the historical outcomes of previously settled customer claims; and used the work of management’s experts to evaluate the appropriateness of management’s assessment of the merits and probable outcome of unpriced change orders and claims against customers. As a basis for using this work, the competence, capabilities and objectivity of management’s experts were evaluated, the work performed was understood and the appropriateness of the work as audit evidence was evaluated. The procedures performed also included evaluation of the methods and assumptions used by management’s experts, tests of the data used by management’s experts and an evaluation of their findings.
Our approach to addressing the matter included the following procedures, among others:
Read the share issuing agreement relating to the preferred shares to develop an understanding of the terms and conditions
Aecon Group Inc. 68
Key audit matter
On October 23, 2023, Aecon Utilities, a wholly owned subsidiary of the Company, entered into a subscription agreement with funds managed by the Power Opportunities strategy of Oaktree Capital Management LP (Oaktree). Oaktree subscribed for 154,640 convertible preferred shares (the preferred shares) in Aecon Utilities at a subscription price of $1,000 each resulting in gross proceeds of $154,640, which represents $150,000 after upfront fees (Net Investment Amount). The Preferred Shares are convertible at any time by Oaktree into a fixed 27.5% of the common equity of Aecon Utilities and is mandatorily convertible upon a qualified initial public offering (IPO). Prior to conversion, the Preferred Shares will accrue a 12% annual coupon for the first three years and 14% annual coupon thereafter. At Aecon’s option, the coupon is payable in kind by accreting the principal amount or in cash. On conversion of the Preferred Shares, Aecon’s 72.5% equity interest in Aecon Utilities is not diluted as a result of the accretion feature.
Aecon has the option to purchase the Preferred Shares for cash at any time at a value equivalent to the greatest of: (a) the as-converted value of the Preferred Shares; (b) the accreted value of the Preferred Shares; and (c) 1.5 times the Net Investment Amount less all cash dividends and distributions paid to Oaktree. Following the seven-year anniversary of the investment, Oaktree may sell its Preferred Shares, subject to a right of first offer in favour of Aecon, or may require Aecon, at Aecon’s election, to either (i) initiate an IPO process and/or (ii) initiate a sale of Aecon Utilities or (iii) purchase the Preferred Shares for cash at a price equal to the greater of (A) the accreted value of the Preferred Shares and (B) the as-converted value of the Preferred Shares being the fair market value of the common shares into which the Preferred Shares is convertible at that time.
associated with the preferred shares including the different conversion features and options.
Assessed management’s classification of the preferred shares as a financial liability.
Professionals with specialized skill and knowledge were used to assist in evaluating the reasonableness of the fair value of the preferred shares at initial recognition.
Evaluated the sufficiency of the disclosures in the consolidated financial statements.
How our audit addressed the key audit matter
2023 Annual Report 69
Key audit matter
Upon the occurrence of a change of control event, or in the event of the dissolution, liquidation or winding-up of Aecon Utilities, the preferred shares will be redeemed for cash at the greatest of: (a) the as-converted value of the Preferred Shares; (b) the accreted value of the Preferred Shares; and (c) 1.5 times the Net Investment Amount less all cash dividends and distributions paid to Oaktree.
Preferred Shares issued by Aecon Utilities Group Inc. Aecon Utilities are recorded as a financial liability measured at fair value through profit and loss. The fair value of the Preferred Shares was determined at inception, represented by the aggregate subscription price. The key inputs used in determining the fair value include credit spread, market volatility, and the underlying share price.
We considered this a key audit matter due to the significant judgment and estimation made by management in determining the accounting treatment and the fair value at initial recognition of the preferred shares and the magnitude of the preferred shares to the consolidated financial statements. This in turn led to a high degree of auditor judgment in performing procedures and evaluating evidence relating to the accounting treatment and the determination of the fair valuation at initial recognition of the preferred shares. The audit effort involved the use of professionals with specialized skill and knowledge.
Other information
Management is responsible for the other information. The other information comprises the Management’s Discussion and Analysis of Operating Results and Financial Condition, which we obtained prior to the date of this auditor’s report and the information, other than the consolidated financial statements and our auditor’s report thereon, included in the annual report, which is expected to be made available to us after that date.
How our audit addressed the key audit matter
Aecon Group Inc. 70
Our opinion on the consolidated financial statements does not cover the other information and we do not express any form of assurance conclusion thereon.
In connection with our audit of the consolidated financial statements, our responsibility is to read the other information identified above and, in doing so, consider whether the other information is materially inconsistent with the consolidated financial statements or our knowledge obtained in the audit, or otherwise appears to be materially misstated.
If, based on the work we have performed on the other information that we obtained prior to the date of this auditor’s report, we conclude that there is a material misstatement of this other information, we are required to report that fact. We have nothing to report in this regard. When we read the information, other than the consolidated financial statements and our auditor’s report thereon, included in the annual report, if we conclude that there is a material misstatement therein, we are required to communicate the matter to those charged with governance.
Responsibilities of management and those charged with governance for the consolidated financial statements
Management is responsible for the preparation and fair presentation of the consolidated financial statements in accordance with IFRS Accounting Standards, and for such internal control as management determines is necessary to enable the preparation of consolidated financial statements that are free from material misstatement, whether due to fraud or error.
In preparing the consolidated financial statements, management is responsible for assessing the Company’s ability to continue as a going concern, disclosing, as applicable, matters related to going concern and using the going concern basis of accounting unless management either intends to liquidate the Company or to cease operations, or has no realistic alternative but to do so.
Those charged with governance are responsible for overseeing the Company’s financial reporting process.
Auditor’s responsibilities for the audit of the consolidated financial statements
Our objectives are to obtain reasonable assurance about whether the consolidated financial statements as a whole are free from material misstatement, whether due to fraud or error, and to issue an auditor’s report that includes our opinion. Reasonable assurance is a high level of assurance, but is not a guarantee that an audit conducted in accordance with Canadian generally accepted auditing standards will always detect a material misstatement when it exists. Misstatements can arise from fraud or error and are considered material if, individually or in the aggregate, they could reasonably be expected to influence the economic decisions of users taken on the basis of these consolidated financial statements.
As part of an audit in accordance with Canadian generally accepted auditing standards, we exercise professional judgment and maintain professional skepticism throughout the audit. We also:
Identify and assess the risks of material misstatement of the consolidated financial statements, whether due to fraud or error, design and perform audit procedures responsive to those risks, and
2023 Annual Report 71
obtain audit evidence that is sufficient and appropriate to provide a basis for our opinion. The risk of not detecting a material misstatement resulting from fraud is higher than for one resulting from error, as fraud may involve collusion, forgery, intentional omissions, misrepresentations, or the override of internal control.
Obtain an understanding of internal control relevant to the audit in order to design audit procedures that are appropriate in the circumstances, but not for the purpose of expressing an opinion on the effectiveness of the Company’s internal control.
Evaluate the appropriateness of accounting policies used and the reasonableness of accounting estimates and related disclosures made by management.
Conclude on the appropriateness of management’s use of the going concern basis of accounting and, based on the audit evidence obtained, whether a material uncertainty exists related to events or conditions that may cast significant doubt on the Company’s ability to continue as a going concern. If we conclude that a material uncertainty exists, we are required to draw attention in our auditor’s report to the related disclosures in the consolidated financial statements or, if such disclosures are inadequate, to modify our opinion. Our conclusions are based on the audit evidence obtained up to the date of our auditor’s report. However, future events or conditions may cause the Company to cease to continue as a going concern.
Evaluate the overall presentation, structure and content of the consolidated financial statements, including the disclosures, and whether the consolidated financial statements represent the underlying transactions and events in a manner that achieves fair presentation.
Obtain sufficient appropriate audit evidence regarding the financial information of the entities or business activities within the Company to express an opinion on the consolidated financial statements. We are responsible for the direction, supervision and performance of the group audit. We remain solely responsible for our audit opinion.
We communicate with those charged with governance regarding, among other matters, the planned scope and timing of the audit and significant audit findings, including any significant deficiencies in internal control that we identify during our audit.
We also provide those charged with governance with a statement that we have complied with relevant ethical requirements regarding independence, and to communicate with them all relationships and other matters that may reasonably be thought to bear on our independence, and where applicable, related safeguards.
From the matters communicated with those charged with governance, we determine those matters that were of most significance in the audit of the consolidated financial statements of the current period and are therefore the key audit matters. We describe these matters in our auditor’s report unless law or regulation precludes public disclosure about the matter or when, in extremely rare circumstances, we determine that a matter should not be communicated in our report because the adverse consequences of doing so would reasonably be expected to outweigh the public interest benefits of such communication.
Aecon Group Inc. 72
The engagement partner on the audit resulting in this independent auditor’s report is Sal Bianco.
Chartered Professional Accountants, Licensed Public Accountants
Toronto, Ontario
March 5, 2024
2023 Annual Report 73
CONSOLIDATED BALANCE SHEETS
AS AT DECEMBER 31, 2023 AND 2022
December 31 December 31 2023 2022 Note ASSETS Current assets Cash and cash equivalents 8 $ 645,784 $ 377,212 Restricted cash 8 - 107,033 Trade and other receivables 9 969,756 1,024,378 Unbilled revenue 10 719,243 685,258 Inventories 11 20,815 37,620 Income tax recoverable 23,863 14,768 Prepaid expenses 93,795 76,985 2,473,256 2,323,254 Non-current assets Long-term financial assets 21,423 3,812 Projects accounted for using the equity method 12 232,752 107,871 Deferred income tax assets 22 93,285 74,626 Property, plant and equipment 13 251,899 395,101 Intangible assets 14 123,013 662,353 722,372 1,243,763 TOTAL ASSETS $ 3,195,628 $ 3,567,017 LIABILITIES Current liabilities Bank indebtedness 15 $ 111,700 $ 120,979 Trade and other payables 16 1,017,836 1,064,048 Provisions 17 35,270 14,579 Deferred revenue 10 519,084 386,560 Income taxes payable 11,359 9,508 Current portion of non-recourse project debt 18 - 3,347 Current portion of long-term debt 18 42,608 56,564 Convertible debentures 19 - 178,878 1,737,857 1,834,463 Non-current liabilities Provisions 17 3,976 6,318 Non-recourse project debt 18 - 375,654 Long-term debt 18 106,770 173,638 Preferred Shares of Aecon Utilities 20 157,110Concession related deferred revenue 21 - 97,412 Deferred income tax liabilities 22 125,337 124,680 Other liabilities 252 857 393,445 778,559 TOTAL LIABILITIES 2,131,302 2,613,022 EQUITY Capital stock 25 430,709 419,357 Convertible debentures 19 - 12,707 Contributed surplus 80,706 63,312 Retained earnings 551,263 435,305 Accumulated other comprehensive income 1,648 23,314 TOTAL EQUITY 1,064,326 953,995 TOTAL LIABILITIES AND EQUITY $ 3,195,628 $ 3,567,017 Contingencies (Note 24) Approved by the Board of Directors John M. Beck, Director Deborah S. Stein, Director The accompanying notes are an integral part of these consolidated financial statements Aecon Group Inc. 74
(in thousands of Canadian dollars)
CONSOLIDATED STATEMENTS OF INCOME
FOR THE YEARS ENDED DECEMBER 31, 2023 AND 2022
(in thousands of Canadian dollars, except per share amounts)
December 31 December 31 2023 2022
Revenue $ 4,643,842 $ 4,696,450 Direct costs and expenses 26 (4,388,216) (4,340,493) Gross profit 255,626 355,957 Marketing, general and administrative expense 26 (177,839) (196,439) Depreciation and amortization 26 (79,087) (94,153) Income from projects accounted for using the equity method 12 18,747 17,703 Other income 27 223,467 14,086 Operating profit 240,914 97,154 Finance income 7,665 2,899 Finance cost 28 (71,034) (57,065) Profit before income taxes 177,545 42,988 Income tax expense 22 (15,655) (12,607) Profit for the year $ 161,890 $ 30,381 Basic earnings per share 29 $ 2.62 $ 0.50 Diluted earnings per share 29 $ 2.10 $ 0.47 The accompanying notes are an integral part of these consolidated financial statements 2023 Annual Report 75
Note
CONSOLIDATED STATEMENTS OF COMPREHENSIVE INCOME
FOR THE YEARS ENDED DECEMBER 31, 2023 AND 2022
of Canadian dollars)
thousands
December 31 December 31 2023 2022 Profit for the year $ 161,890 $ 30,381 Other comprehensive income (loss): Items that will not be reclassified to profit or loss: Actuarial loss - employee benefit plans (292) (1,474) Income taxes on the above 77 391 (215) (1,083) Items that may be reclassified subsequently to profit or loss: Currency translation differences - foreign operations (7,224) 14,542 Cash flow hedges - equity accounted investees (10,839) 27,621 Cash flow hedges - joint operations (5,927) 7,935 Fair value loss on Preferred Shares of Aecon Utilities (1,840)Income taxes on the above 4,379 (9,455) Total other comprehensive income (loss) for the year (21,666) 39,560 Comprehensive income for the year $ 140,224 $ 69,941 The accompanying notes are an integral part of these consolidated financial statements Aecon Group Inc. 76
(in
CONSOLIDATED STATEMENTS OF CHANGES IN EQUITY
FOR THE YEARS ENDED DECEMBER 31, 2023 AND 2022
(in thousands of Canadian dollars, except per share amounts)
During the year ended December 31, 2023, the Company declared dividends amounting to $0.74 per share (December 31, 2022$0.74 per share).
other comprehensive income (loss) Fair value Currency Actuarial Cash loss Capital Convertible Contributed Retained translation gains and flow on preferred Shareholders' stock debentures surplus earnings differences losses hedges shares equity Balance at January 1, 2023 $ 419,357 $ 12,707 $ 63,312 $ 435,305 $ 3,274 $ 1,018 $ 19,022 $ - $ 953,995 Profit for the year - - - 161,890 - - - - 161,890 Other comprehensive income (loss): Currency translation differences - foreign operations - - - - (7,224) - - - (7,224) Remeasurements - employee benefit plans - - - - - (292) - - (292) Cash flow hedges - equity accounted investees - - - - - - (10,839) - (10,839) Cash flow hedges - joint operations - - - - - - (5,927) - (5,927) Fair value adjustments on preferred shares of Aecon Utilities - - - - - - - (1,840) (1,840) Taxes with respect to above items included in other comprehensive income - - - - - 77 4,379 - 4,456 Total other comprehensive loss for the year - - - - (7,224) (215) (12,387) (1,840) (21,666) Total comprehensive income (loss) for the year - - - 161,890 (7,224) (215) (12,387) (1,840) 140,224 Dividends declared - - - (45,745) - - - - (45,745) Repayment of convertible debentures - (12,707) 12,707 - - - - -Common shares issued on conversion of debentures 2 - - - - - - - 2 Stock-based compensation expense - - 22,075 - - - - - 22,075 Shares issued to settle LTIP/ESU/Director DSU obligations 11,350 - (11,600) (187) - - - - (437) Stock-based compensation settlements and receipts - - (5,788) - - - - - (5,788) Balance at December 31, 2023 $ 430,709 $ - $ 80,706 $ 551,263 $ (3,950) $ 803 $ 6,635 $ (1,840) $ 1,064,326 Accumulated other comprehensive income (loss) Currency Actuarial Cash Capital Convertible Contributed Retained translation gains and flow Shareholders' stock debentures surplus earnings differences losses hedges equity Balance at January 1, 2022 $ 405,807 $ 12,707 $ 60,004 $ 451,294 $ (11,268) $ 2,101 $ (7,079) $ 913,566 Profit for the year - - - 30,381 - - - 30,381 Other comprehensive income (loss): Currency translation differences - foreign operations - - - - 14,542 - - 14,542 Remeasurements - employee benefit plans - - - - - (1,474) - (1,474) Cash flow hedges - equity-accounted investees - - - - - - 27,621 27,621 Cash flow hedges - joint operations - - - - - - 7,935 7,935 Taxes with respect to above items included in other comprehensive income - - - - - 391 (9,455) (9,064) Total other comprehensive income (loss) for the year - - - - 14,542 (1,083) 26,101 39,560 Total comprehensive income (loss) for the year - - - 30,381 14,542 (1,083) 26,101 69,941 Dividends declared - - - (45,209) - - - (45,209) Stock-based compensation expense - - 19,228 - - - - 19,228 Shares issued to settle LTIP/ESU/Director DSU obligations 13,550 - (14,713) (1,161) - - - (2,324) Stock based compensation settlements and receipts - - (1,207) - - - - (1,207) Balance at December 31, 2022 $ 419,357 $ 12,707 $ 63,312 $ 435,305 $ 3,274 $ 1,018 $ 19,022 $ 953,995
Accumulated
The accompanying notes are an integral part of these consolidated financial statements 2023 Annual Report 77
CONSOLIDATED STATEMENTS OF CASH FLOWS
FOR THE YEARS ENDED DECEMBER 31, 2023 AND 2022
See Note 30 for additional disclosures relating to the Consolidated Statements of Cash Flows.
thousands
December 31 December 31 2023 2022
Note Operating activities Profit before income taxes $ 177,545 $ 42,988 Income taxes paid (38,712) (36,754) Defined benefit pension (897) 521 Stock-based compensation settlements and receipts (5,282) (3,531) Items not affecting cash: Depreciation and amortization 79,087 94,153 Income from projects accounted for using the equity method (18,747) (17,703) Gain on sale of assets (46,816) (12,568) Gain on sale of subsidiaries 27 (175,545)Gain on fair value change of Preferred Shares of Aecon Utilities 20 (2,927)Gain on fair value change of other financial instruments (942)Provision for expected credit losses 353 631 Concession deferred revenue (3,001) (3,866) Unrealized foreign exchange (gain) loss (3,448) 1,813 Increase (decrease) in provisions 32,351 (970) Notional interest representing accretion 9,929 5,727 Stock-based compensation expense 23,114 19,727 Change in other balances relating to operations 30 25,010 (203,829) 51,072 (113,661) Investing activities Decrease (increase) in restricted cash balances 2,016 (2,856) Purchase of property, plant and equipment 13 (18,516) (32,708) Proceeds on sale of property, plant and equipment 71,081 12,544 Proceeds on sale of subsidiaries, net of cash in subsidiaries disposed 27 317,632Increase in intangible assets (5,481) (8,604) Increase in long-term financial assets (19,095) (836) Distributions from projects accounted for using the equity method 13,856 3,183 Net cash outflow from business acquisitions (716) (5,820) 360,777 (35,097) Financing activities (Decrease) increase in bank indebtedness (9,279) 97,674 Issuance of long-term debt 12,794 15,391 Repayments of lease liabilities (44,762) (61,703) Repayments of long-term debt (22,341) (15,755) Issuance of Preferred Shares by Aecon Utilities 20 154,640Repayments of non-recourse project debt (3,355) (3,002) Dividends paid (45,611) (44,469) Repayment of convertible debentures (183,998)(141,912) (11,864) Increase (decrease) in cash and cash equivalents during the year 269,937 (160,622) Effect of foreign exchange on cash balances (1,365) 5,153 Cash and cash equivalents - beginning of year 377,212 532,681 Cash and cash equivalents - end of year 8 $ 645,784 $ 377,212
(in
of Canadian dollars)
CASH PROVIDED BY (USED IN)
The accompanying notes are an integral part of these consolidated financial statements Aecon Group Inc. 78
NOTES TO THE CONSOLIDATED FINANCIAL STATEMENTS
DECEMBER 31, 2023 AND 2022
(in
thousands of Canadian dollars, except per share amounts)
1. CORPORATE INFORMATION
Aecon Group Inc. (“Aecon” or the “Company”) is a publicly traded construction and infrastructure development company incorporated in Canada. Aecon and its subsidiaries provide services to private and public sector clients throughout Canada and on a selected basis internationally. Its registered office is located in Toronto, Ontario at 20 Carlson Court, Suite 105, M9W 7K6.
The Company operates in two segments within the infrastructure development industry: Construction and Concessions. Refer to Note 35 “Related Parties,” for further details on the Company’s subsidiaries and significant joint arrangements and associates.
2. DATE OF AUTHORIZATION FOR ISSUE
The consolidated financial statements of the Company were authorized for issue on March 5, 2024 by the Board of Directors of the Company.
3. BASIS OF PRESENTATION
Basis of presentation and statement of compliance
The Company prepares its consolidated financial statements in accordance with International Financial Reporting Standards as issued by the International Accounting Standards Board (“IFRS Accounting Standards”).
Basis of measurement
The consolidated financial statements have been prepared under the historical cost convention, except for the revaluation of certain financial assets and financial liabilities to fair value, including derivative instruments.
Principles of consolidation
The consolidated financial statements include the accounts of the Company and all of its subsidiaries. In addition, the Company’s participation in joint arrangements classified as joint operations is accounted for in the consolidated financial statements by reflecting, line by line, the Company’s share of the assets held jointly, liabilities incurred jointly, and revenue and expenses arising from the joint operations. The consolidated financial statements also include the Company’s investment in and share of the earnings of projects accounted for using the equity method.
4. CRITICAL ACCOUNTING ESTIMATES
The preparation of the Company’s consolidated financial statements requires management to make judgments, estimates and assumptions that affect the reported amounts of revenue, expenses, assets and liabilities, and the disclosure of contingent liabilities. Uncertainty about these assumptions and estimates could result in a material adjustment to the carrying value of the asset or liability affected.
Critical accounting estimates are those that require management to make assumptions about matters that are highly uncertain at the time the estimate or assumption is made. Critical accounting estimates are also those that could potentially have a material impact on the Company’s financial results were a different estimate or assumption used.
Estimates and underlying assumptions are reviewed on an ongoing basis. These estimates and assumptions are subject to change at any time based on experience and new information. Revisions to accounting estimates are recognized in the period in which the estimates are revised and in any future periods affected. Critical accounting estimates are also not specific to any one segment unless otherwise noted below.
The Company’s material accounting policies are described in Note 5, “Summary of Material Accounting Policies”. The following discussion is intended to describe those judgments and key assumptions concerning major sources of
2023 Annual Report 79
NOTES TO THE CONSOLIDATED FINANCIAL STATEMENTS
DECEMBER 31, 2023 AND 2022
(in
thousands of Canadian dollars, except per share amounts)
estimation uncertainty at the end of the reporting period that have the most significant risk of resulting in a material adjustment to the carrying amount of assets and liabilities within the next financial year.
ECONOMIC CONDITIONS
Within the Construction segment, economic conditions have had varying degrees of impact since 2020 and through to the end of year 2023, notably from supply chain disruptions, inflation related to labour and materials, and availability of labour (see also Section 24, “Contingencies”). Within the Concessions segment, COVID-19 and related travel restrictions and protocols, as well as the recovery in air traffic since those restrictions were lifted, have impacted operations at the Bermuda International Airport Project since March 2020, including through to the end of year 2023.
Any estimate of the length and severity of these developments is subject to significant uncertainty, and accordingly estimates of the extent to which the ongoing economic conditions may materially and adversely affect the Company’s operations, financial results and condition in future periods are also subject to significant uncertainty. Therefore, uncertainty about judgments, estimates and assumptions made by management during the preparation of the Company’s consolidated financial statements related to potential impacts of these economic conditions on revenue, expenses, assets, liabilities, and note disclosures could result in a material adjustment to the carrying value of the asset or liability affected. The major sources of estimation uncertainty and judgment affecting the Company are discussed in greater detail below.
4.1 MAJOR SOURCES OF ESTIMATION UNCERTAINTY
REVENUE AND GROSS PROFIT RECOGNITION
Revenue and income from fixed price construction contracts, including contracts in which the Company participates through joint operations, are determined on the percentage of completion method, based on the ratio of costs incurred to date over estimated total costs. The Company has a process whereby progress on jobs is reviewed by management on a regular basis and estimated costs to complete are updated. However, due to unforeseen changes in the nature or cost of the work to be completed or performance factors, contract profit can differ significantly from earlier estimates.
The Company’s estimates of contract revenue and cost are highly detailed. Management believes, based on its experience, that its current systems of management and accounting controls allow the Company to produce materially reliable estimates of total contract revenue and cost during any accounting period. However, many factors can and do change during a contract performance period, which can result in a change to contract profitability from one financial reporting period to another. Some of the factors that can change the estimate of total contract revenue and cost include differing site conditions (to the extent that contract remedies are unavailable), the availability of skilled contract labour, the performance of major material suppliers to deliver on time, the performance of major subcontractors, unusual weather conditions and the accuracy of the original bid estimate. Fixed price contracts are common across all of the Company’s sectors, as are change orders and claims, and therefore these estimates are not unique to one core segment. Because the Company has many contracts in process at any given time, these changes in estimates can offset each other without impacting overall profitability. Changes in cost estimates, which on larger, more complex construction projects can have a material impact on the Company’s consolidated financial statements, are reflected in the results of operations when they become known.
A change order results from a change to the scope of the work to be performed compared to the original contract that was signed. Unpriced change orders are change orders that have been approved as to scope but unapproved as to price. Claims are amounts in excess of the agreed contract price, or amounts not included in the original contract price, that the Company seeks to collect from clients for delays, errors in specifications and designs, contract terminations, change orders in dispute or unapproved as to both scope and price, or other causes of unanticipated additional costs. Management, in making judgments, estimates and assumptions that affect the contract revenue and cost amounts from unpriced change orders and claims, also considered the impacts of recent economic conditions on the Company’s operations. As noted above in greater detail, Aecon’s operations since 2020 were impacted at varying times by supply chain disruptions, inflation related to labour and materials, and availability of labour, or by other impacts on air traffic. These judgments, estimates and assumptions affecting the revenue and cost forecasts of individual performance obligations were based on facts and circumstances that existed at the time when such judgments, estimates and assumptions were made. In accordance with the Company’s accounting policy, unpriced change orders and claims are recognized in revenue at the amount the Company expects to be entitled to, where it is highly probable that a significant
Aecon Group Inc. 80
NOTES TO THE CONSOLIDATED FINANCIAL STATEMENTS
DECEMBER 31, 2023 AND 2022
(in
thousands of Canadian dollars, except per share amounts)
reversal of cumulative revenue recognized will not occur when the uncertainty associated with the variable consideration is resolved. Where such revenue amounts cannot be estimated with reasonable assurance, they are excluded from the revenue forecast of the related performance obligation. Therefore, it is possible for the Company to have substantial contract costs recognized in one accounting period with associated revenue recognized in a later period.
Given the above-noted critical accounting estimates associated with the accounting for construction contracts, including change orders and claims, it is reasonably possible, on the basis of existing knowledge, that outcomes within the next financial year or later could be different from the estimates and assumptions adopted and could require a material adjustment to revenue and/or the carrying amount of the asset or liability affected. The Company is unable to quantify the potential impact to the consolidated financial results from a change in estimate in calculating revenue.
LITIGATION RISK AND CLAIMS RISK
Disputes are common in the construction industry and as such, in the normal course of business, the Company is involved in various legal actions and proceedings which arise from time to time, some of which may be substantial, including the legal proceedings discussed in Note 24, “Contingencies”. The Company must make certain assumptions and rely on estimates regarding potential outcomes of legal proceedings in order to determine if a provision is required. Estimating and recording the future outcome of litigation proceedings requires management to make significant judgments and assumptions, which are inherently subject to risks and uncertainties. Management regularly analyzes current information about these matters, and internal and external legal counsel, as well as other claim specialists, are often used for these assessments. In making decisions regarding the need for provisions, management considers the degree of probability of an unfavorable outcome and the ability to make a sufficiently reliable estimate of the amount of loss. The outcome of matters related to disputes, legal actions and proceedings may have a material effect on the financial position, results of operations or cash flows of the Company, and there is no guarantee that there will not be a future rise in litigation which, depending on the nature of the litigation, could impact the financial position, results of operations, or cash flows of the Company.
The Company also pursues claims against project owners for additional costs exceeding the contract price or for amounts not included in the original contract price. When these types of events occur and unresolved claims are pending, the Company may invest significant working capital in projects to cover costs pending the resolution of the relevant claims. A failure to ultimately recover on claims could have a material effect on liquidity and financial results.
FAIR VALUING FINANCIAL INSTRUMENTS
From time to time, the Company, often through its subsidiaries, joint arrangements and equity accounted investees, enters into forward contracts and other foreign exchange hedging products to manage its exposure to changes in exchange rates related to transactions denominated in currencies other than the Canadian dollar, but does not hold or issue such financial instruments for speculative trading purposes. In addition, some of the Company’s equity accounted investees enter into derivative financial instruments, namely interest rate swaps, to hedge the variability of interest rates related to non-recourse project debt. The Company is required to measure certain financial instruments at fair value, using the most readily available market comparison data and where no such data is available, using quoted market prices of similar assets or liabilities, quoted prices in markets that are not active, or other observable inputs that can be corroborated.
Preferred Shares issued by Aecon Utilities Group Inc. “Aecon Utilities” are recorded as a financial liability measured at fair value through profit and loss. The fair value of the Preferred Shares was determined at inception, represented by the aggregate subscription price, and subsequently remeasured to its fair value at each reporting date. This subsequent fair value was determined using significant unobservable inputs when readily available market comparison date was not available. The key inputs in the fair value measurement include credit spread, market volatility, and the underlying share price. The changes in these inputs and assumptions could materially affect the determination of the fair value at each reporting date. Refer to Note 20, “Preferred Shares of Aecon Utilities” and Note 31, “Financial Instruments” for further details regarding the Preferred Shares.
While the Company considers its fair value measurements to be appropriate and reasonable, the use of alternative assumptions could result in different fair values. It is possible that other market participants may measure a same financial instrument and arrive at a different fair value on a given valuation date, with the valuation techniques and inputs used by
2023 Annual Report 81
NOTES TO THE CONSOLIDATED FINANCIAL STATEMENTS
DECEMBER 31, 2023 AND 2022
(in
thousands of Canadian dollars, except per share amounts)
these market participants still meeting the definition of fair value. The fact that different fair value measurements could exist reflects the judgment, estimates and assumptions applied as well as the uncertainty involved in determining the fair value of these financial instruments.
Further information with regard to the treatment of other financial instruments can be found in Note 31, “Financial Instruments.”
INCOME TAXES
The Company is subject to income taxes in both Canada and several foreign jurisdictions. Significant estimates and judgments are required in determining the Company’s worldwide provision for income taxes. In the ordinary course of business, there are transactions and calculations where the ultimate tax determination is uncertain. The Company recognizes liabilities for anticipated tax audit issues based on estimates of whether additional taxes will be due. Management estimates income taxes for each jurisdiction the Company operates in, taking into consideration different income tax rates, non-deductible expenses, valuation allowances, changes in tax laws, and management’s expectations of future results. Management bases its estimates of deferred income taxes on temporary differences between the assets and liabilities reported in the Company’s consolidated financial statements, and the assets and liabilities determined by the tax laws in the various countries in which the Company operates. Although the Company believes its tax estimates are reasonable, there can be no assurance that the final determination of any tax audits and litigation will not be materially different from that reflected in the Company’s historical income tax provisions and accruals. Where the final tax outcome of these matters is different from the amounts that were initially recorded, such differences will impact the Company’s income tax expense and current and deferred income tax assets and liabilities in the period in which such determinations are made. Although management believes it has adequately provided for any additional taxes that may be assessed as a result of an audit or litigation, the occurrence of either of these events could have an adverse effect on the Company’s current and future results and financial condition.
The Company is unable to quantify the potential future impact to its consolidated financial results from a change in estimate in calculating income tax assets and liabilities.
IMPAIRMENT OF GOODWILL AND OTHER INTANGIBLE ASSETS
Intangible assets with finite lives are amortized over their useful lives. Goodwill, which has an indefinite life, is not amortized. Management evaluates intangible assets that are not amortized at the end of each reporting period to determine whether events and circumstances continue to support an indefinite useful life. Intangible assets with finite lives, including the Company’s intangible assets in Skyport which is accounted for using the equity method, are tested for impairment whenever events or circumstances indicate the carrying value may not be recoverable. Goodwill and intangible assets with indefinite lives, if any, are tested for impairment by applying a fair value test in the fourth quarter of each year and between annual tests if events occur or circumstances change, which suggest the goodwill or intangible assets should be evaluated.
Impairment assessments inherently involve management judgment as to the assumptions used to project these amounts and the impact of market conditions on those assumptions. The key assumptions used to estimate the fair value of cash generating units under the fair value less cost to disposal approach are: weighted average cost of capital used to discount the projected cash flows; cash flows generated from new work awards; and projected operating margins.
The weighted average cost of capital rates used to discount projected cash flows are developed via the capital asset pricing model, which is primarily based on market inputs. Management uses discount rates it believes are an accurate reflection of the risks associated with the forecasted cash flows of the respective reporting units.
To develop the cash flows generated from project awards and projected operating margins, the Company tracks prospective work primarily on a project-by-project basis as well as the estimated timing of when new work will be bid or prequalified, started and completed. Management also gives consideration to its relationships with prospective customers, the competitive landscape, changes in its business strategy, and the Company’s history of success in winning new work in each reporting unit. With regard to operating margins, consideration is given to historical operating margins in the end markets where prospective work opportunities are most significant, and changes in the Company’s business strategy.
Aecon Group Inc. 82
NOTES TO THE CONSOLIDATED FINANCIAL STATEMENTS
DECEMBER 31, 2023 AND 2022
(in thousands of Canadian dollars, except per share amounts)
Unanticipated changes in these assumptions or estimates could materially affect the determination of the fair value of a reporting unit and, therefore, could reduce or eliminate the excess of fair value over the carrying value of a reporting unit entirely and could potentially result in an impairment charge in the future.
See Note 14, “Intangible Assets”, in the Company’s annual consolidated financial statements for the year ended December 31, 2023 for further details regarding goodwill and other intangible assets.
4.2 JUDGMENTS
The following are critical judgments management has made in the process of applying accounting policies and that have the most significant effect on how certain amounts are reported in the consolidated financial statements.
BASIS FOR CONSOLIDATION AND CLASSIFICATION OF JOINT ARRANGEMENTS
Assessing the Company’s ability to control or influence the relevant financial and operating policies of another entity may, depending on the facts and circumstances, require the exercise of significant judgment to determine whether the Company controls, jointly controls, or exercises significant influence over the entity performing the work. This assessment of control impacts how the operations of these entities are reported in the Company’s consolidated financial statements (i.e., full consolidation, equity investment or proportional share).
The Company performs the majority of its construction and concession projects through wholly owned subsidiary entities, which are fully consolidated. However, a number of projects, particularly some larger, multi-year, multi-disciplinary projects and concession projects, are executed through partnering agreements. As such, the classification of these entities as a subsidiary, joint operation, joint venture, associate or financial instrument requires judgment by management to analyze the various indicators that determine whether control exists. In particular, when assessing whether an entity is classified as either a joint operation, joint venture or associate, management considers the contractual rights and obligations, voting shares, share of board members and the legal structure of the joint arrangement. Subject to reviewing and assessing all the facts and circumstances of each joint arrangement, joint arrangements contracted through agreements and general partnerships would generally be classified as joint operations whereas joint arrangements contracted through corporations would be classified as joint ventures. The majority of the current partnering agreements are classified as joint operations.
The application of different judgments when assessing control or the classification of joint arrangements could result in materially different presentations in the consolidated financial statements.
SERVICE CONCESSION ARRANGEMENTS
The accounting for concession arrangements requires the application of judgment in determining if the project falls within the scope of IFRIC Interpretation 12, “Service Concession Arrangements”, (“IFRIC 12”). Additional judgments are needed when determining, among other things, the accounting model to be applied under IFRIC 12, the allocation of the consideration receivable between revenue-generating activities, the classification of costs incurred on such activities, as well as the effective interest rate to be applied to the financial asset. As the accounting for concession arrangements under IFRIC 12 requires the use of estimates over the term of the arrangement, any changes to these long-term estimates could result in a significant variation in the accounting for the concession arrangement.
DISCONTINUED OPERATIONS
The determination of whether a component of the Company, that either has been disposed of or is classified as held for sale, should be classified as a discontinued operation requires the exercise of judgment by management. The classification can have a significant impact on the presentation in the consolidated financial statements. In the third quarter of 2023, the Company completed the sale of a 49.9% interest in L.F. Wade International Airport (Bermuda International Airport) concessionaire, Bermuda Skyport Corporation Limited (“Skyport”). In management’s judgment, Skyport does not meet the criteria for classification as a discontinued operation. In making such determinations, management examined all the lines of business the Company currently operates in, and the geographic markets the Company participates in. With respect to Skyport, the Company will retain the management contract for the airport and joint control of Skyport with a 50.1% retained interest. The Concessions segment also continues its role of investing, developing, financing, operating and maintaining infrastructure projects by way of contractual structures in the global marketplace for public-private partnerships (“P3”).
2023 Annual Report 83
NOTES TO THE CONSOLIDATED FINANCIAL STATEMENTS
DECEMBER 31, 2023 AND 2022
(in
thousands of Canadian dollars, except per share amounts)
In the second quarter of 2023, the Aecon Transportation East (“ATE”) operations in Ontario were sold. In management’s judgment, the ATE operations do not meet the criteria for classification as a discontinued operation as the Company will continue to provide roadbuilding infrastructure solutions outside of Ontario to provincial governments, municipalities, and private clients. In Ontario, the Company will also continue to deliver integrated solutions to private and public-sector clients through its Construction segment, including major projects that have a roadbuilding component to them.
5. SUMMARY OF MATERIAL ACCOUNTING POLICIES
5.1 REVENUE RECOGNITION
Identification of a contract with a customer
A construction contract is a contract specifically negotiated for the construction of an asset or combination of assets, including contracts for the rendering of services directly related to the construction of the asset. Such contracts include fixed price and cost-plus contracts.
When determining the proper revenue recognition method for contracts, the Company evaluates whether two or more contracts should be combined and accounted for as one single contract and whether the combined or single contract should be accounted for as more than one performance obligation. This evaluation requires significant judgment and the decision to combine a group of contracts or to separate a single contract into multiple performance obligations could affect the amount of revenue and profit recorded in a given period.
The Company accounts for a contract when it has commercial substance, the parties have approved the contract in accordance with customary business practices and are committed to their obligations, the rights of the parties and payment terms are identified, and collectability of consideration is probable.
Identifying performance obligations in a contract
For most of the Company’s contracts, the customer contracts with the Company to provide a significant service of integrating a complex set of tasks and components into a single project. Consequently, the entire contract is accounted for as one performance obligation. Less frequently, however, the Company may provide several distinct goods or services as part of a contract, in which case the Company separates the contract into more than one performance obligation. If a contract is separated into more than one performance obligation, the total transaction price is allocated to each performance obligation in an amount based on the estimated relative standalone selling prices of the promised goods or services underlying each performance obligation. The expected cost plus a margin approach is typically used to estimate the standalone selling price of each performance obligation. On occasion, the Company will sell standard products, such as aggregates and other materials, with observable standalone sales. In these cases, the observable standalone sales are used to determine the standalone selling price.
Performance obligations satisfied over time
The Company typically transfers control of goods or services, and satisfies performance obligations, over time. Therefore, the Company recognizes revenue over time as these performance obligations are satisfied. This continuous transfer of control to the customer is often supported by the customer’s physical possession or legal title to the work in process, as well as contractual clauses that provide the Company with a present right to payment for work performed to date plus a reasonable profit in the event a customer unilaterally terminates the contract for convenience.
As a result of control transferring over time, revenue is recognized based on the extent of progress towards completion of the performance obligation. The Company generally uses the cost-to-cost measure of progress for its contracts because it best reflects the transfer of an asset to the customer which occurs as costs are incurred on the contract. Under the cost-to-cost measure of progress, the extent of progress towards completion is measured based on the ratio of costs incurred to date to the total estimated costs at completion of the performance obligation. Revenues, including estimated fees or profits, are recorded proportionally as costs are incurred. Costs to fulfill contracts may include labour, materials, subcontractor, equipment costs, and other direct costs, as well as an allocation of indirect costs.
Aecon Group Inc. 84
NOTES TO THE CONSOLIDATED FINANCIAL STATEMENTS
DECEMBER 31, 2023 AND 2022
(in thousands of Canadian dollars, except per share amounts)
Determining the transaction price
It is common for the Company’s contracts to contain incentive fees or other provisions that can either increase or decrease the transaction price. These variable amounts generally are awarded upon achievement of certain performance metrics, program milestones or cost targets and can be based upon customer discretion. Variable consideration also includes change orders that have not been approved as to price, as well as claims. Claims are amounts in excess of the agreed contract price, or amounts not included in the original contract price, that the Company seeks to collect from clients for delays, errors in specifications and designs, contract terminations, change orders in dispute or unapproved as to both scope and price, or other causes of unanticipated additional costs. The Company estimates variable consideration at the most likely amount it expects to be entitled. The Company includes these estimated amounts in the transaction price to the extent it is highly probable that a significant reversal of cumulative revenue recognized will not occur when the uncertainty associated with the variable consideration is resolved. The estimates of variable consideration and determination of whether to include estimated amounts in the transaction price are based largely on an assessment of the Company’s anticipated performance and all information, historical, current and forecasted, that is reasonably available.
Contracts are often modified to account for changes in contract specifications and requirements. Contract modifications exist when the change either creates new, or changes existing, enforceable rights and obligations. Most of the Company’s contract modifications are for goods or services that are not distinct from the existing contract due to the significant integration service provided in the context of the contract and are accounted for as if they were part of that existing contract. The effect of these contract modifications on the transaction price and the measure of progress for the performance obligation to which it relates, is recognized as a cumulative adjustment to revenue as either an increase or decrease in revenue. However, if a contract modification is for distinct goods and services from the existing contract and the pricing of the contract modification reflects the standalone selling pricing of the additional goods or services, then the contract modification is treated as a separate contract.
Due to the nature of many of the Company’s performance obligations, the estimation of total revenue and costs at completion is complex, subject to many variables, and requires significant judgment. These areas of measurement uncertainty are discussed further in Note 4.1, “Major Sources of Estimation Uncertainty”. Any changes to the estimates of forecasted revenue and total costs are recognized on a cumulative basis, which recognizes in the current period the cumulative effect of the changes based on a performance obligation's percentage of completion. A significant change in one or more of these estimates could affect the profitability of one or more of the Company’s performance obligations. When estimates of total costs to be incurred on a performance obligation exceed the total estimated revenue to be earned, a provision for the entire loss on the performance obligation is recognized in the period the loss is determined.
Revenue recognition – other
Upfront costs are those costs that the Company incurs to pursue a contract with a customer that it would not have incurred if the contract had not been awarded. The Company recognizes upfront costs as an asset if it expects to recover those costs. Costs to pursue a contract that would have been incurred regardless of whether the contract was awarded are recognized as an expense when incurred, unless those costs are explicitly chargeable to the customer regardless of whether the contract is obtained.
Mobilization costs are non-recurring set up costs incurred to facilitate performance obligations under customer contracts. Mobilization costs are expensed as incurred unless they are capital in nature, in which case they are capitalized in accordance with the relevant accounting standard, or there is a contractual entitlement to recover such costs from the customer, in which case the costs are capitalized and amortized to the income statement over the contract period.
Contract revenues are measured at the fair value of the consideration received or receivable. Where deferral of payment has a material effect on the determination of such fair value, the amount at which revenues are recognized is adjusted to account for the time-value-of-money.
Trade and other receivables include amounts billed and currently due from customers. The Company maintains an allowance for expected credit losses to provide for the estimated amount of receivables that will not be collected. The allowance is based upon an assessment of creditworthiness of the portfolio of customers, historical payment experience, the age of outstanding receivables, collateral to the extent applicable, and forward-looking information regarding collectability.
2023 Annual Report 85
NOTES TO THE CONSOLIDATED FINANCIAL STATEMENTS
DECEMBER 31, 2023 AND 2022
(in thousands of Canadian dollars, except per share amounts)
Unbilled revenue represents revenue earned in excess of amounts billed on uncompleted contracts. Unbilled revenue typically results from sales under construction contracts when the cost-to-cost method of revenue recognition is utilized and revenue recognized exceeds the amount billed to the customer. Unbilled revenue amounts are adjusted for expected credit losses.
Deferred revenue represents the excess of amounts billed to customers over revenue earned on uncompleted contracts. Where advance payments are received from customers for the mobilization of project staff, equipment and services, the Company recognizes these amounts as liabilities and includes them in deferred revenue. Deferred revenue on construction contracts is classified as a current liability.
Unbilled revenue and deferred revenue are accounted for on a contract-by-contract basis at the end of each reporting period.
The operating cycle, or duration, of many of the Company’s contracts exceeds one year. All contract related assets and liabilities are classified as current as they are expected to be realized or satisfied within the operating cycle of the contract.
The Company normally does not have any construction contracts where the period up to the transfer of the promised goods or services to the customer represents a financing component. As such, the transaction price is not adjusted for the time value of money. For long-term receivables under Service Concession Arrangements, see section 5.12, “Service Concession Arrangements”.
If the Company receives an advance payment, a future obligation is recognized and the recognition and measurement principles of IFRS 15 are applied to determine an appropriate basis for recognizing revenue.
Generally, construction and services contracts include defect and warranty periods following completion of the project. These obligations are not deemed to be separate performance obligations and are therefore estimated and included in the total cost of the contracts. Where required, amounts are recognized according to IAS 37 “Provisions, Contingent Liabilities and Contingent Assets”.
Other revenue types
Revenue related to the sale of aggregates and other materials is recognized at a point in time, and the performance obligation is typically satisfied on the delivery of the product to the customer.
Revenue related to operations and maintenance (“O&M”) is recognized over time, as the performance obligations are satisfied by the Company.
Remaining performance obligations
Backlog (i.e. remaining performance obligations) is the total value of work that has not yet been completed that: (a) has a high certainty of being performed as a result of the existence of an executed contract or work order specifying job scope, value and timing; or (b) has been awarded to the Company, as evidenced by an executed binding letter of intent or agreement, describing the general job scope, value and timing of such work, and where the finalization of a formal contract in respect of such work is reasonably assured. O&M activities are provided under contracts that can cover a period of up to 30 years. In order to provide information that is comparable to the backlog of other categories of activity, the Company limits backlog for O&M activities to the earlier of the contract term and the next five years.
5.2 CASH AND CASH EQUIVALENTS
Cash and cash equivalents consist of cash at banks and on hand, cash in joint operations, demand deposits, and shortterm highly liquid investments that are readily convertible into known amounts of cash and that are subject to an insignificant risk of changes in value. The Company considers investments purchased with original maturities of three months or less to be cash equivalents.
Aecon Group Inc. 86
NOTES TO THE CONSOLIDATED FINANCIAL STATEMENTS
DECEMBER 31, 2023 AND 2022
(in thousands of Canadian dollars, except per share amounts)
5.3 FINANCIAL INSTRUMENTS – CLASSIFICATION AND MEASUREMENT
The Company classifies its financial assets into one of three categories: measured at amortized cost, fair value through other comprehensive income (“FVTOCI”) and fair value through profit and loss (“FVTPL”). The classification of financial assets under IFRS 9 is generally based on the business model in which a financial asset is managed and its contractual cash flow characteristics.
Recognition and initial measurement
Financial assets and financial liabilities are recognized in the statement of financial position when the Company becomes party to the contractual provisions of a financial instrument. All financial instruments are measured at fair value on initial recognition. Financial instruments related to all contract assets and liabilities are classified as current as they are expected to be realized or satisfied within the operating cycle of the contract. All other financial instruments are considered non-current if they are expected to be realized more than 12 months after the reporting period.
Transaction costs that are directly attributable to the acquisition or issuance of financial assets and financial liabilities, other than financial assets and financial liabilities classified as FVTPL, are added to or deducted from the fair value on initial recognition. Transaction costs directly attributable to the acquisition of financial assets or financial liabilities classified as FVTPL are recognized immediately in net income.
Contingent assets are not recognized in the consolidated financial statements as this may result in the recognition of income that may never be realized. However, when the realization of income is virtually certain, then the related asset is not a contingent asset and its recognition is appropriate.
Classification and subsequent measurement
The Company classifies financial assets, at the time of initial recognition, according to the Company’s business model for managing the financial assets and the contractual terms of the cash flows. Financial assets are classified in the following measurement categories:
(a) Amortized cost; and
(b) Fair value.
When assets are measured at fair value, gains and losses are either recognized entirely in profit or loss (i.e. FVTPL), or recognized in other comprehensive income (i.e. FVTOCI).
Financial assets are subsequently measured at amortized cost if both the following conditions are met and they are not designated as FVTPL:
(a) the financial asset is held within a business whose objective is to hold financial assets to collect contractual cash flows; and
(b) the contractual terms of the financial asset give rise on specified dates to cash flows that are solely payments of principal and interest on the principal amount outstanding. These assets are subsequently measured at amortized cost using the effective interest rate method, less any impairment, with gains and losses recognized in net income in the period that the asset is derecognized or impaired.
Financial liabilities are subsequently measured at amortized cost using the effective interest rate method with gains and losses recognized in net income in the period that the liability is derecognized, except for financial liabilities classified as FVTPL. These financial liabilities are subsequently measured at fair value with changes in fair value recorded in net income in the period in which they arise to the extent they are not part of a designated hedging relationship.
2023 Annual Report 87
NOTES TO THE CONSOLIDATED FINANCIAL STATEMENTS
DECEMBER 31, 2023 AND 2022
(in
thousands of Canadian dollars, except per share amounts)
The following table outlines the classification of financial instruments under IFRS 9:
Classification
Financial assets
Cash and cash equivalents
Restricted cash
Trade and other receivables
Unbilled revenue
Long-term financial assets- financial instruments
Long-term financial assets- other receivables
Financial liabilities
Bank indebtedness
Trade and other payables
Long-term debt
Preferred Shares of Aecon Utilities
Other liabilities- derivative liabilities
Amortized cost
Amortized cost
Amortized cost
Amortized cost
FVTPL, unless designated in a hedging relationship in which case classified as FVTOCI
Amortized cost
Amortized cost
Amortized cost
Amortized cost
FVTPL
FVTOCI
From an accounting perspective, a preferred share that provides for mandatory redemption by the issuer for a fixed or determinable amount at a fixed or determinable future date, or gives the holder the right to require the issuer to redeem the instrument at or after a particular date for a fixed or determinable amount is a financial liability. In addition, a financial instrument that gives the holder the right to put it back to the issuer for cash or another financial asset (a 'puttable instrument') is a financial liability. As a result of the liquidity provisions and puttable nature of the Preferred Shares of Aecon Utilities, the Preferred Shares have been classified as a non-current financial liability in the consolidated balance sheets at December 31, 2023.
In addition, because the Preferred Shares contain certain embedded features that would otherwise qualify as embedded derivatives, the Company has elected to designate the Preferred Shares at fair value through profit or loss and will subsequently revalue the Preferred Shares to its fair value at each reporting date. The amount of change in the fair value of the financial liability that is attributable to changes in the credit risk of the Preferred Shares are recognized in other comprehensive income and are not recycled through the income statement.
5.4 DERIVATIVE FINANCIAL INSTRUMENTS – HEDGE ACCOUNTING
The Company, often through its joint arrangements and equity accounted investees, enters into derivative financial instruments, namely interest rate swaps to hedge the variability of interest rates related to the long-term debt of its concession projects and foreign currency forward contracts to hedge foreign currency exposures on select construction projects. For designated hedges, the Company formally documents all relationships between hedging instruments and hedged items, as well as its risk management objective and strategy for undertaking these hedge transactions, and regularly assesses the effectiveness of these hedges.
Derivative financial instruments designated as cash flow hedges are measured at fair value established by using valuation techniques based on observable market data and taking into account the credit quality of the instruments. The effective portion of the change in fair value of the derivative financial instrument is recorded in other comprehensive income, while the ineffective portion, if any, of such change is recognized in net income. When ineffective, gains or losses from cash flow hedges included in other comprehensive income are reclassified to net income as an offset to the losses or gains recognized on the underlying hedged items.
Aecon Group Inc. 88
NOTES TO THE CONSOLIDATED FINANCIAL STATEMENTS
DECEMBER 31, 2023 AND 2022
(in
thousands of Canadian dollars, except per share amounts)
5.5 PROPERTY, PLANT AND EQUIPMENT
Property, plant and equipment are recorded at historical cost less accumulated depreciation and accumulated impairment losses, if any. The cost of property, plant and equipment includes the purchase price and the directly attributable costs of acquisition or construction costs required to bring the asset to the location and condition necessary for the asset to be capable of operating in the manner intended by management. Right-of-use assets are initially measured at cost, which comprises the initial amount of the lease liability adjusted for any lease payments made at or before the commencement date, plus any initial direct costs incurred and an estimate of costs to dismantle and remove the underlying asset or to restore the underlying asset or the site on which it is located, less any lease incentives received.
In subsequent periods, property, plant and equipment are stated at cost less accumulated depreciation and any impairment in value, with the exception of land and assets under construction, which are not depreciated but are stated at cost less any impairment in value.
Depreciation is recorded to allocate the cost, less estimated residual values of property, plant and equipment over their estimated useful lives on the following bases:
Aggregate properties are depreciated using the unit of extraction method based on estimated economically recoverable reserves, which results in a depreciation charge proportional to the depletion of reserves.
All other assets, excluding assets under construction, are depreciated on a straight-line basis over periods that approximate the estimated useful lives of the assets as follows:
Assets Term
Land Not depreciated
Buildings and leasehold improvements
10 to 40
Assets under construction are not depreciated until they are brought into use, at which point they are transferred into the appropriate asset category.
The Company reviews the residual value, useful lives and depreciation method of depreciable assets on an annual basis and, where revisions are required, the Company applies such changes in estimates on a prospective basis.
The net carrying amounts of property, plant and equipment assets are reviewed for impairment either individually or at the cash-generating unit level when events and changes in circumstances indicate the carrying amount may not be recoverable. To the extent these carrying amounts exceed their recoverable amounts, that excess is fully recognized in profit or loss in the financial year in which it is determined.
When significant parts of property, plant and equipment are required to be replaced and it is probable that future economic benefits associated with the item will be available to the Company, the expenditure is capitalized and the carrying amount of the item replaced is derecognized. Similarly, maintenance and inspection costs associated with major overhauls are capitalized and depreciated over their useful lives where it is probable that future economic benefits will be available and any remaining carrying amounts of the cost of previous overhauls are derecognized. All other costs are expensed as incurred.
5.6 GOODWILL AND INTANGIBLE ASSETS
Goodwill
Goodwill represents the future economic benefits arising from other assets acquired in a business combination that are not individually identified and separately recognized. Goodwill relating to the acquisition of subsidiaries is included on the
years Machinery and equipment 2 to 15 years Office equipment 3 to 5 years Vehicles 1 to 5 years
2023 Annual Report 89
NOTES TO THE CONSOLIDATED FINANCIAL STATEMENTS
DECEMBER 31, 2023 AND 2022
(in thousands of Canadian dollars, except per share amounts)
consolidated balance sheets in intangible assets. Goodwill relating to the acquisition of associates is included in the investment of the associate and therefore tested for impairment in conjunction with the associate investment balance.
Goodwill is not amortized but is reviewed for impairment at least annually and whenever events or circumstances indicate the carrying amount may be impaired. Goodwill is allocated to cash-generating units for the purpose of impairment testing. The allocation is made to the cash-generating units or groups of cash-generating units that are expected to benefit from the business combination in which the goodwill arose. The Company’s cash-generating units generally represent either individual business units, or groups of business units that are all below the level of the Company’s operating segments.
In a business combination, when the fair value attributable to the Company’s share of the net identifiable assets acquired exceeds the cost of the business combination, the excess is recognized immediately in profit or loss.
Internally generated goodwill is not recognized.
Gains and losses on the disposal of an entity include the carrying amount of goodwill relating to the entity sold.
Intangible assets
Intangible assets acquired as part of a business combination are recorded at fair value at the acquisition date if the asset is separable or arises from contractual or legal rights and the fair value can be measured reliably on initial recognition. Separately acquired intangible assets are recorded initially at cost and thereafter are carried at cost less accumulated amortization and impairment if the asset has a finite useful life.
Intangible assets are amortized over their estimated useful lives. Intangible assets under development are not amortized until put into use.
Estimated useful lives are determined as the period over which the Company expects to use the asset and for which the Company retains control over benefits derived from use of the asset.
For intangible assets with a finite useful life, the amortization method and period are reviewed annually and impairment testing is undertaken when circumstances indicate the carrying amounts may not be recoverable.
Amortization expense on intangible assets with finite lives is recognized in profit or loss as an expense item.
The major types of intangible assets and their amortization periods are as follows:
Assets
Acquired customer backlog
Licences, software and other rights
Aggregate permits
5.7 SERVICE CONCESSION ARRANGEMENTS
Amortization basis
Pro rata basis as backlog revenue is worked off
1 - 10 years
Units of extraction
The Company accounts for Service Concession Arrangements in accordance with “IFRIC 12”.
IFRIC 12 provides guidance on the accounting for certain qualifying public-private partnership arrangements, whereby the grantor (i.e., usually a government) (a) controls or regulates what services the operator (i.e. “the concessionaire”) must provide with the infrastructure, to whom it must provide those services, and at what price; and (b) controls any significant residual interest in the infrastructure at the end of the term of the arrangement.
Aecon Group Inc. 90
NOTES TO THE CONSOLIDATED FINANCIAL STATEMENTS
DECEMBER 31, 2023 AND 2022
(in thousands of Canadian dollars, except per share amounts)
Under such concession arrangements, the concessionaire accounts for the infrastructure asset by applying one of the following accounting models depending on the allocation of the demand risk through the usage of the infrastructure between the grantor and the concessionaire:
Accounting Model
(a) Financial Asset Model
Applicable when the concessionaire does not bear demand risk through the usage of the infrastructure (i.e., it has an unconditional right to receive cash irrespective of the usage of the infrastructure, for example through availability payments).
When the Company delivers more than one category of activity in a service concession arrangement, the consideration received or receivable is allocated by reference to the relative fair values of the activity delivered, when the amounts are separately identifiable.
Revenue recognized by the Company under the financial asset model is recognized in “Long Term Receivables”, a financial asset that is recovered through payments received from the grantor.
(b) Intangible Asset Model
Applicable when the concessionaire bears demand risk (i.e., it has a right to charge fees for usage of the infrastructure).
The Company recognizes an intangible asset arising from a service concession arrangement when it has a right to charge for usage of the concession infrastructure. The intangible asset received as consideration for providing construction or upgrade services in a service concession arrangement is measured at fair value upon initial recognition. Borrowing costs, if any, are capitalized until the infrastructure is ready for its intended use as part of the carrying amount of the intangible asset.
The intangible asset is then amortized over its expected useful life, which is the concession period in a service concession arrangement. The amortization period begins when the infrastructure is available for use.
Revenues from service concession arrangements accounted for under IFRIC 12 are recognized as follows:
(a) Construction or upgrade activities when a service concession arrangement involves the construction or upgrade of the public service infrastructure:
Revenues relating to construction or upgrade services under a service concession arrangement are recognized based on the stage of completion of the work performed, consistent with the Company’s accounting policy on recognizing revenue applicable to any construction contract (see Section 5.1, “Revenue Recognition”).
(b) Operations and maintenance activities may include maintenance of the infrastructure and other activities provided directly to the grantor or the users:
Operations and maintenance revenues are recognized in the period in which the activities are performed by the Company, consistent with the Company’s accounting policy on recognizing revenue applicable to any operations and maintenance contract (see Section 5.1, “Revenue Recognition”).
(c) Financing (applicable when the financial asset model is applied)
Finance income generated on financial assets is recognized using the effective interest method.
2023 Annual Report 91
NOTES TO THE CONSOLIDATED FINANCIAL STATEMENTS
DECEMBER 31, 2023 AND 2022
(in
thousands of Canadian dollars, except per share amounts)
5.8 IMPAIRMENT OF NON-FINANCIAL ASSETS
Property, plant and equipment and intangible assets that are subject to amortization are reviewed for impairment at the end of each reporting period. If there are indicators of impairment, a review is undertaken to determine whether the carrying amounts are in excess of their recoverable amounts. An asset’s recoverable amount is determined as the higher of its fair value less costs of disposal and its value-in-use. Such reviews are undertaken on an asset-by-asset basis, except where assets do not generate cash flows independent of other assets, in which case the review is undertaken at the cash-generating unit (“CGU”) level.
Where a CGU, or group of CGUs, has goodwill allocated to it, or includes intangible assets that are either not availablefor- use or that have an indefinite useful life (and can only be tested as part of a CGU), an impairment test is performed at least annually or whenever there is an indication the carrying amounts of such assets may be impaired. Corporate assets, where material to the carrying value of a CGU in computing impairment calculations, are allocated to CGUs based on the benefits received by the CGU.
If the carrying amount of an individual asset or CGU exceeds its recoverable amount, an impairment loss is recorded in profit or loss to reflect the asset at the lower amount. In assessing the value-in-use, the relevant future cash flows expected to arise from the continuing use of such assets and from their disposal are discounted to their present value using a market determined pre-tax discount rate, which reflects current market assessments of the time-value-of-money and asset-specific risks. Fair value less costs to sell is determined as the amount that would be obtained from the sale of the asset in an arm’s length transaction between knowledgeable and willing parties.
Similarly, a reversal of a previously recognized impairment loss is recorded in profit or loss when events or circumstances indicate the estimates used to determine the recoverable amount have changed since the prior impairment loss was recognized and the recoverable amount of the asset exceeds its carrying amount. The carrying amount is increased to the recoverable amount but not beyond the carrying amount net of amortization, which would have arisen if the prior impairment loss had not been recognized. After such a reversal, the amortization charge is adjusted in future periods to allocate the asset’s revised carrying amount, less any residual value, on a systematic basis over its remaining useful life. Goodwill impairments are not reversed.
5.9 JOINT ARRANGEMENTS
Under IFRS 11, “Joint Arrangements,” a joint arrangement is a contractual arrangement wherein two or more parties have joint control. Joint control is the contractually agreed sharing of control of an arrangement when the strategic financial and operating decisions relating to the arrangement require the unanimous consent of the parties sharing control.
Investments in joint arrangements are classified as either joint operations or joint ventures depending on the contractual rights and obligations of each party. Refer to Note 4 “Critical Accounting Estimates” for significant judgments affecting the classification of joint arrangements as either joint operations or joint ventures.
The parties to a joint operation have rights to the assets, and obligations for the liabilities, relating to the arrangement whereas joint ventures have rights to the net assets of the arrangement. In accordance with IFRS 11, the Company accounts for joint operations by recognizing its share of any assets held jointly and any liabilities incurred jointly, along with its share of the revenue from the sale of the output by the joint operation, and its expenses, including its share of any expenses incurred jointly.
Joint ventures are accounted for using the equity method of accounting in accordance with IAS 28, “Investments in Associates and Joint Ventures.”
Under the equity method of accounting, the Company’s investments in joint ventures and associates are carried at cost and adjusted for post-acquisition changes in the net assets of the investment. Profit or loss reflects the Company’s share of the results of these investments. Distributions received from an investee reduce the carrying amount of the investment. The consolidated statements of comprehensive income also include the Company’s share of any amounts recognized by joint ventures and associates in OCI.
Aecon Group Inc. 92
NOTES TO THE CONSOLIDATED FINANCIAL STATEMENTS
DECEMBER 31, 2023 AND 2022
(in thousands of Canadian dollars, except per share amounts)
Where there has been a change recognized directly in the equity of the joint venture or associate, the Company recognizes its share of that change in equity.
The financial statements of the joint ventures and associates are generally prepared for the same reporting period as the Company, using consistent accounting policies. Adjustments are made to bring into line any dissimilar accounting policies that may exist in the underlying records of the joint venture and/or associate. Adjustments are made in the consolidated financial statements to eliminate the Company’s share of unrealized gains and losses on transactions between the Company and its joint ventures and associates.
Transactions with joint operations
Where the Company contributes or sells assets to a joint operation, the Company recognizes only that portion of the gain or loss that is attributable to the interests of the other parties.
Where the Company purchases assets from a joint operation, the Company does not recognize its share of the profit or loss of the joint operation from the transaction until it resells the assets to an independent party.
The Company adjusts joint operation financial statement amounts, if required, to reflect consistent accounting policies.
5.10 ASSOCIATES
Entities in which the Company has significant influence and which are neither subsidiaries, nor joint arrangements, are accounted for using the equity method of accounting in accordance with IAS 28, “Investments in Associates and Joint Ventures.” This method of accounting is described in Section 5.14, “Joint Arrangements.”
The Company discontinues the use of the equity method from the date on which it ceases to have significant influence, and from that date accounts for the investment in accordance with IFRS 9, “Financial Instruments,” (at fair value), provided the investment does not then qualify as a subsidiary or a joint arrangement.
5.11 LOSS OF CONTROL OF A SUBSIDIARY
The loss of control of a subsidiary for accounting purposes usually occurs when the Company sells or otherwise transfers a portion of its interest in a subsidiary in a single transaction or as a result of multiple transactions. On losing control of a subsidiary for accounting purposes, the Company:
• derecognizes the assets (including goodwill) and liabilities of the subsidiary at their carrying amounts;
• derecognizes the non-controlling interest (including any components of other comprehensive income attributable to them);
• recognizes the fair value of the consideration received, if any, and any shares distributed as dividends as part of the transaction that resulted in the loss of control;
• recognizes any investment retained in the former subsidiary at fair value;
• reclassifies to profit or loss (if required by other IFRS Accounting Standards) or transfers directly to retained earnings, any amounts included in other comprehensive income; and
• recognizes any resulting gain or loss within profit or loss attributable to the parent.
5.12 PROVISIONS
General
Provisions are recognized when the Company has a present obligation (legal or constructive) as a result of a past event, it is probable that an outflow of resources embodying economic benefits will be required to settle the obligation and a reliable estimate can be made of the amount of the obligation. Where the Company expects some or all of the provision to be reimbursed, the reimbursement is recognized as a separate asset when reimbursement is virtually certain. The expense relating to any provision is presented in profit or loss net of any reimbursement. Where material, provisions are discounted using a current pre-tax discount rate that reflects, where appropriate, the risks specific to the liability. Where discounting is used, the increase in the provision due to the passage of time is recognized as a finance cost.
2023 Annual Report 93
NOTES TO THE CONSOLIDATED FINANCIAL STATEMENTS
DECEMBER 31, 2023 AND 2022
(in thousands of Canadian dollars, except per share amounts)
Decommissioning liabilities
The Company has legal obligations associated with the retirement of pits and quarries utilized in aggregate mining operations. As a result, a provision is made for close down, restoration and environmental rehabilitation costs (which include the dismantling and demolition of infrastructure, removal of residual materials and remediation of disturbed areas) in the financial period when the related environmental disturbance occurs, based on estimated future costs using information available at the consolidated balance sheet dates. The provision is discounted using a current market-based pre-tax discount rate that reflects the average life of the obligations and the risks specific to the liability. An increase in the provision due to the passage of time is recognized as a finance cost and the provision is reduced by actual rehabilitation costs incurred. The present value of the legal obligations incurred is recognized as an inventory production cost and is included in the cost of the aggregates produced.
The provision is reviewed at each reporting date for changes to obligations, legislation or discount rates that impact estimated costs or lives of operations. Changes in the amount or timing of the underlying future cash flows or changes in the discount rate are immediately recognized as an increase or decrease in the carrying amounts of related assets and the provision.
5.13 LEASES
At inception of a contract, the Company assesses whether a contract is, or contains, a lease. A contract is, or contains, a lease if the contract conveys the right to control the use of an identified asset for a period of time in exchange for consideration.
To assess whether a contract conveys the right to control the use of an identified asset, the Company assesses whether:
The contract involves the use of an identified asset – this may be specified explicitly or implicitly and should be physically distinct or represent substantially all of the capacity of a physically distinct asset. If the supplier has a substantive substitution right, then the asset is not identified;
The Company has the right to obtain substantially all of the economic benefits from use of the asset throughout the period of use; and
The Company has the right to direct the use of the asset. The Company has this right when it has the decisionmaking rights that are most relevant to changing how and for what purpose the asset is used. In rare cases where the decision about how and for what purpose the asset is used is predetermined, the Company has the right to direct the use of the asset if either:
o The Company has the right to operate the asset; or
o The Company designed the asset in a way that predetermines how and for what purpose it will be used.
At inception or on reassessment of a contract that contains a lease component, the Company allocates the consideration in the contract to each lease component on the basis of their relative stand-alone price.
The Company recognizes a right-of-use asset and a lease liability at the lease commencement date. The right-of-use asset is initially measured at cost, which comprises the initial amount of the lease liability adjusted for any lease payments made at or before the commencement date, plus any initial direct costs incurred and an estimate of costs to dismantle and remove the underlying asset or to restore the underlying asset or the site on which it is located, less any lease incentives received.
The right-of-use asset is subsequently depreciated using the straight-line method from the commencement date to the earlier of the end of the useful life of the right-of-use asset or the end of the lease term. The estimated useful lives of right-of-use assets are determined on the same basis as those of property, plant and equipment. In addition, the right-ofuse asset is periodically reduced by impairment losses, if any, and adjusted for certain remeasurements of the lease liability.
Aecon Group Inc. 94
NOTES TO THE CONSOLIDATED FINANCIAL STATEMENTS
DECEMBER 31, 2023 AND 2022
(in thousands of Canadian dollars, except per share amounts)
The lease liability is initially measured at the present value of the lease payments that are not paid at the commencement date, discounted using the interest rate implicit in the lease or, if that rate cannot be readily determined, the Company’s incremental borrowing rate.
Lease payments included in the measurement of the lease liability comprise the following:
Fixed payments, including in-substance fixed payments;
Variable lease payments that depend on an index or a rate, initially measured using the relevant index or rate as at the commencement date;
Amounts expected to be payable under a residual value guarantee; and
The exercise price under a purchase option that the Company is reasonably certain to exercise, lease payments in an optional renewal period if the Company is reasonably certain to exercise an extension option, and penalties for early termination of a lease unless the Company is reasonably certain not to terminate early.
The lease liability is measured at amortized cost using the effective interest method. It is remeasured when there is a change in future lease payments arising from a change in the relevant index or rate, if there is a change in the Company’s estimate of the amount expected to be payable under a residual value guarantee, or if the Company changes its assessment of whether it will exercise a purchase, extension or termination option.
When the lease liability is remeasured in this way, a corresponding adjustment is made to the carrying amount of the right-of-use asset or is recorded in profit or loss if the carrying amount of the right-of-use asset has been reduced to zero.
The Company presents right-of-use assets in “property, plant and equipment” and lease liabilities in “long-term debt” in the consolidated balance sheets.
Short-term leases and leases of low-value assets
The Company has elected not to recognize right-of-use assets and lease liabilities for short-term leases of property, plant and equipment that have a lease term of 12 months or less and leases of low-value assets, such as some IT-equipment. The Company recognizes the lease payments associated with these leases as an expense on a straight-line basis over the lease term.
Nature of leased assets
The Company leases various offices, warehouses, land, equipment and vehicles. Contracts are typically made for fixed periods of one to ten years but may have extension options as described below. Lease terms are negotiated on an individual basis and contain a wide range of different terms and conditions. Leased assets may not be used as security for borrowing purposes. Some leases provide for additional payments based on changes in inflation.
Extension and termination options
Some office leases include an option to renew the lease for an additional period after the non-cancellable contract period. Where practicable, the Company seeks to include extension options in new leases to provide operational flexibility. Extension options are exercisable only by the Company and not by the lessors. The Company assesses at lease commencement whether it is reasonably certain to exercise the extension options. The Company reassesses its portfolio of leases to determine whether it is reasonably certain to exercise the options if there is a significant event or significant change in circumstances within its control. The Company considers all facts and circumstances when making this decision. The Company examines whether there is an economic incentive or penalty that would affect the decision to exercise the option, for example, whether the lease option is below market value or whether the Company has made significant investments in leasehold improvements. Where it is not reasonably certain that the lease will be extended or terminated, the Company will not recognize these options.
2023 Annual Report 95
NOTES TO THE CONSOLIDATED FINANCIAL STATEMENTS
DECEMBER 31, 2023 AND 2022
(in thousands of Canadian dollars, except per share amounts)
Variable lease payments
Some leases also require the Company to make payments that relate to the property taxes and additional services levied on the lessor and insurance payments made by the lessor; these amounts are generally determined annually.
5.14 EMPLOYEE BENEFIT PLANS
The Company recognizes the cost of retirement benefits over the periods in which employees are expected to render services in return for the benefits.
The Company sponsors defined benefit pension plans (which had their membership frozen as at January 1, 1998) and defined contribution pension plans for its salaried employees. The Company matches employee contributions to the defined contribution plans, which are based on a percentage of salaries. For the defined contribution pension plans the contributions are recognized as an employee benefit expense when they are earned.
For the defined benefit pension plans, current service costs are charged to operations as they accrue based on services rendered by employees during the year. Pension benefit obligations are determined annually by independent actuaries using management’s best estimate assumptions. The plans’ assets are measured at fair value. The present value of the defined benefit obligation is determined by discounting the estimated future cash flows using interest rates of high quality corporate bonds that have terms to maturity approximating the terms of the related pension liability. Actuarial gains and losses are recognized in other comprehensive income as they arise. Past service costs are recognized immediately in profit or loss unless the changes to the pension plan are conditional on the employees remaining in service for a specified period of time (the vesting period). In this case, the past service costs are amortized on a straight-line basis over the vesting period.
5.15 CURRENT AND DEFERRED INCOME TAXES
Current income tax is calculated on the basis of tax laws enacted or substantively enacted at the consolidated balance sheet dates in the countries where the Company operates and generates taxable income. Current tax includes adjustments to tax payable or recoverable in respect of previous periods.
Deferred income tax is provided using the asset and liability method on all temporary differences at the consolidated balance sheet dates between the tax basis of assets and liabilities and their carrying amounts for financial reporting purposes. However, deferred income taxes are not recognized if they arise from the initial recognition of goodwill. Deferred income tax is also not accounted for if it arises from the initial recognition of an asset or liability in a transaction that is not a business combination and, at the time of the transaction, affects neither the accounting profit nor taxable profit or loss.
Deferred income tax is provided on temporary differences associated with investments in subsidiaries, associates or joint ventures, except where the timing of the reversal of temporary differences can be controlled and it is probable the temporary differences will not reverse in the foreseeable future.
Deferred income tax assets are recognized only to the extent that it is probable that taxable profit will be available against which deductible temporary differences, carried forward tax credits or tax losses can be utilized.
Deferred tax is measured on an undiscounted basis at the tax rates that are expected to apply in the periods in which the asset is realized or the liability is settled, based on tax rates and tax laws enacted or substantively enacted at the consolidated balance sheet dates.
The carrying amount of deferred income tax assets is reviewed at each consolidated balance sheet date and reduced to the extent that it is no longer probable that sufficient taxable profit will be available to allow all or part of the deferred income tax asset to be utilized. To the extent that an asset not previously recognized fulfills the criteria for recognition, a deferred income tax asset is recorded.
Current and deferred taxes relating to items recognized directly in equity and other comprehensive income are recognized in equity and other comprehensive income and not in profit or loss.
Aecon Group Inc. 96
NOTES TO THE CONSOLIDATED FINANCIAL STATEMENTS
DECEMBER 31, 2023 AND 2022
(in thousands of Canadian dollars, except per share amounts)
Current income tax assets and liabilities or deferred income tax assets and liabilities are offset, if a legally enforceable right exists to offset current tax assets against current tax liabilities and the income taxes relate to the same taxable entity and the same tax authority.
5.16 STOCK-BASED COMPENSATION
The Company has stock-based compensation plans, as described in Note 25, “Capital Stock.” All transactions involving stock-based payments are recognized as an expense over the vesting period.
Equity-settled stock-based payment transactions, such as stock option awards and the Company’s long-term incentive plan, are measured at the grant date fair value of employee services received in exchange for the grant of options or share awards and for non-employee transactions, at the fair value of the goods or services received at the date on which the entity recognizes the goods or services. The total amount of the expense recognized in profit or loss is determined by reference to the fair value of the share awards or options granted, which factors in the number of options expected to vest. Equity-settled share-based payment transactions are not remeasured once the grant date fair value has been determined, except in cases where the stock-based payment is linked to non-market related performance conditions.
Cash-settled stock-based payment transactions are measured at the fair value of the liability. The liability is remeasured at each consolidated balance sheet date and at the date of settlement, with changes in fair value recognized in profit or loss.
5.17 EARNINGS PER SHARE
Basic earnings per share
Basic earnings per share is determined by dividing profit attributable to shareholders of the Company, excluding, if applicable, preferred dividends after-tax, amortization of discounts and premiums on issuance, premiums on repurchases, inducements to convert relating to convertible debentures and any costs of servicing equity other than common shares, by the weighted average number of common shares outstanding during the year.
Diluted earnings per share
Diluted earnings per share adjusts the figures used in the determination of basic earnings per share to take into account the after income tax effect of interest and other financing costs associated with dilutive potential common shares and the weighted average number of shares assumed to have been issued in relation to dilutive potential common shares.
Dilutive potential common shares result from issuances of stock options and convertible debentures.
5.18 FOREIGN CURRENCY TRANSLATION
Functional and presentation currency
Items included in the financial statements of each of the Company’s entities are measured using the currency of the primary economic environment in which the entity operates (“the functional currency”). The consolidated financial statements are presented in thousands of Canadian dollars, which is the Company’s presentation currency.
Transactions
Foreign currency transactions are translated into the functional currency using the exchange rates prevailing at the dates of the transactions or valuation where items are remeasured. Foreign exchange gains and losses resulting from the settlement of such transactions and resulting from the translation at year-end exchange rates of monetary assets and liabilities denominated in foreign currencies are recognized in profit or loss, except when deferred in other comprehensive income for qualifying cash flow hedges and for qualifying net investment hedges.
All foreign exchange gains and losses presented in profit or loss are presented within other income. Changes in the fair value of monetary securities denominated in a foreign currency classified as FVTOCI are separated between translation differences resulting from changes in the amortized cost of the security and other changes in the carrying amount of the security. Translation differences related to changes in amortized cost are recognized in profit or loss, and other changes in the carrying amount are recognized in other comprehensive income.
2023 Annual Report 97
NOTES TO THE CONSOLIDATED FINANCIAL STATEMENTS
DECEMBER 31, 2023 AND 2022
(in thousands of Canadian dollars, except per share amounts)
Translation differences on non-monetary financial assets and liabilities such as equities held at fair value through profit or loss are recognized in profit or loss as part of the fair value gain or loss. Translation differences on non-monetary financial assets, such as equities classified as FVTOCI, are included in other comprehensive income.
Translation of foreign entities
Assets and liabilities are translated from the functional currency to the presentation currency at the closing rate at the end of the reporting period. The consolidated statements of income are translated at exchange rates at the dates of the transactions or at the average rate if it approximates the actual rates. All resulting exchange differences are recognized in other comprehensive income.
On disposal, or partial disposal, of a foreign entity, or repatriation of the net investment in a foreign entity, resulting in a loss of control, significant influence or joint control, the cumulative translation account balance recognized in equity relating to that particular foreign entity is recognized in profit or loss as part of the gain or loss on sale. On a partial disposition of a subsidiary that does not result in a loss of control, the amounts are reallocated to the non-controlling interest in the foreign operation based on its proportionate share of the cumulative amounts recognized in AOCI. On partial dispositions of jointly controlled foreign entities or associates, the proportionate share of translation differences previously recognized in AOCI is reclassified to profit or loss
6. NEW ACCOUNTING STANDARDS
The following amendments to standards and interpretations became effective for the annual periods beginning on or after January 1, 2023. The application of these amendments and interpretations had no significant impact on the Company’s consolidated financial position or results of operations.
Disclosure of Accounting Policies (Amendments to IAS 1)
The amendments to IAS 1 require an entity to disclose its material accounting policies instead of its significant accounting policies. The amendments clarify that accounting policy information is material if users of an entity’s financial statements would need it to understand other material information in the financial statements.
Definition of Accounting Estimates (Amendments to IAS 8, Accounting Policies, Changes in Accounting Estimates and Errors)
The amendments to IAS 8 provide guidance to assist entities in distinguishing between accounting policies and accounting estimates. The amendments replace the definition of a change in accounting estimates with the definition of accounting estimates. Under the new definition, accounting estimates are monetary amounts in financial statements that are subject to measurement uncertainty. The amendments also clarify that a change in accounting estimate that results from new information or new developments is not the correction of an error. In addition, the effects of a change in an input or a measurement technique used to develop an accounting estimate are changes in accounting estimates if they do not result from the correction of prior period errors.
Deferred Tax on Assets and Liabilities Arising From Lease and Decommissioning Obligation Transactions (Amendments to IAS 12, Income Taxes)
The amendments to IAS 12 provide clarifications in accounting for deferred tax on certain transactions such as leases and decommissioning obligations. The amendments clarify that the initial recognition exemption does not apply to transactions such as leases and decommissioning obligations. As a result, entities may need to recognize both a deferred tax asset and a deferred tax liability for temporary differences arising on initial recognition of leases and decommissioning obligations.
IFRS 17, Insurance Contracts
IFRS 17 establishes the principles for the recognition, measurement, presentation, and disclosure of insurance contracts to ensure that an entity provides relevant and reliable information to the users of the financial statements as a basis to assess the effect that insurance contracts have on the entity’s financial statements. In certain cases, financial guarantee and performance guarantee contracts may be considered insurance contracts for the purposes of IFRS 17 if significant insurance risk is transferred from another party to the entity and the contract involves potential compensation to the other party for an adverse event. IFRS 17 superseded IFRS 4, “Insurance Contracts” and the related interpretations.
Aecon Group Inc. 98
NOTES TO THE CONSOLIDATED FINANCIAL STATEMENTS
DECEMBER 31, 2023 AND 2022
(in
thousands of Canadian dollars, except per share amounts)
7. FUTURE ACCOUNTING CHANGES
Classification of Liabilities as Current or Non-current (Amendments to IAS 1, Presentation of Financial Statements)
The amendments to IAS 1 provide a more general approach to the classification of liabilities based on the contractual arrangements in place at the reporting date. The amendments clarify that the classification of liabilities as current or noncurrent should be based on rights that are in existence at the end of the reporting period and align the wording in all affected paragraphs to refer to the right to defer settlement by at least twelve months and make explicit that only rights in place at the end of the reporting period should affect the classification of a liability. The amendments are effective for annual reporting periods beginning on or after January 1, 2024 and are to be applied retrospectively. Upon adoption of the amendments to IAS 1, the Preferred Shares of Aecon Utilities at December 31, 2023 will be reclassified from non-current liabilities to current liabilities and bank indebtedness at December 31, 2023 will be reclassified from current liabilities to non-current liabilities in the consolidated balance sheets.
Non-current Liabilities with Covenants (Amendments to IAS 1)
The amendments to IAS 1 specify that only covenants with which an entity is required to comply on or before the reporting date affect the classification of a liability as current or non-current. In addition, an entity has to disclose information in the notes that enables users of financial statements to understand the risk that non-current liabilities with covenants could become repayable within twelve months. The amendments are effective for annual reporting periods beginning on or after January 1, 2024 and are to be applied retrospectively.
Lease Liability Measurement in a Sale and Leaseback transaction (Amendments to IFRS 16, Leases)
The amendments to IFRS 16 clarify how a seller-lessee should apply the subsequent measurement requirements in IFRS 16 to the lease liability that arises in a sale and leaseback transaction. The amendments specify that the seller-lessee does not recognize any amount of the gain or loss that relates to the right of use it retains when lease liabilities are subsequently measured. However, the new requirements do not prevent a seller-lessee from recognizing, in profit or loss, any gain or loss that relates to the partial or full termination of a lease. The amendments are effective for annual periods beginning on or after January 1, 2024 and are to be applied retrospectively.
Other than as noted above, the Company is still assessing the impact of adopting these amendments on its future financial statements.
8. CASH AND CASH EQUIVALENTS, AND RESTRICTED CASH
Cash and cash equivalents on deposit in the bank accounts of joint operations cannot be accessed directly by the Company.
Restricted cash is cash held by Skyport. This cash cannot be used by the Company other than to finance the Bermuda International Airport Redevelopment Project. At December 31, 2023, the Company’s 50.1% interest in Skyport is reported using the equity method of accounting (see Note 12, “Projects Accounted For Using The Equity Method”).
December 31 December 31 2023 2022 Cash balances excluding joint operations $ 258,734 $ 19,815 Cash balances of joint operations 387,050 357,397 $ 645,784 $ 377,212 Restricted cash $ - $ 107,033 $ - $ 107,033
2023 Annual Report 99
NOTES TO THE CONSOLIDATED FINANCIAL STATEMENTS
DECEMBER 31, 2023 AND 2022
(in thousands of Canadian dollars, except per share amounts)
9. TRADE AND OTHER RECEIVABLES
A reconciliation of the beginning and ending carrying amounts of the Company’s allowance
credit losses is as follows:
December 31 December 31 2023 2022 Trade receivables $ 601,467 $ 628,365 Holdbacks receivable 341,690 341,298 Other 27,447 56,077 Allowance for expected credit losses (848) (1,362) 969,756 1,024,378 Amounts receivable beyond one year $ 13,198 $ 109,395
December 31 December 31 2023 2022 Balance - beginning of year $ (1,362) $ (1,145) Additional amounts provided for during the year (353) (631) Trade receivables written off during the year 554 36 Amounts recovered 49 378 Disposal of subsidiaries 264Balance - end of year $ (848) $ (1,362) Aecon Group Inc. 100
for expected
NOTES TO THE CONSOLIDATED FINANCIAL STATEMENTS
DECEMBER 31, 2023 AND 2022
(in
thousands of Canadian dollars, except per share amounts)
10. UNBILLED REVENUE AND DEFERRED REVENUE
A reconciliation of the beginning and ending carrying amounts of unbilled revenue and deferred revenue is as follows:
In addition, revenue earned during the year ended December 31, 2023, from performance obligations satisfied in previous periods, decreased by $187,298 (2022 - $120,060). These amounts primarily related to the impact of adjustments to forecasted revenue and cost.
Revenue recognized in 2023 from deferred revenue balances existing at the beginning of the year totaled $189,252 (2022 - $206,305).
11. INVENTORIES
For the year ended For the year ended December 31, 2023 December 31, 2022 Unbilled revenue Deferred revenue Unbilled revenue Deferred revenue Balance outstanding - beginning of year $ 685,258 $ (386,560) $585,974 $ (430,985) Revenue earned in the year 4,441,972 201,870 4,489,079 207,371 Billings in the year (4,394,165) (344,630) (4,389,873) (162,946) Sale of ATE (See Note 27 "Other Income") (13,822) 10,236 -Changes due to business combinations - - 78Balance outstanding - end of year $ 719,243 $ (519,084) $685,258 $ (386,560)
December 31 December 31 2023 2022 Raw materials and supplies $ 15,100 $ 16,761 Finished goods 5,715 20,859 $ 20,815 $ 37,620 2023 Annual Report 101
NOTES TO THE CONSOLIDATED FINANCIAL STATEMENTS
DECEMBER 31, 2023 AND 2022
(in
thousands of Canadian dollars, except per share amounts)
12. PROJECTS ACCOUNTED FOR USING THE EQUITY METHOD
The Company performs some construction and concession related projects through non-consolidated entities. The Company’s participation in these entities is conducted through joint ventures and associates and is accounted for using the equity method. The Company’s joint ventures and associates are private entities and there is no quoted market price available for their shares.
The summarized financial information below reflects the Company’s share of the amounts presented in the financial statements of joint ventures and associates:
December 31, 2023 December 31, 2022 Joint Ventures Associates Total Joint Ventures Associates Total Cash and cash equivalents $ 37,719 $ - $ 37,719 $ 59,236 $ - $ 59,236 Other current assets 465,510 - 465,510 329,360 - 329,360 Total current assets 503,229 - 503,229 388,596 - 388,596 Non-current assets 1,301,771 - 1,301,771 961,538 - 961,538 Total assets 1,805,000 - 1,805,000 1,350,134 - 1,350,134 Trade and other payables and provisions 435,100 - 435,100 365,108 45 365,153 Total current liabilities 435,100 - 435,100 365,108 45 365,153 Non-current financial liabilities 1,132,052 - 1,132,052 871,630 - 871,630 Other non-current liabilities 5,096 - 5,096 5,480 - 5,480 Total non-current liabilities 1,137,148 - 1,137,148 877,110 - 877,110 Total liabilities 1,572,248 - 1,572,248 1,242,218 45 1,242,263 Net assets (liabilities) $ 232,752 $ - $ 232,752 $ 107,916 $ (45) $ 107,871 For the year ended December 31, 2023 December 31, 2022 Joint Ventures Associates Total Joint Ventures Associates Total Revenue $ 788,596 $ - $ 788,596 $ 663,730 $ - $ 663,730 Depreciation and amortization (4,015) - (4,015) (624) - (624) Other costs and expenses (724,133) 45 (724,088) (606,297) 550 (605,747) Operating profit 60,448 45 60,493 56,809 550 57,359 Finance cost (37,211) - (37,211) (38,315) - (38,315) Income tax expense (4,535) - (4,535) (1,341) - (1,341) Profit for the year 18,702 45 18,747 17,153 550 17,703 Other comprehensive income (loss) (12,745) - (12,745) 24,057 - 24,057 Total comprehensive income $ 5,957 $ 45 $ 6,002 $ 41,210 $ 550 $ 41,760 Aecon Group Inc. 102
NOTES TO THE CONSOLIDATED FINANCIAL STATEMENTS
DECEMBER 31, 2023 AND 2022
(in
thousands of Canadian dollars, except per share amounts)
The movement in the investment in projects accounted for using the equity method is as follows:
The following joint ventures and associates are included in projects accounted for using the equity method:
On September 20, 2023, the Company completed the sale of a 49.9% interest in Skyport to Connor, Clark & Lunn Infrastructure (“CC&L Infrastructure”). Subsequent to this transaction, the Company holds a 50.1% interest in Skyport, the concessionaire responsible for the Bermuda International Airport’s operations, maintenance and commercial functions, and the entity that will manage and coordinate the overall delivery of the Bermuda International Airport Redevelopment Project over a 30-year concession term that commenced in 2017. Prior to the closing of the transaction with CC&L Infrastructure, the Company’s participation in Skyport was 100% consolidated in the Concessions segment and, as such, was accounted for in the consolidated financial statements by reflecting, line by line, the assets, liabilities, revenue and expenses of Skyport. Subsequent to the closing of the sale of a 49.9% interest in Skyport, Aecon’s remaining 50.1% interest in the Skyport concession joint venture is accounted for using the equity method (see Note 27 “Other Income”).
Aecon’s share of the results of the Yellowline Asphalt Products Ltd. joint venture was reported in projects accounted for using the equity method until its sale in the second quarter of 2023 as part of the sale of the ATE business (see Note 27 “Other Income”).
Projects accounted for using the equity method include various concession joint ventures or project special purpose vehicles (“SPVs”) as listed above. However, the construction activities related to these concessions and project SPVs are classified as joint operations which are accounted for in the consolidated financial statements by reflecting, line by line, the Company's share of the assets held jointly, liabilities incurred jointly, and revenue and expenses arising from the joint operations.
For the year ended For the year ended December 31 December 31 2023 2022 Projects accounted for using the equity method - at January 1 $ 107,871 $ 69,294 Share of profit for the year 18,747 17,703 Share of other comprehensive income (loss) for the year (12,745) 24,057 Disposal of joint venture (see Note 27 “Other Income” for the sale of ATE) (23,796)Commencement of equity method accounting for the Company’s 50.1% interest in Skyport 156,531Distributions from projects accounted for using the equity method (13,856) (3,183) Projects accounted for using the equity method - at December 31 $ 232,752 $ 107,871
Name Ownership interest Joint Venture or Associate Years included Waterloo Light Rail Transit Concessionaire 10%Joint Venture 2023, 2022 Eglinton Crosstown Light Rail Transit Concessionaire 25%Joint Venture 2023, 2022 Finch West Light Rail Transit Concessionaire 33%Joint Venture 2023, 2022 Gordie Howe International Bridge Concessionaire 20%Joint Venture 2023, 2022 Highway 401 Expansion Project SPV 50%Joint Venture 2023, 2022 Pattullo Bridge Replacement Project SPV 50%Joint Venture 2023, 2022 Eglinton Crosstown West Extension Advance Tunnel Project SPV 40%Joint Venture 2023, 2022 ONxpress Operations Inc. 28%Joint Venture 2023, 2022 Yellowline Asphalt Products Ltd. 50%Joint Venture 2023, 2022 Bermuda International Airport Concessionaire ("Skyport") 50.1%Joint Venture 2023
2023 Annual Report 103
NOTES TO THE CONSOLIDATED FINANCIAL STATEMENTS
DECEMBER 31, 2023 AND 2022
(in thousands of Canadian dollars, except per share amounts)
13. PROPERTY, PLANT AND EQUIPMENT
(a) Includes disposals of property, plant and equipment related to the sales of ATE and Skyport. See Note 27 “Other Income” for further information on the sales of ATE and a 49.9% interest in Skyport. Subsequent to the sale of a 49.9% interest in Skyport in the third quarter of 2023, Aecon’s remaining 50.1% interest in the Skyport concession joint venture is accounted for using the equity method (see Note 12, “Projects Accounted For Using The Equity Method”).
(b) Depreciation of land relates to leases of land.
Land Buildings and leasehold improvements Aggregate properties Machinery and construction equipment Office equipment, furniture and fixtures, and computer hardware Vehicles Total Cost Balance at January 1, 2023 $52,283 $ 178,749 $ 60,499 $ 388,230 $ 43,464 $ 79,375 $ 802,600 Additions - purchased assets 120 1,784 1,986 8,484 2,462 3,273 18,109 Additions - right-of-use assets 2,537 7,346 - 4,577 - 13,821 28,281 Disposals (a) (15,264) (38,424) (40,613) (174,291) (7,983) (25,768) (302,343) Foreign currency translation adjustments - (71) - (225) (2) (55) (353) Balance at December 31, 2023 $ 39,676 $ 149,384 $ 21,872 $ 226,775 $ 37,941 $ 70,646 $ 546,294 Accumulated depreciation and impairment Balance at January 1, 2023 1,082 81,581 21,456 213,276 39,163 50,941 407,499 Depreciation - purchased assets - 4,803 1,378 14,265 2,226 924 23,596 Depreciation - right-of-use assets (b) 930 8,299 - 11,482 - 8,680 29,391 Disposals (a) (198) (20,413) (13,105) (106,244) (7,529) (18,446) (165,935) Foreign currency translation adjustments - (51) - (80) (1) (24) (156) Balance at December 31, 2023 $1,814 $ 74,219 $ 9,729 $ 132,699 $ 33,859 $ 42,075 $ 294,395 Net book value at December 31, 2023 $ 37,862 $ 75,165 $ 12,143 $ 94,076 $ 4,082 $ 28,571 $ 251,899 Net book value at January 1, 2023 $ 51,201 $ 97,168 $ 39,043 $ 174,954 $ 4,301 $ 28,434 $ 395,101 Net book value of right-of-use assets included in property, plant & equipment at January 1, 2023 $964 $ 33,518 $ 75 $ 86,527 $ - $ 25,833 $ 146,917 Net book value of right-of-use assets included in property, plant & equipment at December 31, 2023 $2,571 $ 29,306 $ 75 $ 35,199 $ - $ 23,959 $ 91,110
Aecon Group Inc. 104
NOTES TO THE CONSOLIDATED FINANCIAL STATEMENTS
DECEMBER 31, 2023 AND 2022
(in
thousands of Canadian dollars, except per share amounts)
Land Buildings and leasehold improvements Aggregate properties Machinery and construction equipment Office equipment, furniture and fixtures, and computer hardware Vehicles Total Cost Balance at January 1, 2022 $ 53,343 $ 173,513 $ 57,975 $ 358,761 $ 40,525 $ 71,163 $ 755,280 Additions - purchased assets 80 699 4,788 23,276 2,994 871 32,708 Additions - right of use assets 365 7,942 - 26,343 - 12,547 47,197 Additions - business combination - - - 15 - 906 921 Disposals (1,505) (3,571) (2,264) (20,638) (132) (6,215) (34,325) Foreign currency translation adjustments - 166 - 473 77 103 819 Balance as at December 31, 2022 $ 52,283 $ 178,749 $ 60,499 $ 388,230 $ 43,464 $ 79,375 $ 802,600 Accumulated depreciation and impairment Balance at January 1, 2022 836 70,638 22,210 199,091 36,959 46,040 375,774 Depreciation - purchased assets - 5,765 1,510 15,751 2,280 1,023 26,329 Depreciation - right of use assets (a) 246 7,811 - 16,989 - 9,865 34,911 Disposals - (2,726) (2,264) (18,744) (132) (6,052) (29,918) Foreign currency translation adjustments - 93 - 189 56 65 403 Balance as at December 31, 2022 $ 1,082 $ 81,581 $ 21,456 $ 213,276 $ 39,163 $ 50,941 $ 407,499 Net book value as at December 31, 2022 $ 51,201 $ 97,168 $ 39,043 $ 174,954 $ 4,301 $ 28,434 $ 395,101 Net book value as at January 1, 2022 $ 52,507 $ 102,875 $ 35,765 $ 159,670 $ 3,566 $ 25,123 $ 379,506 Net book value of right-of-use assets included in property, plant & equipment as at January 1, 2022 $ 845 $ 33,328 $ 75 $ 81,510 $ - $ 22,965 $ 138,723 Net book value of right-of-use assets included in property, plant & equipment as at December 31, 2022 $ 964 $ 33,518 $ 75 $ 86,527 $ - $ 25,833 $ 146,917 (a) Depreciation of land relates to leases of land. 2023 Annual Report 105
NOTES TO THE CONSOLIDATED FINANCIAL STATEMENTS
DECEMBER 31, 2023 AND 2022
(in
thousands of Canadian dollars, except per share amounts)
14. INTANGIBLE ASSETS
Includes disposals of goodwill related to the sale of ATE and of intangible assets related to the sale of Skyport. See Note 27 “Other Income” for further information on the sales of ATE and a 49.9% interest in Skyport. Subsequent to the sale of a 49.9% interest in Skyport in the third quarter of 2023, Aecon’s remaining 50.1% interest in Skyport is accounted for using the equity method (see Note 12, “Projects Accounted For Using The Equity Method”).
Concession Rights Goodwill Licences, software and other rights Total Cost Balance at January 1, 2023 $ 668,168 $108,102 $ 112,529 $ 888,799 Additions Separately acquired or constructed - 459 5,481 5,940 Disposals (a) (666,988) (2,991) (11,993) (681,972) Foreign currency translation adjustments (1,180) (9) 7 (1,182) Balance at December 31, 2023 $ - $105,561 $ 106,024 $ 211,585 Accumulated amortization and impairment Balance at January 1, 2023 145,293 - 81,153 226,446 Amortization 15,633 - 10,467 26,100 Disposals (a) (160,747) - (3,048) (163,795) Foreign currency translation adjustments (179) - - (179) Balance at December 31, 2023 $ - $- $ 88,572 $ 88,572 Balance at December 31, 2023 $ - $ 105,561 $ 17,452 $ 123,013 Net book value at January 1, 2023 $ 522,875 $ 108,102 $ 31,376 $ 662,353
Concession Rights Goodwill Licences, software and other rights Total Cost Balance as at January 1, 2022 $ 625,445 104,855 $ 101,885 $ 832,185 Additions Separately acquired or constructed - - 8,604 8,604 Business combination - 3,247 2,335 5,582 Disposals - (601) (601) Foreign currency translation adjustments 42,723 - 306 43,029 Balance as at December 31, 2022 $ 668,168 $108,102 $ 112,529 $ 888,799 Accumulated amortization and impairment Balance as at January 1, 2022 117,274 - 67,962 185,236 Amortization 19,997 - 12,916 32,913 Disposals - - (601) (601) Foreign currency translation adjustments 8,022 - 876 8,898 Balance as at December 31, 2022 $ 145,293 $- $ 81,153 $ 226,446 Net book value as at December 31, 2022 $ 522,875 $ 108,102 $ 31,376 $ 662,353 Net book value as at January 1, 2022 $ 508,171 $ 104,855 $ 33,923 $ 646,949 Aecon Group Inc. 106
(a)
NOTES TO THE CONSOLIDATED FINANCIAL STATEMENTS
DECEMBER 31, 2023 AND 2022
(in
thousands of Canadian dollars, except per share amounts)
Concession rights – Bermuda International Airport Redevelopment Project
At December 31, 2023, the Company holds a 50.1% (2022- 100%) interest in Bermuda Skyport Corporation Limited (“Skyport”), a Bermudian company undertaking the L.F. Wade International Redevelopment Project in Bermuda (“Bermuda International Airport Redevelopment Project”). See Note 27, “Other Income” for details of the Company’s sale of 49.9% interest in Skyport in 2023.
Skyport’s main operations consist of:
(a) managing and operating the existing L.F Wade International Airport (the “Existing Bermuda Airport”); and
(b) managing the development, financing, construction, operation and maintenance of the new airport terminal and associated infrastructure (“New Airport Terminal”) under a 30-year concession arrangement.
At December 31, 2023, the concession right for the New Airport Terminal, representing the costs to construct the New Airport Terminal, had a carrying amount of $nil (2022- $522,875) included in intangible assets in the Company’s consolidated balance sheets. At December 31, 2023, the Company’s 50.1% retained interest in Skyport is accounted for using the equity method (see Note 12, “Projects Accounted For Using The Equity Method”).
Amortization of intangible assets is included in the depreciation and amortization expense line item on the consolidated statements of income.
Goodwill
The following CGUs or groups of CGUs have significant amounts of goodwill allocated to them for the purposes of impairment testing:
The recoverable amounts of the above listed CGUs were determined based on fair value less costs to sell calculations. Fair value less costs to sell calculations use post-tax cash flow projections expected to be generated by the CGU based on financial budgets approved by management covering a two-year period. For the CGUs noted above, cash flows beyond the two-year period were extrapolated as at December 31, 2023 using a growth rate of 2% (2022 – 2%), which does not exceed the long-term average growth rate for the business in which the CGUs operate. The discount rate applied to cash flow projections as at December 31, 2023 was 10.25% to 12% (2022 – 10.0%) based on the Company’s post-tax weighted average cost of capital. Detailed sensitivity analyses were conducted to assess the impact of changes in growth rates, costs of capital and cash flows on the recoverable amount, which has not indicated that the carrying amount of the CGU exceeds the recoverable amount. Budgeted cash flows were determined by management based on the Company’s past performance, backlog currently on hand and future revenue prospects.
December 31 December 31 2023 2022 CGUs: Utilities $ 62,824 $ 62,374 Industrial 30,633 30,633 Civil 12,104 15,095 $ 105,561 $ 108,102
2023 Annual Report 107
NOTES TO THE CONSOLIDATED FINANCIAL STATEMENTS
DECEMBER 31, 2023 AND 2022
(in
thousands of Canadian dollars, except per share amounts)
15. BANK INDEBTEDNESS
December 31
December 31 2023 2022
On October 24, 2023, following the issue of Preferred Shares by Aecon Utilities, Aecon replaced its $600,000 committed credit facility with a $450,000 committed credit facility for Aecon and a new separate $400,000 committed credit facility for Aecon Utilities. At December 31, 2023, these two committed revolving credit facilities totalled $850,000 (December 31, 2022 - $600,000). Both credit facilities mature on October 24, 2027. The Company also has uncommitted demand letter of credit facilities of $201,000 (December 31, 2022 - $201,000) from Canadian banks and $43,878 (€30,000) from a Spanish bank (December 31, 2022 - $43,374 (€30,000)).
Bank indebtedness representing borrowings on the Aecon and Aecon Utilities revolving credit facilities at December 31, 2023 were $nil and $111,700, respectively- (December 31, 2022 - $120,979 and $nil, respectively). At December 31, letters of credit amounting to $4,971 and $540, respectively, were issued against Aecon and Aecon Utilities revolving credit facilities (December 31, 2022 - $3,234 and $nil, respectively). Letters of credit amounting to $22,169 and $nil, respectively, were issued against Aecon and Aecon Utilities uncommitted demand letter of credit facilities (December 31, 2022 - $8,151 and $nil, respectively). Cash drawings under the two revolving credit facilities bear interest at rates between prime and prime plus 1.85% per annum. Letters of credit drawn on the revolving credit facilities reduce the amount available-for-use under the facilities.
The Company also maintains an additional performance security guarantee facility of $900,000 (December 31, 2022$900,000) to support letters of credit provided by Export Development Canada of which $622,392 was utilized at December 31, 2023 (December 31, 2022 - $563,444). On June 30, 2023, the maturity date of this performance security guarantee facility was extended to June 30, 2025.
16. TRADE AND OTHER PAYABLES
Bank indebtedness $ 111,700 $ 120,979 $ 111,700 $ 120,979
December 31 December 31 2023 2022 Trade payables and accrued liabilities $ 834,005 $ 901,855 Holdbacks payable 183,831 162,193 $ 1,017,836 $ 1,064,048 Amounts payable beyond one year $ - $ 2,531 Aecon Group Inc. 108
NOTES TO THE CONSOLIDATED FINANCIAL STATEMENTS
DECEMBER 31, 2023 AND 2022
(in
thousands of Canadian dollars, except per share amounts)
17. PROVISIONS
(a) Contract related obligations are made up of contract warranty obligations, litigation risks, and onerous contracts relating to construction operations. Contract warranty obligations relate to warranties provided by the Company in respect of its construction contracts. If not used during the warranty period, these amounts will be reversed into income. Warranty periods range from one to seven years.
(b) Asset decommissioning costs relate to future legal and constructive obligations associated with the retirement of pits and quarries engaged in aggregate mining operations in Ontario and Alberta. Decommissioning obligations are expected to be settled between 2030 and 2055 at which point the amount of the liability will reverse. A 2% inflation factor has been applied to obtain the future value of the decommissioning costs, which has been discounted at a rate of 5.2% to obtain the present value of the obligation.
(c) Tax assessments include provisions for specific income tax exposures faced by the Company in Canadian and foreign jurisdictions. Although final federal and provincial reassessments have not yet been issued for certain years, the Company believes that it has adequate provisions to cover the ultimate outcome of this and other tax reassessments.
Contract related obligations Asset decommissioning costs Tax assessments Other Total (a) (b) (c) Balance at January 1, 2023 $ 3,641 $ 5,666 $ 10,164 $ 1,426 $ 20,897 Additions made 27,903 287 - 3,911 32,101 Amounts used (953) (431) (6,620) (3,172) (11,176) Disposals (1,044) (1,782) - - (2,826) Other changes 14 236 - - 250 Balance at December 31, 2023 $ 29,561 $ 3,976 $ 3,544 $ 2,165 $ 39,246 Reported as: Current 29,561 - 3,544 2,165 35,270 Non-current - 3,976 - - 3,976 $ 29,561 $ 3,976 $ 3,544 $ 2,165 $ 39,246 2023 Annual Report 109
NOTES TO THE CONSOLIDATED FINANCIAL STATEMENTS
DECEMBER 31, 2023 AND 2022
(in
thousands of Canadian dollars, except per share amounts)
18. LONG-TERM DEBT AND NON-RECOURSE PROJECT DEBT
LONG-TERM DEBT
The following describes the components of long-term debt:
(a) As at December 31, 2023, leases of $120,735 (December 31, 2022 - $170,959) bore interest at fixed rates averaging 4.62% (December 31, 2022 – 3.52%) per annum, with specific equipment provided as security.
(b) As at December 31, 2023, equipment and other loans of $28,643 (December 31, 2022 - $59,243) bore interest at fixed rates averaging 4.10% (December 31, 2022 – 3.08%) per annum, with specific equipment provided as security.
The weighted average interest rate on total long-term debt outstanding (excluding convertible debentures and nonrecourse project debt) as at December 31, 2023 was 4.52% (December 31, 2022 – 3.41%).
Expenses relating to short-term leases and leases of low-value assets recognized in the statement of income for the year ended December 31, 2023 was $94,570 (2022 - $95,105).
Variable lease payments of $1,219 related to property taxes levied on lessors and not included in the measurement of lease liabilities were recognized in the statement of income during the year ended December 31, 2023 (2022 - $1,681).
Total cash outflow related to leases in 2023 was $44,762 (2022 – $61,703).
Refer to Note 13, “Property, plant and equipment” for further details of additions to right-of-use assets and depreciation charged on right-of-use assets during the year ended December 31, 2023.
Refer to Note 28, “Finance cost” for further details of interest on lease liabilities recognized during the year ended December 31, 2023.
Refer to Note 31, “Financial instruments” for contractual maturities of lease liabilities as at December 31, 2023.
Lease extension and termination options are included in a number of property and equipment leases across the Company. As at December 31, 2023, potential future cash outflow of $19,848 (December 31, 2022 - $25,568) related to these extension and termination options are not included in the lease liability because it is not reasonably certain that the leases will be extended (or not terminated).
December 31 December 31 2023 2022 Long-term debt: Leases $ 120,735 $ 170,959 Equipment and other loans 28,643 59,243 Total long-term debt $ 149,378 $ 230,202 Reported as: Current liabilities: Current portion of long-term debt $ 42,608 $ 56,564 Non-current liabilities: Long-term debt 106,770 173,638 $ 149,378 $ 230,202
Aecon Group Inc. 110
NOTES TO THE CONSOLIDATED FINANCIAL STATEMENTS
DECEMBER 31, 2023 AND 2022
(in thousands of Canadian dollars, except per share amounts)
As at December 31, 2023, potential future cash outflow of $4,442 (December 31, 2022 - $6,836) related to variable lease payments for property taxes and/or insurance payments made by lessors have not been reflected in the measurement of lease liabilities. These variable lease payments are recognized in the statement of income in the period in which those payments occur.
NON-RECOURSE PROJECT DEBT
(a) Non-recourse project debt represents the debt of Skyport. Included in the Company’s consolidated balance sheet at December 31, 2022 is debt, net of transaction costs, of $379,001 (US$279,829). At December 31, 2023, the Company’s 50.1% interest in the Skyport concession joint venture is accounted for using the equity method (see Note 12, “Projects Accounted For Using The Equity Method”). This debt is secured by the assets of Skyport and is without recourse to the Company. The financing is denominated in US dollars and bears interest at 5.90% annually.
The movements in net debt for 2023 and 2022 are presented below:
December 31 December 31 2023 2022 Non-recourse project debt: Bermuda International Airport Redevelopment Project financing (a) $ - $ 379,001 Total non-recourse project debt $ - $ 379,001 Reported as: Current liabilities: Current portion of non-recourse project debt $ - $ 3,347 Non-current liabilities: Non-recourse project debt - $ 375,654 $ - $ 379,001
Cash Bank indebtedness Long-term debt Convertible debentures Non-recourse project debt Preferred Shares of Aecon Utilities Balance as at January 1, 2023 $ 377,212 $ 120,979 $ 230,202 $ 178,878 $379,001 $Cash flows 277,278 (9,279) (54,309) (183,998) (3,355) 154,640 Foreign exchange adjustments (1,365) (52) - (655)Non-cash lease additions and modifications - 38,176 - -Sale of ATE (7,341) (64,639) - -Sale of 49.9% interest in Skyport (see Note 12 “Projects Accounted For Using The Equity Method”) - - - - (373,609)Interest/dividend accretion and other non-cash movements - - 5,120 (1,382) 2,470 Balance as at December 31, 2023 $ 645,784 111,700 $ 149,378 $ - $ - $ 157,110 Cash Bank indebtedness Long-term debt Convertible debentures Non-recourse project debt Balance as at January 1, 2022 $ 532,681 $ 23,305 $ 224,895 $ 173,898 $357,537 Cash flows (160,622) 97,674 (62,067) - (3,002) Foreign exchange adjustments 5,153 - 122 - 24,273 Non-cash lease additions - - 66,553 -Interest accretion and other non-cash movements - - 699 4,980 193 Balance as at December 31, 2022 $ 377,212 120,979 $ 230,202 $ 178,878 $ 379,001 2023 Annual Report 111--
Net debt reconciliation
NOTES TO THE CONSOLIDATED FINANCIAL STATEMENTS
DECEMBER 31, 2023 AND 2022
(in
thousands of Canadian dollars, except per share amounts)
19. CONVERTIBLE DEBENTURES
debentures consist of:
On September 26, 2018, the Company issued $160,000 of unsecured subordinated convertible debentures maturing December 31, 2023 and bearing interest at 5.0% per annum payable on a semi-annual basis (the “5.0% Debentures”). On October 1, 2018, an additional $24,000 of debentures were issued pursuant to the exercise of the over-allotment option granted to the syndicate of underwriters, bringing the total aggregate gross proceeds from the offering to $184,000.
In 2023, 5.0% Debentures with a face value of $2 were converted at $23.21 per share by the holders into 86 common shares. On December 29, 2023, the remaining 5.0% Debentures were redeemed for a total principal amount of $183,998 plus accrued and unpaid interest of $781.
Finance cost associated with the 5.0% Debentures consists of:
subordinated
December 31 December 31 2023 2022 Debt component: Debenture maturing on December 31, 2023 - 5.0% Debentures - 178,878 Total convertible debentures $ - $ 178,878 Reported as: Current liabilities: Convertible debentures - 178,878 $ - $ 178,878 December 31 December 31 2023 2022 Equity component: Debenture maturing on December 31, 2023 - 5.0% Debentures $ - $ 12,707
Convertible
YTD ended December 31 December 31 2023 2022 Interest expense on face value $ 9,200 $ 9,200 Notional interest representing accretion 5,120 4,980 $ 14,320 $ 14,180 Aecon Group Inc. 112
DECEMBER 31, 2023 AND 2022
(in
thousands of Canadian dollars, except per share amounts)
20. PREFERRED SHARES OF AECON UTILITIES
Reported as non-current liabilities:
December 31 December 31 2023 2022
On October 23, 2023, Aecon Utilities, a wholly owned subsidiary of Aecon, entered into a subscription agreement with funds managed by the Power Opportunities strategy of Oaktree Capital Management LP (“Oaktree”). Oaktree subscribed for 154,640 convertible preferred shares (the "Preferred Shares") in Aecon Utilities at a subscription price of $1,000 each resulting in gross proceeds of $154,640, which represents $150,000 after upfront fees (“Net Investment Amount”). The Preferred Shares are convertible at any time by Oaktree into a fixed 27.5% of the common equity of Aecon Utilities and is mandatorily convertible upon a qualified initial public offering (“IPO”). Prior to conversion, the Preferred Shares will accrue a 12% annual coupon for the first three years and 14% annual coupon thereafter. At Aecon’s option, the coupon is payable in kind by accreting the principal amount or in cash. On conversion of the Preferred Shares, Aecon’s 72.5% equity interest in Aecon Utilities is not diluted as a result of the accretion feature. Transaction costs of $13,305 incurred in 2023 to issue the Preferred Shares are included in “Finance costs” in the consolidated statements of Income (see Note 28, “Finance Cost”). Accrued dividends of $3,557 were included in finance costs in 2023.
Aecon has the option to purchase the Preferred Shares for cash at any time at a value equivalent to the greatest of: (a) the as-converted value of the Preferred Shares, (b) the accreted value of the Preferred Shares, and (c) 1.5 times the Net Investment Amount less all cash dividends and distributions paid to Oaktree. Following the seven-year anniversary of the Investment, Oaktree may sell its Preferred Shares, subject to a right of first offer in favour of Aecon, or may require Aecon, at Aecon’s election, to either (i) initiate an IPO process and/or (ii) initiate a sale of Aecon Utilities or (iii) purchase the Preferred Shares for cash at a price equal to the greater of (A) the accreted value of the Preferred Shares and (B) the as-converted value of the Preferred Shares being the fair market value of the common shares into which the Preferred Shares is convertible at that time.
Upon the occurrence of a change of control event, or in the event of the dissolution, liquidation or winding-up of Aecon Utilities, the preferred shares will be redeemed for cash at the greatest of: (a) the as-converted value of the Preferred Shares, (b) the accreted value of the Preferred Shares, and (c) 1.5 times the Net Investment Amount less all cash dividends and distributions paid to Oaktree.
A six-person board of directors will oversee Aecon Utilities, comprised of four members nominated by Aecon and two members nominated by Oaktree.
The following table sets out the movements in the Preferred Shares of Aecon Utilities for the year ended December 31, 2023:
For the year ended December 31, 2023
Initial issuance on October 23, 2023
NOTES TO THE CONSOLIDATED FINANCIAL STATEMENTS
Preferred Shares of Aecon Utilities $ 157,110 $Total Preferred Shares of Aecon Utilities $ 157,110 $ -
Accrued dividends 3,557 Fair value through profit or loss adjustments (2,927) Fair value through other comprehensive income adjustments 1,840 Balance as at December 31, 2023 $ 157,110 2023 Annual Report 113
$154,640
NOTES TO THE CONSOLIDATED FINANCIAL STATEMENTS
DECEMBER 31, 2023 AND 2022
(in
thousands of Canadian dollars, except per share amounts)
21. CONCESSION RELATED DEFERRED REVENUE
Concession related deferred revenue consists of:
December 31 December 31
As part of acquiring, in 2017, the rights to operate the Existing Bermuda Airport, concession related deferred revenue includes the estimated value of the “inducement” received by Skyport to develop, finance and operate the New Airport Terminal as well as development funds related to the Bermuda International Airport Redevelopment Project. These concession deferred revenue amounts are amortized to earnings over the term of the New Airport Terminal concession period. The New Airport Terminal commenced operations on December 9, 2020. For the year ended December 31, 2023, the amounts recognized as revenue up to the date of its sale, included in the Company’s consolidated income statements were $3,001 (2022 - $3,866).
At December 31, 2023, the Company’s 50.1% interest in the Skyport concession joint venture is accounted for using the equity method (see Note 12, “Projects Accounted For Using The Equity Method”).
2023 2022 Bermuda International Airport Redevelopment
$ - $ 97,412 $ - $ 97,412
Project
Aecon Group Inc. 114
NOTES TO THE CONSOLIDATED FINANCIAL STATEMENTS
DECEMBER 31, 2023 AND 2022
(in
thousands of Canadian dollars, except per share amounts)
22. INCOME TAXES
The provision for income taxes differs from the result that would be obtained by applying combined Canadian federal and provincial (Ontario, Alberta, Quebec and British Columbia) statutory income tax rates to profit or loss before income taxes. This difference results from the following:
taxes have been remeasured to reflect statutory enacted future tax rates.
December 31 December 31 2023 2022 Profit before income taxes $ 177,545 $42,988 Statutory income tax rate 26.40% 26.40% Expected income tax expense (46,872) (11,349) Effect on income taxes of: Projects accounted for using the equity method 3,507 1,496 Provincial and foreign rate differences (287) (2,505) Disposal of subsidiaries 11,214Disposal of other assets (13,156)Non-taxable remeasurement gains 24,068Other non-deductible recoveries (expenses) 1,584 (895) Adjustments in respect of prior years (1,877) 646 Other 6,16431,217 (1,258) Income tax expense $ (15,655) $ (12,607) Deferred
Income taxes were comprised of the following: December 31 December 31 2023 2022 Current income tax $ (26,852) $ (31,550) Deferred income tax 11,197 18,943 Income tax expense $ (15,655) $ (12,607) 2023 Annual Report 115
NOTES TO THE CONSOLIDATED FINANCIAL STATEMENTS
DECEMBER 31, 2023 AND 2022
(in thousands of Canadian dollars, except per share amounts)
The movement in the components of deferred income taxes is as follows:
(1) Results from the difference between the use of the percentage of completion method of reporting for consolidated financial statement purposes and use of the uncompleted contracts and billings less costs, excluding contractual holdbacks, for tax purposes.
Deferred tax assets are offset against deferred tax liabilities within each legal entity.
As at December 31, 2023, the Company had $434,678 (2022 - $493,167) of non-capital tax losses carried forward which will expire in varying amounts within 20 years. As at December 31, 2023, a deferred income tax asset of $114,743 (2022$129,165) has been recognized on $434,678 (2022 - $493,167) of these losses. The deferred income tax assets are recognized only to the extent that it is probable that taxable income will be available against which the unused tax losses can be utilized.
The operations of the Company are complex and related tax interpretations, regulations and legislation are subject to change. The Company believes the amounts reported as deferred income tax liabilities adequately reflect management's current best estimate of its income tax exposures (see Note 17 “Provisions”).
2023 2022 (Charged)/ (Charged) / (Charged)/ (Charged)/ (Charged) / (Charged)/ credited to credited credited credited credited credited equity in to the to other to equity in to the to other respect income comprehensive respect of income comprehensive of business January 1 statement income business sale December 31 January 1 statement income combinations December 31 Canadian components: Net operating and capital losses carried forward $129,165 $ (10,240) $- $ (4,182) $ 114,743 $71,774 $57,391 $- $- $ 129,165 Reserves expensed for financial statement purposes and deducted for income tax purposes when paid 2,837 (354) - (432) 2,051 4,770 (1,933) - - 2,837 Other temporary differences 2 - - - 2 9 (7) - - 2 Other long-term differences 5,579 1,630 - (774) 6,435 2,812 2,767 - - 5,579 Actuarial and hedging gains and losses (2,323) - 3,007 - 684 3,161 - (5,484) - (2,323) Property, plant and equipment: net book value in excess of tax basis (18,255) 15,084 - 4,264 1,093 (16,732) (632) - (891) (18,255) Long-term contracts, including joint ventures (1) (166,105) 4,123 - 4,922 (157,060) (126,549) (39,556) - - (166,105) Discounting convertible debentures (954) 954 - - - (1,867) 913 - - (954) Deferred income tax asset (liability), net $ (50,054) $11,197 $3,007 $3,798 $ (32,052) $ (62,622) $18,943 $ (5,484) $ (891) $ (50,054)
on the
as follows: Deferred income tax asset $ 93,285 $ 74,626 Deferred income tax liability (125,337) (124,680) Deferred income tax liability, net $ (32,052) $ (50,054)
Reported
consolidated balance sheets
Aecon Group Inc. 116
NOTES TO THE CONSOLIDATED FINANCIAL STATEMENTS
DECEMBER 31, 2023 AND 2022
(in
thousands of Canadian dollars, except per share amounts)
23. EMPLOYEE BENEFIT PLANS
The Company has defined benefit pension plans including supplementary executive retirement plans and defined contribution plans covering substantially all employees, other than union employees who are covered by multi-employer pension plans administered by the unions. Benefits under the defined benefit plans are generally based on the employee’s years of service and level of compensation near retirement. Benefits are not indexed for inflation, except for a supplementary executive retirement plan, which is fully indexed for changes in the consumer price index. The Company does not provide post-employment benefits other than pensions.
The measurement date used for financial reporting purposes of the pension plan assets and benefit obligation is December 31. The most recent actuarial valuation filed for funding purposes for the principal defined benefit pension plan was completed as at December 31, 2021 and the next required actuarial valuation will be prepared with an effective date no later than December 31, 2024.
The defined benefit pension obligation is presented as part of other liabilities on the consolidated balance.
The financial position and other selected information related to the employee defined benefit pension plans is presented in the tables below:
2023 Annual Report 117
NOTES TO THE CONSOLIDATED FINANCIAL STATEMENTS
DECEMBER 31, 2023 AND 2022
(in thousands of Canadian dollars, except per share amounts)
December 31 December 31 2023 2022 Change in fair value of plan assets: Fair value of plan assets - beginning of year $ 32,616 $42,770 Return on plan assets greater (less) than discount rate 1,304 (8,243) Net interest income 1,597 1,120 Plan administration costs (328) (210) Company contributions 1,391 704 Transfers between employee benefit plans - (795) Plan participant contributions 37 38 Benefits paid (2,810) (2,768) Fair value of plan assets - end of year $ 33,807 $32,616 Change in benefit obligation: Benefit obligation - beginning of year $ 33,473 $41,632 Current service cost 175 254 Actuarial loss due to actuarial experience 249 115 Actuarial (gain) loss due to financial assumption changes 1,332 (6,884) Net interest cost 1,603 1,086 Benefits paid (2,810) (2,768) Plan participant contributions 37 38 Benefit obligation - end of year $ 34,059 $33,473 Funded status: Fair value of plan assets $ 33,807 $32,616 Defined benefit obligation (34,059) (33,473) Pension liabilities at December 31 $ (252) $(857) 2023 2022 Weighted average assumptions used to calculate benefit obligation: Discount rate 4.50% 5.00% Rate of increase in future compensation - first year 3.50% 4.00% Rate of increase in future compensation - thereafter 3.00% 3.00% Asset categories of pension assets: Debt securities 62.40% 62.45% Equity securities 26.53% 27.25% Cash and short-term notes 11.06% 10.30% Aecon Group Inc. 118
NOTES TO THE CONSOLIDATED FINANCIAL STATEMENTS
DECEMBER 31, 2023 AND 2022
(in
thousands of Canadian dollars, except per share amounts)
During 2024, the Company expects to make contributions of $1,217 to the defined benefit plans.
The defined benefit obligations and benefit cost levels will change as a result of future changes in the actuarial methods and assumptions, the membership data, the plan provisions and the legislative rules, or as a result of future experience gains or losses, none of which have been anticipated at this time. Emerging experience, differing from the assumptions, will result in gains or losses that will be revealed in future accounting valuations. As a result of the uncertainty associated with these estimates, there is no assurance that the plans will be able to earn the assumed rate of return on plan assets. Furthermore, market driven changes may result in changes to discount rates and other variables, which would result in the Company being required to make contributions to the plans in the future that may differ significantly from estimates. As a result, there is a significant amount of measurement uncertainty involved in the actuarial valuation process. This measurement uncertainty may lead to potential fluctuations in financial results attributable to the selection of actuarial assumptions and other accounting estimates involved in the determination of pension expense and obligations. A significant actuarial and accounting assumption impacting the reporting of pension plans is the discount rate assumption. As at December 31, 2023, the Company used a discount rate of 4.5% in its pension plan calculations for consolidated financial statement purposes. The impact of a 0.5% decrease in the discount rate assumption would have resulted in an increase in the pension benefit obligation of approximately $1,370 at December 31, 2023 and an increase in the estimated 2024 pension expense of approximately $62.
At December 31, 2023, the weighted average duration of the defined benefit obligation is 7.7 years.
2023 2022 Defined benefit pension expense: Current service cost, net of employee contributions $ 175 $ 254 Net interest cost (income) 7 (34) Plan administration costs 328 210 Defined benefit pension expense recognized in profit or loss 510 430 Actuarial loss recognized in other comprehensive income 276 1,474 Defined benefit pension expense $ 786 $ 1,904 Other pension expense: Defined contribution pension expense $ 9,705 $ 9,797 Multi-employer pension plan expense 85,302 100,865 Other pension expense $ 95,007 $ 110,662 Weighted average assumptions used to calculate defined benefit pension expense: Discount rate 5.00% 2.75% Rate of increase in future compensation 3.50% 3.00%
2023 2022 Total cash contribution for employee pension plans: Defined benefit plans $ 1,391 $704 Defined contribution plans 9,705 9,797 Multi-employer pension plans 85,302 100,865 $ 96,398 $111,366
2023 Annual Report 119
DECEMBER 31, 2023 AND 2022
(in
thousands of Canadian dollars, except per share amounts)
24. CONTINGENCIES
Coastal GasLink Pipeline, Sections 3 and 4
The project has been delayed and impacted by various events for which SA Energy Group (“SAEG”), a partnership in which the Company holds a 50% interest, asserts Coastal GasLink (“CGL”) is contractually responsible, including, but not limited to, significant scope changes and delays by CGL, unforeseen site conditions, compensable adverse weather impacts and a suspension implemented by CGL as a result of regulatory restrictions imposed due to the COVID-19 pandemic. SAEG asserts that it is entitled to additional compensation for costs associated with those delays and impacts and commenced an arbitration in the second quarter of 2021 pursuant to the terms of the contract to resolve the matter. In the third quarter of 2022, CGL issued a counterclaim, alleging breach of contract and damages arising therefrom; CGL did not articulate the amount of damages it was seeking. In the first quarter of 2023, CGL withdrew its allegations of breach of contract and related damages from its counterclaim. The arbitration hearing is scheduled to commence in the third quarter of 2024. While this commercial dispute could result in a material impact to Aecon’s earnings, cash flow, and financial position if not resolved favourably through ongoing negotiations or arbitration, the ultimate results cannot be predicted at this time.
Kemano Generating Station Second Tunnel Project
During the second quarter of 2020, Rio Tinto issued a notice of termination of contract to the joint venture in which Aecon holds a 40% interest with respect to the Kemano Generating Station Second Tunnel Project. Rio Tinto also issued notice to the joint ventures’ sureties asserting a claim on the 50% performance bonds; the sureties entered into a cooperation agreement with Rio Tinto but have not taken a position on the validity of this claim on the bonds. In the third quarter of 2020, the joint venture issued a notice of civil claim seeking approximately $105,000 in damages from Rio Tinto. The joint venture also registered and perfected a builders’ lien against project lands, providing security over approximately $97,000 of the claimed damages. In the first quarter of 2021, Rio Tinto issued a counterclaim against the joint venture but did not articulate the amount of damages it may seek from the joint venture; such amount is expected to be material. While it is possible that this commercial dispute could result in a material impact to Aecon’s earnings and cash flow if not resolved, the ultimate results cannot be predicted at this time. The aforementioned notice of civil claim was commenced in the Supreme Court of British Columbia between Frontier Kemper Constructors and Frontier Kemper – Aecon Joint Venture as plaintiffs/defendants by counterclaim and Rio Tinto Alcan Inc. and Aluminum Company of Canada Limited/Aluminum Du Canada Limitee as the defendants/plaintiffs by counterclaim.
K+S Potash Canada
During the second quarter of 2018, the Company filed a statement of claim in the Court of King’s Bench for Saskatchewan (the "Court") against K+S Potash Canada ("KSPC") and KSPC filed a statement of claim in the Court against the Company. Both actions relate to the Legacy mine project in Bethune, Saskatchewan. The Company is seeking $180,000 in payments due to it pursuant to agreements entered into between the Company and KSPC with respect to the project plus approximately $14,000 in damages. The Company has recorded $140,474 of unbilled revenue and accounts receivable at December 31, 2023. Offsetting this amount to some extent, the Company has accrued $45,000 in trade and other payables for potential payments to third parties pending the outcome of the claim against KSPC. KSPC is seeking an order that the Company repay to KSPC approximately $195,000 already paid to the Company pursuant to such agreements. The Company has also been brought into two other lawsuits in the same Court between KSPC and various other contractors involved with the Legacy mine project, both relating to matters which the Company believes are materially covered by insurance coverage, to the extent of any liability. In the fourth quarter of 2022, the Court issued a decision allowing an application by Aecon to add KSPC’s parent company K+S Aktiengesellschaft (“KSAG”) as a defendant to the lawsuit arising from KSAG’s conduct in inducing KSPC to breach its contract with Aecon. These claims may not be resolved for several years. While the Company considers KSPC’s claim to be without merit and does not expect that the resolution of these claims will cause a material impact to its financial position, the ultimate results cannot be predicted at this time.
The Company is involved in various other disputes and litigation both as plaintiff and defendant. In the opinion of management, the resolution of other disputes against the Company, including those provided for (see Note 17, “Provisions”), will not result in a material effect on the consolidated financial position of the Company.
NOTES TO THE CONSOLIDATED FINANCIAL STATEMENTS
Aecon Group Inc. 120
NOTES TO THE CONSOLIDATED FINANCIAL STATEMENTS
DECEMBER 31, 2023 AND 2022
(in
thousands of Canadian dollars, except per share amounts)
See also Note 4, “Critical Accounting Estimates” for judgments and estimates impacting litigation risk and claims risk.
As part of regular operations, the Company has the following guarantees and letters of credit outstanding:
Under the terms of many of the Company’s associate and joint arrangement contracts with project owners, each of the partners is jointly and severally liable for performance under the contracts. At December 31, 2023, the value of uncompleted work for which the Company’s associate and joint arrangement partners are responsible, and which the Company could be responsible for assuming, amounted to approximately $4,836,058 a portion of which is supported by performance bonds. In the event the Company assumed this additional work, it would have the right to receive the partner’s share of billings to the project owners pursuant to the respective associate or joint arrangement contract.
25. CAPITAL STOCK
For the year ended December 31, 2023
For the year ended December 31, 2022
The Company is authorized to issue an unlimited number of common shares.
STOCK−BASED COMPENSATION Long-Term Incentive Plan
In 2005 and 2014, the Company adopted Long-Term Incentive Plans (collectively “LTIP” or individually “2005 LTIP” or “2014 LTIP”) to provide a financial incentive for its senior executives to devote their efforts to the long-term success of the Company’s business. Awards to participants are based on the financial results of the Company and are made in the form of Deferred Share Units (“DSUs”) or in the form of Restricted Share Units (“RSUs”). Awards made in the form of DSUs will vest only on the retirement or termination of the participant. Awards made in the form of RSUs will vest annually over three years. Compensation charges related to the LTIP are expensed over the estimated vesting period of the awards in marketing, general and administrative expense. Awards made to individuals who are eligible to retire under the plan are assumed, for accounting purposes, to vest immediately.
For the year ended December 31, 2023, the Company recorded LTIP compensation charges of $19,366 (2022 - $17,160) respectively.
Project December 31, 2023
Financial and performance - issued by Export Development Canada Various joint arrangement projects $ 622,392 Financial and performance - issued in the normal conduct of business Various $ 27,680
Letters of credit:
Number Amount Number Amount Number of common shares outstanding - beginning of year 61,535,925 $ 419,357 60,822,889 $ 405,807 Common shares issued on conversion of 5.0% Debentures 86 2 -Shares issued to settle LTIP/ESU/Director DSU obligations 730,392 11,350 713,036 13,550 Number of common shares outstanding - end of year 62,266,403 $ 430,709 61,535,925 $ 419,357
2023 Annual Report 121
NOTES TO THE CONSOLIDATED FINANCIAL STATEMENTS
DECEMBER 31, 2023 AND 2022
(in thousands of Canadian dollars, except per share amounts)
Other Stock-based Compensation – Director DSU Awards
In February 2021, the Board of Directors modified its director compensation program by replacing the 2014 Director DSU Plan (as defined below) with a director deferred share unit plan that provides for the settlement of DSUs in cash only (the “2021 Director DSU Plan”) for future grants. A DSU is a right to receive an amount from the Company equal to the value of one common share. In addition to the discretionary award of DSUs, directors have an option to elect to receive 50% or 100% of their Board annual retainer fee that is otherwise payable in cash in the form of DSUs. The number of DSUs awarded to a director is equal to the value of the compensation that a director elects to receive in DSUs or the value awarded by the Company on an annual basis divided by the volume weighted average trading price of a common share on the TSX for the five trading days prior to the date of the award. DSUs are redeemable on the first business day following the date the director ceases to serve on the Board.
The Board of Directors will no longer issue new DSUs under the director deferred share unit plan dated May 2014 (the “2014 Director DSU Plan”). The last award of DSUs under the 2014 Director DSU Plan was made on March 12, 2020. DSUs granted under the 2014 Director DSU Plan will continue to be governed by the terms of the 2014 Director DSU Plan.
Director DSU awards are expensed in full on the date of grant and recognized in marketing, general and administrative expense in the consolidated statements of income. DSU awards under the 2014 Director DSU Plan are accounted for as equity-settled stock-based transactions. DSU awards under the 2021 Director DSU Plan are accounted for as cash-settled stock-based transactions with the related liability revalued to fair value at the end of each reporting period. Director DSUs have accompanying dividend equivalent rights, which are also expensed as earned in marketing, general and administrative expense.
For the year ended December 31, 2023, the Company recorded Director DSU compensation expense, net of fair value adjustments, of $2,606 (2022 - $752).
Other Stock-based Compensation – Employee Share Unit (ESU) Awards
In April 2019, the Company adopted an Employee Share Unit (“ESU”) plan, an employee benefit program that enables all permanent, non-unionized, Canadian resident employees to become shareholders of the Company. The program includes ESUs gifted to eligible employees, and additional ESUs that may be purchased by eligible employees during a predetermined window each year at a discounted price.
ESU awards and purchases vest annually over three years. ESUs are equity settled awards with compensation charges related to ESU awards and purchases expensed over the estimated vesting period in marketing, general and administrative expense.
For the year ended December 31, 2023, the Company recorded an ESU compensation expense of $1,141 (2022$1,816).
Aecon Group Inc. 122
NOTES TO THE CONSOLIDATED FINANCIAL STATEMENTS
DECEMBER 31, 2023 AND 2022
(in thousands of Canadian dollars, except per share amounts)
Details of the changes in the balance of LTIP awards, Director DSUs, and ESUs outstanding are detailed below:
Amounts included in Contributed Surplus in the Consolidated Balance Sheets at December 31, 2023 in respect of LTIP, Director DSUs, and ESUs were $45,881 (December 31, 2022 - $41,466), $5,047 (December 31, 2022 - $4,894), and $4,803 (December 31, 2022 – $4,685), respectively. Amounts included in Trade and Other Payables in the Consolidated Balance Sheets at December 31, 2023 in respect of Director DSUs was $3,558 (December 31, 2022 - $1,576).
26. EXPENSES
For the year ended December 31, 2023 LTIP Director DSUs ESUs Share Units Balance outstanding - beginning of year 2,986,486 476,660 313,403 Granted 1,374,288 111,349 36,300 Dividend equivalent rights 262,742 35,711 35,946 Settled (1,075,233) (38,272) (56,748) Forfeited (67,872) - (33,168) Balance outstanding - end of year 3,480,411 585,448 295,733 Weighted Average Grant Date Fair Value Per Unit Balance outstanding - beginning of year $ 15.40 $ 13.57 $ 17.25 Granted including Director DSU fair value adjustments 12.72 19.53 11.45 Dividend equivalent rights 14.77 15.80 17.11 Settled 15.13 15.78 16.37 Forfeited 14.54 - 15.19 Balance outstanding - end of year $ 14.39 $ 14.70 $ 16.92
For the year ended December 31 December 31 2023 2022 Personnel $ 1,441,910 $ 1,424,704 Subcontractors 2,032,113 1,863,942 Materials 814,071 983,127 Equipment costs 244,743 228,364 Depreciation of property, plant and equipment and amortization of intangible assets 79,087 94,153 Other expenses 33,218 36,795 Total expenses $ 4,645,142 $ 4,631,085 2023 Annual Report 123
NOTES TO THE CONSOLIDATED FINANCIAL STATEMENTS
DECEMBER 31, 2023 AND 2022
(in
thousands of Canadian dollars, except per share amounts)
Reported as:
27. OTHER INCOME
On May 1, 2023, the Company completed the sale of its Aecon Transportation East (“ATE”) roadbuilding, aggregates and materials businesses in Ontario to Green Infrastructure Partners Inc. Gross cash proceeds received on closing, net of debt assumed by the purchaser, were $162,657. Cash on hand in ATE subsidiaries at the closing date of $7,341 was transferred to the purchaser. ATE provided roadbuilding infrastructure solutions throughout Ontario to the provincial government, municipalities, and private clients. The financial results of ATE prior to its sale were reported in the construction segment. For the year ended December 31, 2023, the Company recorded a gain on sale of $36,520, which were included in other income in the consolidated income statements.
On September 20, 2023, the Company completed the sale of a 49.9% interest in Skyport to CC&L Infrastructure and as a result lost control for accounting purposes of Skyport (see Note 12, “Projects Accounted For Using The Equity Method”). Gross cash proceeds received on closing were $162,316 (US$120,000). For the year ended December 31, 2023, the Company recorded a gain on sale of $139,025, including $80,409 relating to the remeasurement of the retained interest in Skyport in other income in the consolidated income statements, and inclusive of foreign currency gains of $1,594 that were reclassified from accumulated other comprehensive income to the consolidated income statements.
Subsequent to the closing of the sale of a 49.9% interest in Skyport, the Company’s remaining 50.1% interest in the Skyport concession joint venture is no longer fully consolidated and is instead accounted for using the equity method.
For the year ended December 31 December 31 2023 2022 Direct costs and expenses $ 4,388,216 $ 4,340,493 Marketing, general and administrative expense 177,839 196,439 Depreciation and amortization 79,087 94,153 Total expenses $ 4,645,142 $ 4,631,085
For the year ended December 31 December 31 2023 2022 Foreign exchange gain $ 164 $1,518 Gain on sale of property, plant and equipment 46,816 8,138 Gain on sale of subsidiaries 175,545Gain on change in fair value of other financial instruments 942Other gains - 4,430 Total other income $ 223,467 $14,086
Aecon Group Inc. 124
NOTES TO THE CONSOLIDATED FINANCIAL STATEMENTS
DECEMBER 31, 2023 AND 2022
(in
thousands of Canadian dollars, except per share amounts)
28. FINANCE COST
For the year ended
29. EARNINGS PER SHARE
Details of the calculation of earnings per share are set out below:
For the year ended
(1) When the impact of dilutive securities increases the earnings per share or decreases the loss per share, they are excluded for purposes of the calculation of diluted earnings (loss) per share.
(2) The convertible debentures were fully repaid on December 29, 2023 (see Note 19 “Convertible Debentures”).
December 31 December 31 2023 2022 Interest and notional interest on long-term debt, non-recourse project debt, and debentures $ 33,548 $ 38,256 Interest on leases 4,534 4,939 Interest on short-term debt 18,767 13,614 Dividends on Preferred Shares of Aecon Utilities 3,557Transaction costs related to issuance of Preferred Shares by Aecon Utilities 13,305Gain on change in fair value of Preferred Shares of Aecon Utilities (2,927)Notional interest on provisions 250 256 Total finance cost $ 71,034 $ 57,065
December 31 December 31 2023 2022 Profit attributable to shareholders $ 161,890 $ 30,381 Interest on convertible debentures, net of tax (1) 10,526 10,422 Diluted net earnings $ 172,416 $ 40,803 Average number of common shares outstanding 61,714,211 60,977,009 Effect of dilutive securities:(1) Convertible debentures (2) 16,420,663 15,003,448 Long-term incentive plan 3,793,609 3,290,149 Weighted average number of diluted common shares outstanding 81,928,483 79,270,606 Basic earnings per share $ 2.62 $ 0.50 Diluted earnings per share (1) $ 2.10 $ 0.47
2023 Annual Report 125
NOTES TO THE CONSOLIDATED FINANCIAL STATEMENTS
DECEMBER 31, 2023 AND 2022
(in thousands of Canadian dollars, except per share amounts)
30. SUPPLEMENTARY CASH FLOW INFORMATION
Change in other balances relating to operations
For the year ended December 31 December 31 2023 2022 Decrease (increase) in: Trade and other receivables $ (5,976) $ (191,561) Unbilled revenue (52,363) (79,440) Inventories 3,394 (11,207) Prepaid expenses (21,567) (7,606) Increase (decrease) in: Trade and other payables (53,617) 140,882 Provisions (4,556) (9,093) Deferred revenue 159,695 (45,804) $ 25,010 $ (203,829) Cash flows from interest For the year ended December 31 December 31 2023 2022 Operating activities Cash interest paid $ (58,726) $ (50,397) Cash interest received 7,634 2,899 Aecon Group Inc. 126
NOTES TO THE CONSOLIDATED FINANCIAL STATEMENTS
DECEMBER 31, 2023 AND 2022
(in
thousands of Canadian dollars, except per share amounts)
31. FINANCIAL INSTRUMENTS
Fair value
From time to time, the Company enters into forward contracts and other foreign exchange hedging products to manage its exposure to changes in exchange rates related to transactions denominated in currencies other than the Canadian dollar but does not hold or issue such financial instruments for speculative trading purposes. At December 31, 2023, the Company had contracts to buy US$2,200, sell US$14,920, and sell €1,200 (December 31, 2022 – buy US$10,200, sell US$nil, and sell €nil, respectively), on which there was a cumulative net unrealized exchange gain of $526 recorded in the consolidated statements of income at that date (December 31, 2022 - gain $713). In addition, at December 31, 2023, outstanding contracts to buy US$29,724 (December 31, 2022 – buy US$96,420) were designated as cash flow hedges on which there was a cumulative unrealized gain recorded in other comprehensive income of $784 (December 31, 2022 –gain $6,710). The net unrealized exchange gain or loss represents the estimated amount the Company would have received/paid if it terminated the contracts at the end of the respective periods.
In addition, some of the Company’s investments in projects accounted for using the equity method enter into derivative financial instruments, namely interest rate swaps, to hedge the variability of interest rates related to non-recourse project debt. At December 31, 2023, for these derivative financial instruments designated as cash flow hedges, there was a cumulative unrealized gain recorded in other comprehensive income of $8,371 (December 31, 2022 - gain $19,210).
IFRS 13, “Fair Value Measurement”, enhances disclosures about fair value measurements. Fair value is defined as the amount for which an asset could be exchanged, or a liability settled, between knowledgeable, willing parties in an arm's length transaction. Valuation techniques used to measure fair value must maximize the use of observable inputs and minimize the use of unobservable inputs. The fair value hierarchy is based on three levels of inputs. The first two levels are considered observable and the last unobservable. These levels are used to measure fair values as follows:
• Level 1 – Quoted prices (unadjusted) in active markets for identical assets or liabilities that the Company has the ability to access at the measurement date.
• Level 2 – Inputs, other than Level 1 inputs, that are observable for assets and liabilities, either directly or indirectly. Level 2 inputs include: quoted market prices for similar assets or liabilities; quoted prices in markets that are not active; or other inputs that are observable or can be corroborated by observable market data for substantially the full term of the assets or liabilities. • Level 3 – Unobservable inputs that are supported by little or no market activity and that are significant to the fair value of the assets or liabilities.
The following table summarizes the fair value hierarchy under which the Company’s fair value disclosures of financial instruments are calculated.
At December 31, 2023
During the year ended December 31, 2023, there were no transfers between Level 1 and Level 2 fair value measurements, and no transfers into or out of Level 3 fair value measurements.
Total Level 1 Level 2 Level 3 Financial assets (liabilities) measured at fair value: Cash flow hedges $ 9,155 $ - $ 9,155 $Long-term financial assets 14,671 - 14,671Preferred Shares of Aecon Utilities (157,110) - - (157,110) Financial assets (liabilities) disclosed at fair value: Long-term financial assets 6,738 - 6,738Long-term debt (153,120) - (153,120) -
2023 Annual Report 127
NOTES TO THE CONSOLIDATED FINANCIAL STATEMENTS
DECEMBER 31, 2023 AND 2022
(in thousands of Canadian dollars, except per share amounts)
Preferred Shares of Aecon Utilities
The Preferred Shares are designated as fair value through profit or loss and is classified as level 3 in the fair value hierarchy as there are significant unobservable inputs used in the valuation. Management uses a lattice model to estimate the fair value of the preferred shares. It utilizes the binomial tree method to project the stock price movements, determine optimal timing to exercise the conversion feature and other optionalities included in the instrument, and calculates the possible payoffs of the instruments. The key inputs in determining fair value include credit spread, risk-free rate, market volatility, underlying share price and conversion price, and assumptions related to the probability of events that would trigger mandatory conversions.
Methodologies and procedures regarding Level 3 fair value measurements are determined by the Company’s management. The calculation of Level 3 fair values is derived based on the underlying contractual terms of the Preferred Shares as well as observable and unobservable inputs. Development of unobservable inputs requires the use of significant judgment. Level 3 fair value measurements are reviewed and validated by the Company’s management to ensure reasonability and accuracy on a quarterly basis.
The Preferred Shares were measured at fair value using the following significant unobservable inputs: The Company used an underlying share price of Aecon Utilities at December 31, 2023 of $1.00. If the Company had used an underlying share price that was higher or lower by 10%, the potential effect would be an increase of $13,918 or a decrease of $(13,144) to the fair value of the Preferred Shares through the income statement. The Company used a market volatility of 37.8%. If the Company had used a market volatility that was higher or lower by 10%, the potential effect would be an increase of $2,165 or a decrease of $(1,856) to the fair value of the preferred shares through the income statement. The Company used a credit spread of 14.01%. If the Company had used a credit spread that was higher or lower by 10%, the potential effect would be a decrease of $(2,165) or an increase of $5,103 to the fair value of the preferred shares through other comprehensive income.
Risk management
The main risks arising from the Company’s financial instruments are credit risk, liquidity risk, interest rate risk and currency risk. These risks arise from exposures that occur in the normal course of business and are managed on a consolidated Company basis.
Credit risk
Financial instruments that subject the Company to credit risk consist primarily of cash and cash equivalents, short-term deposits and marketable securities, accounts receivable, holdbacks receivable, unbilled revenues, and foreign exchange contracts.
Credit risk associated with cash and short-term deposits is minimized by ensuring these financial assets are placed with financial institutions with investment grade credit ratings and by placing a limit on the amount that can be invested with any single financial institution.
The credit risk associated with foreign exchange contracts arises from the possibility the counterparty to one of these contracts fails to perform according to the terms of the contract. Credit risk associated with foreign exchange contracts is minimized by entering into such transactions with major Canadian financial institutions.
Concentration of credit risk associated with accounts receivable, holdbacks receivable and unbilled revenue is limited by the Company’s diversified customer base and its dispersion across different business and geographic areas. The credit quality of the Company’s significant customers is monitored on an ongoing basis and allowances are provided for potential losses that have been incurred at the consolidated balance sheet date. Receivables that are neither past due nor impaired are considered by management to have no significant collection risk. The liquidity of customers and their ability to pay receivables are considered in the impairment of such assets. Most trade receivables that are past due are from public-sector clients and infrastructure/industrial companies with strong credit ratings and are subject to lower credit risk. No collateral is held in respect of impaired assets or assets that are past due but not impaired. The Company recognizes
Aecon Group Inc. 128
NOTES TO THE CONSOLIDATED FINANCIAL STATEMENTS
DECEMBER 31, 2023 AND 2022
(in
thousands of Canadian dollars, except per share amounts)
loss allowances using 12-month expected credit losses, or lifetime expected credit losses if there has been a significant increase in the credit risk on the instrument.
As at December 31, 2023, the Company had $67,334 in trade receivables that were past due. Of this amount, $57,914 was over 60 days past due, against which the Company has recorded an allowance for expected credit losses of $848.
Liquidity risk
Liquidity risk is the risk the Company will encounter difficulty in meeting obligations associated with financial liabilities that are settled in cash or another financial asset.
The Company’s approach is to ensure it will have sufficient liquidity to meet operational, tax, capital and regulatory requirements and obligations, under both normal and stressed circumstances. Cash flow projections are prepared and reviewed quarterly by the Board of Directors to ensure a sufficient continuity of funding. Long-term debt maturities are spread over a range of dates, thereby ensuring the Company is not exposed to excessive refinancing risk in any one year. The Company’s cash and cash equivalents, short-term deposits and restricted cash are invested in highly liquid interestbearing investments.
Contractual maturities for financial liabilities as at December 31, 2023 are as follows:
Due
Interest rate risk
The Company is exposed to interest rate risk on its short-term deposits and its long-term debt to the extent that its investments or credit facilities are based on floating rates of interest.
For the year ended December 31, 2023, a 1% increase or a 1% decrease in interest rates applied to the Company’s variable rate long-term debt would not have a significant impact on net earnings or comprehensive income.
between Total Due withinone andDue after undiscountedEffect of Fair valueCarrying one year five yearsfive yearscash flowsinterestadjustmentvalue Bank indebtedness $ - $ 111,700 $ - $ 111,700 $ - $ - $ 111,700 Trade and other payables $ 1,017,836 $ - $ - $ 1,017,836 $ - $ - $ 1,017,836 Leases $ 38,279 $ 83,692 $ 12,665 $ 134,636 $ (13,901) $ - $ 120,735 Equipment and other loans 10,065 14,941 7,163 32,169 (3,526) - 28,643 48,344 98,633 19,828 166,805 (17,427) - 149,378 Preferred Shares of Aecon Utilities (1) - - 381,183 381,183 (222,986) (1,087) 157,110 Long-term financial liabilities $ 48,344 $ 98,633 $ 401,011 $ 547,988 $ (240,413) $ (1,087) $ 306,488 (1) The Preferred Shares of Aecon Utilities have no fixed repayment terms
20
Preferred
Aecon
The Preferred
(see Note
“
Shares of
Utilities”).
Shares are assumed to have a contractual maturity of 7 years from issuance in this summary
2023 Annual Report 129
NOTES TO THE CONSOLIDATED FINANCIAL STATEMENTS
DECEMBER 31, 2023 AND 2022
(in thousands of Canadian dollars, except per share amounts)
As at December 31, 2023, the interest rate profile of the Company’s long-term debt was as follows:
The Company is not exposed to changes in interest rates on fixed rate long-term debt instruments. As such, changes in interest rates in the current year related to these financial liabilities would not have had an impact on net earnings or comprehensive income in the current period. The impact of changes in market interest rates on the fair value of future cash flows of the Preferred Shares of Aecon Utilities is discussed above in this note the section titled “Fair Value”.
Cash and cash equivalents, restricted cash and short-term deposits have limited interest rate risk due to their short-term nature.
Currency risk
The Company operates internationally and is exposed to risk from changes in foreign currency rates. The Company is mainly exposed to fluctuations in the US dollar.
At December 31, 2023, a 10% change in the US dollar against the Canadian dollar would have impacted the Company’s profit or loss in the current period by $2,924 because of currency exposures. The sensitivity analysis includes foreign currency denominated monetary items but excludes all investments in joint ventures and hedges and adjusts their translation at year-end for the above 10% change in foreign currency rates.
Additional information on financial instruments:
Fixed rate instruments $ 149,378 Total long-term debt $ 149,378
As at December 31, 2023 Fair value Fair value Total Amortized through through carrying Total fair cost profit or loss OCI amount value Cash and cash equivalents $ 645,784 $ - $ - $ 645,784 $ 645,784 Trade and other receivables 969,756 - - 969,756 969,756 Unbilled revenue 719,243 - - 719,243 719,243 Long-term financial assets 6,738 14,671 14 21,423 21,423 $ 2,341,521 $ 14,671 $ 14 $ 2,356,206 $ 2,356,206 Bank indebtedness $ 111,700 $ - $ - $ 111,700 $ 111,700 Trade and other payables 1,017,836 - - 1,017,836 1,017,836 Preferred Shares of Aecon Utilities - 157,110 - 157,110 157,110 Long-term debt 149,378 - - 149,378 153,120 $ 1,278,914 $ 157,110 $ - $ 1,436,024 $ 1,439,766 Aecon Group Inc. 130
NOTES TO THE CONSOLIDATED FINANCIAL STATEMENTS
DECEMBER 31, 2023 AND 2022
(in
thousands of Canadian dollars, except per share amounts) As
Cash and cash equivalents, restricted cash, marketable securities, trade receivables, trade payables and accrued liabilities approximate their fair values on a discounted cash flow basis because of the short-term nature of these instruments. In general, investments with original maturities of greater than three months and remaining maturities of less than one year are classified as short-term investments. Investments with maturities beyond one year may be classified as current based on their highly liquid nature and because such marketable securities represent the investment of cash that is available for current operations.
Other financial instruments held or issued by the Company include holdbacks receivable, non-interest bearing project advances payable or holdbacks payable, which are amounts directly related to construction contracts. These amounts, by their nature, do not bear interest and consideration for the time value of money is thus negotiated into the price of the contracts. The Company does not have plans to sell these financial instruments to third parties and will realize or settle them in the normal course of business. No quoted market price exists for these instruments because they are not traded in an active and liquid market. Accordingly, the fair values of holdbacks receivable, non-interest bearing project advances payable or holdbacks payable, which are due within one year, are considered to approximate their carrying values. For those financial instruments that are due beyond one year, the Company has valued them to reflect the time value of money and the credit risk or the borrowing risk associated with these financial instruments.
The fair value of long-term debt is derived by discounting the remaining principal and interest payments at interest rates reflective of the Company’s current cost of borrowing for similar debt. These interest rates were calculated by using the Canadian interest rate swap yield at year-end and adjusting for the credit spread that reflects the Company’s cost of secured credit. The fair value of the convertible debentures was obtained from quoted prices observable on the Toronto Stock Exchange.
Convertible debentures are discussed further in Note 19.
at December 31, 2022 Fair value Fair value Total Amortized through through carrying Total fair cost profit or loss OCI amount value Cash and cash equivalents $ 377,212 $ - $ - $ 377,212 $ 377,212 Restricted cash 107,033 - - 107,033 107,033 Trade and other receivables 1,024,378 - - 1,024,378 1,024,378 Unbilled revenue 685,258 - - 685,258 685,258 Long-term financial assets 2,473 - 1,339 3,812 3,812 $ 2,196,354 $ - $ 1,339 $ 2,197,693 $ 2,197,693 Bank indebtedness $ 120,979 $ - $ - $ 120,979 $ 120,979 Trade and other payables 1,064,048 - - 1,064,048 1,064,048 Convertible debentures 178,878 - - 178,878 183,062 Non-recourse project debt 379,001 - - 379,001 379,001 Long-term debt 230,202 - - 230,202 227,762 $ 1,973,108 $ - $ - $ 1,973,108 $ 1,974,852
2023 Annual Report 131
NOTES TO THE CONSOLIDATED FINANCIAL STATEMENTS
DECEMBER 31, 2023 AND 2022
(in
thousands of Canadian dollars, except per share amounts)
32. CAPITAL DISCLOSURES
For capital management purposes, the Company defines capital as the aggregate of its shareholders’ equity and debt. Debt includes the current and non-current portions of long-term debt (excluding non-recourse debt), convertible debentures, and Preferred Shares of Aecon Utilities.
The Company’s principal objectives in managing capital are:
• to ensure sufficient liquidity to adequately fund the ongoing operations of the business;
• to provide flexibility to take advantage of contract and growth opportunities that are expected to provide returns to shareholders;
• to maintain a strong capital base;
• to provide a rate of return in excess of its cost of capital to its shareholders; and
• to comply with financial covenants required under its various borrowing facilities.
The Company manages its capital structure and adjusts it in light of changes in economic conditions. In order to maintain or adjust its capital structure, the Company may issue new debt or repay existing debt, issue new shares, issue convertible debt, or adjust the quantum of dividends paid to shareholders. Financing decisions are generally made on a specific transaction basis and depend on such things as the Company’s needs, capital markets and economic conditions at the time of the transaction.
Although the Company monitors capital on a number of bases, including liquidity and working capital, total debt (excluding non-recourse debt and drawings on the Company’s credit facilities presented as bank indebtedness) as a percentage of total capitalization (debt to capitalization percentage) is considered by the Company to be the most important metric in measuring the strength and flexibility of its consolidated balance sheets. At December 31, 2023, the debt to capitalization percentage including Preferred Shares and convertible debentures as debt was 22% (December 31, 2022 - 30%). While the Company believes these debt to capitalization percentages are acceptable, because of the cyclical nature of its business, and due to the uncertainties described in Note 4, “Critical Accounting Estimates” and Note 24, “Contingencies”, the Company will continue its current efforts to maintain a conservative capital position.
At December 31, 2023, the Company complied with all of its financial debt covenants.
Aecon Group Inc. 132
NOTES TO THE CONSOLIDATED FINANCIAL STATEMENTS
DECEMBER 31, 2023 AND 2022
(in
thousands of Canadian dollars, except per share amounts)
33. OPERATING SEGMENTS
Segment reporting is based on the Company’s divisional operations. The breakdown by division mirrors the Company’s internal reporting systems.
The Company currently operates in two segments within the infrastructure development industry: Construction and Concessions. The other costs and eliminations category in the summary below includes corporate costs and other activities not directly allocable to segments and also includes inter-segment eliminations.
The Construction segment includes all aspects of the construction of both public and private infrastructure, primarily in Canada, and on a selected basis, internationally and focuses primarily on the following market sectors:
• Civil Infrastructure;
• Urban Transportation Solutions;
• Nuclear Power Infrastructure;
• Utility Infrastructure; and
• Industrial Infrastructure.
Activities within the Concessions segment include the development, financing, build and operation of construction projects primarily by way of public-private partnership contract structures, as well as integrating the services of all project participants, and harnessing the strengths and capabilities of Aecon. The Concessions segment focuses primarily on providing the following services:
• Development of domestic and international Public-Private Partnership (“P3”) projects;
• Private finance solutions;
• Developing strategic partnerships;
• Leading and/or actively participating in development teams; and
• Operations and maintenance of infrastructure assets.
2023 Annual Report 133
NOTES TO THE CONSOLIDATED FINANCIAL STATEMENTS
DECEMBER 31, 2023 AND 2022
(in
thousands of Canadian dollars, except per share amounts)
For the year ended December 31, 2023 Construction Concessions Other and eliminations Total Consolidated statements of income External customer revenue $ 4,570,315 $ 73,527 $ - $ 4,643,842 Inter-segment revenue 2,185 - (2,185)Total revenue 4,572,500 73,527 (2,185) 4,643,842 Expenses $ (4,545,511)$ (55,144)$ (44,487) $ (4,645,142) Which include: Depreciation and amortization (61,119) (16,974) (994) (79,087) Other income: Foreign exchange gain (loss) $ 320 $ (84)$ (72) $ 164 Gain on sale of property, plant and equipment 28,786 - 18,030 46,816 Gain on sale of subsidiaries - 139,025 36,520 175,545 Gain on change in fair value of other financial instruments - 942 - 942 Income from projects accounted for using the equity method $ 2,944 $ 15,803 $ - $ 18,747 Operating profit $ 59,039 $ 174,069 $ 7,806 $ 240,914 Finance income (cost): Finance income $ 7,665 Finance cost (71,034) Profit before income taxes $ 177,545 Income tax expense (15,655) Profit for the year $ 161,890 Revenue by contract type Fixed price $ 1,951,962 $ - $ 4 $ 1,951,966 Cost plus/unit price 2,620,538 - (2,189) 2,618,349 Concession operations - 73,527 - 73,527 Total revenue 4,572,500 73,527 (2,185) 4,643,842 Revenue by service type Construction revenue $ 4,572,500 $ - $ (2,185) $ 4,570,315 Concession revenue - 73,527 - 73,527 Total revenue 4,572,500 73,527 (2,185) 4,643,842 ConstructionConcessions Other and eliminations Total Consolidated balance sheets Segment assets $ 2,673,302 $ 229,964 $ 292,362 $ 3,195,628 Which include: Projects accounted for using the equity method 8,370 224,382 - 232,752 Segment liabilities $ 1,152,819 $ (61,438)$ 1,039,921 $ 2,131,302 Additions to non-current assets: Property, plant and equipment $ 42,735 $ 368 $ 3,287 $ 46,390 Intangible assets $ 459 $ 4,202 $ 1,279 $ 5,940 Aecon Group Inc. 134
NOTES TO THE CONSOLIDATED FINANCIAL STATEMENTS
DECEMBER 31, 2023 AND 2022
(in
thousands of Canadian dollars, except per share amounts)
For the year ended December 31, 2022 Construction Concessions Other and eliminations Total Consolidated statements of income External customer revenue $ 4,620,540 $ 75,910 $ - $ 4,696,450 Inter-segment revenue 274 - (274)Total revenue 4,620,814 75,910 (274) 4,696,450 Expenses $ (4,516,851)$ (68,026)$ (46,208) $ (4,631,085) Which include: Depreciation and amortization (70,892) (21,744) (1,517) (94,153) Other income: Foreign exchange gain $ 894 $ 2 $ 622 $ 1,518 Gain on sale of property, plant and equipment 8,138 - - 8,138 Other gains 4,430 - - 4,430 Income from projects accounted for using the equity method $ 3,455 $ 14,248 $ - $ 17,703 Operating profit (loss) $ 120,880 $ 22,134 $ (45,860) $ 97,154 Finance income (cost): Finance income $ 2,899 Finance cost (57,065) Profit before income taxes $ 42,988 Income tax expense (12,607) Profit for the year $ 30,381 Revenue by contract type Fixed price $ 2,379,778 $ - $ (67) $ 2,379,711 Cost plus/unit price 2,241,036 - (207) 2,240,829 Concession operations - 75,910 - 75,910 Total revenue 4,620,814 75,910 (274) 4,696,450 Revenue by service type Construction revenue $ 4,620,814 $ - $ (274) $ 4,620,540 Concession revenue - 75,910 - 75,910 Total revenue 4,620,814 75,910 (274) 4,696,450 ConstructionConcessions Other and eliminations Total Consolidated balance sheets Segment assets $ 2,938,198 $ 721,875 $ (93,056) $ 3,567,017 Which include: Projects accounted for using the equity method 35,854 72,017 - 107,871 Segment liabilities $ 1,367,750 $ 440,820 $ 804,452 $ 2,613,022 Additions to non-current assets: Property, plant and equipment $ 73,181 $ 327 $ 7,318 $ 80,826 Intangible assets $ 5,582 $ 6,877 $ 1,727 $ 14,186 2023 Annual Report 135
NOTES TO THE CONSOLIDATED FINANCIAL STATEMENTS
DECEMBER 31, 2023 AND 2022
(in
thousands of Canadian dollars, except per share amounts)
Revenue from external customers has been attributed to individual countries on the basis of the customer’s location.
Revenue from the Company’s largest customer accounted for approximately 9.3% of consolidated revenue for the year ended December 31, 2023. The customer and its affiliated entities are located in Canada, with revenue recorded primarily in the construction segment.
34. REMAINING PERFORMANCE OBLIGATIONS
Backlog (i.e. remaining performance obligations) means the total value of work that has not yet been completed that: (a) has a high certainty of being performed as a result of the existence of an executed contract or work order specifying job scope, value and timing; or (b) has been awarded to the company, as evidenced by an executed binding letter of intent or agreement, describing the general job scope, value and timing of such work, and where the finalization of a formal contract in respect of such work is reasonably assured. O&M activities are provided under contracts that can cover a period of up to 30 years. In order to provide information that is comparable to the backlog of other categories of activity, the Company limits backlog for O&M activities to the earlier of the contract term and the next five years.
Reported backlog as at December 31, 2023 of $6,157,449 compares to backlog of $6,296,462 as at December 31, 2022. New contract awards of $4,504,828 were booked in 2023 compared to $4,795,125 in 2022.
Geographic segment information: December 31 December 31 2023 2022 Revenue from external customers: Canada $ 4,294,786 $ 4,507,955 USA 172,013 100,029 International 177,043 88,466 $ 4,643,842 $ 4,696,450 Property, plant, equipment and intangible assets Canada $ 365,693 $ 523,202 USA 8,699 4,845 International 520 529,407 $ 374,912 $ 1,057,454
Backlog As at December 31 2023 2022 Construction $ 6,053,032 $6,197,400 Concessions 104,417 99,062 Consolidated $ 6,157,449 $6,296,462 Aecon Group Inc. 136
NOTES TO THE CONSOLIDATED FINANCIAL STATEMENTS
DECEMBER 31, 2023 AND 2022
(in
thousands of Canadian dollars, except per share amounts)
Backlog duration, representing the expected period during which backlog on hand will be converted into revenue, is set out in the table below:
The Company does not report as backlog the significant number of contracts and arrangements in hand where the exact amount of work to be performed cannot be reliably quantified or where a minimum number of units at the contract specified price per unit is not guaranteed. Examples include time and material and some cost-plus and unit priced contracts where the extent of services to be provided is undefined or where the number of units cannot be estimated with reasonable certainty. Other examples include the value of construction work managed under construction management advisory contracts, concession agreements, multi-year operating and maintenance service contracts where the value of the work is not specified, supplier of choice arrangements and alliance agreements where the client requests services on an as-needed basis. None of the expected revenue from these types of contracts and arrangements is included in backlog. Therefore, the Company’s anticipated future work to be performed at any given time is greater than what is reported as backlog.
35. RELATED PARTIES
The Company conducts its business principally through the following subsidiary companies, all of which are wholly owned. Oaktree’s investment in the Preferred Shares of Aecon Utilities is convertible at any time by Oaktree into a fixed 27.5% of the common equity of Aecon Utilities (see Note 20 “Preferred Shares of Aecon Utilities”):
Estimated backlog duration As at December 31 2023 2022 Next 12 months $ 2,669,825 43% $3,035,244 48% Next 13-24 months 1,308,735 21% 1,853,091 29% Beyond 2,178,889 36% 1,408,127 23% $ 6,157,449 100% $6,296,462 100%
Subsidiary Jurisdiction of Incorporation Aecon Construction Group Inc. Canada Aecon Infrastructure Management Inc. Alberta Aecon Transportation West Ltd. Alberta Aecon Utilities Inc. Canada Groupe Aecon Quebec Ltee. Quebec 2023 Annual Report 137
NOTES TO THE CONSOLIDATED FINANCIAL STATEMENTS
DECEMBER 31, 2023 AND 2022
(in thousands of Canadian dollars, except per share amounts)
The Company also conducts its business through the following significant joint arrangements and associates:
Joint arrangements and associates Country of operations Ownership interests Nature of activities Annacis Water Supply Tunnel Project Canada 40.00% Construction Bermuda Skyport Corporation Limited Bermuda 50.10% Concession Bruce Power Unit 3 & 4 Steam Generator Replacement Project Canada 40.00% Construction Bruce Power Unit 3 Fuel Channel and Feeder Replacement Project Canada 55.00% Construction Bruce Power Unit 6 Fuel Channel and Feeder Replacement Project Canada 40.00% Construction Bruce Power Unit 6 Steam Generator Replacement Project Canada 40.00% Construction Bruce Power Units 4, 5, 7 and 8 Fuel Channel and Feeder Replacement Project Canada 55.00% Construction Buffalo Pound Water Treatment Plant Renewal Project Canada 50.00% Construction Coastal GasLink Pipeline (Spreads 3 and 4) Project Canada 50.00% Construction Darlington Nuclear Re-Tube and Feeder Replacement Project Canada 50.00% Construction Darlington Nuclear Turbine Generator Refurbishment Project Canada 60.00% Construction Eglinton Crosstown Light Rail Transit Concessionaire Canada 25.00% Concession Eglinton Crosstown Light Rail Transit Construction Project Canada 25.00% Construction Eglinton Crosstown West Extension – Advance Tunnel Construction Project Canada 40.00% Construction Eglinton Crosstown West Extension – Advance Tunnel Project SPV Canada 40.00% Construction Finch West Light Rail Transit Concessionaire Canada 33.00% Concession Finch West Light Rail Transit Construction Project Canada 33.00% Construction Gordie Howe International Bridge Concessionaire Canada and USA 20.00% Concession Gordie Howe International Bridge Project Canada and USA 20.00% Construction Highway 401 Expansion Project Canada 50.00% Construction Highway 401 Expansion Project SPV Canada 50.00% Construction John Hart Seismic Upgrades Project Canada 60.00% Construction Kicking Horse Canyon Project Canada 50.00% Construction Montréal-Trudeau International Airport REM Station project Canada 50.00% Construction ONxpress GO Expansion On-Corridor Works Project Canada 50.00% Construction ONxpress Operations Inc. Canada 28.00% Concession Pattullo Bridge Replacement Construction Project Canada 50.00% Construction Pattullo Bridge Replacement Project SPV Canada 50.00% Construction Réseau express métropolitain Montreal Light Rail Transit Project Canada 24.00% Construction Scarborough Subway Extension – Stations, Rail and Systems Canada 50.00% Construction Second Narrows Water Supply Tunnel Project Canada 40.00% Construction Site C Generating Station and Spillways Civil Works Project Canada 30.00% Construction Vaudreuil-Soulanges Hospital Project Canada 33.33% Construction Winnipeg North End Sewage Treatment Plant Project Canada 50.00% Construction Aecon Group Inc. 138
NOTES TO THE CONSOLIDATED FINANCIAL STATEMENTS
DECEMBER 31, 2023 AND 2022
(in
thousands of Canadian dollars, except per share amounts)
The Company enters into transactions with certain equity accounted investees as part of the normal course of operations. The Company had the following transactions with equity accounted investees:
As at December 31, 2023, trade receivables include amounts due from equity accounted investees of $126,251 (2022$88,290), and trade payables include amounts due to equity accounted investees of $nil (2022 - $341).
For the year ended December 31, 2023, revenue includes sales to equity accounted investees of $841,541 (2022$879,153), and direct costs and expenses include purchases from equity accounted investees of $nil (2022 - $24,749).
Key management includes the Company’s Board of Directors and Named Executive Officers. Compensation awarded to key management is as follows:
December 31 December 31 2023 2022 Short-term employee benefits $ 6,515 $ 6,918 Post-employment benefits 150 149 Stock-based payments 4,010 2,312 $ 10,675 $ 9,379 2023 Annual Report 139

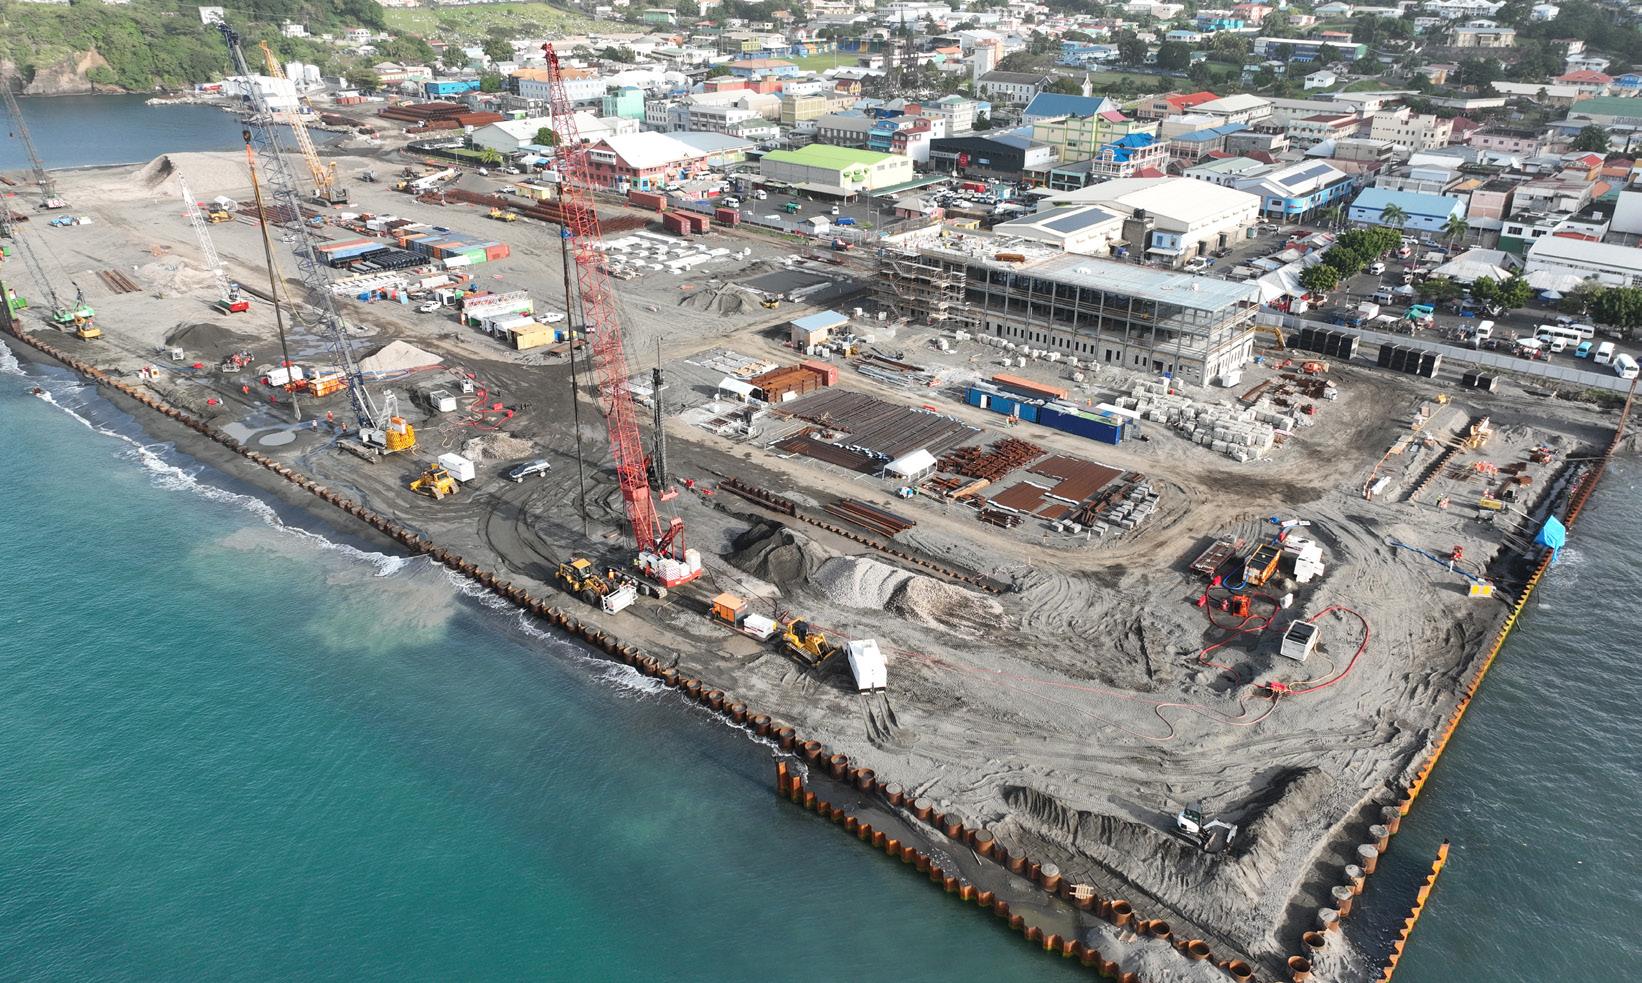
EXECUTIVE COMMITTEE
Jean-Louis Servranckx President and Chief Executive Officer
Jerome Julier
Executive Vice President and Chief Financial Officer
Steve Nackan
Executive Vice President and President, Concessions
Thomas Clochard
Executive Vice President, Civil and Nuclear
Eric MacDonald
Executive Vice President, Utilities
Manuel Rivaya
Senior Vice President, Urban Transportation Solutions
Gordana Terkalas
Senior Vice President and Chief People Officer
BOARD OF DIRECTORS
John M. Beck
Anthony P. Franceschini
J.D. Hole
Susan Wolburgh Jenah ICD.D
Stuart Lee
Eric Rosenfeld
Jean-Louis Servranckx
Monica Sloan ICD.D
Deborah S. Stein ICD.D
Scott Thon ICD.D
Left: Bruce Power Major Component Replacement Project – Tiverton, ON
Right: Kingstown Port Modernisation Project Works, Lot 1: Primary Cargo Port – Saint Vincent and the Grenadines

TORONTO HEADQUARTERS
20 Carlson Court, Suite 105
Toronto, Ontario M9W 7K6
Phone: 416 297 2600
GENERAL INQUIRIES
Toll Free: 1 877 232 2677
Email: aecon@aecon.com
INVESTOR RELATIONS INQUIRIES
Email: ir@aecon.com
MEDIA RELATIONS INQUIRIES
Email: corpaffairs@aecon.com

REGISTRAR AND TRANSFER AGENT
Computershare Investor Services Inc.
Phone: 514 982 7555
Toll Free: 1 800 564 6253
Email: service@computershare.com
ETHICS HOTLINE
Toll Free: 1 844 980 2967
Online: aecon.ethicspoint.com
QR Code: aecon.navexone.com
 Photo: Réseau express métropolitain (REM) – Montréal, QC
