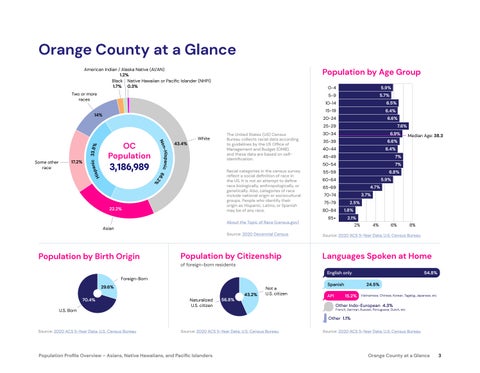
Orange County at a Glance Population by Age Group
American Indian / Alaska Native (AI/AN) 1.2% Black Native Hawaiian or Pacific Islander (NHPI) 1.7% 0.3% Two or more races
S
14%
0-4
5.9%
5-9
5.7%
10-14
6.5%
15-19
6.4% 6.6%
20-24
7.6%
17.2%
OC Population
3,186,989
n-Hispanic 66 No .2%
Some other race
c 33.8% pani His
25-29
43.4%
White
The United States (US) Census Bureau collects racial data according to guidelines by the US Office of Management and Budget (OMB), and these data are based on selfidentification.
6.9%
30-34
6.4%
40-44
7%
45-49
7%
50-54 Racial categories in the census survey reflect a social definition of race in the US. It is not an attempt to define race biologically, anthropologically, or genetically. Also, categories of race include national origin or sociocultural groups. People who identify their origin as Hispanic, Latino, or Spanish may be of any race.
22.2%
About the Topic of Race (census.gov)
6.8%
55-59
5.9%
60-64 4.7%
65-69
3.7%
70-74 75-79 80-84 85+
2.5% 1.8% 2.1% 2%
Asian Source: 2020 Decennial Census
Population by Birth Origin
Population by Citizenship
Median Age: 38.3
6.6%
35-39
4%
6%
8%
Source: 2020 ACS 5-Year Data, U.S. Census Bureau
Languages Spoken at Home
of foreign-born residents 54.8%
English only Foreign-Born 29.6% 70.4% U.S. Born
Naturalized U.S. citizen
56.8%
43.2%
Not a U.S. citizen
24.5%
Spanish API
15.2%
Vietnamese, Chinese, Korean, Tagalog, Japanese, etc
Other Indo-European 4.3%
French, German, Russian, Portuguese, Dutch, etc
Other 1.1% Source: 2020 ACS 5-Year Data, U.S. Census Bureau
Source: 2020 ACS 5-Year Data, U.S. Census Bureau
Population Profile Overview – Asians, Native Hawaiians, and Pacific Islanders
Source: 2020 ACS 5-Year Data, U.S. Census Bureau
Orange County at a Glance
3

