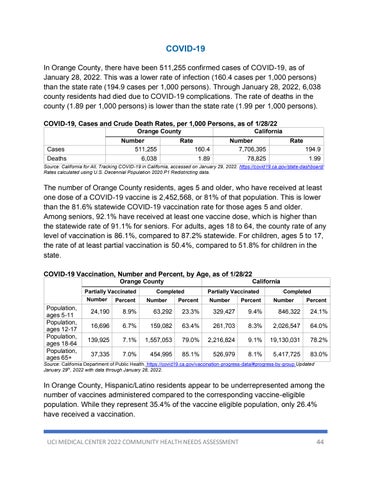
COVID-19 In Orange County, there have been 511,255 confirmed cases of COVID-19, as of January 28, 2022. This was a lower rate of infection (160.4 cases per 1,000 persons) than the state rate (194.9 cases per 1,000 persons). Through January 28, 2022, 6,038 county residents had died due to COVID-19 complications. The rate of deaths in the county (1.89 per 1,000 persons) is lower than the state rate (1.99 per 1,000 persons). COVID-19, Cases and Crude Death Rates, per 1,000 Persons, as of 1/28/22 Orange County Number 511,255
Cases Deaths
California
Rate
6,038
160.4
Number 7,706,395
1.89
78,825
Rate 194.9 1.99
Source: California for All, Tracking COVID-19 in California, accessed on January 29, 2022. https://covid19.ca.gov/state-dashboard/ Rates calculated using U.S. Decennial Population 2020 P1 Redistricting data.
The number of Orange County residents, ages 5 and older, who have received at least one dose of a COVID-19 vaccine is 2,452,568, or 81% of that population. This is lower than the 81.6% statewide COVID-19 vaccination rate for those ages 5 and older. Among seniors, 92.1% have received at least one vaccine dose, which is higher than the statewide rate of 91.1% for seniors. For adults, ages 18 to 64, the county rate of any level of vaccination is 86.1%, compared to 87.2% statewide. For children, ages 5 to 17, the rate of at least partial vaccination is 50.4%, compared to 51.8% for children in the state. COVID-19 Vaccination, Number and Percent, by Age, as of 1/28/22 Orange County Partially Vaccinated Number Percent
Population, ages 5-11 Population, ages 12-17 Population, ages 18-64 Population, ages 65+
California
Completed Number
Percent
Partially Vaccinated Number
Percent
Completed Number
Percent
24,190
8.9%
63,292
23.3%
329,427
9.4%
846,322
24.1%
16,696
6.7%
159,082
63.4%
261,703
8.3%
2,026,547
64.0%
139,925
7.1%
1,557,053
79.0%
2,216,824
9.1%
19,130,031
78.2%
37,335
7.0%
454,995
85.1%
526,979
8.1%
5,417,725
83.0%
Source: California Department of Public Health. https://covid19.ca.gov/vaccination-progress-data/#progress-by-group Updated January 29th, 2022 with data through January 28, 2022.
In Orange County, Hispanic/Latino residents appear to be underrepresented among the number of vaccines administered compared to the corresponding vaccine-eligible population. While they represent 35.4% of the vaccine eligible population, only 26.4% have received a vaccination.
UCI MEDICAL CENTER 2022 COMMUNITY HEALTH NEEDS ASSESSMENT
44
