

ENVIRONMENTAL
HEALTH CARE AGENCY PUBLIC HEALTH SERVICES
HEALTH June 2017
 Cover Photo: Family Fun in Surf
2016 Annual Ocean, Harbor & Bay Water Quality Report

PROJECT MANAGERS
• Anthony Martinez, Program Manager
• Larry Brennler, Supervising Environmental Health Specialist II
• Hisham Elmishad, Environmental Health Specialist II
2016 Annual Ocean, Harbor & Bay Water Quality Report - Page I June 2017

2016 Annual Ocean, Harbor & Bay Water Quality Report - Page II
Surfer Windsailing
TABLE OF CONTENTS
Executive Summary V
Orange County Beaches Monitoring Stations VII
The Ocean Water Protection Program 1

Sewage Waste Discharges 8
Ocean, Harbor and Bay Water Closures Due to Sewage Spills 13
Ocean, Harbor and Bay Water Postings Due to Bacteriological Standards Violations 20 Ocean, Harbor and Bay Water Rain Advisories 23
Appendix 1 32
Postings by Open Coastal Ocean Water Areas 2000 – 2016
Appendix 2 48
Postings by Harbor and Bay Water Areas 2000 – 2016
Appendix 3 53
Unauthorized Discharges of Waste and Ocean/Harbor/Bay Closures 1987 - 2016
Appendix 4 55
2016 Sewage Spill Closures for Ocean, Harbor and Bay Water Areas
Appendix 5 56
Single Sample Standard Exceedance Rates for Non Point Zero Open Coastal Locations
Appendix 6 57
Single Sample Standard Exceedance Rates for Point Zero Open Coastal Locations
& Bay Water Quality Report - Page III
2016 Annual Ocean, Harbor
Surfers looking at surf
Over 8,600 water samples were collected and approximately 25,900 tests performed.

2016 Annual Ocean, Harbor & Bay Water Quality Report - Page IV
“
Family Fun at the Beach
EXECUTIVE SUMMARY
The 2016 Annual Ocean, Harbor and Bay Water Quality Report provides an updated analysis of bacteriological water quality data for Orange County’s recreational waters and includes data on sewage spills and related ocean, harbor and bay water closures. The annual report also describes year-to-year variability and trends representing the 17-year period (2000 – 2016) that Assembly Bill 411 (AB 411) Ocean Water-Contact Sports Standards for bacteriological water quality have been in place. In addition, the annual report incorporates historical sewage spill and associated ocean, harbor and bay water closure information during the most recent 30-year period from 1987 – 2016.
Major findings of the 2016 Annual Ocean, Harbor and Bay Water Quality Report: Sewage Spills and Ocean, Harbor and Bay Water Closures
• The total number of sewage spills reported to the Ocean Water Protection Program in 2016 was 129, continuing a steady decline and down 68.3% from the peak record of 408 spills set in 2002.
• During 2016, the total number of sewage spills resulting in beach closures (9) remained 52.6% below the 30-year average of 19 beach closures per year.
• The total number of Beach Mile Days (BMD’s) due to sewage spill closures was 14.0 and is 33% below the 18-year average of 27.4 BMD’s from 1999 through 2016.

• Pipeline blockages continue to be responsible for the majority of sewage spills resulting in beach closures. Since 1999, blockages have resulted in 61.5% of all closures and over half of these blockages (56.2%) were caused by infiltration of roots or deposition of grease.
Posted Warnings Due to Bacteriological Standards Violations
• Total Beach Mile Days posted due to bacteriological water quality standards violations during the AB 411 period (April 1 to October 31) were 29.1 which is 92% below the record high of 366 recorded in 2002. The continuing trend of record lows over the last 4 years is likely due to drought and less runoff impacting the beach.
• The new South County Unified Regional Monitoring Plan completed its second AB 411 monitoring season (April 1 to October 31). This new regional monitoring plan was implemented at south county beaches in April 2015 and requires “point zero” monitoring at locations where urban runoff physically enters the ocean. Second year monitoring results during the AB 411 period showed 15 out of the 28 point zero stations were in 100% compliance with state ocean water health standards. See Appendix 6 for additional information about point zero monitoring results.
• During the summer of 2016, HCA/Environmental Health continued collaborating with Stanford University and Heal the Bay on a Predictive Modeling pilot study. One of the three chosen pilot locations in Southern California was at San Juan Creek in Doheny State Beach. The pilot used a computer model to determine if water quality at selected beach locations would exceed state health standards on any given day to determine if the beach should be posted. A continuation of the pilot study is planned for the 2017 AB 411 period.
• Thirteen (13) Rain Advisories were posted during 2016 for a total of 51 days and represents a 25% increase over the previous 3-year ’s drought-impacted average of 38 days. The current number is still 18% below the (pre drought) average of 62 days and may continue to contribute to better water quality due to less urban runoff flowing to the ocean.
2016 Annual Ocean, Harbor & Bay Water Quality Report - Page V
Surfing Dog
Ocean Water Protection Program
staff responds on a 24-hour basis to investigate any reports of sewage or other potential contamination incidents …

2016 Annual Ocean, Harbor & Bay Water Quality Report - Page VI
“


2016 Annual Ocean, Harbor & Bay Water Quality Report - Page VII

2016 Annual Ocean, Harbor & Bay Water Quality Report - Page VIII
Seagull Newport Beach
THE OCEAN WATER PROTECTION PROGRAM
As part of the County of Orange Health Care Agency, the Environmental Health Ocean Water Protection Program is responsible for protecting the public from exposure to ocean and bay waters that may be contaminated with sewage or may cause illness along Orange County’s 42 miles of open ocean coastline and 70 miles of harbor and bay frontage. Ocean and bay waters used for body-contact recreational activities such as swimming, surfing and diving must meet specific bacteriological water quality standards to be considered safe for such purposes.
In 2016, the Health Care Agency (HCA), the Orange County Sanitation District (OCSD), the South Orange County Wastewater Authority (SOCWA) and OC Public Works (OCPW) cooperatively tested the coastal waters in Orange County for bacteria that indicated the possible presence of disease-causing organisms. Staff from HCA’s Ocean Water Protection Program, OCSD, SOCWA and OCPW participated in the weekly collection of water samples at 140 ocean, harbor and bay monitoring locations throughout coastal Orange County. Last year, over 8100 ocean, harbor, and bay water samples were collected and approximately 24,586 analyses were performed to determine the results for three indicator bacteria used for compliance purposes (i.e., total coliform, fecal coliform and enterococcus).
The Ocean Water Protection Program staff review the bacteriological sample results daily and will issue ocean, harbor and bay water closures, postings and health advisories under the
requirements stipulated by the California Health and Safety Code and Title 17 of the California Code of Regulations. When the results of testing indicate that one or more of the AB 411 Ocean Water-Contact Sports Standards have been exceeded, the public is notified, signs are posted at the beach, and the monitoring frequency and locations may increase until the sample results meet established standards and/or the source of the contamination is eliminated. In addition, Ocean Water Protection Program staff respond on a 24hour basis to investigate any reports of sewage or other potential contamination incidents that may affect public health at any of Orange County’s ocean, harbor and bay water areas.
The Ocean Water Protection Program maintains an Ocean, Harbor and Bay Water Posting and Closure web page, telephone hotline and social media account (Twitter), which provides current information regarding Orange County beach closures, posted warnings and advisories. The telephone hotline and web page are immediately updated and a Twitter message is sent when a change of status occurs at any ocean, harbor or bay water area in Orange County.
Ocean, Harbor and Bay Water Closure & Posting Telephone Hotline: (714) 433-6400

Ocean, Harbor and Bay Water Closure & Posting Web Page: www ocbeachinfo com
Tweeter: http://twitter com/ochealth
2016 Annual Ocean, Harbor & Bay Water Quality Report - Page 1
Newport Beach
Ocean Water-Contact Sports Standards – Assembly Bill 411 (AB411)
In 1998, AB 411 (Wayne) was chaptered into law and added Sections 115880-115915 to the California Health and Safety Code. The law authorized the creation of bacteriological ocean water quality standards that are considered protective of public health (California Code of Regulations Sections 7956-7962).
The standards are informally called “AB 411 standards” and include the following:
• Required testing of the waters adjacent to all ocean and bay public beaches for total coliforms, fecal coliforms and enterococci bacteria that may indicate the presence of possible disease-causing bacteria, viruses or protozoa.
• Required maintenance and updates of the Ocean, Harbor and Bay Posting and Closure Hotline.
• Established single sample standards for total coliforms, fecal coliforms and enterococci bacteria which shall not exceed:
• Total Coliforms: 10,000 organisms per 100 milliliter sample.
• Fecal Coliforms: 400 organisms per 100 milliliter sample.
• Enterococci: 104 organisms per 100 milliliter sample.
• Fecal Coliform to Total Coliform ratio: >1,000 total coliforms if ratio exceeds 0.1.
• Established 30-day geometric mean standards (of five weekly samples) for total coliforms, fecal coliforms and enterococci bacteria which shall not exceed:
• Total Coliforms: 1,000 organisms per 100 milliliter sample.
• Fecal Coliforms: 200 organisms per 100 milliliter sample.
• Enterococci: 35 organisms per 100 milliliter sample.
• When any waters adjacent to a public beach fail to meet any of the standards described above, the local health officer shall post signs on the beach to restrict access to the affected waters.
• Weekly testing is required from April 1 to October 31 if the following applies:
• The beach is visited by more than 50,000 people annually.

• The beach is located in an area adjacent to a storm drain that flows in the summer.
• In the case of a known release of sewage into ocean or bay waters adjacent to a public beach, the local health officer is required to:
• Immediately close the affected ocean or bay waters until the source of the sewage is eliminated.
• Collect bacterial samples from the affected waters.
• Continue the closure until testing results of water samples meet the established standards.
2016 Annual Ocean, Harbor & Bay Water Quality Report - Page 2
Seagulls on beach
Disease-Causing Microorganisms
Contaminated runoff and untreated sewage released into ocean and bay waters may result in swimmer exposure to pathogenic bacteria, viruses or protozoa. These disease-causing microorganisms may be present at or near the sites where discharges enter the water.

The following table lists the types of microorganisms and the diseases (or symptoms) they may cause.
PATHOGENIC AGENT DISEASE
Bacteria
Escherichia coli (E. coli)
Salmonella (not typhi)
Some strains of Shigella
Protozoa (Intestinal Parasites)
Cryptosporidium
Gastroenteritis
Gastroenteritis, usually with fever; less commonly septicemia (generalized infection - organisms multiply in the bloodstream)
Gastroenteritis, usually with fever
Diarrhea – Cryptosporidiosis
Giardia lamblia Diarrhea – Giardiasis
Viruses
Rotavirus Gastroenteritis
Enteroviruses Respiratory infection, rash, fever, meningitis
Norwalk and Norwalk-like viruses
Gastroenteritis
Adenovirus Respiratory infection and gastroenteritis
Hepatitis A (outbreaks associated with eating shellfish from sewage-contaminated water)
Infectious hepatitis (liver malfunction)
The levels of bacteria, viruses and protozoa typically decrease in ocean and bay waters over time due to the following reasons:
• Die off due to sun (ultraviolet exposure), salt water or age.
• Predation by other organisms.
• Dispersion and dilution.
2016 Annual Ocean, Harbor & Bay Water Quality Report - Page 3
Shaw’s Cove at Sunset Laguna Beach
Indicator Bacteria Testing Methods
The detection and enumeration of disease-causing organisms (pathogens) identified with waterborne illness is difficult, time-consuming and costly. Thus, most water quality laboratories are required to test for fecal indicator bacteria (i.e., total coliforms, fecal coliforms and enterococci) as a means to ascertain the likelihood that human pathogens may be present in recreational waters. Fecal indicator bacteria normally occur in the intestines of all warm-blooded animals, are excreted in high numbers in feces, but can also be found in soil and decaying vegetation. Since there is no ideal indicator group, testing is done for more than one indicator. Total coliforms are a broad group of organisms that include fecal coliform bacteria as well as E. coli The enterococci group has been determined to be a good indicator of water-contact associated gastroenteritis. The methods most commonly used to detect fecal indicator bacteria in water include:
• Membrane Filtration (MF)
• Multiple-Tube Fermentation (MTF)
• Colilert®
• Enterolert®
All of the methods are culture based, which means that the indicator bacteria present in water must be allowed to grow in order to be detected. Differences between the methods include how the bacteria are detected and counted, how soon the results become known, and cost. Each method has its advantages and disadvantages. Most of the limitations depend on factors such as the other types of constituents in the water and density of bacteria present, and all require at least an 18-hour incubation period. The following is a brief summary of the Membrane Filtration method, the method used by the County of Orange Health Care Agency/Public Health Laboratory, the South Orange County Wastewater Authority Laboratory and the Orange County Sanitation District Laboratory for the analyses of total coliforms, fecal coliforms and enterococci in ocean and bay waters. Detailed descriptions for the Membrane Filtration (MF), MultipleTube Fermentation (MTF), Colilert® and Enterolert® methods are available in the latest edition of Standard Methods for the Examination of Water and Wastewater.
Membrane Filtration (MF)
The Membrane Filtration method involves filtering water through a porous membrane to concentrate or trap bacteria from the water sample on the filter surface. The membrane filter is placed onto a culture medium designed to encourage the growth of the target indicator. The filter is incubated for 22–24 hours to allow the bacterial cells to multiply into visible colonies. Theoretically, each bacterial cell (or clump of cells) produces a single colony on the membrane.
The colonies are viewed under a 10X magnifying lens and distinguished from non-target bacteria based on the type, size and color of the colonies. Target bacteria are indicated by pigment production resulting from bacterial enzymatic reactions to specific substrates. The number of colonies present in 100 milliliters of water, also known as “Colony Forming Units” (CFUs), is counted and the concentration of organisms in the original sample is calculated.


2016 Annual Ocean, Harbor & Bay Water Quality Report - Page 4
Total Coliform Colonies
Fecal Coliform Colonies
Enterococcus Colonies
Public Notification and Risk Communication
Public notification and risk communication is a critical component of the Ocean Water Protection Program. Public awareness and enhancing the capacity for informed personal choice are important factors in ensuring public health protections are provided to recreational water users. The Ocean Water Protection Program has established and maintains an integrated management system to inform the public of the potential health risks associated with water contact activities in coastal recreational waters that do not meet applicable water quality standards. Multiple communication measures are promptly taken to notify the public when ocean, harbor or bay water areas do not meet or are expected not to meet AB 411 Ocean Water-Contact Sports Standards. The Ocean Water Protection Program implements the following types of public notification measures to communicate information regarding beach water quality and to protect the health of beach users:
• Beach Signs – Signs are posted to notify beach users of the current status of the ocean, harbor or bay water area. Posted beach signs are located where they are most likely to be noticed by beach users and provide a visual notice at the point of ocean water access.
• Telephone Hotline – The Ocean, Harbor and Bay Water Closure & Posting Telephone Hotline has been established to inform the public about all beaches that are currently closed, posted with a health warning or when a rain advisory has been issued. The telephone hotline message is immediately updated when a change in the status of beach closures, postings or advisories occur. The Ocean, Harbor and Bay Water Closure & Posting Telephone Hotline is (714) 433-6400.
• Web Page – The Ocean, Harbor and Bay Water Closure & Posting Web Page has been developed and is used to report beach closures, postings and rain advisories. The web page is updated immediately when the status of the closure, posting or advisory changes. The Ocean, Harbor and Bay Water Closure & Posting Web Page internet address is www.ocbeachinfo.com
• Social Media – Public notification of ocean water quality status changes are communicated to the public through the social media network of Twitter. Follow us on Twitter at http://twitter.com/ochealth for water quality updates as they occur.
• Press Releases – Public notification of a beach closure or rain advisory is provided in a press release issued by the Health Care Agency The press release will indicate whether a closure or rain advisory is being issued, the reason for the closure or advisory, the area affected and the anticipated duration of the closure or advisory.
• Annual Reports – To assess the health of the ocean, harbor and bay waters being monitored, the Ocean Water Protection Program compiles an annual report of the beach closures, postings and advisories after the year has ended. The Annual Ocean, Harbor and Bay Water Quality Report provides an updated analysis of bacteriological water quality, describes year-to-year variability and trends for Orange County’s recreational waters, and includes data on sewage spills and beach closures. Annual Reports from 2002 to present can be viewed and downloaded from the Ocean, Harbor and Bay Water Closure & Posting Web Page at www.ocbeachinfo.com
2016 Annual Ocean, Harbor & Bay Water Quality Report - Page 5
Current information about OC water conditions is available at www.ocbeachinfo.com, Twitter and the Closure & Posting Telephone Hotline. “
Closure and Warning Signs
The yellow closure sign is posted when a sewage spill affects ocean or bay waters adjacent to a public beach. This sign is also available in Spanish.


The warning sign with the red and black border is posted when a violation of the AB 411 Ocean WaterContact Sports Standards occurs.
The warning sign with the yellow and black border is permanently posted near storm drains, creeks and rivers to advise the public of the risks associated with possible contamination from urban runoff and confirmed violations of the AB 411 Ocean WaterContact Sports Standards where runoff physically enters the ocean at the receiving zone. The receiving zone is considered to be from 75 feet upcoast to 75 feet downcoast of the flowing drain, creek or river.

2016 Annual Ocean, Harbor & Bay Water Quality Report - Page 6
Beach Mile Days (BMD)
The term “Beach Mile Days” is used to represent the measurement of the number of days and the linear area of ocean, harbor or bay front waters that are closed due to a sewage spill or posted for a violation of the AB 411 Ocean Water-Contact Sports Standards.
Beach Mile Days (BMD) are calculated by multiplying the number of days of a closure or posting by the number of miles of beach closed or posted:

(Number of Days) x (Miles of Beach Closed/Posted) = Beach Mile Days
For example, if a sewage spill resulted in the closure of ½ mile of beach for 7 days then: (7 days) x (0.5 miles of beach closed) = 3.5 Beach Mile Days of closure
Another example, if 300 feet of beach is posted for a violation of the AB411 Ocean Water-Contact Sports Standards for 5 consecutive days, then: (5 days) x (0.06 miles of beach posted) = 0.3 Beach Mile Days of posting
Using BMD as a measurement of ocean and bay water availability is more meaningful than using the number of incidences or the number of days since BMD take into account both the length of beach and number of days for a closure or posting. The State of California Water Resources Control Board and all California coastal counties use BMD for reporting closures and postings which provides a standardized measurement that allows comparison of different areas (beach to beach or county to county) and the assessment of closure and posting trends over time.
2016 Annual Ocean, Harbor & Bay Water Quality Report - Page 7
with innertubes
Beach fun
SEWAGE WASTE DISCHARGES
Sewage waste discharges commonly known as “sewage spills” occur when wastewater being transported via underground pipes overflows through a manhole, clean-out drain or broken pipe. Sewage spills can cause health hazards, damage to homes and businesses and threaten the environment, local waterways and beaches. Untreated sewage has high levels of disease-causing bacteria and viruses. Orange County Health Care Agency/Environmental Health is responsible for protecting public health by closing ocean, harbor and bay water areas affected by sewage spills and will suspend food-service establishment’s operating permit if a sewage spill poses a threat to public health.
Common Causes of Sewage Spills:
Grease builds up inside and eventually blocks sewer pipes. Grease gets into the sewer from food establishments, household drains, as well as from poorly maintained commercial grease traps and interceptors.
Infrastructure problems caused by tree roots in the lines, broken/cracked pipes, missing or broken cleanout caps or undersized sewers can cause blockages.
Infiltration and inflow impacts pipe capacity and is caused when groundwater or rainwater enters the sewer system through pipe defects and illegal connections.
Local and state agencies have legal jurisdiction and enforcement authority to ensure sewage spills are remediated. Allowing sewage to discharge from a home, business or public property may subject the responsible party to penalties and/or out-of-pocket costs to reimburse local and state agencies for clean-up efforts and for not reporting the sewage spill. As mandated by the California Health and Safety Code, any person who causes or permits a sewage discharge to any state waters must immediately notify the local health agency of the discharge.
If you see a sewage spill occurring, immediately notify your City Sewer/Public Works Department or Public Sewer District

2016 Annual Ocean, Harbor & Bay Water Quality Report - Page 8
Upper Newport Bay Newport Beach
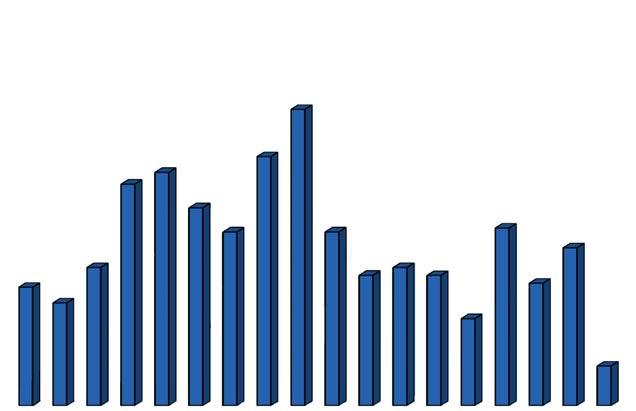
The number of sewage discharges reported to the Orange County Ocean Water Protection Program by sanitation districts, cities that operate sewage collection systems and private property owners from 19872016 is detailed in the following graph. The total number of sewage spills reported in 2016 represents the thirteenth consecutive year a decrease in the total number of sewage spills has been reported.

63 83 59 75 100 114 94 120 115 123 158 224 245 340 387 408 399 374 367 341 293 266 208 188 181173 168 158 133 129 1987 1988 1989 1990 1991 1992 1993 1994 1995 1996 1997 1998 1999 2000 2001 2002 2003 2004 2005 2006 2007 2008 2009 2010 2011 2012 2013 2014 2015 2016 0 50 100 150 200 250 300 350 400 450 Year Spills Reported Number of Sewage Spills Reported 1987 - 2016 (Excluding Tertiary Recycled Water Spills) 2016 Annual Ocean, Harbor & Bay Water Quality Report - Page 9
Number of Sewage Waste Discharges Reported 1987 - 2016
Health
Beach Jogger
Source: Orange County Health Care Agency/Environmental
The following chart depicts the percentage of sewage spills due to overflows from privately owned sewage systems (e.g. residential homes, apartment/condominium complexes, strip malls, etc.) reported each year from 1999 - 2016. In 2016, privately owned sewage systems were responsible for 41% of all sewage waste discharges reported in Orange County.

19992000 2001 2002 2003 2004 2005 2006 2007 2008 2009 2010 2011 2012 2013 2014 2015 2016 0 10 20 30 40 50 60 70 80 90 100 Percent of Private Property Owner Sewage Spills 1999 - 2016 Year Percent 20% 26% 29% 38% 37% 39% 52% 54% 54% 49% 50% 43% 37% 48% 43% 33% 41%41% 2016 Annual Ocean, Harbor & Bay Water Quality Report - Page 10
Private Property Owner Sewage Spills 1999 – 2016
Enjoying a Beach Walk
Source: Orange County Health Care Agency/Environmental Health
Sewage Waste Discharge Causes 1999 - 2016

The percentage of sewage spills caused by pipeline blockages from 1999 – 2016 is detailed in the following graph. The percentage of sewage spills caused by pipeline blockages continues to be the leading cause of sewage waste discharges.
The following graph depicts the percentage of sewage spills caused by pipeline breaks from 1999 – 2016. The percentage of sewage spills caused by pipeline breaks continues to trend at its lowest levels during the 18-year period from 1999 - 2016.
14% 14% 27% 15% 18% 25% 23% 25% 24% 28%28% 8% 8% 7% 6% 8% 0% 8% 1999 2000 2001 2002 2003 2004 2005 2006 2007 2008 2009 2010 2011 2012 2013 201420152016 0 10 20 30 40 50 60 70 80 90 100 Year Percent Percent
1999
76% 76% 75% 78% 67% 66% 60% 61% 57% 56% 53% 71% 81% 80% 87% 78% 80% 92% 1999 2000 2001 2002 2003 2004 2005 2006 2007 200820092010 20112012 2013 2014 20152016 0 10 20 30 40 50 60 70 80 90 100 Year Percent
1999
2016 Annual Ocean, Harbor & Bay Water Quality Report - Page 11
of Sewage Spills Caused by Pipeline Breaks
- 2016
Percent of Sewage Spills Caused by Pipeline Blockages
- 2016
Orange
Health Care Agency/Environmental
Source: Orange County Health Care Agency/Environmental Health
Seagull on Pier Huntington Beach
Source:
County
Health

13% 14% 19% 13% 15% 13% 7% 14% 19% 17% 11% 16% 9% 12% 13% 9% 7% 8% 10% 7% 4% 7% 3% 9% 3% 5% 7% 10% 8% 9% 1987 1988 1989 1990 1991 1992 1993 1994 1995 1996 1997 1998 1999 2000 2001 2002 2003 2004 2005 2006 2007 2008 2009 2010 2011 2012 2013 2014 2015 2016 0 10 20 30 Year Percent Percentage of Sewage Spills Resulting in Ocean, Harbor and Bay Water Closures 1987 - 2016 (Excluding Tertiary Recycleed Water Spills) 2016 Annual Ocean, Harbor & Bay Water Quality Report - Page 12 Percent of Sewage Waste Discharges Resulting in Closures 1987 - 2016
percentage of sewage spills reported that resulted in an ocean, harbor, or bay water closure from 1987 –2016
graph.
2016, seven percent (7%) of the sewage waste discharges resulted in
ocean water closure which
10.4% annual average rate since 1987.
The
is shown in the following
In
an
is below the
Shore Birds
Source: Orange County Health Care Agency/Environmental Health
Bolsa Chica Ecological Reserve, Huntington Beach
OCEAN, HARBOR AND BAY WATER CLOSURES DUE TO SEWAGE SPILLS
When a known release of sewage is reported to the Ocean Water Protection Program, the ocean or bay water areas that may be affected by the sewage discharge are immediately closed to water-contact recreational activities. The closure area is based on many factors including type of sewage (e.g., untreated, secondary treated, etc.), volume of spill, location of spill, ocean currents and tides, historical sewage spills in the area and other pertinent information. After the initial closure area is established, the appropriate agencies are notified, the area is posted with closure signs, a press release is issued, the Ocean, Harbor and Bay Water Closure & Posting Telephone Hotline, Web Page and Twitter account are updated with the beach closure information, and daily bacterial sampling of the affected area is initiated.
The closed ocean or bay water area will be reopened or reduced in size when the contamination source has been eliminated and after two daily consecutive sampling results indicate the affected area meets the AB 411 Ocean Water-Contact Sports Standards.
The Ocean, Harbor and Bay Water Closure and Posting Telephone Hotline, web page and Twitter account provide the current status information for beach closures and are immediately updated when a change of status occurs. In addition, detailed information regarding Orange County beach closure events from 1999 to the present can be viewed and downloaded from the web page.
Ocean, Harbor and Bay Water Closure & Posting Telephone Hotline: (714) 433-6400
Ocean, Harbor and Bay Water Closure & Posting Web Page: www.ocbeachinfo.com.
Twitter: http://twitter.com/ochealth
2016 Annual Ocean, Harbor & Bay Water Quality Report - Page 13
Total Number of Closures Due to Sewage Spills 1987 - 2016
The total number of ocean, harbor and bay water closures in Orange County due to sewage spills from 19872016 is summarized in the following graph. The number of sewage spill closures continues to remain below the 30-year average of 19 closures per year.
Number of Ocean, Harbor and Bay Water Closures Due to Sewage Spills 1987 - 2016

8 12 11 10 15 15 7 17 22 21 17 35 20 40 51 37 30 27 24 12 18 6 17 36 6 9 11 16 9 10 1987 1988 1989 1990 1991 1992 1993 1994 1995 1996 1997 1998 1999 2000 2001 2002 2003 2004 2005 2006 2007 2008 2009 2010 2011 2012 2013 2014 2015 2016 0 10 20 30 40 50 60 Year Closures
2016 Annual Ocean, Harbor & Bay Water Quality Report - Page 14
Source: Orange County Health Care Agency/Environmental Health
Little Corona Beach Newport Beach
20 40 51 37 27 30 36 24 12 18 6 17 6 9 11 16 10 9 1999 2000 20012002 2003 2004 2005 20062007 2008 2009 2010 2011 2012 2013 201420152016 0 10 20 30 40 50 60 Year Number of Closures Total Number of Closures 1999 - 2016 0 10 20 30 40 50 60 70 80 100 90 51.0 52.0 59.1 18.5 15.1 13.5 74.0 15.3 2.0 30.2 6.3 67.5 12.9 6.0 11.1 25.3 18.9 14.0 1999 2000 2001 2002 2003 2004 2005 2006 2007 20082009 20102011 2012 20132014 20152016 Year Number of Days Total Number of Beach Mile Days 1999 - 2016 145 151 175 123 79 87 124 61 33 60 18 64 14 29 32 52 30 34 1999 2000 2001 2002 2003 2004 2005 2006 2007 2008 200920102011 2012 2013 2014 20152016 0 50 100 150 200 250 Year Number of Days Total Number of Closure Days 1999 -
2016 Annual Ocean, Harbor & Bay Water Quality Report - Page 15
Total Number of Closures, Closure Days and Beach Mile Days 1999 - 2016 Source: Orange County Health Care Agency/Environmental Health Source: Orange County Health Care Agency/Environmental Health Source: Orange County Health Care Agency/Environmental Health
2016
The following graphs depict the total number of closures, total number of closure days and total number of Beach Mile Days of closure due to sewage spills in Orange County. In 2016, the total number of Beach Mile Days of closure was 14 days and continues to remain below the 18-year average of 27.4 days for the period 1999 – 2016.


Pump Station Failures (8.4%) Pipeline Blockages (61.5%) Pipeline Breaks (12.7%) Vessel Pump Stations
Treatment Plant Discharges (1.6%)
of
Closures
2016 Annual Ocean, Harbor & Bay Water Quality Report - Page 16
Spill
(11.9%)
Miscellaneous (3.2%) Causes
Ocean, Harbor and Bay Water
1999 - 2016
The following chart illustrates that sewage system pipeline blockages caused the majority (61.5%) of all ocean, harbor and bay water closures in Orange County for the 18-year period from 1999 - 2016. Sewage
Closure Causes 1999 - 2016
Sea Lion Source: Orange County Health Care Agency/Environmental Health
Basking


Unknown 21.3% Grease 24.3% Miscellaneous 6.6% Debris 14.7% Vandalism 1.2% Roots 31.9%
of Pipeline
Causing Ocean,
and Bay Water Closures 1999 - 2016 2016 Annual Ocean, Harbor & Bay Water Quality Report - Page 17
Types
Blockages
Harbor
The infiltration of roots and deposition of grease into sewer pipes accounted for a majority
the pipeline blockages that resulted in ocean, harbor and bay water closures in Orange County
2015.
Types of Pipeline Blockages Causing Closures 1999 - 2016
(56%) of
for the 17-year period from 1999 –
Source: Orange County Health Care Agency/Environmental Health
Surfing Lesson
Closures Due to Private Property Owner Sewage Spills 1999 - 2016

The percentage of ocean, harbor and bay water closures that were due to private property owner sewage system spills for the 18-year period from 1999 – 2016 is shown in the following chart. Of the 9 ocean water closures that occurred in 2016, only one closure was due to a private property owner sewage spill which accounted for 10% of all ocean, harbor and bay water closures for the year.
35% 26% 44% 75% 33% 33% 63% 50% 59% 56% 30% 35% 22% 45% 31% 40% 44% 10% 1999 2000 2001 200220032004 20052006200720082009 2010 2011 2012 2013 2014 2015 2016 0 10 20 30 40 50 60 70 80 90 100 Percent Year
of Ocean,
and Bay Water Closures Due to Private Property Owner Sewage Spills 1999 - 2016 2016 Annual Ocean, Harbor & Bay Water Quality Report - Page 18
Percent
Harbor
Source: Orange County Health Care Agency/Environmental Health
Tall Ship at Sunset Dana Point

2016 Annual Ocean, Harbor & Bay Water Quality Report - Page 19
Stairs to Beach Laguna Beach
OCEAN, HARBOR AND BAY WATER POSTINGS DUE TO BACTERIOLOGICAL STANDARDS VIOLATIONS
Upon implementation of the AB 411 Ocean Water-Contact Sports Standards in July of 1999, the Ocean Water Protection Program began posting the required health warning signs at public beaches where the ocean, harbor or bay waters failed to meet state mandated recreational water quality standards.
From April 1 to October 31 bacteriological water samples are collected a minimum of once a week at approximately 140 ocean, harbor and bay locations throughout Orange County. Sample results are reviewed daily by the Ocean Water Protection Program to determine compliance with the seven AB 411 bacteriological standards established by the State of California. Each year the Ocean Water Protection Program reviews bacteriological results of approximately 3800 ocean, harbor and bay water samples collected from April 1 to October 31.
When a bacteriological water sample fails to meet an AB 411 Ocean Water-Contact Sports Standard, the following actions are taken:
• Warning signs are posted at the affected ocean, harbor or bay water area indicating that bacteria levels have exceeded health standards and ocean water contact may cause illness.
• The information regarding the posted area is updated on the Ocean, Harbor and Bay Water Closure and Posting Hotline at (714) 433-6400, Web Page at www.ocbeachinfo.com and by Twitter at http://twitter. com/ochealth
• Follow-up bacteriological water samples are collected at the posted location and the results are evaluated daily to determine if the posted area should be increased, reduced, shifted or removed.
Because ocean, harbor or bay water areas that violate the AB 411 Ocean Water-Contact Sports Standards may cause illness to recreational water users, the Ocean Water Protection Program staff recommends staying out of the water at all beach areas that are posted with the health warning sign shown below.
2016 Annual Ocean, Harbor & Bay Water Quality Report - Page 20
Total Number of Posted Warnings, Posting Days and Beach Mile Days 20002016
As required by the California Health and Safety Code Section 115910, violations of the AB 411 Ocean WaterContact Sports Standards between April 1 and October 31 must be reported to the California State Water Resources Control Board by all California coastal counties on a monthly basis. The information provided in this section is the data reported to the California State Water Resources Control Board beginning with the year 2000, the first calendar year that the AB 411 Ocean Water-Contact Sports Standards were in place.

The total number of posted warnings, total number of posting days and total number of Beach Mile Days that were posted due to AB 411 standards violations between April 1 and October 31 for all Orange County ocean, harbor and bay water areas are shown in the following table:
YEAR
POSTED WARNINGS
POSTING DAYS
BEACH MILE DAYS
2000 199 2,123 362.8 2001 208 2,454 282.4 2002 308 2,456 366.0 2003 160 1,732 247.5 2004 141 1,877 196.8 2005 102 1,512 197.6 2006 183 1,381 177.4 2007 116 1,037 139.0 2008 121 857 132.2 2009 109 791 135.6 2010 102 843 87.6 2011 114 855 164.4 2012 119 1,135 178.6 2013 87 458 34.6 2014 115 637 35.4 2015 109 674 36.2 2016 74 662 29.1
2016 Annual Ocean, Harbor & Bay Water Quality Report - Page 21
Crescent Bay Laguna Beach
The total number of Beach Mile Days that were posted due to AB 411 standards violations between April 1 and October 31 from 2000 – 2016 is detailed in the following graph. The total number of Beach Mile Days posted in 2016 (29.1) is the lowest on record. The recent lower trend of posted Beach Mile Days is due to drought conditions and less urban runoff flowing to the ocean.

362.8 282.4 366.0 247.5 196.8 197.6 177.4 139.9 132.2 135.6 87.6 164.0 178.6 34.6 35.4 36.2 29.1 2000 2001 2002 2003 2004 2005 20062007 2008 2009 2010 20112012 2013 2014 2015 2016 0 50 100 150 200 250 300 350 400 Year Beach Mile Days Total Number of Beach Mile Days Posted 2000 -
(April
-
2016 Annual Ocean, Harbor & Bay Water Quality Report - Page 22
2016
1
October 31)
Total Number of Beach Mile Days Posted 2000 – 2016
Source: Orange County Health Care Agency/Environmental Health California Sea Lion
OCEAN, HARBOR AND BAY WATER RAIN ADVISORIES
During and after a significant rainstorm event, storm drains, creeks and rivers carry floodwaters with urban runoff into local ocean, harbor and bay waters. Urban runoff may include fertilizers, road oils, litter and large amounts of bacteria from a variety of sources, such as animal waste and decomposing vegetation.
The levels of bacteria can rise significantly in ocean and bay waters close to discharging storm drains and outlets of creeks, rivers and streams during and after rainstorms. To ensure that public health and safety is protected, the Ocean Water Protection Program staff advises against body-contact recreational use of ocean, harbor or bay waters where there may be contamination due to storm water carrying urban runoff. The elevated bacterial levels in ocean, harbor and bay waters may continue for a period of at least three days depending on the intensity of the rain and the volume of runoff.
Swimmers, surfers and divers should avoid body-contact recreation with Orange County’s ocean, harbor and bay waters during and after a rainstorm event and all beach users should avoid contact with any storm drain or creek runoff on the beach during dry or wet weather conditions.
The Ocean Water Protection Program issues a Rain Advisory during or immediately after a rainstorm event that results in measured rainfall greater than or equal to two-tenths of an inch (0.20”). If multiple rainstorm events occur during the 72-hour window of the previous rainstorm, the existing rain advisory continues for an additional 72 hours. Rain advisory information is provided by issuing a Rain Advisory Press Release to media outlets and on the Ocean, Harbor and Bay Water Closure and Posting Hotline at (714) 433-6400, Web Page at www.ocbeachinfo.com, and by Twitter at http://twitter.com/ochealth

2016 Annual Ocean, Harbor & Bay Water Quality Report - Page 23
Foggy Night Huntington Beach Pier
Swimmers, surfers and divers should avoid body-contact recreation with Orange County’s ocean, harbor and bay waters during and after a rainstorm event.

2016 Annual Ocean, Harbor & Bay Water Quality Report - Page 24
Rainbow after a storm Laguna Beach
“

2016 Annual Ocean, Harbor & Bay Water Quality Report - Page 25
Sunet at Newport Beach

55 74 44 54 65 63 75 48 54 38 98 64 68 39 35 40 51 2000 2001 2002 2003 2004 2005 2006 2007 2008 2009 2010 20112012 2013 2014 2015 2016 0 20 40 60 80 100 120 Year Number of Days
Number of Rain
Days 2000
2016 2016 Annual Ocean, Harbor & Bay Water Quality Report - Page 26
Source: Orange County Health Care Agency/Environmental Health
Total
Advisory
-
Total Number of Rain Advisory Days 2000 - 2016 The following graph depicts the total number of rain advisory days issued for ocean, harbor and bay waters from 2000 - 2016. In 2016, Orange County experienced a total of 51 rain advisory days. The average number of rain advisory days during the 17-year period from 2000 to 2016 is 57 days per year. Surfer throwing up some spray San Clemente

Rain Advisory Days Beach Closures 40 51 37 27 30 36 24 12 18 6 17 55 74 44 54 65 63 75 48 54 38 98 64 6 9 11 16 10 9 68 39 35 40 54 2000 2001 2002 2003 2004 2005 2006 2007 2008 2009 2010 2011 2012 2013 2014 2015 2016 0 20 40 60 80 100 120 Year Number of Advisory Days vs. Closures Number of Rain Advisory Days and Sewage Spill Beach Closures 2000 - 2016 2016 Annual Ocean, Harbor & Bay Water Quality Report - Page 27 Number of Rain Advisory Days and Sewage Spill Beach Closures 2000 - 2016
rain
days
increase
decrease
The following graph compares the total number of
advisory days to the total number of sewage spill beach closures from 2000 to 2016. The increase or decrease in the total number of rain advisory
from year to year generally correlates with an
or
in the total number of sewage spill beach closures.
Source: Orange County Health Care Agency/Environmental Health
Sunset over Crescent Bay Laguna Beach

2016 Annual Ocean, Harbor & Bay Water Quality Report - Page 28
Beach Rocks
Ocean, Harbor and Bay Rain Advisories 2000 - 2016
2016 Annual Ocean, Harbor & Bay Water Quality Report - Page 29
below are the total number of rain advisory days for each year and the dates that the ocean, harbor and bay water rain advisories were in effect for Orange County from 2000 - 2015.
2000 (55 Total Rain Advisory Days) January 25 – February 2 February 28 – March 13 October 11 – October 15 February 10 – February 16 April 17 – April 23 October 27 – November 2 February 17 – February 27 September 23 – September 25
Listed
YEAR
Rain
January 8 – January 16 April 7 – April 13 November 29 – December 6 January 24 – January 31 April 21 – April 24 December 14 – December 18 February 10 – February 16 November 12 – November 16 December 21 – December 25 February 20 – March 13 November 24 – November 27 December 30 – December 31
2002 (44 Total Rain Advisory Days) January 1 – January 3 March 7 – March 11 November 8 – November 13 January 1 – January 3 March 18 – March 21 November 30 – December 3 February 17 – February 21 March 23 – March 27 December 16 – December 31
YEAR 2001 (74 Total
Advisory Days)
YEAR
Rain Advisory Days) January 1 – January 2 April 14 – April 18 December 8 – December 11 January 8 – January 12 May 3 – May 7 December 15 – December 18 February 11 – February 17 July 30 – August 3 December 25 – December 28 February 25 – March 2 November 1 – November 7 March 15 – March 19 November 13 – November 19
2004 (65 Total Rain Advisory Days) January 2 – January 6 April 17 – April 20 November 21 – November 25 February 3 – February 6 October 17 – October 24 November 27 – December 1 February 18 – March 6 October 26 – November 1 December 5 – December 12 April 2 – April 5 November 8 – November 12 December 28 – December 31 YEAR 2005 (73 Total Rain Advisory Days) January 1 – January 18 March 19 – March 26 October 17 – October 21 January 28 – January 31 April 22 – May 1 November 10 – November 14 February 11 – February 28 May 6 – May 10 December 31 March 5 – March 8 September 20 – September 24 YEAR 2006 (75 Total Rain Advisory Days) January 1 – January 6 April 14 – April 18 December 10 – December 14 February 18 – February 23 April 23 – April 26 December 17 – December 21 February 27 – March 24 May 22 – May 25 December 22 – December 25 March 28 – April 9 October 14 – October 17 December 27 – December 31 YEAR 2007 (48 Total Rain Advisory Days) January 31 – February 6 March 21 - March 23 November 30 - December 4 February 11 - February 16 April 20 - April 25 December 7 - December 12 February 19 - February 26 September 22 - September 25 December 19 - December 24 February 27 - March 2 October 13 - October 16 YEAR 2008 (54 Total Rain Advisory Days) January 4 – January 10 February 14 – February 17 November 4 – November 7 January 22 – February 1 February 21 – February 27 November 26 – December 1 February 3 – February 6 May 22 – May 27 December 15 – December 28
YEAR 2003 (54 Total
YEAR

2016 Annual Ocean, Harbor & Bay Water Quality Report - Page 30 YEAR 2009 (38 Total Rain Advisory Days) January 23 – January 27 March 5 – March 8 December 7 – December 16 February 5 – February 21 October 14 – October 17 December 22 – December 25 YEAR 2010 (98 Total Rain Advisory Days) January 18 – January 30 April 22 – April 25 November 8 – November 11 February 5 – February 13 April 28 – May 1 November 20 – November 27 February 20 - March 10 October 5 – October 10 November 28 – December 1 April 5 – April 8 October 19 – October 24 December 6 – December 9 April 12 – April 15 October 25 – November 2 December 17 – December 31 YEAR 2011 (64 Total Rain Advisory Days) January 1 – January 7 March 20 - March 29 November 4 – November 10 February 16 – February 23 April 9 – April 12 November 12 – November 15 February 26 - March 1 May 17 – May 21 November 20 – November 24 March 7 - March 10 October 4– October 9 December 12 – December 19 YEAR 2012 (68 Total Rain Advisory Days) January 16 – January 19 March 25 - March 29 November 9 – November 12 January 21 – January 27 April 11 – April 17 November 17 – November 20 February 15 – February 18 April 26 – April 29 November 29 – December 6 February 27 - March 2 July 13 – July 16 December 13 – December 21 March 17 - March 21 October 11 – October 15 December 24 – December 31 YEAR 2013 (39 Total Rain Advisory Days) January 24 – January 30 May 6 - May 11 December 7 – December 10 February 8 – February 11 October 9 – October 13 December 19 – December 22 February 20 – February 23 November 21 – November 25 March 8 - March 12 November 29 – December 3 YEAR 2014 (35 Total Rain Advisory Days) February 3 – February 10 April 26 – April 29 December 12 – December 19 February 27 – March 5 November 1 – November 4 April 1 – April 5 December 2 – December 7 YEAR 2015 (40 Total Rain Advisory Days) January 11 – January 15 May 14 - May 18 October 5 – October 8 February 23 – February 26 July 18 – July 22 December 14 – December 17 March 1 – March 5 September 9 – September 12 December 19 – December 25 May 8 - May 11 September 15 – September 18 YEAR 2016 (51 Total Rain Advisory Days) January 55 – January 10 May 6 - May 10 December 16 – December 19 January 31 – February 3 October 17 - October 20 December 21 – December 27 February 18 – February 21 October 24 - October 28 December 30 – December 31 March 6 – March 16 November 21 - November 24 April 10 – April 12 November 26 - November 30 Beach
View from Newport Beach Pier

2016 Annual Ocean, Harbor & Bay Water Quality Report - Page 31
Moonrise over Laguna Beach
APPENDIX 1
Postings by Open Coastal Ocean Water Areas 2000 – 2016
The following tables and graphs provide monitoring information from April 1 to October 31 for each of Orange County‘s open coastal ocean water areas and is arranged geographically from north to south along the Orange County shoreline. The appendix information provided for each open coastal ocean water area includes:
• Sampling agency, sampling frequency, sampling locations and number of beach miles;
• Total number of posted warnings, total number of posted warning days and total number of Beach Mile Days that were posted due to AB 411 standards violations from 2000 - 2016;

• A trend graph depicting the total number of Beach Mile Days that the open coastal water area was posted from 2000 – 2016; and
• The dry weather AB 411 single sample standard compliance rate at each open coastal ocean water sampling location for the 10-year period from 2005 – 2016.
2016 Annual Ocean, Harbor & Bay Water Quality Report - Page 32
Children Playing on Beach
100.0% 99.5% 99.4% 97.1% 95.2% 90.8% 85 90 95 100 Broadway Sea Way 14th St. 8th St. 1st St. 100 Yds. So. of Pier Station Location Percent Sample Station Compliance with AB411 Standards 2005 - 2016 (April 1 - October 31) 3.7 0.4 1.2 0.2 0.4 2.4 0.3 0.5 1.3 0.5 0.9 0.3 2.6 2.2 3.7 0.9 4.5 2000 2001 2002 2003 2004 2005 2006 2007 2008 2009 2010 2011 2012 2013 2014 20152016 0 1 2 3 4 5 Year Beach Mile Days
of Beach Mile Days Posted
2016 Annual Ocean, Harbor & Bay Water Quality Report - Page 33 •
of Posted Warnings, Posting Days and Beach Mile Days
Posted Warnings Posting Days Beach
Days
Source: Orange County Health Care Agency/Environmental Health Source: Orange County Health Care Agency/Environmental Health
Number
2000 -2016 (April 1 - October 31)
SEAL BEACH / SURFSIDE / SUNSET BEACH Sampling Agency: Orange County Sanitation District Sampling Frequency: 1st Street – 2 samples per week; all other locations - 1 sample per week Sampling Locations: 1st Street, 8th Street, 100 yards south of Pier, 14th Street, Sea Way, Broadway Beach Miles: 3.0 miles of open coastal beach Number
(April 1 – October 31) Year
Mile
2000 6 47 3.7 2001 3 6 0.4 2002 5 22 1.2 2003 3 5 0.3 2004 3 18 2.4 2005 1 2 0.1 2006 8 15 0.9 2007 2 8 0.5 2008 4 8 1.3 2009 4 8 0.5 2010 2 5 0.3 2011 2 4 0.3 2012 6 18 2.6 2013 5 11 2.0 2014 20 65 3.7 2015 13 70 4.5 2016 6 14 0.5
5.4 0.1 0.9 0.8 0.1 0.4 0.7 0.6 0.2 0.1 0.1 0.1 0.1 0.5 0.0 0.2 0.1 2000 2001 2002 2003 2004 2005 2006 2007 2008 20092010 2011 2012 2013 2014 2015 2016 0 1 2 3 4 5 6 Year Beach Mile Days Number of Beach Mile Days Posted 2000 - 2016 (April 1 - October 31) 98.4% 99.1% 85 90 95 100 Parking Area #20 Parking Area #14 Station Location Percent Sample Station Compliance with AB411 Standards 2005 - 2016 (April 1 - October 31) 2016 Annual Ocean, Harbor & Bay Water Quality Report - Page 34 Source: Orange County Health Care Agency/Environmental Health Source: Orange County Health Care Agency/Environmental Health • BOLSA
STATE BEACH Sampling Agency: Orange County Sanitation District Sampling Frequency: 1 sample per week Sampling Locations: Parking Area #20, Parking Area #14 Beach Miles: 2.8 miles of open coastal beach Number of Posted Warnings, Posting Days and Beach Mile Days (April 1 – October 31) Year Posted Warnings Posting Days Beach Mile Days 2000 6 12 5.4 2001 1 1 0.1 2002 7 11 0.9 2003 8 14 0.8 2004 1 1 0.1 2005 4 7 0.4 2006 7 13 0.7 2007 3 6 0.6 2008 2 2 0.2 2009 1 1 0.1 2010 1 1 0.1 2011 2 2 0.1 2012 5 9 0.5 2013 0 0
2014 2 2 0.1 2015 4 4 0.2 2016 1 1 0.1
CHICA
0.0
Beach Crowd Huntington Beach
10.1 1.4 1.2 0.8 0.5 0.4 0.9 1.4 0.7 0.5 0.2 1.3 0.1 0.2 0.10.1 0.1 20002001 2002 2003 2004 2005 2006 2007 20082009 2010 2011 20122013 2014 20152016 0 2 4 6 8 10 12 Year Beach Mile Days Number of Beach Mile Days Posted 2000 - 2016 (April 1 - October 31) 98.6% 99.1% 99.6% 98.2% Jack’s Snack Bar Beach Blvd. 17th St. Bluffs 85 90 95 100 Station Location Percent Sampling Station Compliance with AB411 Standards 2005 - 2016 (April 1 - October 31) 2016 Annual Ocean, Harbor & Bay Water Quality Report - Page 35 • HUNTINGTON
Sampling Agency: Orange County Sanitation District Sampling Frequency: 1 sample per week
Locations: Bluffs
Beach), 17
Street,
Bar
Street),
miles
Number of Posted Warnings, Posting Days and Beach Mile Days (April 1 – October 31)
Posted Warnings Posting Days Beach Mile Days
6
10 16
7 14
7 12
4
3 7
4
10 18
7 9
5 7
7
7
3
2
1
Source: Orange County Health Care Agency/Environmental Health Source: Orange County Health Care Agency/Environmental Health
CITY BEACH
Sampling
(Dog
th
Jack’s Snack
(Huntington
Beach Blvd. Beach Miles: 3.5
of open coastal beach
Year
2000
10 10.1 2001
1.4 2002
1.2 2003
0.8 2004
8 0.5 2005
0.4 2006
6 0.9 2007
1.4 2008
0.7 2009
0.5 2009
9 1.3 2010 3 3 0.2 2011
9 1.3 2012 1 1 0.1 2013
3 0.2 2014
2 0.1 2015 1 1 0.1 2016
1 0.1
95.4% 91.0% 91.9% 94.4% 98.6% 85 90 95 100 Brookhurst Magnolia Newland Beach Blvd. Santa Ana River Mouth Station Location Percent Sampling Station Compliance with AB411 Standards 2005 - 2016 (April 1 - October 31) 67.6 14.8 23.8 41.9 10.6 12.1 21.9 61.0 26.2 11.0 8.1 3.4 14.5 2.3 2.3 0.4 1.0 200020012002 2003 2004 2005 2006 2007 2008 2009 2010 2011 2012 2013 2014 20152016 0 10 20 30 40 50 60 70 80 Year Beach Mile Days
of
Mile Days Posted
2016 Annual Ocean, Harbor & Bay Water Quality Report - Page 36 •
Posted Warnings, Posting Days
Posted Warnings
Source: Orange County Health Care Agency/Environmental Health Source: Orange County Health Care Agency/Environmental Health
Number
Beach
2000 - 2016 (April 1 - October 31)
HUNTINGTON STATE BEACH Sampling Agency: Orange County Sanitation District Sampling Frequency: 2 samples per week Sampling Locations: Beach Blvd., Newland Street, Magnolia Street, Brookhurst Street, 50 feet upcoast of Santa Ana River Mouth Beach Miles: 2.5 miles of open coastal beach Number of
and Beach Mile Days (April 1 – October 31) Year
Posting Days Beach Mile Days 2000 28 223 67.6 2001 29 70 14.8 2002 31 89 23.8 2003 21 72 41.9 2004 23 55 10.6 2005 14 55 12.1 2006 34 92 21.9 2007 27 112 61.0 2008 28 78 26.2 2009 23 32 11.0 2010 11 27 8.1 2011 7 8 3.4 2012 18 5 14.5 2013 8 8 2.3 2014 14 41 2.3 2015 4 5 0.4 2016 8 9 1.0
92.4% 98.9% 99.9% 99.5% 98.9% 99.5% 99.6% 98.8% 85 90 95 100 Little Corona Corona Del Mar The Wedge Balboa Pier 15th/16th St. 38th St. 52nd/53rd St. Orange St. Station Location Percent Sampling Station Compliance with AB411 Standards 2005 - 2016 (April 1 - October 31) 2.2 0.7 1.2 1.4 1.2 6.0 1.9 0.6 0.6 0.6 0.7 0 0.5 0.6 0.6 3.3 1.0 0.0 2000 2001 2002 2003 2004 2005 2006 2007 2008 2009 2010 2011 2012 2013 2014 2015 2016 1 2 3 4 5 6 7 Year Beach Mile Days
of Beach Mile Days Posted
2016 Annual Ocean, Harbor & Bay Water Quality Report - Page 37 • NEWPORT
of Posted Warnings, Posting Days and Beach Mile Days
Posted Warnings Posting Days
Days
Source: Orange County Health Care Agency/Environmental Health Source: Orange County Health Care Agency/Environmental Health
Number
2000 - 2016 (April 1 - October 31)
BEACH Sampling Agency: Orange County Sanitation District Sampling Frequency: 1 sample per week Sampling Locations: Orange St., 52nd/53rd St., 38th St., 15th/16th St. Balboa Pier, The Wedge, Corona Del Mar State Beach, Little Corona Beach Miles: 7.0 miles of open coastal beach Number
(April 1 – October 31) Year
Beach Mile
2000 8 18 2.2 2001 8 13 0.7 2002 10 17 1.2 2003 14 23 1.4 2004 12 18 1.2 2005 6 21 6.0 2006 6 10 1.9 2007 8 10 0.6 2008 6 11 0.6 2009 3 10 0.6 2010 11 11 0.7 2011 7 8 0.5 2012 6 10 0.6 2013 4 11 0.6 2014 8 51 3.3 2015 11 17 1.0 2016 0 0 0.0
1.3 0.3 0.1 0.2 0.1 0.0 0.4 0.1 0.4 0.0 0.2 0.1 0.3 0.1 0.3 0.0 0.1 2000 2001 2002 2003 2004 2005 20062007 2008 2009 2010 201120122013 2014 20152016 0 1 2 3 4 5 Year Beach Mile Days Number of Beach Mile Days Posted 2000 - 2016 (April
- October 31) 99.6% 99.4% 99.7% 100.0% 99.4% Pelican Point Beach Crystal Cove Muddy Creek El Moro Pelican Point Ramp #3 85 90 95 100 Station Location Percent Sampling Station Compliance with AB411 Standards 2005 - 2016 (April 1 - October 31) 2016 Annual Ocean, Harbor & Bay Water Quality Report - Page 38 •
Sampling Agency: Orange County Sanitation District, OC Public Works Sampling Frequency: 1 sample per week Sampling Locations: Pelican Point Beach,
Point), El
Beach
miles
Posted Warnings, Posting Days and Beach Mile Days
Posted Warnings Posting Days
Days
Source: Orange County Health Care Agency/Environmental Health Source: Orange County Health Care Agency/Environmental Health
1
CRYSTAL COVE STATE BEACH
Crystal Cove Beach, Muddy Beach (Reef
Moro
(including point zero) Beach Miles: 3.2
of open coastal beach Number of
(April 1 – October 31) Year
Beach Mile
2000 9 21 1.3 2001 3 5 0.3 2002 1 1 0.1 2003 1 4 0.2 2004 1 2 0.1 2005 0 0 0.0 2006 1 2 0.4 2007 1 1 0.1 2008 1 2 0.4 2009 0 0 0.0 2010 2 3 0.2 2011 1 1 0.1 2012 2 4 0.3 2013 1 1 0.1 2014 3 5 0.3 2015 0 0 0.0 2016 1 1 0.1
1.9 0.6 0.2 0.2 0.6 0.3 0.4 0.3 0.5 0.0 0.2 0.5 1.0 0.1 0.2 0.1 0.7 2000 2001 2002 2003 2004 2005 2006 2007 2008 20092010 2011 2012 2013 2014 20152016 0 1 2 3 4 5 Year Beach Mile Days Number of Beach Mile Days Posted 2000 - 2016 (April 1 - October 31) 100.0% 98.3% 98.3% 98.4% 99.7% 99.0% 100.0% 100.0% 100.0% 100.0% 85 90 95 100 Bluebird Canyon Laguna Main Beach Emerald Bay Crescent Bay Hotel Laguna Victoria Beach Blue Lagoon Pearl Street Cleo Street Diver’s Cove Station Location Percent Sampling Station Compliance with AB411 Standards 2005 - 2016 (April 1 - October 31) 2016 Annual Ocean, Harbor & Bay Water Quality Report - Page 39 • LAGUNA BEACH Sampling Agency: OC Public Works Sampling Frequency: 1 sample per week Sampling Locations:
Bay*, Crescent Bay, Diver’s Cove*, Laguna Main Beach*, Hotel
Cleo Street*,
Canyon*,
Street
Zero Monitoring implemented
Beach
miles
Number of Posted Warnings, Posting Days and Beach Mile Days (April 1 – October 31) Year Posted Warnings Posting Days Beach Mile Days 2000 15 34 1.9 2001 5 10 0.6 2002 3 4
2003 2 4 0.2 2004 4 7
2005 3 6
2006 4 7
2007 4 5
2008 3 8
2009 0 0
3 3
2011 3 7
2012 8 17
2013 1 3
2014 2 4
2015 1 2
2016 4 21
Source: Orange County Health Care Agency/Environmental Health Source: Orange County Health Care Agency/Environmental Health
Emerald
Laguna*,
Bluebird
Pearl Street*, Dumond
(Victoria Beach)*, Blue Lagoon* (* = Point
in 2015)
Miles: 4.4
of open coastal beach
0.2
0.6
0.3
0.4
0.3
0.5
0.0 2010
0.2
0.5
1.0
0.1
0.2
0.1
0.7
1.6 0.7 1.7 0.5 0.6 0.6 0.6 0.6 0.1 0.3 0.3 1.1 0.4 0.3 0.3 0.1 0.1 2000 2001 2002 2003 2004 2005 2006 2007 2008 2009 2010 20112012 20132014 2015 2016 0 1 2 3 4 5 Year Beach Mile Days Number of Beach Mile Days Posted 2000 - 2016 (April 1 - October 31) 99.8% 99.1% 99.7% 100.0% 99.7% 96.8% 98.4% 99.7% 99.4% 99.4% 100.0% 99.2% 85 90 95 100 Treasure Island Goff Island 9th St./1000 Steps Aliso Creek Point Zero Aliso−Middle Aliso−South Carmel Point Table Rock Laguna Lido Three Arch Bay West Street Aliso−North Station Location Percent Sampling Station Compliance with AB411 Standards 2005 - 2016 (April 1 - October 31) 2016 Annual Ocean, Harbor & Bay Water Quality Report - Page 40 •
Sampling Agency: South Orange County Wastewater Authority Sampling Frequency: 1 sample per week Sampling Locations: Goff Island, Treasure Island, North Aliso Beach, Aliso Creek Point Zero*, Mid Aliso Beach, South Aliso Beach, Camel Pt, West St*, Table Rock, Laguna Lido, 9th St/1000 Steps, Three Arch Bay (*= Point Zero monitoring implemented 2015) Beach Miles: 2.0 miles of open coastal beach Number of Posted Warnings, Posting Days and Beach Mile Days (April 1 – October 31) Year Posted Warnings Posting Days Beach Mile Days 2000 12 22 1.6 2001 4 5 0.7 2002 4 9 1.7 2003 5 9 0.5 2004 4 6 0.6 2005 6 11 0.6 2006 7 11 0.6 2007 3 11 0.6 2008 1 1 0.1 2009 5 5 0.3 2010 3 6 0.3 2011 6 8 1.1 2012 1 2 0.4 2013 3 6 0.3 2014 3 6 0.3 2015 1 2 0.1 2016 1 1 0.1 Source: Orange County Health Care Agency/Environmental Health Source: Orange County Health Care Agency/Environmental Health
ALISO COUNTY BEACH & SOUTH LAGUNA BEACH
99.4% 93.9% 98.8% 98.9% 85 90 95 100 Salt Creek Beach Monarch Beach 2005-2014 Dana Strands Ocean Institute Station Location Percent Sampling Station Compliance with AB411 Standards 2005 - 2016 (April 1 - October 31) 2.5 0.9 5.5 2.3 6.0 4.0 1.6 0.2 0.3 0.1 0.4 0.7 1.1 0.1 0.8 0.1 0.2 2000 2001 2002 2003 2004 2005 2006 2007 2008 2009 20102011 2012 2013 2014 2015 2015 0 1 2 3 4 5 6 7 8 Year Beach Mile Days Number of Beach Mile Days Posted 2000 - 2016 (April 1 - October 31) 2016 Annual Ocean, Harbor & Bay Water Quality Report - Page 41 • DANA
Sampling
Works Sampling Frequency: 1 sample per week Sampling
miles
Number of Posted Warnings, Posting Days and Beach Mile Days (April 1 – October 31) Year Posted Warnings Posting Days Beach Mile Days
4 42
7 13
10 95
6 39
13 108
5 63
8 23
2007 2 3
1 5
1 7
2010 4 7
5 18
4 12
2 2
3 14
2015 1 2
2016 1 3
Source: Orange County Health Care Agency/Environmental Health Source: Orange County Health Care Agency/Environmental Health
POINT
Agency: OC Public
Locations: Salt Creek County Beach, Dana Strands, Ocean Institute Beach (Monarch Beach included through 2014; see following page for new Monarch Beach Point Zero monitoring results) Beach Miles: 3.0
of open coastal beach
2000
2.5 2001
0.9 2002
5.5 2003
2.3 2004
6.0 2005
4.0 2006
1.6
0.2 2008
0.3 2009
0.1
0.4 2011
1.1 2012
0.7 2013
0.1 2014
0.8
0.1
0.2
• DANA POINT – MONARCH BEACH
Sampling Agency: OC Public Works Sampling Frequency: 1 sample per week Sampling Locations: Monarch Beach at Salt Creek Point Zero, 75 feet upcoast, and 75 feet downcoast (Point Zero monitoring implemented in 2015) Beach Miles: 0.2 miles of open coastal beach 2016 was the second year for point zero monitoring at Salt Creek. The point zero exceedance rate has remained nearly unchanged, but the sample stations 75 feet upcoast and downcoast continue to be in compliance over 98% of the time. Amazingly, beach mile days actually dropped 57% compared to the last AB 411 period and may be the result of the falconry program implemented to help discourage seabirds from visiting the creek area. Although Salt Creek flows through an ozone treatment facility before being discharged to the beach, the exact reason for the higher bacteria levels measured at point zero after treatment is unclear and may be the result of bird waste and decomposition of organic matter in the ponded flow on the beach. Further investigation continues to be conducted to determine the exact cause of the bacterial source, but regardless of the cause the higher exceedance rates confirm why swimmers should avoid any ponded or flowing runoff and the area where it enters the ocean.

4.2 1.8 2015 2016 0 1 2 3 4 5 6 7 8 Year Beach Mile Days Number of Beach Mile Days Posted 2015 - 2016 (April 1 -
31) 100.0% 93.3% 98.4% 80.1% 70 80 90 100 75 85 95 75 feet upcoast of Salt Creek Monarch Beach 2000-2014 Salt Creek Point Zero Monitoring 75 feet downcoast of Salt Creed Station Location Percent Sampling Station Compliance with AB411 Standards 2015 - 2016 (April 1 - October 31) 2016 Annual Ocean, Harbor & Bay Water Quality Report - Page 42 Monarch Beach, Dana Point
of Posted Warnings, Posting Days and Beach Mile Days
– October 31) Year Posted Warnings Posting Days Beach
Days 2015 4 120 4.0 2016 4 52 1.8 Source: Orange County Health Care Agency/Environmental Health Source: Orange County Health Care Agency/Environmental Health
October
Number
(April 1
Mile
90.6% 94.8% 96.7% 85.2% 100.0% 84.6% 98.4% 87.6% 75 80 85 90 95 100 North Beach Creek Pedestrian Bridge South Day Use Area Drain near South Restroom Last Campground (S-1) San Juan Creek Point Zero Drain at Last Parking Lot Frist Campground (S-0) Percent Station Location Sampling Station Compliance with AB411 Standards 2005 - 2016 (April 1 - October 31) 140.0 148.4 142.5 116.5 107.6 107.9 71.0 36.1 60.0 53.3 46.0 121.1 74.9 1.8 1.1 3.3 1.9 2000 2001 2002 2003 2004 2005 20062007 20082009 2010 2011 2012 2013 2014 2015 2016 0 25 50 75 100 125 150 175 Year Beach Mile Days Number of Beach Mile Days Posted 2000 - 2016
31) 2016 Annual Ocean, Harbor & Bay Water Quality Report - Page 43 •
(April 1 - October
(*
of Posted Warnings, Posting Days and Beach Mile Days
Posted Warnings Posting Days Beach Mile Days
Source: Orange County Health Care Agency/Environmental Health Source: Orange County Health Care Agency/Environmental Health
DOHENY STATE BEACH Sampling Agency: South Orange County Wastewater Authority Sampling Frequency: 1 sample per week Sampling Locations: North Beach*, San Juan Creek Point Zero*, San Juan Creek First Campground (S-0), Last Campground (S-1), Drain near south restroom*, South Day Use Area, Pedestrian Bridge, Drain at last parking lot*
= Point Zero Monitoring implemented in 2015) Beach Miles: 1.1 miles of open coastal beach Number
(April 1 – October 31) Year
2000 9 165 140.0 2001 5 191 148.4 2002 7 216 142.5 2003 6 207 116.5 2004 12 226 107.6 2005 3 123 107.9 2006 11 130 71.0 2007 13 180 36.1 2008 10 183 60.0 2009 11 117 53.3 2010 19 184 46.0 2011 9 234 121.1 2012 12 167 74.9 2013 11 19 1.8 2014 9 19 1.1 2015 11 56 3.3 2016 6 33 1.9

100.0% 94.5% 85 90 95 100 Capistrano County Beach Drain near Basketball Courts Station Location Percent Sample Station Compliance with AB411 Standards 2005 - 2016 (April 1 - October 31) 12.4 5.8 2.6 0.3 2.4 3.6 12 1.1 0.6 1.5 0.1 0.1 6.2 0.0 13.3 0.00.0 2000 2001 2002 2003 2004 2005 2006 2007 2008 2009 2010 2011 2012 2013 2014 2015 2015 0 3 6 9 12 15 Year Beach Mile Days Number of Beach Mile Days Posted 2000 - 2016 (April 1 - October 31) 2016 Annual Ocean, Harbor & Bay Water Quality Report - Page 44 •
Sampling
Environmental Health Sampling Frequency: 1 sample per week Sampling Locations:
miles
Number of Posted Warnings, Posting Days and Beach Mile Days (April 1 – October 31) Year Posted Warnings Posting Days Beach Mile Days
4 128
5 98
7 104
2 11
1 2
4 12
4 15
0 0
3 48
3 33
2 3
2 27
2 53
1 2
1 2
0
0 0
Source: Orange County Health Care Agency/Environmental Health Source: Orange County Health Care Agency/Environmental Health
CAPISTRANO COUNTY BEACH
Agency: HCA
Near restroom at Capistrano County Beach and the drain south of the basketball courts*. (* = Point Zero Monitoring implemented in 2015) Beach Miles: 0.25
of open coastal beach
2000
12.4 2001
5.8 2002
6.2 2003
2.6 2004
0.3 2005
2.4 2006
3.6 2007
0.0 2008
12.0 2009
1.1 2010
0.6 2011
1.5 2012
13.3 2013
0.1 2014
0.1 2015
0 0.0 2016
0.0
Capistrano County Beach Dana Point
59.6 4.6 18.4 1.7 11.3 21.5 2.2 37.1 0.7 14.3 6.8 0.2 97.9 1.9 0.9 0.0 0.0 2000 2001 2002 2003 2004 2005 2006 2007 2008 20092010 2011 2012 20132014 20152016 0 20 40 60 80 100 120 Year Beach Mile Days Number of Beach Mile Days Posted 2000 - 2016 (April 1 - October 31) 95.0% 93.8% 100.0% 85 90 95 100 35077 Beach Rd. 35535 Beach Rd. 35195 Beach Rd. Station Location Percent Sample Station Compliance with AB411 Standards 2005 - 2016 (April 1 - October 31) 2016 Annual Ocean, Harbor & Bay Water Quality Report - Page 45 • CAPISTRANO
DISTRICT
Sampling Agency: HCA Environmental Health Sampling Frequency: 1 sample per week Sampling Locations: 35077 Rd.*, 35195 Beach Rd., 35535 Beach Rd. (* = Point Zero Monitoring implemented in 2015) Beach Miles: 1.6 miles of open coastal beach 2Number of Posted Warnings, Posting Days and Beach Mile Days (April 1 – October 31) Year Posted Warnings Posting Days Beach Mile Days 2000 2 53 59.6 2001 5 31
2002 6 77 97.9 2003 5 25
2004 3 4
2005 2 9
2006 6 20
2007 2 7
2008 6 38
2009 6 29 37.1 2010 2 16
2011 7 13
2012 2 62
2013 3 11
2014 2 4
2015 0 0
2016 1 0
Source: Orange County Health Care Agency/Environmental Health Source: Orange County Health Care Agency/Environmental Health Sanderlings
Line Capistrano Bay District
Dana Point
BAY
BEACH
4.6
18.4
1.7
11.3
21.5
1.9
2.2
0.9
0.7
14.3
6.8
0.2
0.0
0.2
at Surf
Beach,,

5.7 18.8 11.0 12.4 5.1 7.8 11.4 14.8 13.5 23.2 2.4 0.2 19.8 9.0 14.0 1.5 0.2 2000 2001 2002 2003 2004 2005 2006 2007 2008 2009 2010 2011 201220132014 2015 2016 0 5 10 15 20 25 Year Beach Mile Days Number of Beach Mile Days Posted 2000 - 2016 (April 1 - October 31) 92.3% 92.9% 96.0% 70 90 100 75 feet downcoast Poche Creek Point Zero 75 feet upcoast Poche Creek Station Location Percent Sample Station Compliance with AB411 Standards 2005 - 2016 (April 1 - October 31) 2016 Annual Ocean, Harbor & Bay Water Quality Report - Page 46 •
Sampling Agency:
Environmental Health Sampling Frequency: 1 sample per week Sampling Locations:
Point Zero
zero monitoring implemented
miles
Number of Posted Warnings, Posting Days and Beach Mile Days (April 1 – October 31) Year Posted Warnings Posting Days Beach Mile Days
3
3
4
7
7
5
4
2
6
2
2
3
2
8
1
4
3
Source: Orange County Health Care Agency/Environmental Health Source: Orange County Health Care Agency/Environmental Health
POCHE BEACH
HCA
Poche Beach (S-15), Poche Creek
(point
in 2015) Beach Miles: 0.2
of open coastal beach
2000
104 5.7 2001
145 19.8 2002
153 18.8 2003
88 11.0 2004
160 12.4 2005
68 5.1 2006
104 7.8 2007
154 9.0 2008
147 11.4 2009
184 14.8 2010
179 14.0 2011
153 13.5 2012
187 23.2 2013
26 2.4 2014
3 0.2 2015
38 1.5 2016
6 0.2
Surfing Poche County Beach
3.9 3.8 0.6 0.6 0.3 0.2 0.3 1.1 1.1 0.3 0.1 1.1 0.2 0.0 1.7 2.4 7.0 2000 2001 2002 2003 2004 2005 2006 2007 2008 2009 20102011 2012 2013 2014 2015 2016 0 1 2 3 4 5 6 7 8 Year Beach Mile Days Number of Beach Mile Days Posted 2000 - 2016 (April 1 - October 31) 2016 Annual Ocean, Harbor & Bay Water Quality Report - Page 47 •
Sampling Agency: HCA Environmental Health Sampling Frequency: 1 sample per week Sampling Locations: Capistrano Shores North & South*, Pico Drain*, North Beach, Mariposa Drain*, Linda Lane Drain*, 450 feet north of Pier, San Clemente Pier*, Trafalgar Street (“T” Street)*, Boca del Canon*, Riviera Beach*, Avenida Califia, Avenida de Las Palmeras (* = point zero monitoring implemented in
Beach Miles: 3.2 miles of open coastal beach Number of Posted Warnings, Posting Days and Beach Mile Days (April 1 – October 31) Year Posted Warnings Posting Days Beach Mile Days 2000 5 13 3.9 2001 4 13 3.8 2002 6 10 0.6 2003 4 7 0.6 2004 2 5 0.3 2005 2 4 0.2 2006 4 6 0.3 2007 3 6 0.3 2008 6 10 1.1
8 20
1
7 17
5 42
2 4
0
8 214
6 148
Source: Orange County Health Care Agency/Environmental Health 96.8% 99.5% 97.4% 86.3% 100.0% 99.2% 97.4% 95.2% 100.0% 100.0% 100.0% 100.0% 75 85 95 100 80 90 North Beach North Capistrano Shores Avenida Calafia Linda Lane Drain Mariposa Avenue Drain 450’ North of Pier San Clemente Pier Trafalgar Canyon “T” St. Riviera Beach Avenida de Las Palmas Boca Del Canon Pico Drain at North Beach Station Location Percent Sampling Station Compliance with AB411 Standards 2005 - 2016 (April 1 - October 31) Source: Orange County Health Care Agency/Environmental Health
SAN CLEMENTE CITY & STATE BEACH
2015)s
2009
1.1 2010
2 0.1 2011
1.1 2012
2.4 2013
0.2 2014
0 0.0 2015
1.7 2016
7.0
APPENDIX 2
Postings by Harbor and Bay Water Areas 2000 – 2016
The following tables and graphs provide monitoring information between April 1 and October 31 for each of Orange County‘s harbor, bay and slough water areas and is arranged geographically from north to south along the Orange County shoreline. The appendix information provided for harbor, bay and slough water area includes: • Sampling agency, sampling frequency, sampling locations and number of beach miles; • Total number of posted warnings, total number of warning days and total number of Beach Mile Days that were posted due to AB 411 standards violations from 2000 - 2016; and • A trend graph depicting the total number of Beach Mile Days that the open coastal water area was posted from 2000 – 2016.

2016
Harbor & Bay Water Quality Report - Page 48
Annual Ocean,
Laguna Beach
HARBOUR

4.7 18.0 7.3 4.0 1.2 3.5 6.1 0.8 1.7 1.0 0.2 1.0 0.7 0.8 1.0 0.7 0.6 2000 2001 2002 2003 2004 2005 2006 2007 2008 2009 20102011 20122013 201420152016 0 5 10 15 20 Year Beach Mile Days Number of Beach Mile Days Posted 2000 - 2016 (April 1 - October 31) 2016 Annual Ocean, Harbor & Bay Water Quality Report - Page 49 •
Sampling
week
of Posted Warnings, Posting Days and Beach Mile Days (April 1 – October 31) Year Posted Warnings Posting Days Beach Mile Days
16
4.7
34 182
24 134
15
15
8
12
4
8
4
Source: Orange County Health Care Agency/Environmental Health
HUNTINGTON
Sampling Agency: HCA Environmental Health
Frequency: 1 sample per
Sampling Locations: Sunset Aquatic Marina, Mother’s Beach, Trinidad Lane Beach, Sea Gate Lagoon, Humboldt Beach, Davenport Beach, Huntington Harbour Marina, Harbour Channel at Coral Cay, 11th Street Beach, Admiralty Drive Channel, Peter’s Landing Marina, Anaheim Bay Shell Gas Dock at Mariner’s Point, Coral Cay Beach. Beach Miles: 31.1 miles of harbor frontage Number
2000
100
2001
18.0 2002
7.3 2003
73 4.0 2004 8 31 1.2 2005
68 3.5 2006 21 110 6.1 2007
16 0.8 2008
34 1.7 2009 5 18 1.0 2010
6 0.2 2011
19 1.0 2012
12 0.7 2013 12 28 0.8 2014 7 12 0.7 2015 10 20 1.0 2016 9 11 0.6
Huntington Harbour, Huntington Beach
NEWPORT BAY
Sampling Agency: HCA Environmental Health Sampling Frequency: 1 sample per week
Sampling Locations: Newport Dunes Beach (east, middle, west, north), Vaughn’s Launch, Ski Zone, North Star Beach, Bayshore Beach, De Anza Launch (Pearson’s Port), 43rd Street Beach, 38th Street Beach, 33rd Street Channel, Newport Blvd. Bridge Marina (Harbor Tower Marina), Lido Isle Yacht Club Beach, Via Genoa Beach, Rhine Channel, 19th Street Beach, 15th Street Beach, 10th Street Beach, Alvarado/Bay Isle Beach, “N” Street Beach, Garnet Avenue Beach, Ruby Avenue Beach, Sapphire Avenue Beach, Grand Canal, Abalone Avenue Beach, Park Avenue Beach, Onyx Avenue Beach, Promontory Point Channel, Bayside Drive Beach (Harbor Patrol Beach) Beach Miles: 39.5 miles of bay frontage

Number of Posted Warnings, Posting Days and Beach Mile Days (April 1 – October 31)
Year Posted Warnings Posting Days Beach Mile Days 2000 56 929 32.0 2001 68 931 39.0 2002 43 905 35.6 2003 40 730 32.3 2004 31 768 31.5 2005 21 719 28.8 2006 30 492 26.7 2007 18 471 25.0 2008 15 246 13.2 2009 19 213 12.1 2010 18 307 14.2 2011 25 267 14.5 2012 22 263 13.9 2013 21 249 13.2 2014 19 295 13.8 2015 17 271 15.0 2016 10 330 13.9
Number of Beach Mile Days Posted 2000 - 2016 (April 1 - October 31)
32 39 35.6 26.7 28.8 32.2 31.5 25 13.2 13.3 14.2 14.5 13.8 13.2 15.0 13.9 13.9 2000 2001 2002 2003 2004 2005 2006 2007 2008 2009 2010 2011 2012 2013 2014 20152016 0 10 20 30 50 40 Year Beach
Mile Days
2016 Annual Ocean, Harbor & Bay Water Quality Report - Page 50 •
Source: Orange County Health Care Agency/Environmental Health
Newport Bay Newport Beach

3.5 2.1 0.7 0.2 1.4 1.1 0.10.1 0.1 0.1 0.1 0.1 0.1 0.3 0.1 0.0 2000 2001 2002 2003 2004 2005 2006 2007 2008 2009 2010 2011 2012 2013 20142015 2016 0 1 2 3 5 4 Year Beach Mile Days
2016 Annual Ocean, Harbor & Bay Water Quality Report - Page 51
NEWPORT
Posted
Posted
Number of Beach Mile Days Posted 2000 - 2016 (April 1 - October 31)
•
SLOUGH Sampling Agency: HCA Environmental Health Sampling Frequency: 1 sample per week Sampling Locations: Lancaster Street at 61st Street, Lancaster Street at Canal Street Beach Miles: 0.1 miles of channel beach Number of
Warnings, Posting Days and Beach Mile Days (April 1 – October 31) Year
Warnings Posting Days Beach Mile Days 2000 N/A N/A N/A 2001 6 324 3.5 2002 5 181 2.1 2003 6 111 1.4 2004 3 96 1.1 2005 2 15 0.2 2006 10 61 0.7 2007 1 2 0.1 2008 4 13 0.1 2009 3 6 0.1 2010 2 6 0.1 2011 1 1 0.1 2012 3 12 0.1 2013 1 2 0.1 2014 2 28 0.3 2015 1 2 0.1 2016 0 0 0.0
Source: Orange County Health Care Agency/Environmental Health
Newport Slough, Newport Beach
DANA
HARBOR

20 19.2 10.4 14.3 12.3 18.6 0.5 0.2 0.7 1.0 2.2 1.9 1.4 0.3 0.2 7.9 0.4 2000 2001 2002 2003 2004 2005 2006 2007 2008 2009 2010 2011 2012 2013 2014 2015 2016 0 5 10 15 25 20 Year Beach Mile Days
of
Mile Days Posted
2016 Annual Ocean, Harbor & Bay Water Quality Report - Page 52
of Posted Warnings, Posting Days and
Mile Days
Posted Warnings Posting Days
Source: Orange County Health Care Agency/Environmental Health
Number
Beach
2000 - 2016 (April 1 - October 31)
•
POINT
Sampling Agency: OC Public Work Sampling Frequency: 1 sample per week Sampling Locations: Fuel Dock, Baby Beach (west end, buoy line, swim area, east end), Pier, Pilgrim Dock, Youth Dock, Harbor Entrance, Guest Dock, Harbor Patrol Dock, “M” Dock Beach Miles: 3.3 miles of harbor frontage Number
Beach
(April 1 – October 31) Year
Beach Mile Days 2000 10 206 7.9 2001 8 420 20.0 2002 9 410 19.2 2003 8 298 12.3 2004 9 362 18.6 2005 6 322 14.3 2006 14 264 10.4 2007 9 27 0.5 2008 6 13 0.2 2009 5 53 0.7 2010 12 74 1.0 2011 8 59 2.2 2012 14 82 1.9 2013 10 41 1.4 2014 1 5 0.3 2015 4 9 0.2 2016 3 25 0.4 Dana
Point Harbor, Dana Point
APPENDIX 3
Unauthorized Discharge of Waste and Ocean/Harbor/Bay Closures 1987 - 2016
The following table lists both the total annual number of unauthorized discharges of waste reported to the Health Care Agency and the total number of ocean, harbor and bay water closures from 1987 through 2016. The total number of unauthorized discharges of waste reported is categorized by sewage type and by waste discharge causes for each year. The total number of ocean, harbor and bay water closures is categorized by waste type and closure causes. In addition, the total number of Beach Mile Days for ocean, harbor and bay water closures from sewage spills and miscellaneous causes is shown for 1999 – 2016.

2016 Annual Ocean, Harbor & Bay Water Quality Report - Page 53
Sunset Birds Laguna Beach
Number of Unauthorized Discharges of Waste & Ocean/Harbor/Bayy Water Closures in
County 1987 –2016 1987 1988 1989 1990 1991 1992 1993 1994 1995 1996 1997 1998 1999 2000 2001 2002 2003 2004 2005
2007
2009 2010 2011 2012 2013 2014 2015 2016 WASTE DISCHARGES T otal Number of Discharges 63 83 59 76 101 118 97 125 120 170
136 120 By W aste Type Raw Sewage 60 83 58 70 96 108 91 112
117
130 127 Primary Treated Effluent 0 0 1 0 0 0 1 1 0 1 1 0 0 1 0 0 0 2 0 0 0 1 2 3 0 0 0 1 0 0 Secondary Treated Effluent 0 0 0 3 3 5 0 2 3 1 10 12 2 6 9 3 6 10 9 7 6 4 6 3 0 2 2 3 2 1 Tertiary Treated Effluent 0 0 0 1 1 4 3 5 5 47 68 28 31 37 25 114 135 122 112 113 101 121 113 102 128 142 132 3 3 0 Miscellaneous 3 0 0 1 1 1 2 5 1 4 5 7 7 2 0 1 1 0 1 1 0 4 1 2 1 0 1 0 1 1 W aste Discharge Causes Pipeline Breaks 16 12 13 25 11 17 21 18 20 57 61 60 38
13 8 10 Pipeline Blockages 26 42 32 34 72 86 61 89 72 65 118 139 210 288 308 409 358 329 289 277 225 215 170 135 154 140 136 119 110 113 Pump Station Failures 14 26 13 12 12 6 9 9 8 24 15 16 14 8 15 11 17 12 7 15 10 13 4 8 6 10 5 11 4 2 Treatment Plant Discharges 0 1 0 2 2 3 0 2 3 1 1 2 0 0 4 2 4 9 4 6 4 9 11 6 1 3 2 0 1 1 Stormwater Surcharges 0 0 0 0 0 1 2 0 10 0 4 14 0 1 0 3 6 2 7 3 3 3 1 11 2 0 2 2 1 1 Vessel Pump Station Failures 0 0 0 0 0 0 1 0 0 1 0 0 0 4 9 3 6 9 4 1 3 1 1 0 0 0 0 2 1 0 Miscellaneous 7 2 1 3 1 5 3 7 7 22 27 21 14 25
2
44 12 36 50 51 13 5 2 OCEAN AND BAY WATER CLOSURES Total Number of Closures 8 12 11 10 15 15 7 17 22 21 17 35 22 40 51 38 27 30 36 24 12 18 6 17 6 10 11 16 10 9 By W aste Type Raw Sewage 8 12 11 10 14 13 7 13 21 20 16 30 19 38 49 37 27 29 35 23 12 18 6 16 5 9 11 16 10 9 Primary T reated Effluent 0 0 0 0 0 0 0 1 0 0 1 0 0 0 0 0 0 1 0 0 0 0 0 0 0 0 0 0 0 0 Secondary T reated Effluent 0 0 0 0 0 2 0 0 0 0 0 1 1 2 2 0 0 0 1 0 0 0 0 0 0 0 0 0 0 0 T ertiary Treated Effluent 0 0 0 0 0 0 0 1 0 0 0 2 0 0 0 0 0 0 0 0 0 0 0 0 0 0 0 0 0 0 Miscellaneous 0 0 0 0 1 0 0 2 1 1 0 2 2 0 0 1 0 0 0 1 0 0 0 1 1 1 0 0 0 0 Ocean and Bay W ater Closure Causes Pipeline Breaks 2 2 5 3 2 5 2 7 6 2 4 18 2 4 6 2 2 3 9 4 0 2 0 4 2 3 0 3 0 2 Pipeline Blockages 3 3 1 5 9 7 2 8 10 8 8 4 11 30 29 31 17 13 18 16 9 11 6 9 3 3 8 9 7 4 Pump Station Failures 3 6 5 1 3 1 1 0 3 7 4 3 5 2 6 1 1 0 2 2 0 3 0 1 1 3 1 2 1 1 T reatment Plant Discharges 0 1 0 0 0 0 0 2 0 0 0 0 1 0 1 0 0 1 1 0 0 1 0 1 0 0 1 0 0 0 Stormwater Surcharges 0 0 0 0 0 1 1 0 2 1 1 5 0 0 0 0 0 0 1 0 0 0 0 1 0 0 0 0 1 0 V essel Pump Station Failures 0 0 0 0 0 0 1 0 0 1 0 0 0 4 9 3 6 9 4 1 3 1 0 0 0 0 0 2 1 2 Miscellaneous 0 0 0 1 1 1 0 0 1 2 0 5 3
4 1 1 0 0 0 1 0 0 1 0 0 0 Beach Mile Days of Closures Due to Sewage Spills ~ ~ ~
Due to Miscellaneous Causes ~ ~ ~
0 ~ = Data Not Available 2016 Annual Ocean, Harbor & Bay Water Quality Report - Page 54
Orange
2006
2008
226 252 276 377 412 522 534 496 480 454 394 387 321 290 309 315 299 160
111
142 205 236 331 378 404 392 362 358 333 287 257 199 180 180 171 165 153
51 60 92 133 114 128 113 94 108 90 118 110 112 103
16
10 21 41 39 55 38
0 0 0 1
~ ~ ~ ~ ~ ~ ~ ~ ~ 51.0 52.0 59.1 18.5 15.1 13.5 74.0 15.3 2.0 30.2 6.3 67.5 12.9 6.0 11.0 25.3 18.9 14.0
~ ~ ~ ~ ~ ~ ~ ~ ~ 105.1 0.0 0.0 11.3 0.0 0.0 0.0 0.0 0.0 0.0 0.0 0.0 0.0 0.0 0.0 0.0 0.0
Sewage Spill Closures for Ocean, Harbor and Bay Water Areas - 2016
The following table provides a summary of each sewage spill that resulted in an ocean, harbor or bay water closure in 2016. The table shows the closure dates; number of days closed; number of Beach Mile Days of the closure; the ocean, harbor or bay water area that was closed; the responsible agency or a private property owner (PPO) responsible for the closure; the cause of the sewage spill closure; and the estimated volume of sewage spilled, recovered and released to the ocean, harbor or bay water area.
in Orange County
1 1/5/16 1/10/16 5 0.95 Upper Newport Bay from Santa Ana Delhi to Newport Dunes, Newport Beach.
2 1/24/16 1/28/16 4 0.76 From Bluebird Canyon Drive to Center Street, Laguna Beach.
3 2/9/16 2/17/16 8 6.48 All of the Newport Slough, Newport Beach.
4 6/23/16 6/26/16 3 1.1 “A” through “O” docks on the north side of the east basin, Dana Point Harbor.
5 7/8/16 7/11/16 3 0.17 Marina Park Docks, Newport Beach.
6 7/15/16 7/18/16 3 0.24 Docks between the Balboa Ferry and Balboa Pavilion, Newport Beach.
7 7/19/16 7/21/16 3 3.00 From the San Gabriel River Mouth to the Anaheim Bay breakwater, Seal Beach.
8 9/17/16 9/19/16 2 0.50 “F” through “O” docks on the north side of the east basin, Dana Point Harbor.
9 12/18/16 12/21/16 3 0.75 From the mouth of the San Gabriel River to 1000 feet downcoast of the San Gabriel River, Seal Beach.
City of Laguna Beach / root blockage

~200 gallons/sewage ~0 gallons recovered ~200 gallons released
City of Laguna Beach / root blockage ~550 gallons/sewage ~0 gallons recovered ~550 gallons released
City of Newport Beach / line break ~500 gallons/sewage ~0 gallons recovered ~500 gallons released
PPO / grease blockage
~1500 gallons/sewage ~0 gallons recovered ~1500 gallons released
City of Newport Beach / vessel pump out station ~20 gallons/sewage ~0 gallons recovered ~20 gallons released
City of Newport Beach / vessel pump out station ~1 gallons/sewage ~0 gallons recovered ~1 gallons released
City of Los Angeles / line break
South Coast Water District / root blockage
City of La Mirada / pump station power failure
~2,425,000 gal./sewage ~829,100 gal. recovered ~1,754,100 gal. released
~900 gal./sewage ~50 gal. recovered ~850 gal. released
~3000 gallons/ sewage ~0 gallons recovered ~3000 gallons released
2016
& Bay Water Quality Report - Page 55
Annual Ocean, Harbor
2015 Sewage Spill Closures for Ocean, Harbor and Bay Water Areas
Date Closed Date Opened Number of Days Closed Beach Mile Days Ocean, Harbor or Bay Area Closed
Agency/Reason Amount Spilled*
APPENDIX 4
PPO
= Private Property Owner * Amount Spilled: gallons of sewage spilled – gallons of sewage recovered = gallons of sewage released into ocean, bay or harbor. All volumes are estimations based on responding sanitation district/city field staff observations and calculations.
Garibaldi and Diver Exploring Reef
5
Single Sample Standard Exceedance Rates for Non-Point Zero Open Coastal Locations
The following table, arranged in geographical order from north to south along the Orange County shoreline, provides the dry weather AB 411 single sample standard exceedance rate at each Orange County open coastal monitoring location from April 1 to October 31 during the 12-year period from 2005 to 2016.
Station
Seal Beach / Surfside / Sunset
Laguna Beach
OSB02 1st Street 9.2% OLB05 Crescent Bay Beach 0.3%
OSB03 8th Street 4.8% S12 Goff Island Beach 0.6%
OSB05 100 Yds South of Pier 2.9% S11 Treasure Island Beach 0.3%
OSB04 14th Street 0.8% S10 Aliso Beach–North 0.6%
OSB01 Sea Way 0.6% S9 Aliso Beach–North 3.2%

OSUB1 Broadway 0.5% S8 Aliso Beach–South 0.8%
Bolsa Chica State Beach S7 Camel Point 0.3%
39N Parking Area #20 0.9% S6 Table Rock 0.2%
33N Parking Area #14 1.6% S5 Laguna Lido 0.0% Huntington City & State Beach S4 9th Street / 1000 Steps 0.3%
27N Bluffs @ Dog Beach 1.8% S3 Three Arch Bay 0.9%
21N 17th Street 0.4% Dana Point
15N Jacks Snack Bar 0.9% S2 Salt Creek Beach 1.2%
12N Beach Blvd. 1.4% S1 Dana Strands 1.1%
9N Newland Street 5.6% S-6 Ocean Institute Beach 0.6%
6N Magnolia Street 8.1% Doheny State Beach
3N Brookhurst Street 9.0% S2 Fence at 1st Campground 14.8%
0 Santa Ana River Mouth 4.6% S-1 Last Campground 9.4% Newport Beach S-3 South Day Use Area 12.4%
3S Orange Street 1.2% S-5 Pedestrian Bridge 9.3%
6S 52nd / 53rd Street 0.4%
Capistrano Beach
9S 38th Street 0.5% S-9 Capistrano County Beach 5.5%
15S 15th / 16th Street 1.1% S-11 Capistrano Bay Dist.–North 5.0%
21S Balboa Pier 0.5% S-13 Capistrano Bay Dist.–South 6.2%
27S The Wedge 0.1% Poche Beach
29S Corona Del Mar Beach 1.1% S-15 Poche Beach 33.6%
ONB3 Little Corona Beach 7.6%
San Clemente City & State Beach
Crystal Cove State Park S-17 North Beach 2.6%
ONB35 Pelican Point 0.6% S-19 450 Feet North of Pier 2.6%
39S Pelican Point Beach 0.4% S-21 Avenida Califia 0.8%
ONB39 Crystal Cove Beach 0.6% S-23 Las Palmeras 0.5%
ONB43 Muddy Creek Beach 0.3%
2016 Annual Ocean, Harbor & Bay Water Quality Report - Page 56 APPENDIX
#
Exceed Standards
% Exceed Standards
Monitoring Location %
Station # Monitoring Location
Young Boy Tubing It
Single Sample Standard Exceedance Rates for Point Zero Open Coastal Locations
The following table shows the seasonal single sample standard exceedance rates for Point Zero stations sampled outside of posted Rain Advisory periods. The displayed rates cover both the AB 411 and non AB 411 monitoring periods in 2016.
Point Zero monitoring is a departure from traditional methods of sampling beach areas to determine bacteriological water quality. Instead of monitoring a location within 100 feet of a storm drain, creek, or river to determine health compliance, samples are collected at specific locations where urban runoff physically mixes with the ocean and at points 75 feet upcoast and downcoast. If there is no urban runoff flow to the beach then only one sample is collected where flow would normally occur or what is termed: “virtual point zero.”
Permanent advisory warning signs continue to be posted at all drains, creeks and rivers advising beach goers to avoid urban runoff on the beach and where it enters the water because water quality can change significantly at any time. However, point zero monitoring serves to confirm exceedances of health standards at the receiving water and allows additional public notification which underscores the need to avoid urban runoff.
Point zero monitoring stations are sampled at the surfzone whether or not the associated drain or creek is flowing. Point Zero is identified by the last letter of the Station ID. For example, a station ending with “Z” is point zero, such as POCHEZ. Similarly, the upcoast and downcoast stations that are sampled 75 feet upcoast and downcoast of the associated storm drain, creek or river will have an identifier ending in “U” or “D,” respectively.
NS = No sample. Samples are sometimes not collected for various reasons, such as limited access to a location, safety concerns for our workers due to high surf or hazardous weather conditions, or simply no flow which eliminates the need for collecting the upcoast and downcoast samples.
2016 AB411 Period
Station ID Monitoring Location
South Crystal Cove State Park
2016 Non AB411 Period
APR - OCT JAN - MAR / NOV - DEC
% Exceed # Sanples % Exceed # Sanples
ELMOROU 75 feet upcoast NS 0 NS 0
ELMOROZ El Moro Creek Point Zero 0.0% 27 0.0% 16
ELMOROD 75 feet downcoast NS 0 NS 0
Laguna Beach
APR - OCT JAN - MAR / NOV - DEC
% Exceed # Sanples % Exceed # Sanples
EMRLDU 75 feet upcoast NS 0 0.0% 2
EMRLDZ Emerald Bay Drain Point Zero 0.0% 27 0.0% 16
EMRLDD 75 feet downcoast NS 0 0.0% 2
HEISLRD 75 feet upcoast NS 0 0.0% 1
HEISLRZ Diver’s Cove Drain Point Zero 0.0% 27 3.8% 17
HEISLRD 75 feet downcoast NS 0 0.0% 1
MAINBCU 75 feet upcoast 0.0% 2 12.5% 8
MAINBCZ Broadway Creek at Laguna Main Beach 7.1% 28 20.0% 20
MAINBCD 75 feet downcoast 0.0% 2 12.5% 8
VICTRAU 75 feet upcoast NS 0 0.0% 3
VICTRAZ Hotel Laguna Drain Point Zero 0.0% 27 0.0% 17
VICTRAD 75 feet downcoast NS 0 0.0% 3
CLEOU 75 feet upcoast 0.0% 2 10.0% 10
CLEOZ Cleo Street Drain Point Zero 0.0% 27 11.1% 18
CLEOD 75 feet downcoast 0.0% 2 10.0% 10
BLUBRDU 75 feet upcoast 0.0% 2 0.0% 12
BLUBRDZ Bluebird Canyon Drain Point Zero 0.0% 27 19.0% 21
BLUBRDD 75 feet downcoast 50.0% 2 0.0% 12
PEARLU 75 feet upcoast 0.0% 5 0.0% 3
PEARLZ Pearl Street Drain Point Zero 3.7% 27 9.1% 11
PEARLD 75 feet downcoast 0.0% 5 0.0% 3
DUMONDU 75 feet upcoast 0.0% 2 0.0% 6
Harbor & Bay Water Quality Report - Page 57
2016 Annual Ocean,
APPENDIX 6
DUMONDZ Victoria Beach Drain Point Zero 6.9% 29 0.0% 16
DUMONDD 75 feet downcoast 0.0% 2 0.0% 6
BLULGNU 75 feet upcoast 0.0% 1 0.0% 4
BLULGNZ Blue Lagoon Drain Point Zero 0.0% 8 4.5% 15
BLULGND 75 feet downcoast 0.0% 1 0.0% 4
ACM1U 75 feet upcoast 0.0% 1 25.0% 4
ACM1Z Aliso Creek Point Zero 0.0% 26 11.8% 17
ACM1D 75 feet downcoast 0.0% 1 25.0% 4
WESTU 75 feet upcoast NS 0 NS 0
WESTZ West Street Drain Point Zero 0.0% 26 4.0% 15
WESTD 75 feet downcoast NS 0 NS 0
Dana Point
APR - OCT JAN - MAR / NOV - DEC % Exceed # Sanples % Exceed # Sanples
SCM1U 75 feet upcoast 0.0% 28 5.6% 18
SCM1Z Salt Creek Point Zero 20.6% 34 45.5% 22
SCM1D 75 feet downcoast 0.0% 28 16.7% 18
Doheny State Beach
APR - OCT JAN - MAR / NOV - DEC % Exceed # Sanples % Exceed # Sanples
DSB5U 75 feet upcoast NS 0 0.0% 1
DSB5Z North Beach Creek Point Zero 12.9% 37 22.2% 18
DSB5D 75 feet downcoast NS 0 0.0% 1
SJC1U 75 feet upcoast NS 0 33.3% 9
SJC1Z San Juan Creek Point Zero 6.9% 29 26.3% 19
SJC1D 75 feet downcoast 0.0% 1 30.0% 10
DSB4U 75 feet upcoast NS 0 0.0% 1
DSB4Z South Day Use Area Drain Point Zero 0.0% 27 13.3% 15
DSB4D 75 feet downcoas NS 0 0.0% 1
DSB1U 75 feet upcoast NS 0 NS 0
DSB1Z Drain at End of Park Point Zero 0.0% 27 6.7% 15
DSB1D 75 feet downcoas NS 0 NS 0
Capistrano Beach
APR - OCT JAN - MAR / NOV - DEC % Exceed # Sanples % Exceed # Sanples
CSBMP1U 75 feet upcoast NS 0 NS 0
CSBMP1Z Drain near Point Zero 0.0% 27 0.0% 15
CSBMP1D 75 feet downcoast NS 0 0.0% 0
CSBBR1U 75 feet upcoast NS 0 NS 0
CSBBR1Z Capo Community Beach Drain 0.0% 27 0.0% 15
CSBBR1D 75 feet downcoast NS 0 NS 14
Poche Beach
APR - OCT JAN - MAR / NOV - DEC % Exceed # Sanples % Exceed # Sanples
POCHEU 75 feet upcoast 10.0% 10 0.0% 13
POCHEZ Poche Creek Point Zero 6.9% 29 22.2% 18
POCHED 75 feet downcoast 0.0% 9 7.1% 14
San Clemente City & State Beach
APR - OCT JAN - MAR / NOV - DEC
% Exceed # Sanples % Exceed # Sanples
SCCS52U 75 feet upcoast NS 0 0.0% 2
SCCS52Z Capistrano Shores North Drain 0.0% 27 0.0% 16
SCCS52D 75 feet downcoast NS 0 0.0% 2
SCCS17U 75 feet upcoast NS 0 NS 0
SCCS17Z Capistrano Shores South Drain NS 0 NS 0
SCCS17 75 feet downcoast NS 0 NS 0
PICOU 75 feet upcoast 0.0% 1 0.0% 0
PICOZ Pico Drain at North Beach Point Zero 3.5% 29 0.0% 13
PICOD 75 feet downcoast 0.0% 1 0.0% 8
MARIPOU 75 feet upcoast NS 0 NS 0
MARIPOz Mariposa Lane Drain Point Zero 0.0% 26 0.0% 12
MARIPOD 75 feet downcoast NS 0 NS 0
LINDALU 75 feet upcoast NS 0 0.0% 2
LINDALZ San Clemente Pier Drain Point Zero 0.0% 26 0.0% 14
LINDALD 75 feet downcoast NS 0 0.0% 3
PIERU 75 feet upcoast 0.0% 19 0.0% 5
& Bay Water Quality Report - Page 58
2016 Annual Ocean, Harbor
Station # Monitoring Location % Exceed Standards AB411 Period % Exceed Standards Non AB411 Period Laguna Beach APR -
JAN - MAR / NOV - DEC % Exceed #
% Exceed # Sanples
OCT
Sanples
PIERZ
PIERD
TRFCYNU
TRFCYNZ
TRFCYND
RIVERAU
RIVERAZ
RIVERAD

LADERAU
LADERAZ
LADERAD
2016 Annual Ocean, Harbor & Bay Water Quality Report - Page 59 Station # Monitoring Location % Exceed Standards AB411 Period % Exceed Standards Non AB411 Period
Beach APR - OCT JAN - MAR / NOV - DEC % Exceed # Sanples % Exceed # Sanples
Laguna
18
San Clemente Pier Drain Point Zero 25.0% 36 44.0%
75 feet downcoast 0.0% 18 50.0% 6
75 feet upcoast 0.0% 1 0.0% 2
Trafalgar Canyon Creek Point Zero 3.5% 29 17.6% 17
75 feet downcoast 0.0% 1 0.0% 2
75 feet upcoast NS 0 NS 0
Riviera Beach Drain Point Zero 0.0% 26 0.0% 9
75 feet downcoast NS 0 NS 0
75 feet upcoast NS 0 NS 0
Boca Del Canon Drain Point Zero 0.0% 27 0.0% 15
75 feet downcoast NS 0 NS 0
Balboa
Island Newport Beach

of Orange Health Care Agency Public Health Services Environmental Health 1241 East Dyer Road, Suite 120 Santa Ana, CA 92705 (714) 433-6000 Web Page: www ocbeachinfo com Twitter: twitter com/ochealth Hotline: (714) 433-6400
County
The
Wedge Newport Beach
