
TODAY’S REAL ESTATE ALONG FLORIDA’S EAST COASTTRENDS MARKET REPORT SEPTEMBER 2022

Aligned by a passion for South Florida and leading with sportsmanship, the Miami Dolphins are the perfect partner to open new opportunities for our agents to connect with the players and fans in a way no other brokerage can.


Partnering with the Miami Dolphins is all about harnessing the power sports has to bring people together. We wanted to reach our community and clientele on a personal level. Being recognized as an o cial real estate partner of the Miami Dolphins is a tribute to what it means to work with ONE Sotheby's International Realty.”
DANIEL DE LA VEGA, PRESIDENT ONE SOTHEBY’S INTERNATIONAL REALTYThe September edition of our TRENDS market report brings strategic perspectives on real estate from Miami, all the way to Amelia Island.
The housing market rebounded from July as the sale pace increased in nearly all counties along Florida’s East Coast. The favorable economic conditions, driven by a tight labor market and wage growth, have boosted consumer confidence in the last month while attracting new residents to the region.
As the selling season begins, keeping a close eye on the market allows us to better advise our clients so they can make an informed next move. We’ll continue to combine our partners’ analytical approach and global viewpoint with the local knowledge of our real estate professionals to provide the most exclusive service within the regional luxury real estate industry.
Florida’s East Coast keeps catching attention as a primary residence destination, outpacing other parts of the country. With an innovative marketing strategy, cutting-edge tools and technology, alongside the highest caliber of expertise of our real estate associates, ONE Sotheby’s International Realty will continue to raise industry standards as we look forward to more outstanding results.
Daniel de la Vega President ONE Sotheby’s International Realty

ONE Sotheby’s International Realty presents the only market report focused on Florida’s East Coast. From Miami to Amelia Island, data is presented from a macro perspective down to city level.
Data is sourced from local Multiple Listing Service (MLS) organizations. Written analysis created in partnership with the Rosen Consulting Group, a nationally recognized consulting firm and trusted advisor to top public and private real estate operators and capital providers.

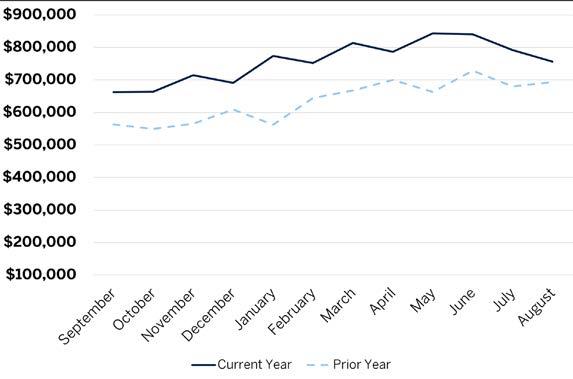
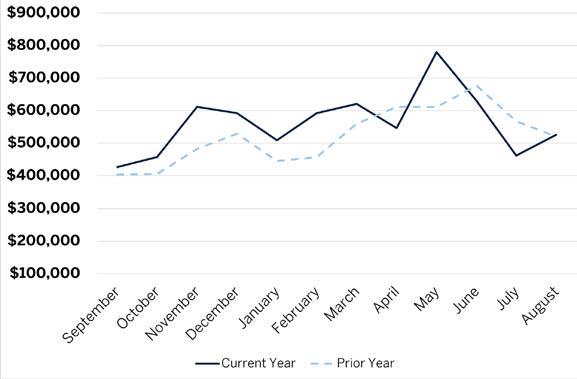
The regional housing market rebounded from July as positive economic conditions enticed additional demand and allowed potential buyers to adjust to higher mortgage rates. With an unemployment rate in the 2% to 3% range in most counties along the Florida East Coast, the tight labor market and wage growth have helped to improve consumer confidence in the last month while attracting new residents to the region.
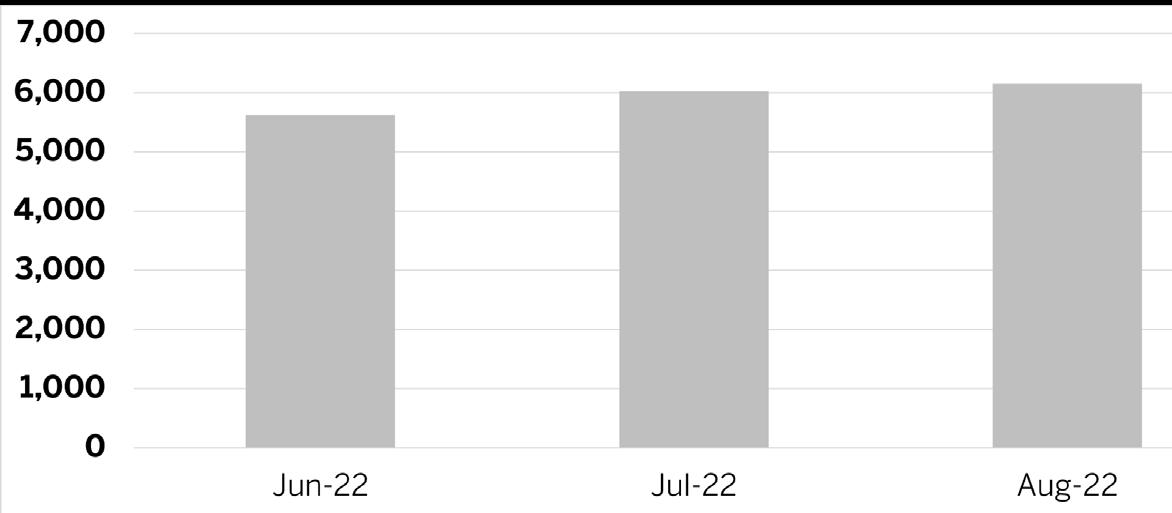
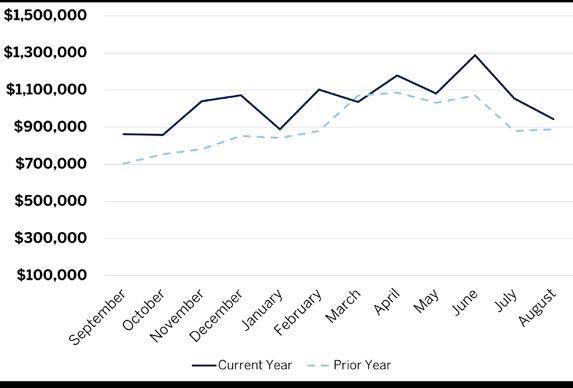
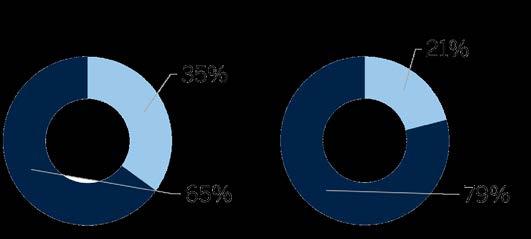
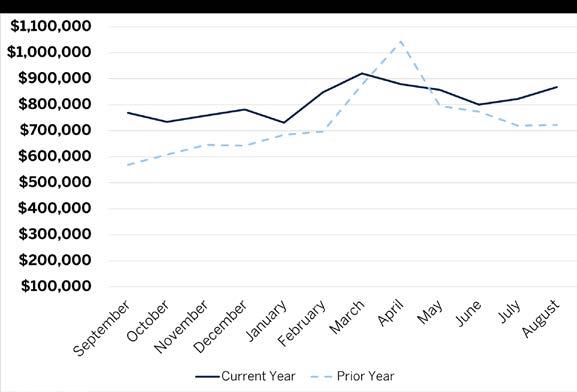
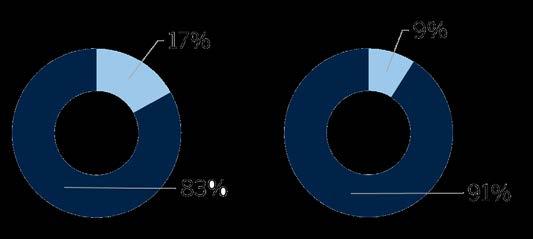
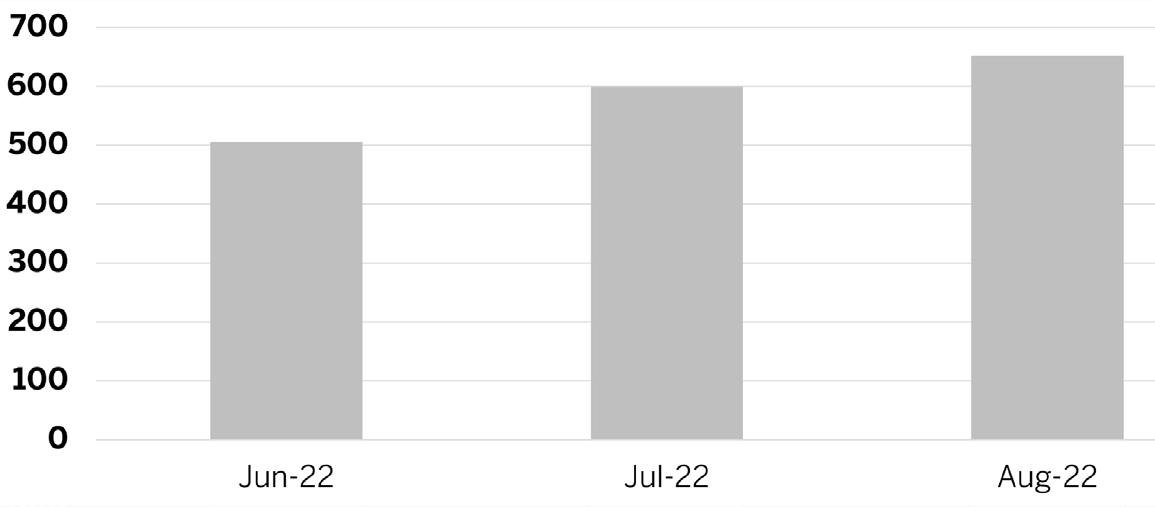
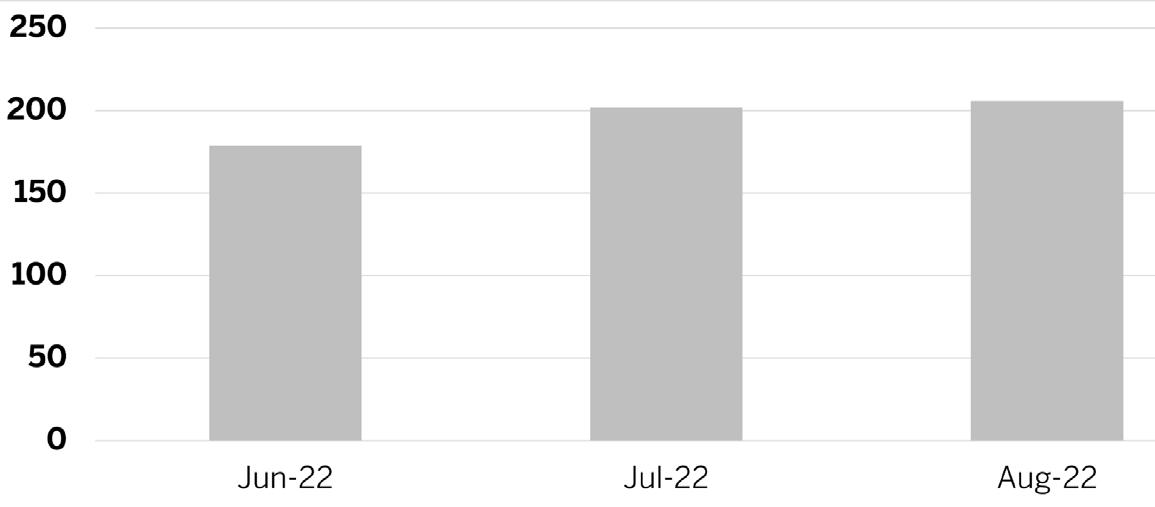
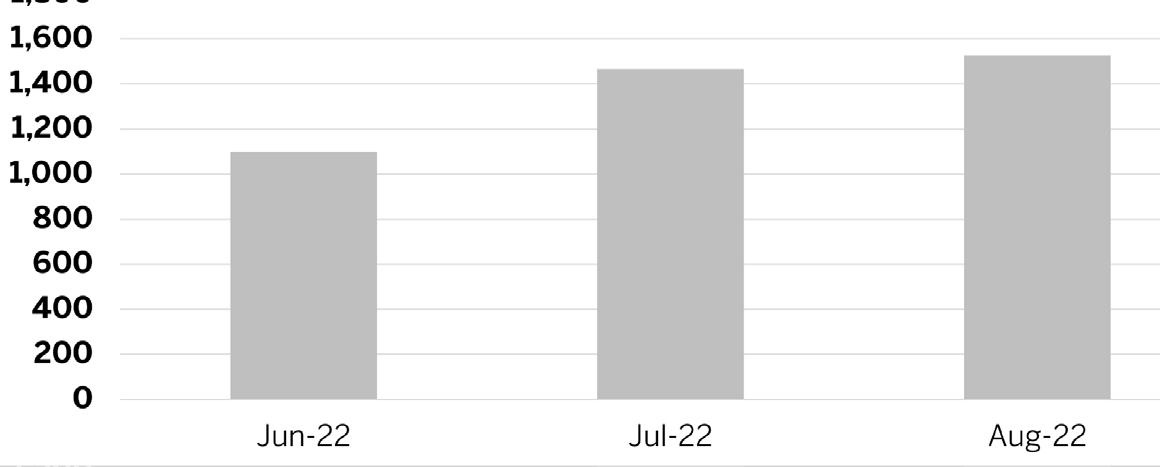
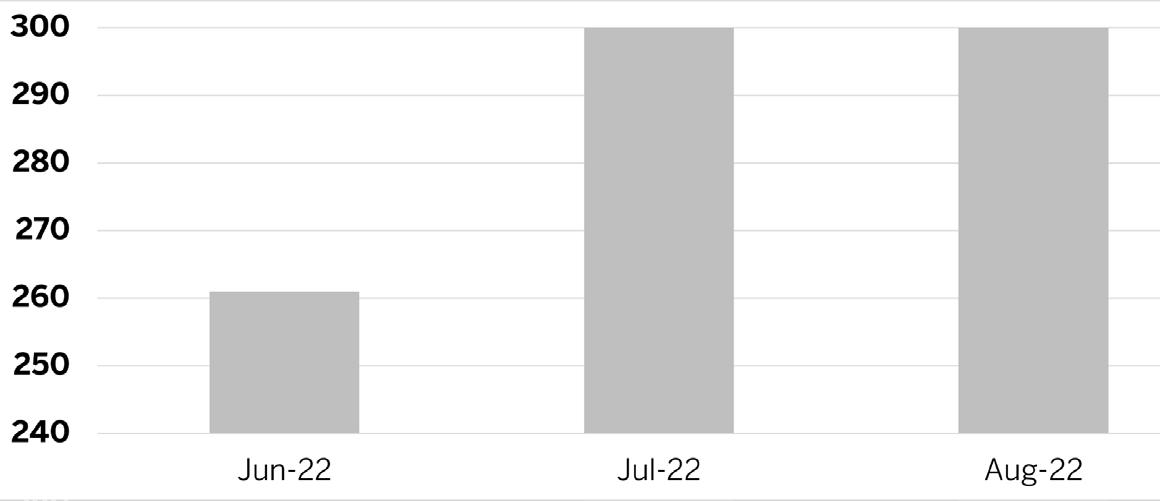
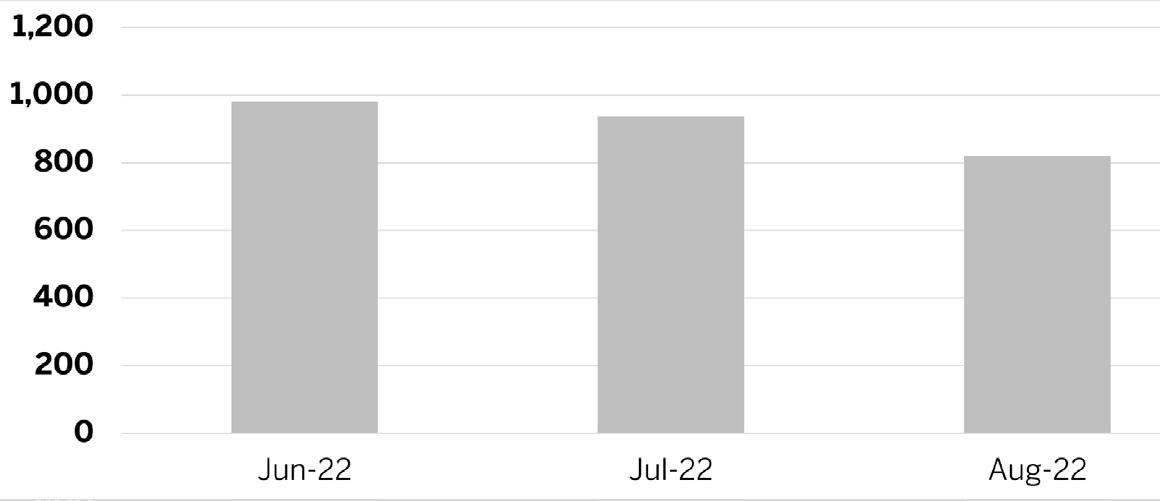
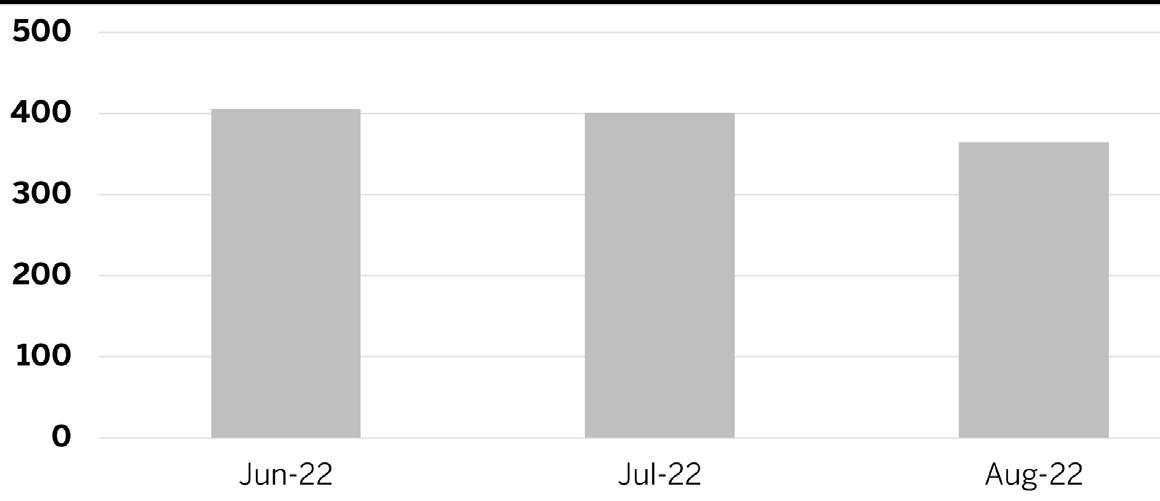
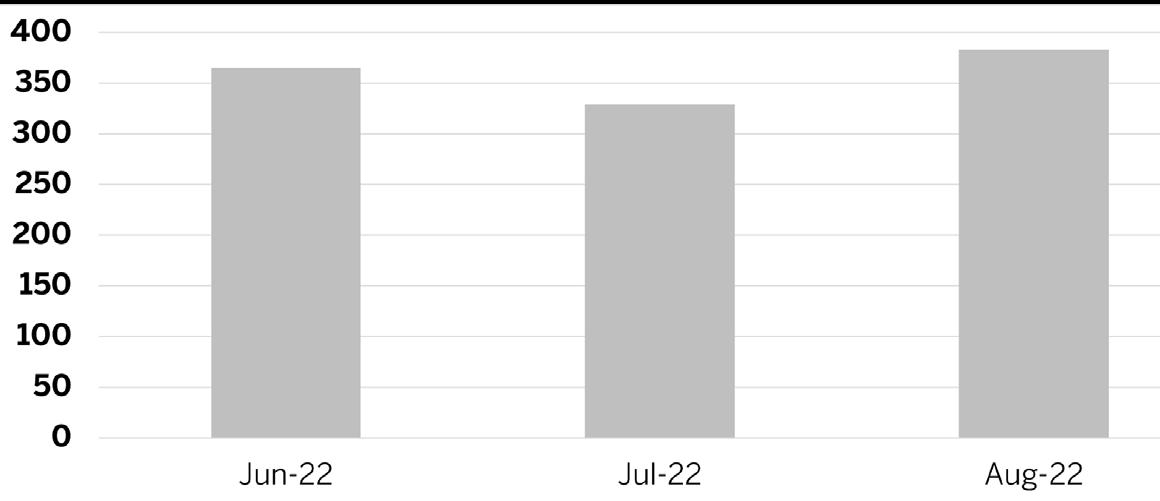
In August, total sales of condos and single-family homes increased by 7%, reversing the four-month trend of slowing sales. During the month, the pace of condo sales increased by 9%, while single-family home sales accelerated by 6%. Sales increased from July in nearly all counties along the Florida East Coast. The most significant gains in sales occurred in Brevard and Duval counties. Throughout the region, by price range, the sales volume of homes priced less than $1 million increased by more than 8%, highlighting that demand for relatively affordable housing remains elevated.

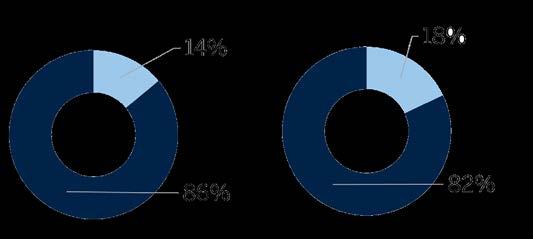
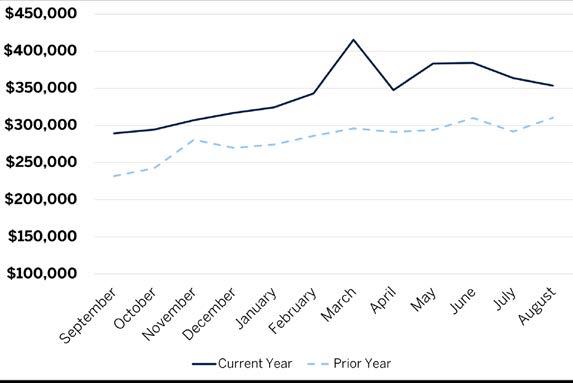
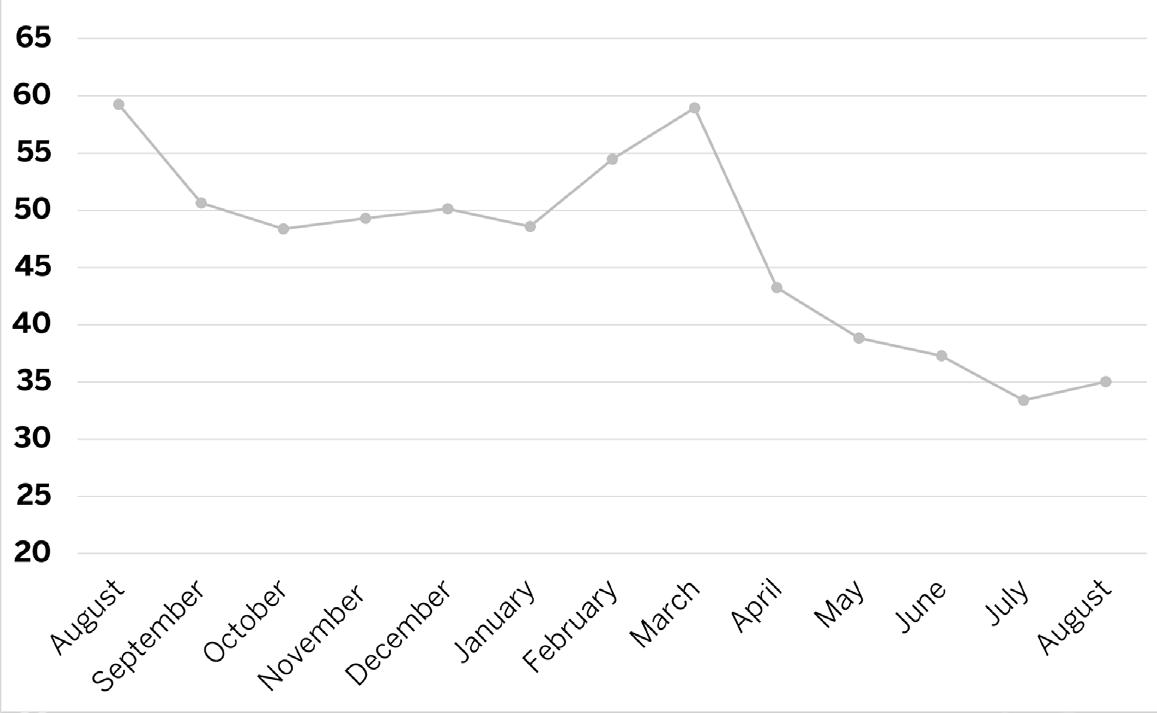
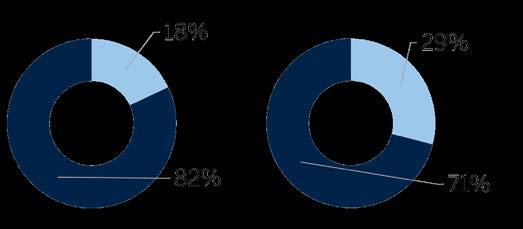
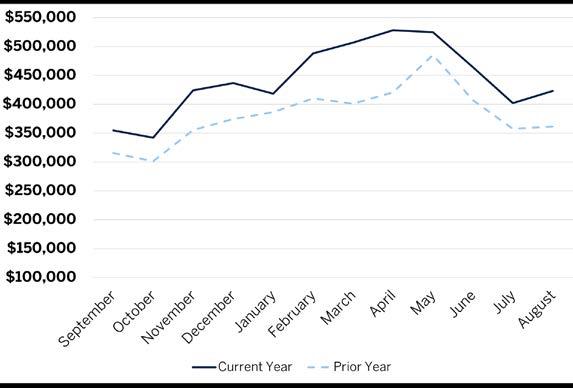
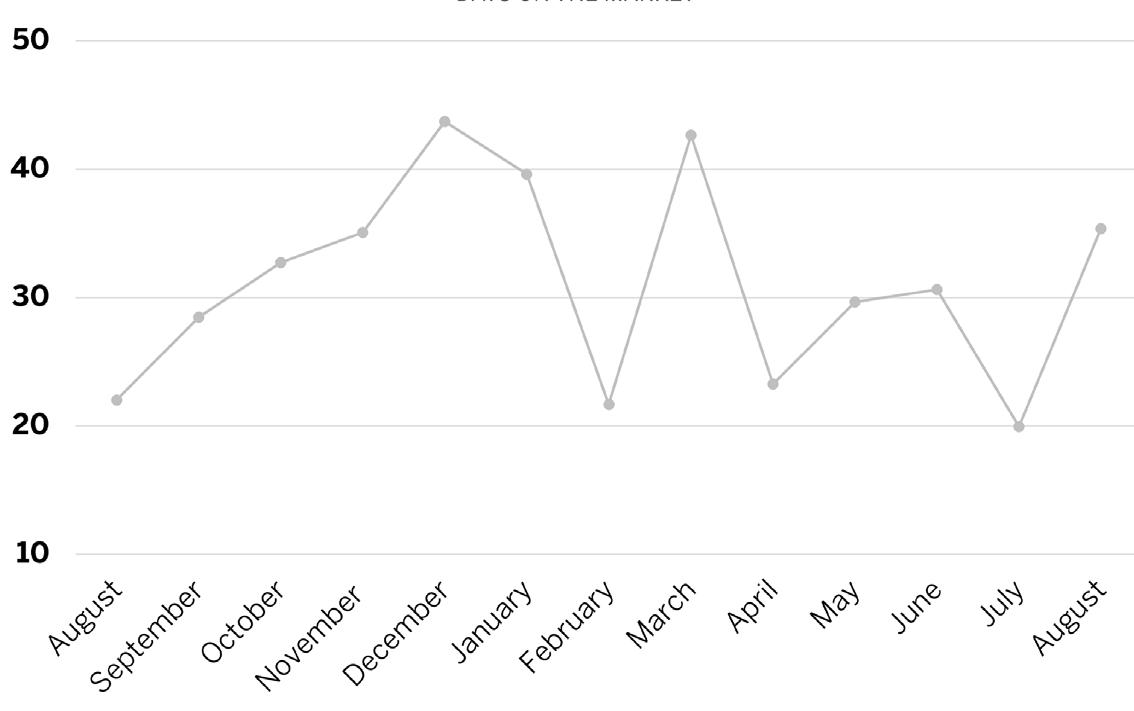
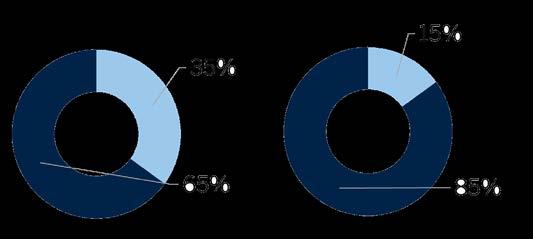
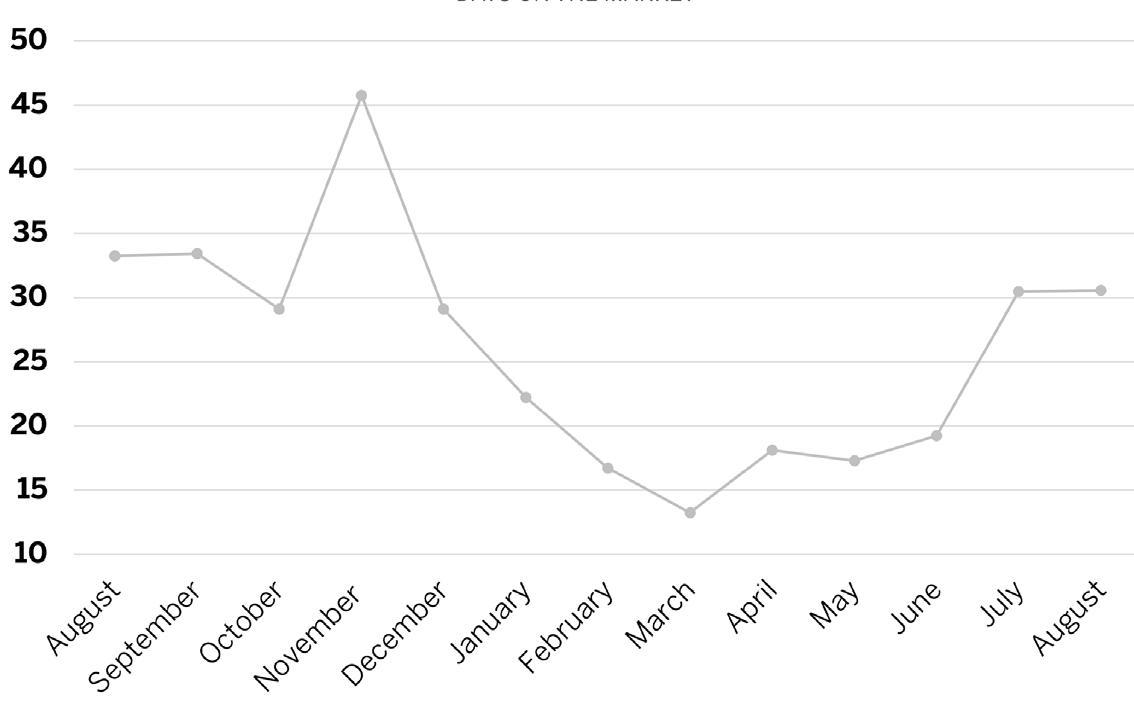
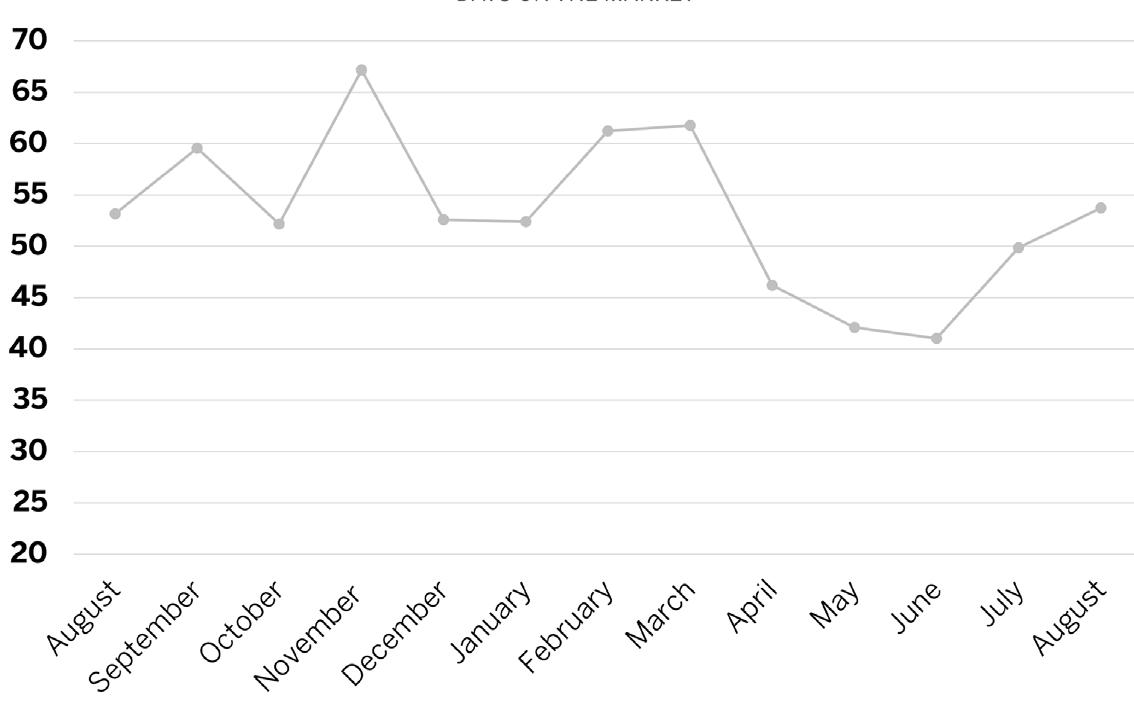
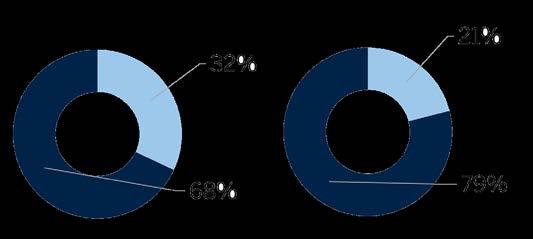
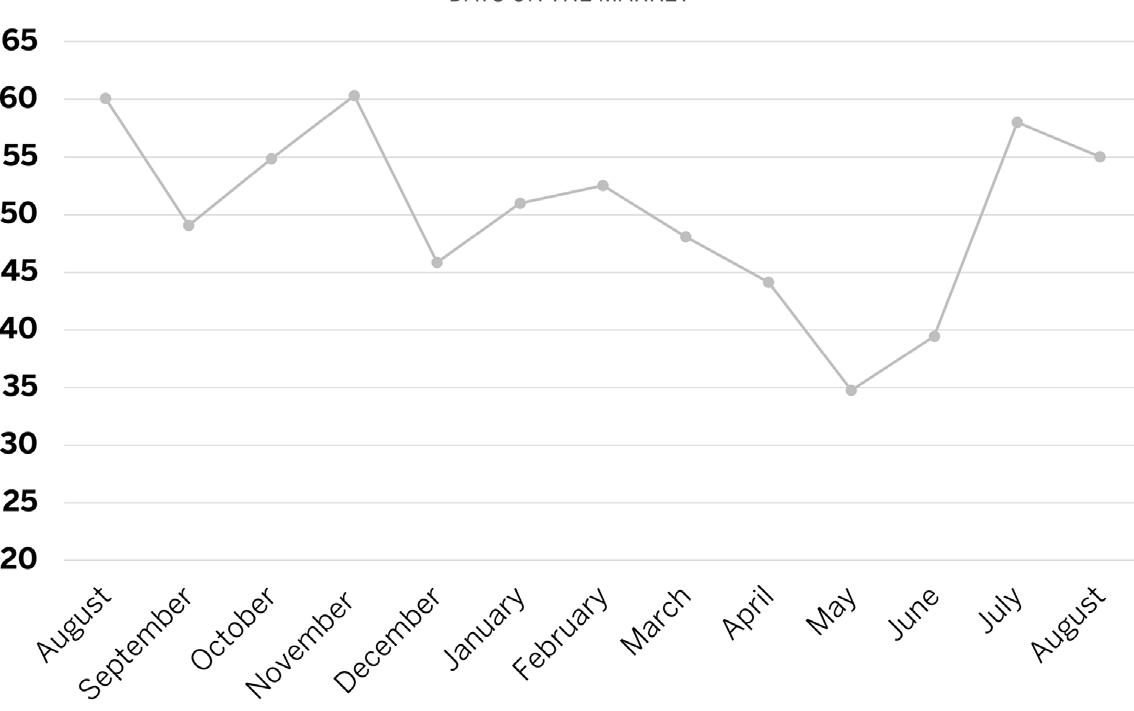
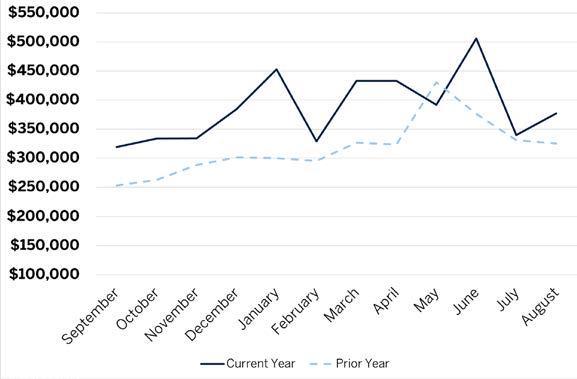
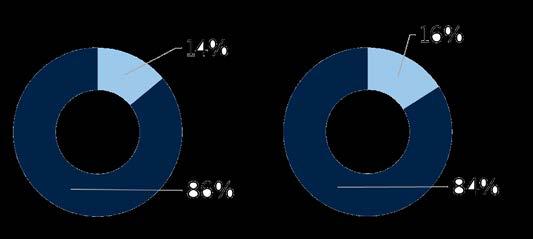
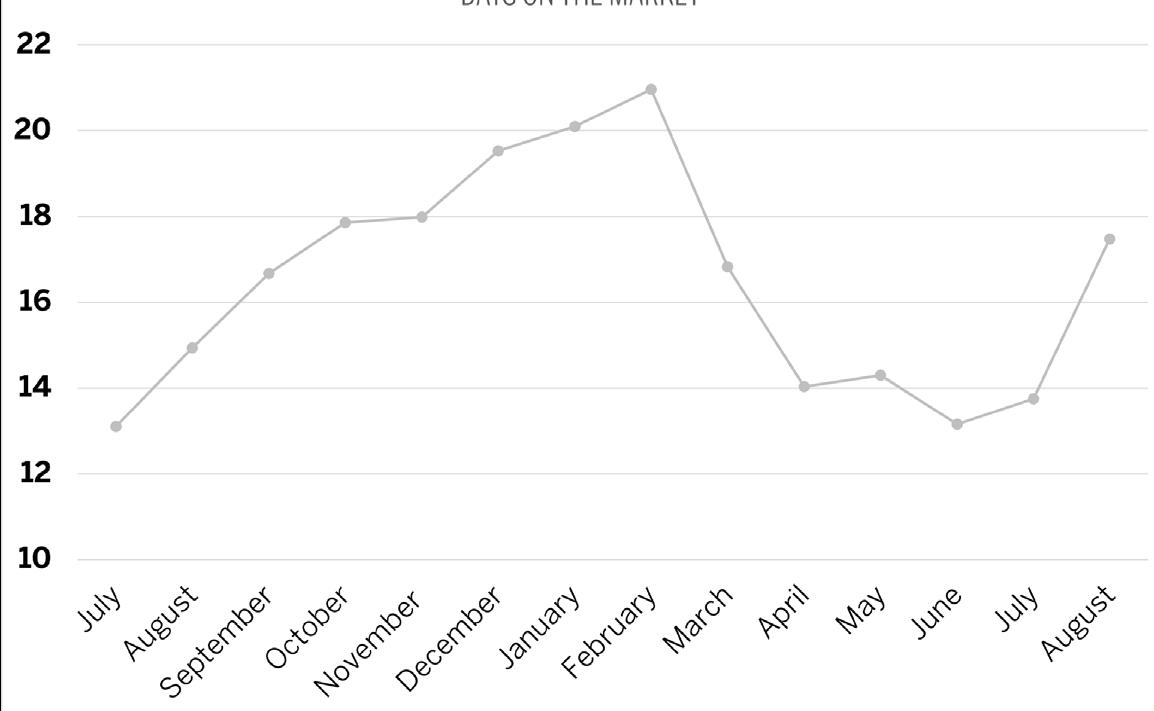
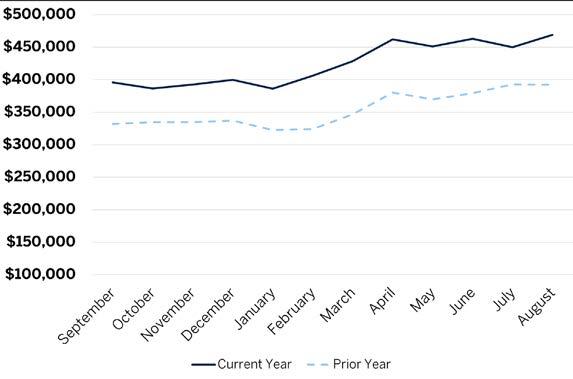
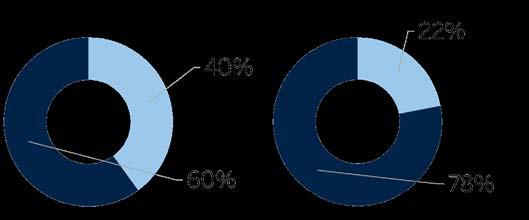
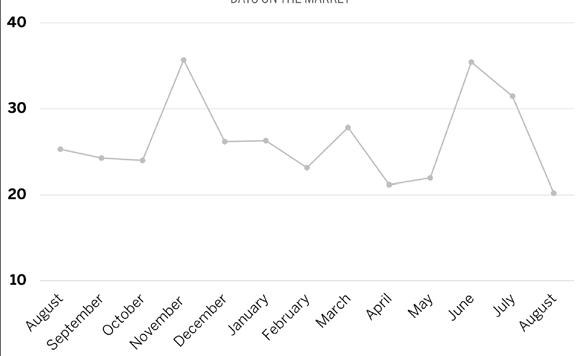
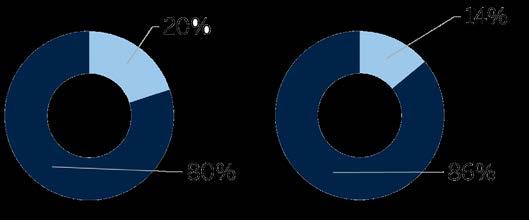
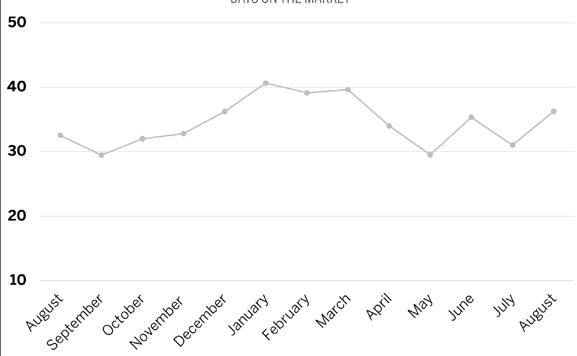
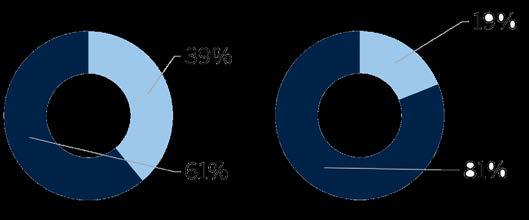
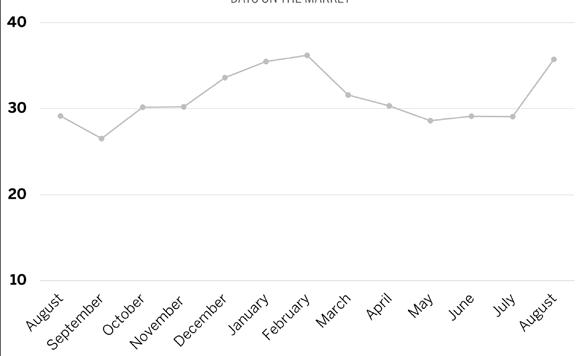
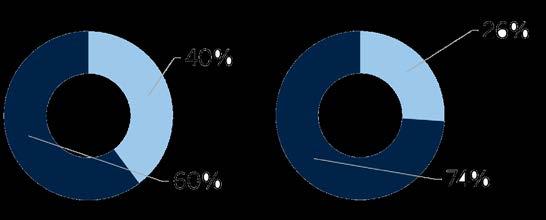
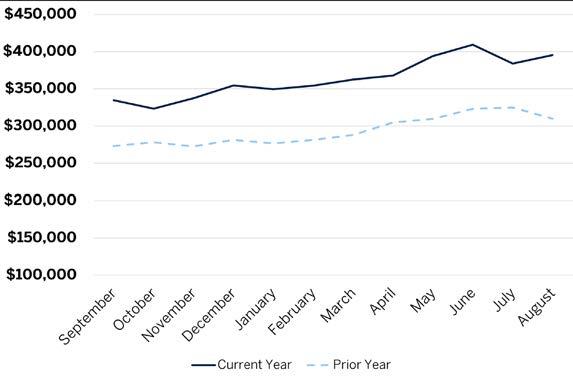
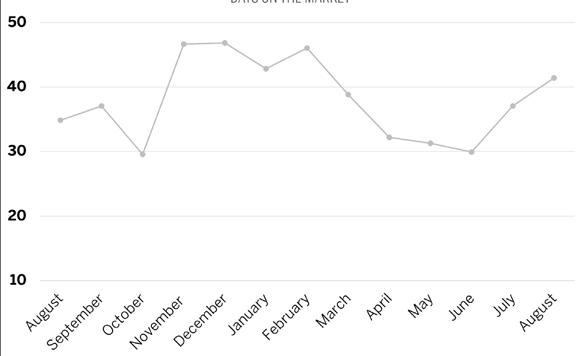
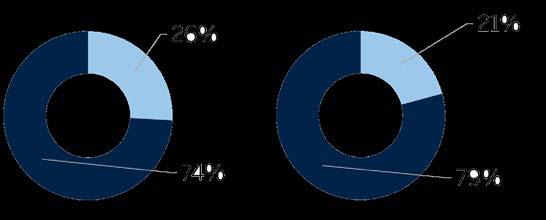
Despite the uptick in sales, homes spend more time on the market than earlier in the year. In the single-family home segment, the average time listings spend on the market is now back over a month. Miami-Dade County bucked the trend, with the average time on the market falling in August. The share of sellers receiving a premium to the list price also decreased by 23% for condos and single-family homes combined. On the other hand, the median condo price, decreased by 2% and the median single-family home price by 1% from last month. In southeast Florida, the median price increased in Indian River and Martin counties.


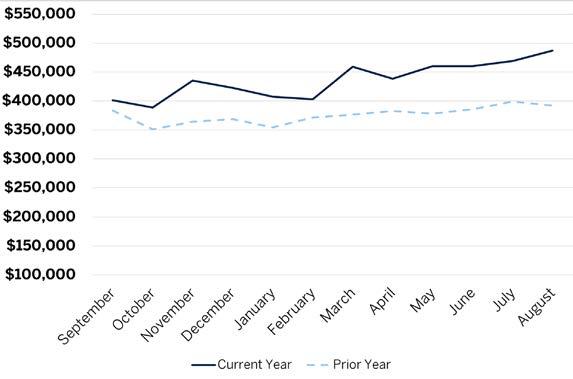
FLORIDA’S EAST COAST $465,000 1%
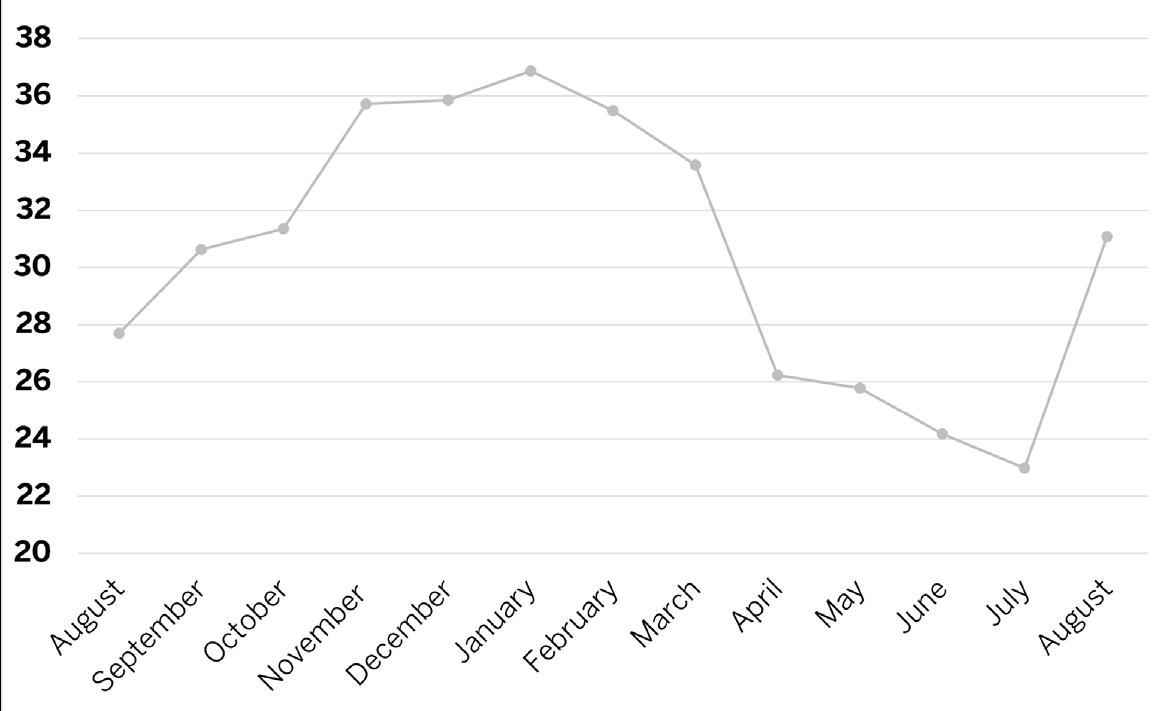
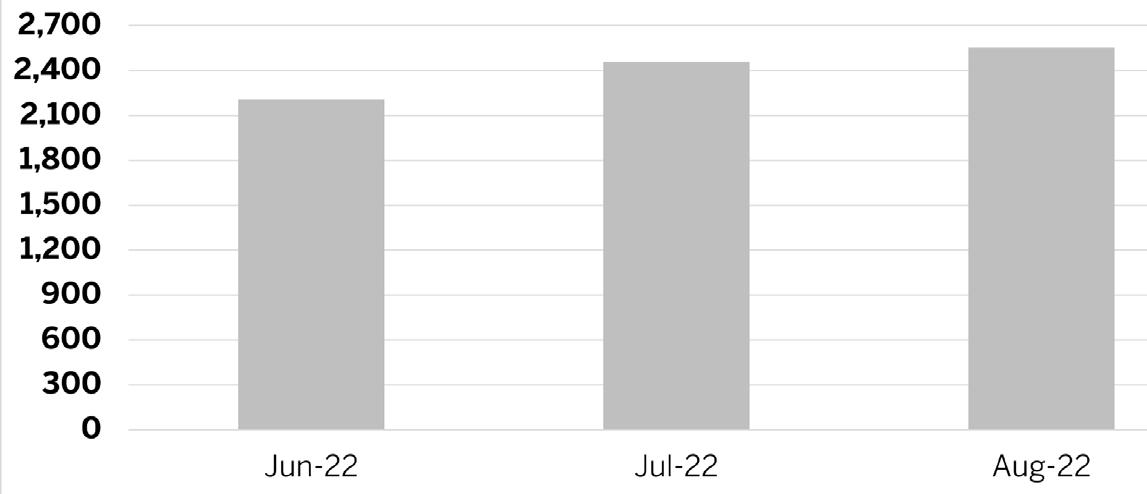
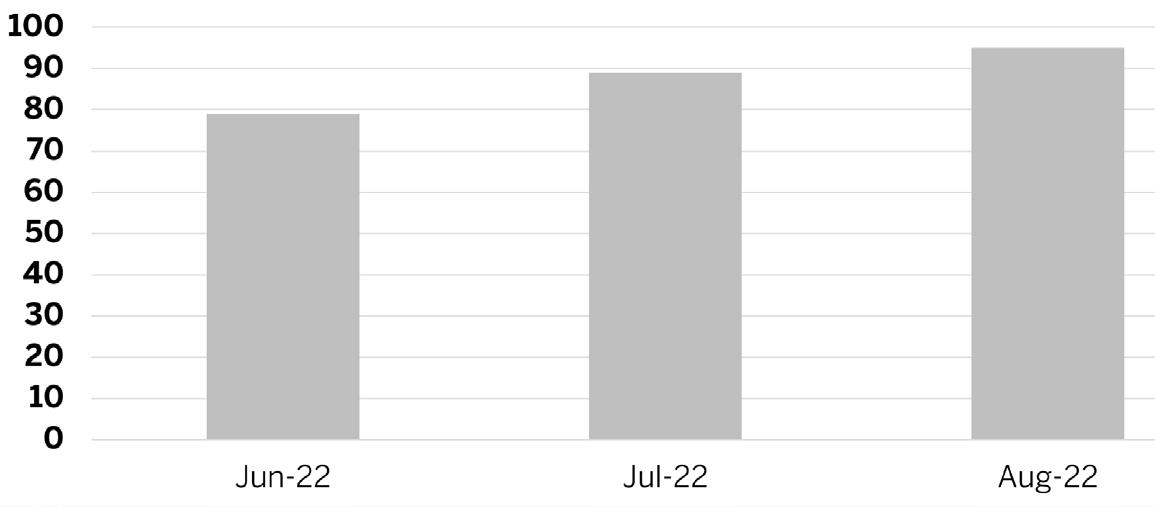
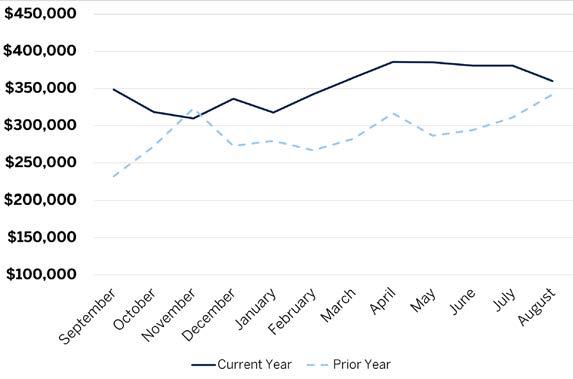
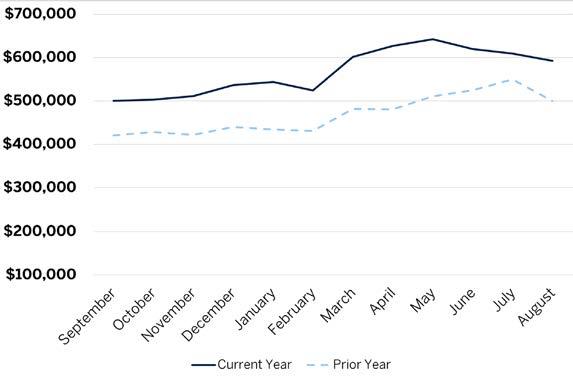
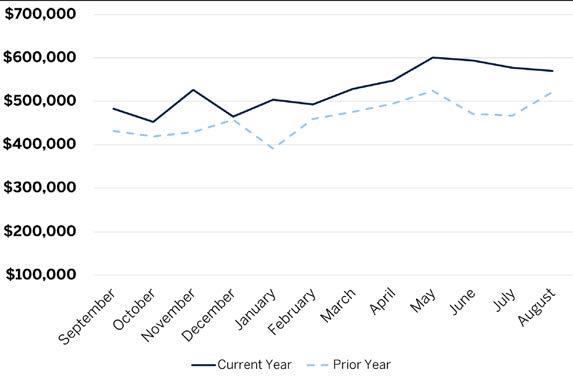
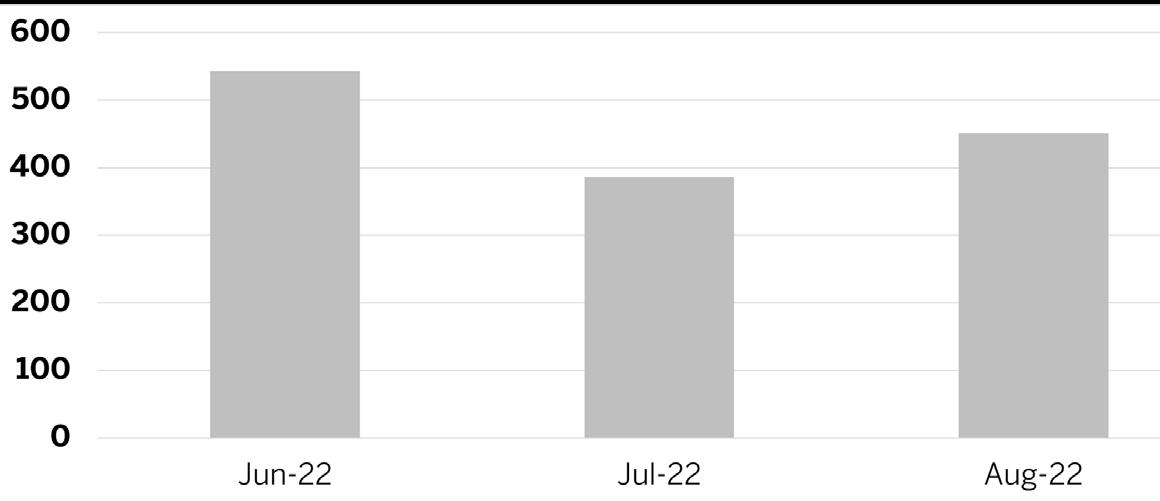
For-sale listings increased slightly in July, nearly 2%, the fifth-consecutive monthly increase. Though an increase in inventory is sometimes a sign of a softening market, the offsetting increase in sales highlights that buyer demand is persistent. Additionally, at the current sales pace, supply would be absorbed within a little over two months, within the range of historical norms. Relative to the historical lows in for-sale supply to begin the year, the increase in options for potential buyers is vital to a sustainable and healthy housing market.
AUG 22
MONTH AUG 22 YOY% CHANGE AUG 22 YOY% CHANGE AUG 22 YOY% CHANGE AUG 22 YOY% CHANGE AUG 22
SINGLE FAMILY HOMES 3,792 4% $559,000 11% $895,255 -10% $407 8% 1,011 -19% $25,000,000
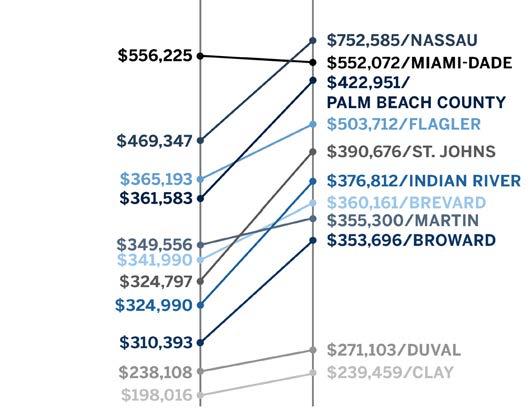
CONDOS 6,151 2% $375,000 12% $552,072 -1% $430 13% 1,407 -25% $12,500,000
SINGLE FAMILY HOMES 1,525 4% $376,000 16% $468,935 20% $237 20% 887 -12% $5,300,000
CONDOS 310 0% $270,000 9% $360,161 5% $262 14% 157 -18% $1,300,000
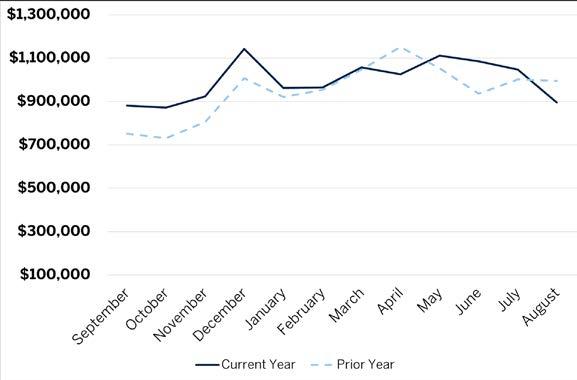
SINGLE FAMILY HOMES 3,267 6% $568,000 14% $755,930 9% $353 17% 1,146 -26% $32,500,000
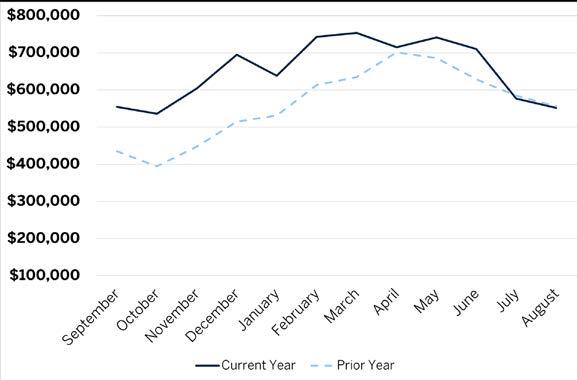
CONDOS 3,295 7% $262,000 19% $353,696 14% $264 20% 1,401 -17% $13,600,000

SINGLE FAMILY HOMES 652 9% $392,000 11% $525,349 1% $253 8% 245 -9% $3,000,000
CONDOS 206 2% $276,000 15% $376,812 16% $264 29% 92 5% $1,700,000
SINGLE FAMILY HOMES 180
CONDOS
$750,000 47% $867,899 20% $348 24% 79 -15% $4,500,000
$325,000 44% $355,300 2% $283 24% 45 -6% $1,025,000
The early summer trends may prove to be temporary as sales activity picked up in August. The strong economy and influx of new residents will continue to buoy demand for homes through the remainder of the year. While pricing and buyer competition may decrease in the coming months, it will be driven primarily by higher mortgage rates and reduced affordability rather than a lack of housing demand. Overall, the Florida East Coast housing market stays strong, outpacing other parts of the country.
FLORIDA’S EAST COAST
SINGLE FAMILY HOMES AND CONDOMINIUMS
 SINGLE


Situated along the beautiful coastline of South Brickell, The St. Regis Residences, Miami epitomize elegant living. It mirrors the sensibilities of those who are driven by connoisseurship, demand excellence, respect tradition and value individuality above all else.
St. Regis represents a future propelled by a historic past. It’s a place where new generations will create lifetimes of legendary moments, in one-of-a-kind homes for individuals who perceive their personal legacies innately intertwined with the rich heritage of Miami.
 ORAL REPRESENTATIONS CANNOT BE RELIED UPON AS CORRECTLY STATING REPRESENTATIONS OF THE DEVELOPER. FOR CORRECT REPRESENTATIONS, MAKE REFERENCE TO THE DOCUMENTS REQUIRED BY SECTION 718.503, FLORIDA STATUTES, TO BE FURNISHED BY A DEVELOPER TO A BUYER OR LESSEE.
The St. Regis Residences, Miami East Tower a condominium within The St. Regis Residences, Miami (the “Condominium”) is developed by 1809 Brickell Property Owner, LLC (“Developer”) and this offering is made only by the Developer’s Prospectus for the Condominium. Sketches, renderings, or photographs depicting lifestyle, amenities, food services, club services, rental services, hosting services, finishes, designs, materials, furnishings, fixtures, appliances, cabinetry, soffits, lighting, countertops, floor plans, specifications, or art are proposed only, and the Developer reserves the right to modify, revise, or withdraw any or all of the same in its sole discretion. Pursuant to license agreements, and for so long as the license agreement governing use of a name is not terminated or expired, Developer has a right to use the trade names, marks, and logos of: (1) St Regis; (2) St. Regis Residences; (3) The Related Group; and (3) Integra Investments, LLC, each of which is a licensor and none of which is the Developer. Marriott International, Inc. is not responsible for the marketing, development, or sales of the Condominium. Consult the Developer’s Prospectus for the proposed budget, terms, conditions, specifications, fees, and Unit dimensions. The Developer is not incorporated in, located in, nor a resident of, New York. This is not intended to be an offer to sell, or solicitation of an offer to buy, condominium units in New York or to residents of New York, or of any other jurisdiction were prohibited by law. 2022 © 1809 Brickell Property Owner, LLC, with all rights reserved.
ORAL REPRESENTATIONS CANNOT BE RELIED UPON AS CORRECTLY STATING REPRESENTATIONS OF THE DEVELOPER. FOR CORRECT REPRESENTATIONS, MAKE REFERENCE TO THE DOCUMENTS REQUIRED BY SECTION 718.503, FLORIDA STATUTES, TO BE FURNISHED BY A DEVELOPER TO A BUYER OR LESSEE.
The St. Regis Residences, Miami East Tower a condominium within The St. Regis Residences, Miami (the “Condominium”) is developed by 1809 Brickell Property Owner, LLC (“Developer”) and this offering is made only by the Developer’s Prospectus for the Condominium. Sketches, renderings, or photographs depicting lifestyle, amenities, food services, club services, rental services, hosting services, finishes, designs, materials, furnishings, fixtures, appliances, cabinetry, soffits, lighting, countertops, floor plans, specifications, or art are proposed only, and the Developer reserves the right to modify, revise, or withdraw any or all of the same in its sole discretion. Pursuant to license agreements, and for so long as the license agreement governing use of a name is not terminated or expired, Developer has a right to use the trade names, marks, and logos of: (1) St Regis; (2) St. Regis Residences; (3) The Related Group; and (3) Integra Investments, LLC, each of which is a licensor and none of which is the Developer. Marriott International, Inc. is not responsible for the marketing, development, or sales of the Condominium. Consult the Developer’s Prospectus for the proposed budget, terms, conditions, specifications, fees, and Unit dimensions. The Developer is not incorporated in, located in, nor a resident of, New York. This is not intended to be an offer to sell, or solicitation of an offer to buy, condominium units in New York or to residents of New York, or of any other jurisdiction were prohibited by law. 2022 © 1809 Brickell Property Owner, LLC, with all rights reserved.


While sales stabilized in August, the median price decreased by 4%. Though fewer homes sold at a premium to the listed price, the decrease was the smallest compared to surrounding counties.
MIAMI-DADE COUNTY
$895,255 $996,084 -10% $407 8% 1,011 -19% 35
AVENTURA $4,076,667 $981,167 315% $967 158% 3 -50% 82
BAL HARBOUR N/A $3,575,000 N/A N/A N/A - N/A N/A
BAY HARBOR ISLANDS
$6,150,000 $8,625,000 -29% $1,472 15% 2 0% 76

COCONUT GROVE $2,478,000 $3,481,000 -29% $947 N/A 13 N/A 34
CORAL GABLES $1,715,000 $2,511,000 -31% $717 12% 32 -48% 23
FISHER ISLAND N/A N/A N/A N/A N/A - N/A N/A
GOLDEN BEACH $25,000,000 $6,182,500 304% $1,894 74% 1 -50% 74
INDIAN CREEK N/A N/A N/A N/A N/A - N/A N/A
KEY BISCAYNE $5,957,083 $4,290,755 39% $1,609 44% 6 -57% 50
MIAMI $726,923 $725,586 0% $374 12% 485 -13% 37
MIAMI BEACH $3,015,700 $5,732,837 -47% $997 -12% 20 -33% 46
MIAMI SHORES $1,652,750 $1,148,416 44% $742 37% 12 -37% 31
NORTH BAY VILLAGE $1,069,750 $700,000 53% $515 49% 1 0% 7
PINECREST $2,811,250 $2,162,604 30% $743 43% 9 -70% 60
SOUTH MIAMI $1,652,591 $1,184,063 40% $732 58% 11 -31% 52

SUNNY ISLES BEACH $1,200,000 N/A N/A N/A N/A 2 N/A 103
SURFSIDE $1,648,750 $2,034,700 -19% $752 -6% 4 -60% 76
<$500,000 $403,741 $387,049 4% $304 15% 396 -36% 33
$500,000-$999,999 $668,729 $688,999 -3% $361 6% 432 12% 31 $1MM-$4.99MM $1,875,800 $2,004,944 -6% $673 9% 168 -22% 44 >$5MM $9,413,053 $11,661,715 -19% $1,858 6% 15 -42% 67

For-sale listings increased by 2%, one of the smallest increases in the region. However, sales also increased by only a small amount, roughly 8%, compared to the neighboring counties.

MIAMI-DADE COUNTY
$552,072 $556,225 -1% $430 13% 1,407 -25% 45
AVENTURA $572,069 $481,430 19% $353 25% 97 -42% 48
BAL HARBOUR $2,075,000 $1,234,556 68% $1,141 72% 8 -56% 113
BAY HARBOR ISLANDS $589,889 $482,600 22% $458 32% 9 -40% 58
BRICKELL/DOWNTOWN MIAMI/EDGEWATER $710,253 $672,981 6% $601 25% 166 -34% 56
COCONUT GROVE $775,000 $1,156,000 -7% $729 37% 24 33% 25
CORAL GABLES $506,000 $786,000 -38% $517 16% 17 -60% 45
FISHER ISLAND
N/A N/A N/A N/A N/A - N/A N/A
GOLDEN BEACH N/A N/A N/A N/A N/A - N/A N/A
INDIAN CREEK
N/A N/A N/A N/A N/A - N/A N/A
KEY BISCAYNE $1,448,381 $1,250,656 16% $821 14% 21 -53% 75
MIAMI $411,202 $391,838 5% $363 15% 420 -25% 38
MIAMI BEACH $698,228 $804,688 -13% $615 6% 167 -23% 58
MIAMI SHORES
$298,000 $435,000 -31% $243 -4% 2 100% 40
NORTH BAY VILLAGE $445,778 $387,731 15% $354 10% 18 38% 36
PINECREST $456,833 $400,830 14% $376 34% 9 -10% 30
SOUTH MIAMI $387,225 $247,500 56% $441 59% 4 -50% 6
SUNNY ISLES BEACH $1,300,000 $1,128,473 15% $613 6% 72 -41% 79
SURFSIDE $1,313,571 $1,100,650 19% $1,002 27% 7 -30% 218
<$500,000 $309,557 $287,738 8% $320 13% 973 -29% 34
$500,000-$999,999 $678,993 $691,587 -2% $536 7% 310 5% 59 $1MM-$4.99MM
$1,837,067 -4% $954 16% 116 -39% 95 >$5MM
$7,166,923 7% $1,789 -5% 8 -38% 146

For-sale listings increased compared to last month, yet the months of supply at the current sales pace remained less than three months, much lower than the pre-pandemic level. Though sales volume declined slightly, the more than 1,100 homes sold are greater than the trough earlier in the year.
BROWARD COUNTY
$755,930 $693,345 9% $353 17% 1,146 -26% 31
COOPER CITY $774,205 $666,007 16% $358 20% 22 -27% 34
CORAL SPRINGS $691,687 $612,680 13% $302 25% 87 -36% 21
DAVIE $814,151 $813,198 0% $342 18% 64 -17% 35
DEERFIELD BEACH $629,939 $406,959 55% $343 35% 33 -8% 27
FORT LAUDERDALE $1,328,639 $1,339,520 -1% $491 6% 152 -21% 41

HALLANDALE $1,515,000 $809,350 87% $584 66% 5 -38% 58
HILLSBORO BEACH N/A N/A N/A N/A N/A - N/A N/A
HOLLYWOOD $554,620 $527,863 5% $355 15% 96 -21% 29
LAUDERDALE-BY-THE-SEA $1,100,125 N/A N/A $679 N/A 4 N/A 34
LIGHTHOUSE POINT $1,357,500 $1,462,522 -7% $562 9% 8 -65% 30
MIRAMAR $622,632 $525,540 18% $306 25% 71 -28% 29
PARKLAND $1,264,306 $989,063 28% $375 27% 50 -37% 29
PEMBROKE PINES $654,818 $531,688 23% $312 22% 90 -27% 26
PLANTATION $777,152 $643,066 21% $323 25% 50 -33% 27

POMPANO BEACH $572,554 $575,708 -1% $373 6% 54 -32% 27
SOUTHWEST RANCHES $1,138,667 $1,138,100 0% $434 29% 3 -79% 21
SUNRISE $460,330 $406,342 13% $290 12% 47 -18% 28
WESTON $983,760 $801,307 23% $376 26% 58 -39% 35
WILTON MANORS $783,469 $653,545 20% $496 16% 16 -16% 26
While sales increased by 11%, Broward County remains one of the more competitive housing markets in the region. In August, 29% of units sold for more than the list price, the highest number for condos in the region.

BROWARD COUNTY
PRICE
CHANGE
$353,696 $310,393 14% $264 20% 1,401 -17% 35
COOPER CITY $374,000 $349,325 7% $282 14% 4 -60% 8
CORAL SPRINGS $279,990 $196,353 43% $219 27% 59 -5% 20
DAVIE $293,305 $241,799 21% $225 24% 40 -45% 16
DEERFIELD BEACH $229,175 $232,763 -2% $190 13% 87 -12% 27
FORT LAUDERDALE $778,289 $580,746 34% $465 30% 177 -33% 51
HALLANDALE $353,680 $312,106 13% $314 17% 89 -31% 57

HILLSBORO BEACH $667,833 $830,833 -20% $511 32% 6 -33% 38
HOLLYWOOD $414,975 $431,524 -4% $344 17% 107 -8% 52
LAUDERDALE-BY-THE-SEA $928,250 $775,343 20% $508 29% 8 -60% 21
LIGHTHOUSE POINT $255,889 $257,322 -1% $248 10% 9 0% 29
MIRAMAR $349,012 $297,545 17% $258 21% 41 8% 25
PARKLAND $579,000 $444,400 30% $344 35% 5 -44% 12
PEMBROKE PINES $288,480 $234,899 23% $235 27% 109 -19% 23
PLANTATION $268,732 $228,943 17% $201 8% 49 -20% 32
POMPANO BEACH $355,600 $312,550 14% $271 14% 110 -15% 28
SOUTHWEST RANCHES N/A N/A N/A N/A N/A - N/A N/A
SUNRISE $243,897 $199,683 22% $207 45% 94 -3% 36
WESTON $389,425 $332,586 17% $285 16% 28 27% 19 WILTON MANORS $458,404 $344,779 33% $313 40% 20 43% 21

Sales increased by 10%, one of the more significant increases in the region. With listing volume stable, the months of supply fell to roughly three months.

PALM BEACH COUNTY
$944,732 $889,432 6% $369 21% 1,121 -20% 30
BOCA RATON $1,262,127 $1,017,361 24% $437 36% 175 -25% 31

BOYNTON BEACH $583,949 $493,313 18% $286 24% 178 -122% 26
DELRAY BEACH $946,809 $1,057,352 -10% $369 9% 75 -39% 24
HIGHLAND BEACH $9,550,000 N/A N/A $2,192 N/A 1 N/A -
JUNO BEACH $1,395,000 $265,000 426% $566 155% 1 0% 43
JUPITER $1,269,373 $1,029,092 23% $501 35% 80 -9% 31
JUPITER INLET COLONY
N/A N/A N/A N/A N/A - N/A N/A
LAKE PARK $430,167 $296,286 45% $292 59% 6 -14% 23
LAKE WORTH $546,205 $465,762 17% $258 15% 114 -16% 30
LANTANA $401,000 $918,879 -56% $288 -12% 4 -71% 32
NORTH PALM BEACH $2,184,281 $1,929,100 13% $591 34% 9 -10% 24
MANALAPAN N/A N/A N/A N/A N/A - N/A N/A
PALM BEACH $12,850,064 $16,273,207 -21% $2,911 10% 5 -44% 54
PALM BEACH GARDENS $1,237,924 $1,282,089 -3% $461 23% 76 -13% 27
SINGER ISLAND $2,675,000 $805,000 232% $1,219 130% 1 0% 1
TEQUESTA $661,250 $1,997,240 -67% $438 -19% 4 -60% 15
WELLINGTON $1,045,433 $869,339 20% $354 16% 72 -23% 35
WEST PALM BEACH $721,073 $573,676 26% $330 26% 120 -37% 37


The number of sales, median price and share of homes sold above the list price all moved by 1% in August.
PALM BEACH COUNTY
CHANGE
$422,951 $361,583 17% $238 20% 982 -28% 29
BOCA RATON $433,765 $438,847 -1% $239 3% 178 -38% 33
BOYNTON BEACH $311,278 $245,717 27% $191 25% 94 -29% 21
DELRAY BEACH $349,669 $231,558 51% $201 46% 162 -24% 29
HIGHLAND BEACH $954,637 $769,300 24% $541 15% 19 -5% 39
JUNO BEACH $1,144,444 $663,962 72% $643 96% 9 -31% 18
JUPITER $635,110 $445,914 42% $382 40% 47 -37% 20
JUPITER INLET COLONY
N/A N/A N/A N/A N/A - N/A N/A
LAKE PARK $250,400 $280,900 -11% $154 -28% 7 250% 29
LAKE WORTH $289,263 $178,431 62% $177 60% 57 -7% 34
LANTANA $277,311 $532,944 -48% $193 -10% 9 0% 31
NORTH PALM BEACH $528,382 $451,465 17% $264 14% 22 -27% 30
MANALAPAN N/A N/A N/A N/A N/A - N/A N/A
PALM BEACH $2,064,429 $1,717,500 20% $822 22% 21 -19% 49
PALM BEACH GARDENS $486,916 $384,283 27% $307 37% 45 -33% 23
SINGER ISLAND $748,167 $1,061,690 -30% $494 21% 6 -71% 71
TEQUESTA $1,161,875 $335,777 246% $567 139% 8 -47% 28
WELLINGTON $400,265 $391,043 2% $260 8% 17 -19% 52
WEST PALM BEACH $243,623 $228,533 7% $143 9% 166 -26% 31
26% 52


Sales volume increased by 18% from the prior month. The share of homes sold above the asking price fell in August.
MARTIN
HOBE
$722,387
$681,150 $810,248
ISLAND $4,500,000
$330
$607
JENSEN BEACH $784,618 $646,262 21% $349 25%

PALM
$791,456 $672,917 18% $316 27%
SEWALL'S POINT $1,678,333 $1,158,714 45% $543 60%
$755,348 $582,900 30% $347 25%
31%
<$500,000 $402,764 $363,672 11% $281 27%
$500,000-$999,999 $777,884 $687,994 13% $317 17%
$1MM-$2.99MM $1,554,000 $1,958,929 -21% $516 4%
>$3MM $4,500,000
$607
21%
TIGHTENS AS SALES ACCELERATE
The months of supply fell to just over two months as sales accelerated more than listing volume.


MARTIN
BY NEIGHBORHOODJENSEN
$240,000
$531,988 $815,000
$380,803 $367,000
$241,250 $313,167
STUART $242,882 $312,928
$200
$426
$239 11%
$204
$200
<$500,000
$230,319
$500,000-$999,999 $659,980 $625,000
$1,562,500
$460
The median home price increased by nearly 5%, the region’s highest rate for single-family homes. Sales also increased by 11%.


For-sale inventory remained stable from last month while sales increased by 12%. Roughly 16% of sales were great than the asking price, slightly above July.
The median price increased to reach a record level in August. Additionally, sales volume increased by 10%.
BREVARD COUNTY
$468,935 $391,942 20% $237 20% 887 -12% 17
COCOA $332,966 $260,333 28% $210 22% 85 -3% 12
COCOA BEACH $871,927 $789,427 10% $441 30% 15 0% 25
GRANT $445,711 $562,833 -21% $223 -15% 12 100% 10
INDIALANTIC $686,644 $670,625 2% $366 11% 16 33% 20
MALABAR $602,250 $537,000 12% $266 15% 6 -14% 28
MELBOURNE $496,294 $426,212 16% $241 21% 212 -25% 15
MELBOURNE BEACH $1,524,810 $836,083 82% $515 55% 21 -9% 32
MERRITT ISLAND $621,219 $495,246 25% $260 15% 52 -20% 19
MIMS $446,938 $336,775 33% $229 23% 11 -15% 21
PALM BAY $344,959 $279,979 23% $197 20% 270 2% 17
ROCKLEDGE $509,562 $449,558 13% $235 11% 64 -6% 19
SATELLITE BEACH & INDIAN HARBOUR BEACH $629,300 $611,670 3% $324 15% 35 -19% 20
TITUSVILLE $342,180 $283,698 21% $196 22% 71 -17% 21
WEST MELBOURNE $502,833 $386,088 30% $240 40% 6 -78% 10
10%
38%

Condo sales rebounded in August by 35% compared with one month ago. Along with this strong recovery, 14% of units sold above the list price.
BREVARD COUNTY
$360,161 $341,990 5% $262 14% 157 -18% 20
COCOA $293,292 $244,143 20% $217 29% 12 71% 10
COCOA BEACH $548,284 $437,087 25% $384 24% 27 -7% 20
GRANT N/A N/A N/A N/A N/A - N/A N/A
INDIALANTIC $656,000 $600,506 9% $351 12% 4 -78% 21
MALABAR N/A N/A N/A N/A N/A - N/A N/A
MELBOURNE
$218,554 $298,565 -27% $190 3% 25 -42% 17
MELBOURNE BEACH $525,000 $829,400 -37% $317 -2% 1 -80% 67
MERRITT ISLAND $203,250 $227,653 -11% $172 -5% 8 -47% 30
MIMS N/A N/A N/A N/A N/A - N/A N/A
PALM BAY $137,750 $225,333 -39% $148 -4% 6 100% 26
ROCKLEDGE $295,836 $217,844 36% $186 16% 17 89% 9
SATELLITE BEACH & INDIAN HARBOUR BEACH $571,821 $436,921 31% $390 33% 14 -26% 18
TITUSVILLE $268,553 $184,536 46% $177 25% 17 21% 27
WEST MELBOURNE $179,333 $174,900 3% $154 0% 3 200% 3
$352 17%
-16% $461 11%
$1,059 6%
St. Johns County remained the highest-priced county in the region even as the average price decreased slightly from last month. The pace of sales began to recover from July, increasing by 6% in August.

ST. JOHNS COUNTY
$592,494 $499,873 19% $286 21% 875 -18% 36
JULINGTON CREEK AREA $603,322 $476,894 27% $238 22% 87 -28% 29
NOCATEE $829,277 $591,020 40% $317 32% 58 -8% 32
PONTE VEDRA BEACH $1,033,316 $851,730 21% $427 36% 62 -13% 40
SOUTHEAST ST JOHNS COUNTY $603,301 $574,805 5% $362 15% 65 -29% 41
ST AUGUSTINE BEACHES/ANASTASIA ISLAND $425,939 $319,681 33% $248 30% 85 -11% 40
ST JOHNS $588,817 $517,587 14% $251 24% 99 -5% 40
SOUTHWEST ST JOHNS COUNTY $398,475 $360,183 11% $241 17% 28 -13% 34
ST AUGUSTINE/VILANO BEACH $590,829 $490,660 20% $284 29% 42 -25% 43
WORLD GOLF VILLAGE AREA/PALENCIA $556,322 $458,888 21% $237 18% 85 -38% 42
<$500,000 $368,768 $340,701 8% $246 20%
-38%
$500,000-$999,999 $664,092 $666,301 0% $293 8%
N/A 63
22% 41 $1MM-$3MM $1,483,237 $1,559,351 -5% $453 11% 63 5% 46 >$3MM $3,919,800 N/A N/A $1,091 N/A

The number of closed sales increased by 9% compared with the previous month, one of the largest gains in the region.

DUVAL COUNTY
ARLINGTON/FORT CAROLINE
CHANGE
$370,982 $317,661 17% $210 20% 1,333 -31% 36
$287,498 $277,790 3% $188 23% 113 -31% 44
AVONDALE/RIVERSIDE/ORTEGA $537,590 $406,693 32% $281 21% 40 -37% 33
BARTRAM $351,736 $310,460 13% $202 19% 36 -45% 30
BEACHES $696,018 $630,693 10% $399 18% 72 -27% 38
BEAUCLERC/MANDARIN $463,309 $372,122 25% $219 21% 109 -36% 32
DOWNTOWN JACKSONVILLE $177,458 $148,421 20% $135 30% 118 -25% 39
INTRACOASTAL $554,392 $420,319 32% $258 26% 138 -28% 36
NOCATEE (DUVAL) $416,851 $389,610 7% $235 23% 17 240% 39

NORTH JACKSONVILLE $328,140 $296,751 11% $181 21% 130 -24% 39
SAN MARCO/SAN JOSE $471,281 $367,859 28% $230 24% 55 -19% 44
SOUTHSIDE $310,568 $279,771 11% $198 17% 158 -36% 30
WEST JACKSONVILLE $283,037 $240,773 18% $178 18% 272 -27% 35
AUG
<$500,000 $291,429 $264,669 10% $190 17% 1,135 -35% 35
$500,000-$999,999 $678,199 $642,836 6% $291 14% 165 -8% 36
$1MM-$3MM $1,512,949 $1,454,350 4% $439 -13% 32 60% 48 >$3MM $3,430,000 $3,949,000 -13% $1,990 223% 1 -67% 23
Sales volume slowed modestly in August though the average price increased by 3%. For single-family homes, the average sale spent just over a month on the market.


CLAY
$309,714
22%
$393,900 30% $202 13% 45 -348%
$439,616 $299,597 47% $209 31% 33 -15% 35
MIDDLEBURG/KEYSTONE $365,111 $287,400 27% $195 21% 78 -38% 33
ORANGE
OAKLEAF
$500,000-$999,999
$1MM-$3MM $1,204,167
$319,281 $289,886 10% $187 25% 68 -15% 41
$415,749 $288,127 44% $182 20% 56 -44% 39
$614,347 2% $202
$259

Home sales rebounded by 10% in August, the greatest increase in the region. The median price per square foot reached a new high of roughly $236 per square foot.

The average price increased by 4% in August, reaching a new record high. Sales also increased by 6% from July.


© 2022 ONE Sotheby’s International Realty. All rights reserved. Sotheby’s International Realty® and the Sotheby’s International Realty Logo are service marks licensed to Sotheby’s International Realty Affiliates LLC and used with permission. ONE Sotheby’s International Realty fully supports the principles of the Fair Housing Act and the Equal Opportunity Act. Each franchise is independently owned and operated. Any services or products provided by independently owned and operated franchisees are not provided by, affiliated with or related to Sotheby’s International Realty Affiliates LLC nor any of its affiliated companies. The information contained herein is deemed accurate but not guaranteed.