GOBEL WORTHINGTON offering memorandum


JD Schmerge
Associate
Cincinnati Office
D. 513.878.7756
jd.schmerge@marcusmillichap.com

Jordan Dickman
First Vice President Investments
Cincinnati Office
D. 513.878.7735
jordan.dickman@marcusmillichap.com
Nick Andrews
First Vice President Investments
Cincinnati Office
D. 513.878.7741

nicholas.andrews@marcusmillichap.com
Austin Sum
Senior Associate
Cincinnati Office
D. 513.878.7747
austin.sum@marcusmillichap.com
“OUR COMMITMENT IS TO HELP OUR CLIENTS CREATE


AND PRESERVE WEALTH BY PROVIDING THEM WITH
THE BEST REAL ESTATE INVESTMENT SALES, FINANCING, RESEARCH AND ADVISORY SERVICES AVAILABLE.”

THIS IS A BROKER PRICE OPINION OR COMPARATIVE MARKET ANALYSIS OF VALUE AND SHOULD NOT BE CONSIDERED AN APPRAISAL. This information has been secured from sources we believe to be reliable, but we make no representations or warranties, express or implied, as to the accuracy of the information. References to square footage or age are approximate. Buyer must verify the information and bears all risk for any inaccuracies.
Marcus & Millichap is not affiliated with, sponsored by, or endorsed by any commercial tenant or lessee identified in this marketing package. The presence of any corporation’s logo or name is not intended to indicate or imply affiliation with, or sponsorship or endorsement by, said corporation of Marcus & Millichap, its affiliates or subsidiaries, or any agent, product, service, or commercial listing of Marcus & Millichap, and is solely included for the purpose of providing tenant lessee information about this listing to prospective customers.

JORDAN DICKMAN
FIRST VICE PRESIDENTS DIRECTOR, NMHG
NICK ANDREWS
FIRST VICE PRESIDENTS DIRECTOR, NMHG
AUSTIN SUM
SENIOR INVESTMENT ASSOCIATE
JD SCHMERGE INVESTMENT ASSOCIATE
BRIAN JOHNSTON INVESTMENT ASSOCIATE
TIM VANWINGERDEN INVESTMENT ASSOCIATE
AUSTIN Hall INVESTMENT ASSOCIATE
ALDEN SIMMIS INVESTMENT ASSOCIATE
SAM PETROSNIO
VALUATION & RESEARCH
LIZ POPP
MIDWEST OPERATIONS MANAGER
JOSH CARUANA
VICE PRESIDENT
REGIONAL MANAGER
INDIANAPOLIS | CINCINNATI | LOUISVILLE | ST LOUIS | KANSAS CITY
JOHN SEBREE
SENIOR VICE PRESIDENT
NATIONAL DIRECTOR
NATIONAL MULTI HOUSING GROUP
MICHAEL GLASS
SENIOR VICE PRESIDENT
MIDWEST DIVISION MANAGER
NATIONAL DIRECTOR, MANUFACTURED HOME COMMUNITIES GROUP
SKLYER WILSON
CLIENT RELATIONS MANAGER
BRITTANY CAMPBELL-KOCH
DIRECTOR OF OPERATIONS
ALEX PAPA
MARKETING COORDINATOR

Property Address: 3216/3224/3246 Gobel Ave; 3127/3128
Worthington Ave
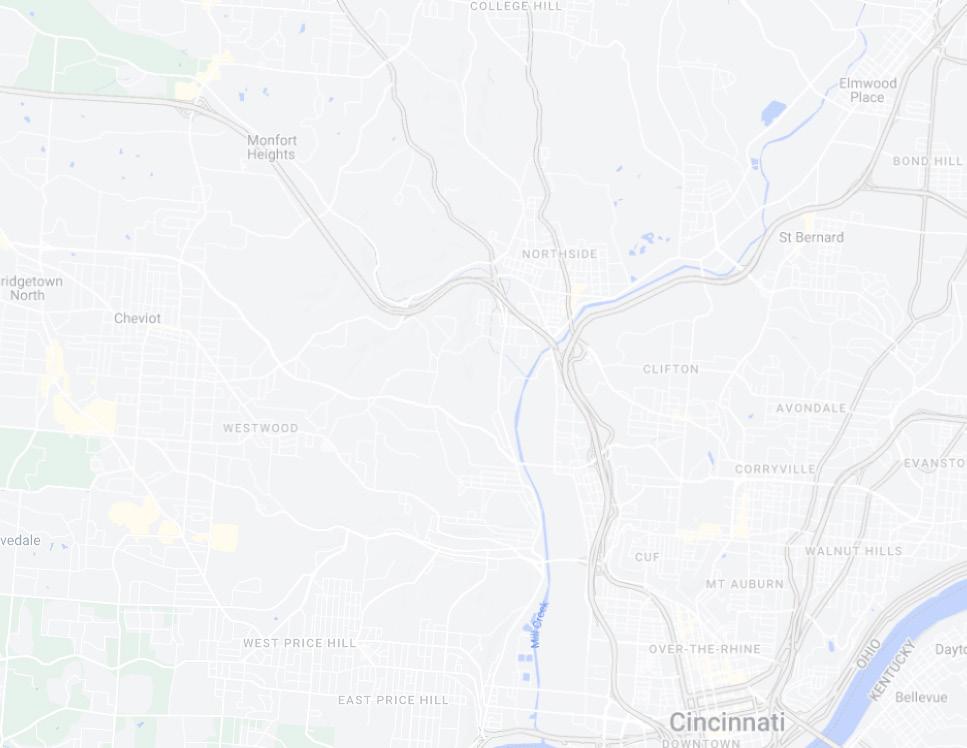
City, State, Zip: Cincinnati, OH 45211
Submarket: Westwood County: Hamilton
Year Built: 1951
Number Of Units: 20
Avg Unit Size: 850
Rentable Sqft: 16,000
Number of Parcels: 5
# of Buildings: 5
# of Stories: 2
Current Occupancy: 80%
Parking Type: Off Street/Garage
Parking Surface: Asphalt
# Garage/Carport: 10
UTILITIES Foundation: Concrete Block
Framing: Wood Framing
Roof Type/Age: Pitched Shingle; <10 years
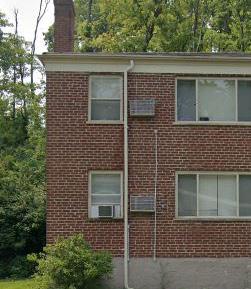
Exterior of Building: Brick
Windows Age/Pane: Vinyl Wiring: Copper
utilities
Electric: Tenant
Gas: Owner heat; tenant cooking
W/S: Owner
Trash: Owner
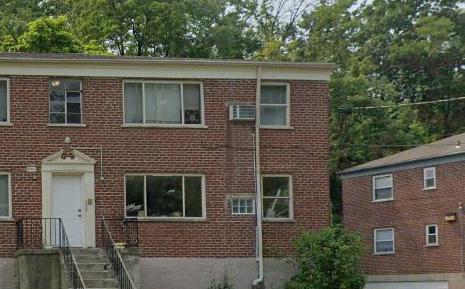
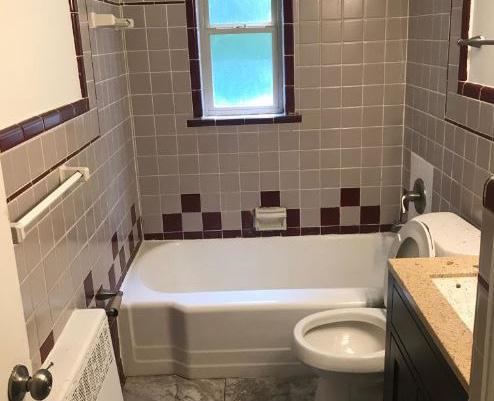
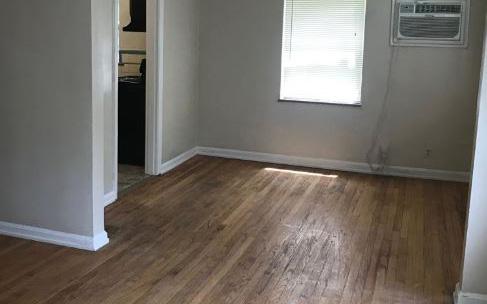
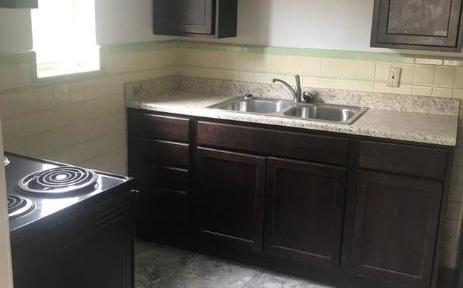
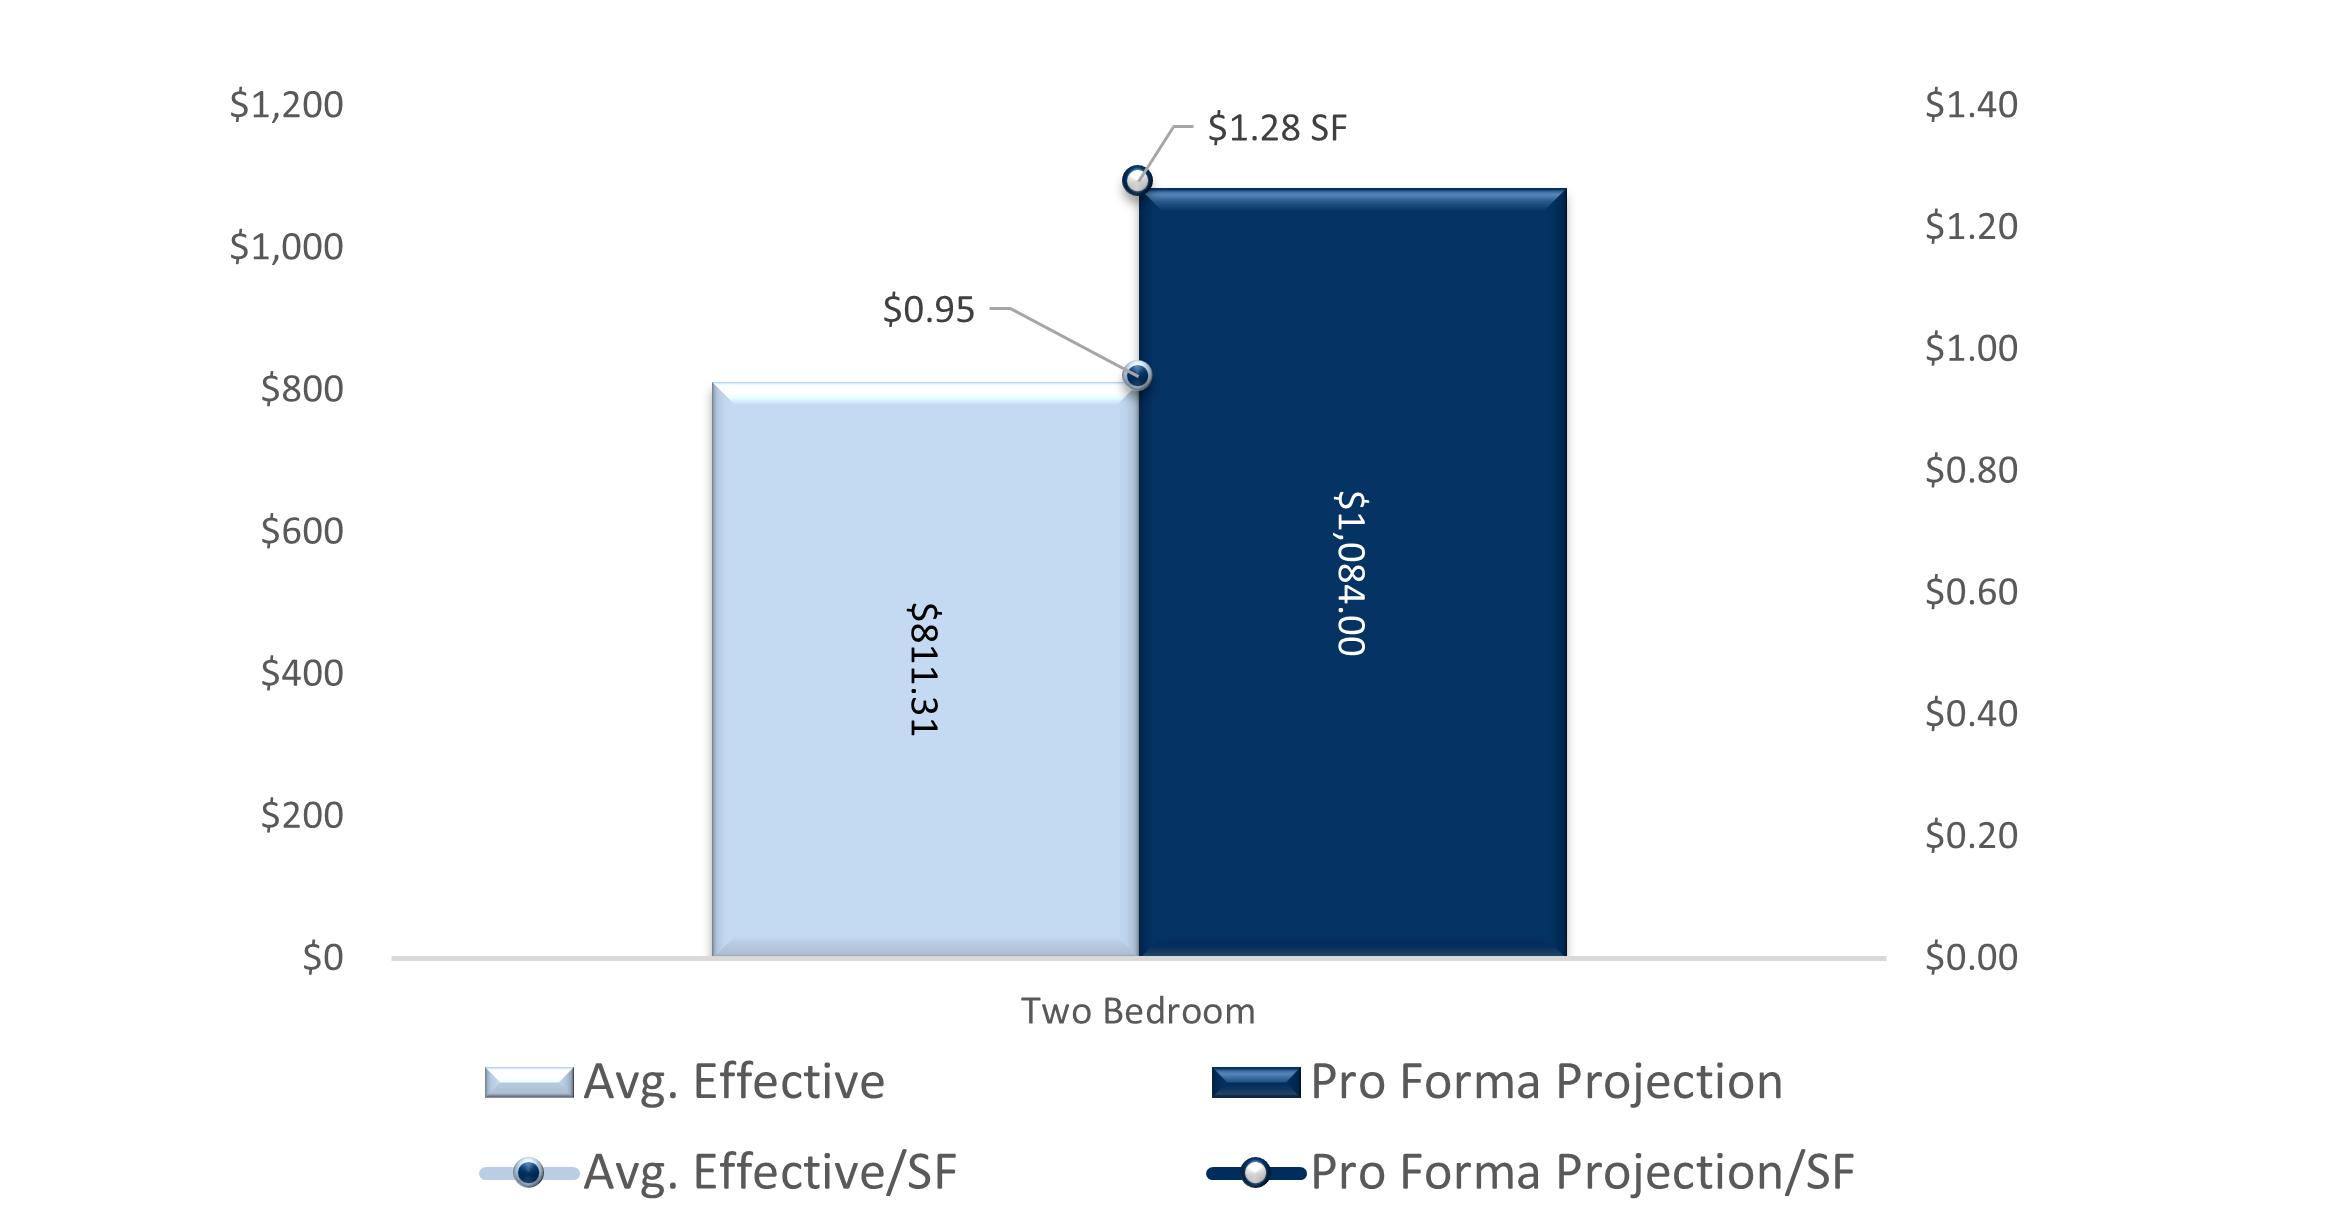
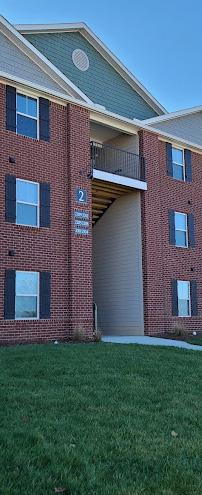
Marcus & Millichap is pleased to present Gobel/Worthington, a portfolio of 20 units in Cincinnati’s Westwood submarket. The assets are a group of five contiguous 4-unit apartment buildings. All 20 units are two bedroom/one bath apartments and all buildings have garages. The properties are a mix of market rate and subsidized tenants. Current ownership has maintained 90%+ occupancy throughout 2022 and shown $300/mo premiums over avg. rent on recent leases.
17,000

1 Replacement & Reserves: added based on market norm of $255 per unit per year
*Calculated as a percentage of Gross Potential Rent | **Calculated as a percentage of Effective Gross Income
The steady and stable nature of the Cincinnati apartment market was undoubtfully a benefit through 2020. The MSA saw a 2.7% annual increase in effective asking rents on new leases which matched the market’s norm for the 2010s decade. This growth put Cincinnati at #14 amongst the 50 largest markets for rent growth in 2020. Although occupancy was down 0.3 points from the prior year’s rate, the 4th quarter 2020 occupancy rate (96.4%) ranked #11 among the top 50 markets and #3 regionally. Only Q1 2020 saw net move-outs, although that’s typically the case in the local
market due to seasonal demand patterns, the three subsequent quarters saw huge demand and absorption totaled 1,563 units. That is 38% above the 20-year norm for annual absorption. During the peak of the pandemic challenges the job market declined 4.6%, this ranked Cincinnati 3rd best among the Midwest and was significantly better than the national average of 5.8%.

Prior to the pandemic, Cincinnati’s real gross metropolitan prod uct grew at an average annual rate of 1.8% from 2015 to 2019. During that same five-year period, job growth averaged 1.4% annually, with roughly 15,500 jobs added on average each year. In 2020, COVID-19 mitigation measures and limited business activity caused the local economy to contract as much as 9.7% year-over-year in 2nd quarter. In the year-ending 3rd quarter 2022, the metro’s inflation-adjusted economic output expand ed 0.3%. At the same time, the metro recorded a net gain of 1,400 jobs, expanding the employment base 0.1%. Cincinnati’s unemployment rate in August 2022 declined 0.5 points yearover-year to 3.8%, on par with the national average of 3.8%. During the past year, job gains in Cincinnati were most pro nounced in the Manufacturing sector followed by Trade/Trans portation/Utilities. Due to job losses stemming from the pan demic, Cincinnati’s current employment base now sits at about 1% below the pre-pandemic level in February 2020. Cincinnati, like many other Rust Belt markets, has long had a concentration in higher-paying manufacturing jobs and has been working to reinvent its economy as a high-skill, high-value manufacturing center. Further, Cincinnati is home to corporate headquarters for seven Fortune 500 companies.

• Cincinnati characteristically managed to escape the more extreme swings in apartment market performance seen over the last two years in the wake of the pandemic. Although apartment absorption cooled considerably in 3rd quarter 2022, Cincinnati apartment demand did not plumet to the degree seen in many other markets nationwide.
• As deliveries mount to a record rate over the next year, operators will be unlikely to sustain Cincinnati’s recent record high rent growth. There were 6,411 units under construction at the end of 3rd quarter, with 3,722
Population: 2.2M
Average occupancy: 96.9%
of those units slated to come online within the next 12 months. Although those deliveries will be spread more evenly throughout the Cincinnati market, new supply will test the depth of the Class A renter pool in a market that has still yet to recover all its pandemic-era job losses.
• During the year-ending 3rd Quarter 2022, median home prices in Cincinnati increased an average of 10.6%, landing at a median price of roughly $270,000.
• The local homeownership rate averaged 70.6% in the year-ending 2nd
• In 3rd quarter 2022, effective asking rents for new leases were up 11.8% yearover-year. That annual rent performance was above the market’s five-year average of 4.7%. Cincinnati’s recent annual rent change performance ranked #2 in the Midwest region.
Median age: 37.9
Rent growth: 11.8%
MSA median home value: $270,000
MSA median hhi: $66,900
• Product classes in Cincinnati, annual effective rent change registered at 14.8% in Class A units, 11.6% in Class B units and 8.1% in Class C units.
1 - Year growth: 10.6%
1 - Year growth: 2.35%
• Among submarkets, the strongest annual rent change performances over the past year were in Butler County and North Central Cincinnati.
• The weakest performances were in West Cincinnati and North Cincinnati. As of 3rd quarter 2022, effective asking rental rates in Cincinnati averaged S1,286 per month, or $1.372 per square foot.
• New apartment completions in Cincinnati were modest recently, as 2,130 units delivered in the year-ending 3rd quarter 2022. With 176 units removed from existing stock over the past year, the local inventory base grew 1.2%.
• In the past year, supply was greatest in Central Cincinnati and Campbell/Kenton Counties. New supply was concentrated in Central Cincinnati, Campbell/Kenton Counties and Northeast Cincinnati/Warren County, which received 65% of the market’s total completions.
• At the end of 3rd quarter 2022, there were 6,411 units under construction with 3,722 of those units scheduled to complete in the next four quarters.
• Scheduled deliveries in the coming year are expected to be concentrated in North Central Cincinnati and Central Cincinnati.
• Over the past five years, annual absorption in Cincinnati has ranged from 675 units to 4,536 units, averaging 2,286 units annually during that time.
• In the year-ending 3rd quarter 2022, the market recorded demand for 1,013 units, trailing concurrent supply volumes. Among submarkets, the strongest absorption over the past five years was seen in Central Cincinnati, Campbell/Kenton Counties and Northeast Cincinnati/Warren County.
• Those areas accounted for 56% of the market’s total demand over the past five years. In the past year, demand was greatest in Central Cincinnati and Campbell/Kenton Counties.
• Transaction dollar volumes in Cincinnati totaled roughly $332.9 million in the year-ending 3rd quarter 2022, down about 40% year-over-year.
• Transactions in the year-ending 3rd quarter 2022 yielded an average cap rate of 5.50%, down 21 basis points year-over-year. By comparison, cap rates averaged 5.05% in the Midwest region and 4.56% nationally.
• The average price per unit in Cincinnati came in at roughly $151,800, up 57.4% annually. Cincinnati’s average price per unit landed below the norms for both the Midwest region ($173,900) and U.S. overall ($238,700).

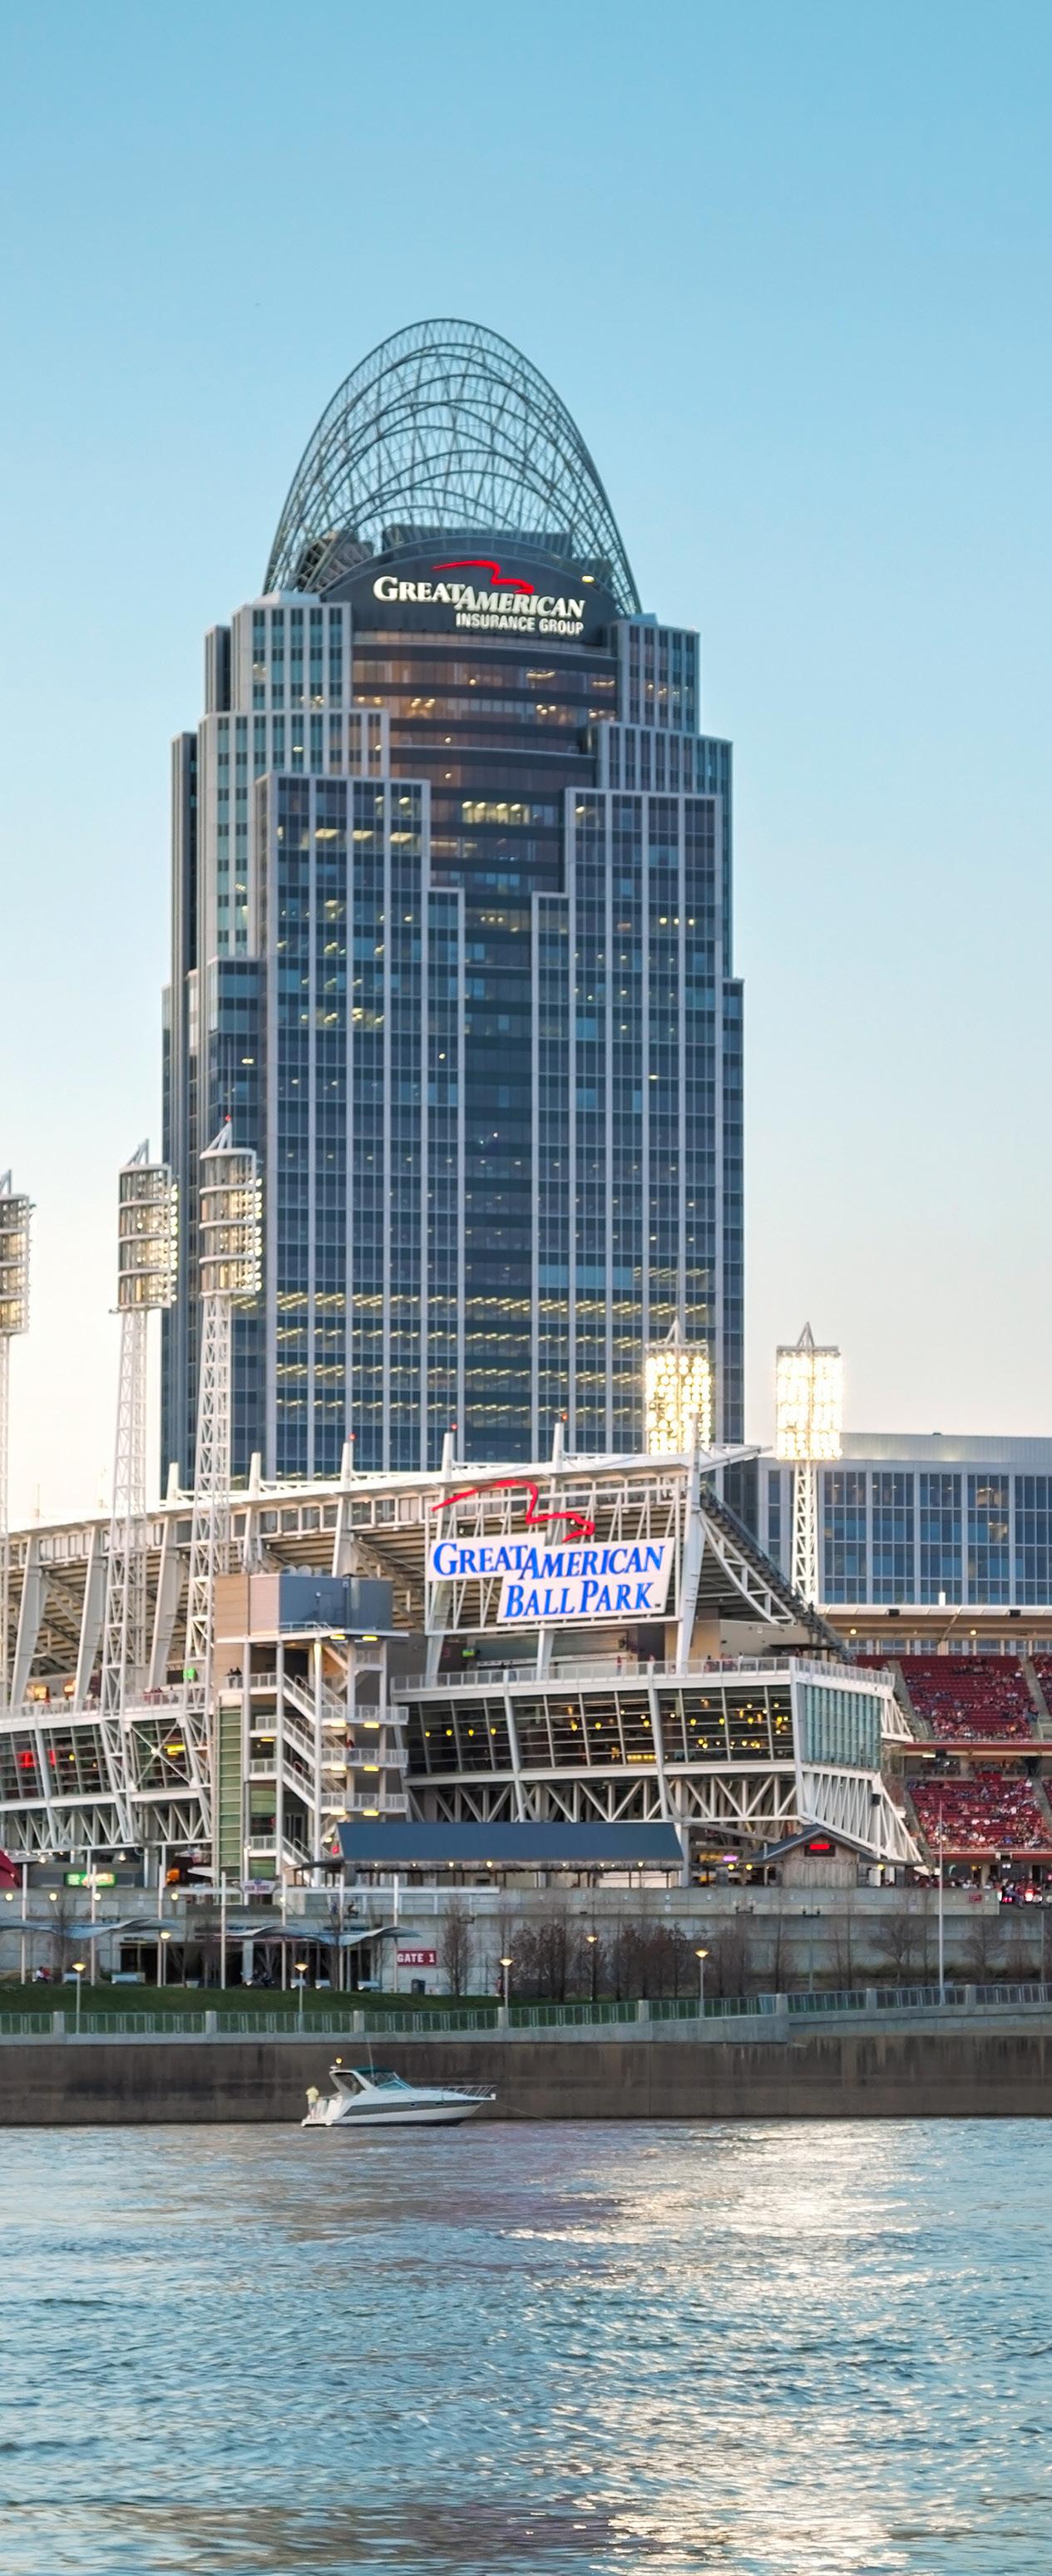
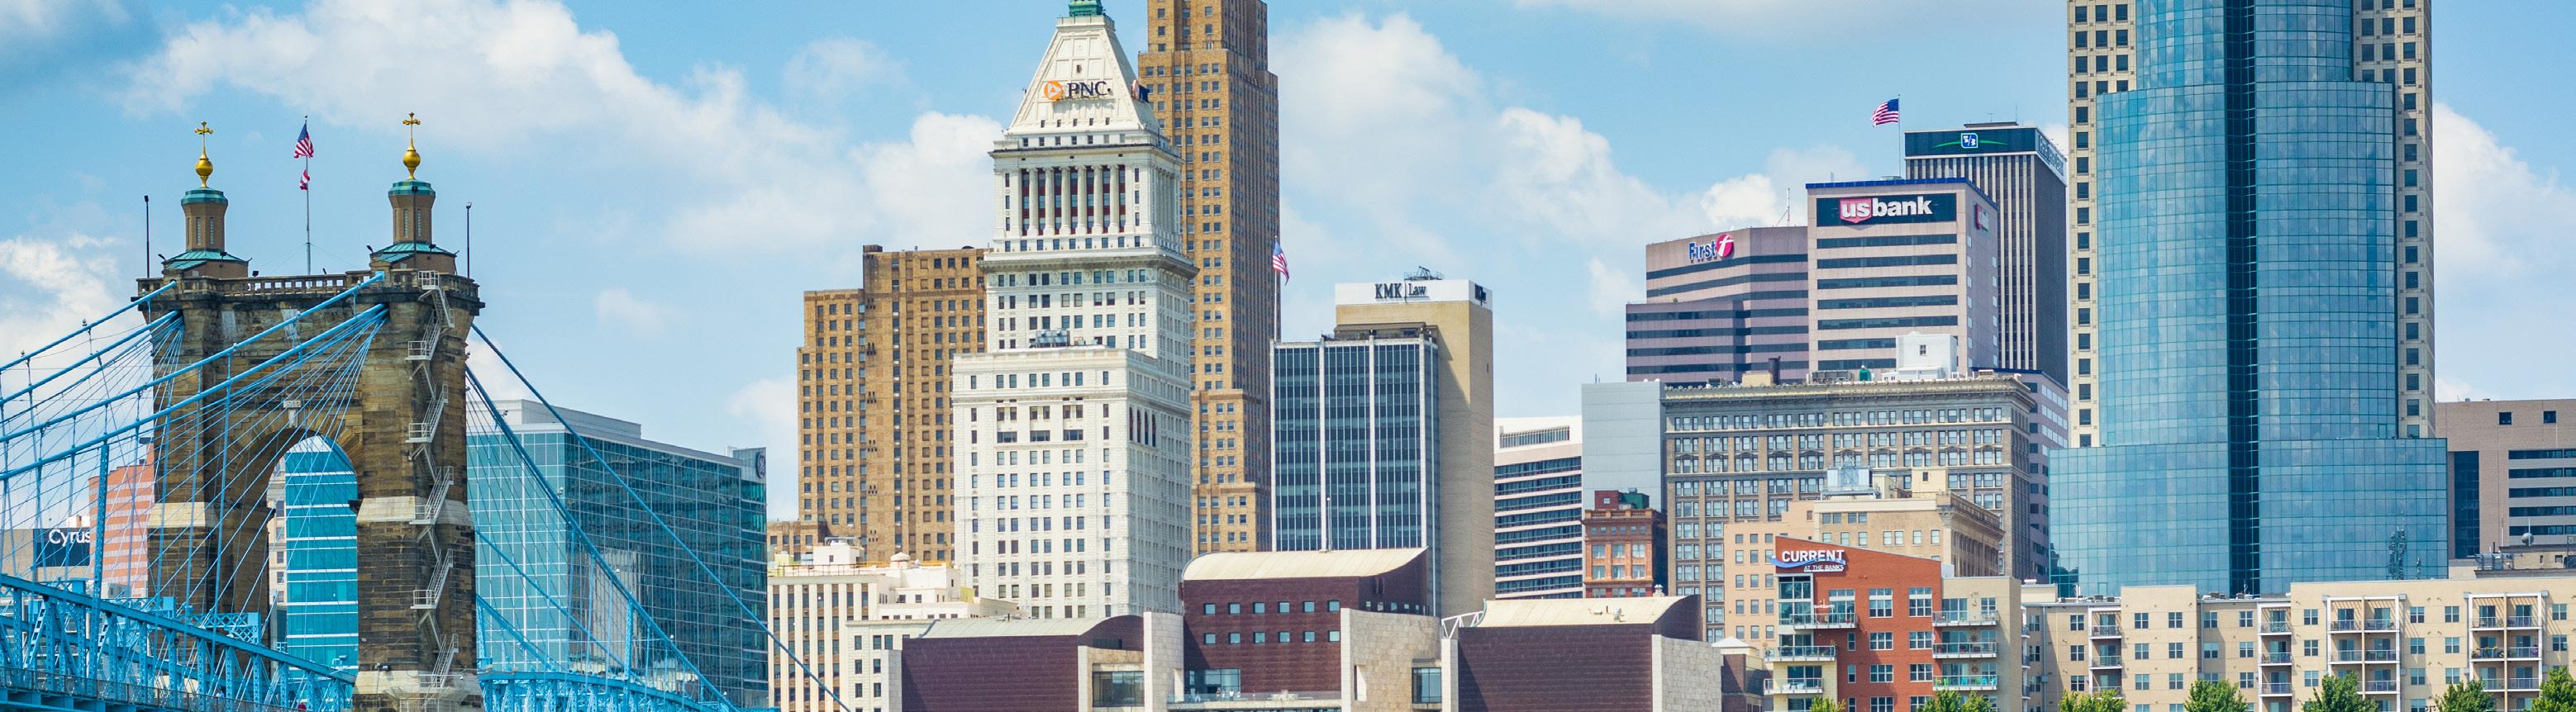
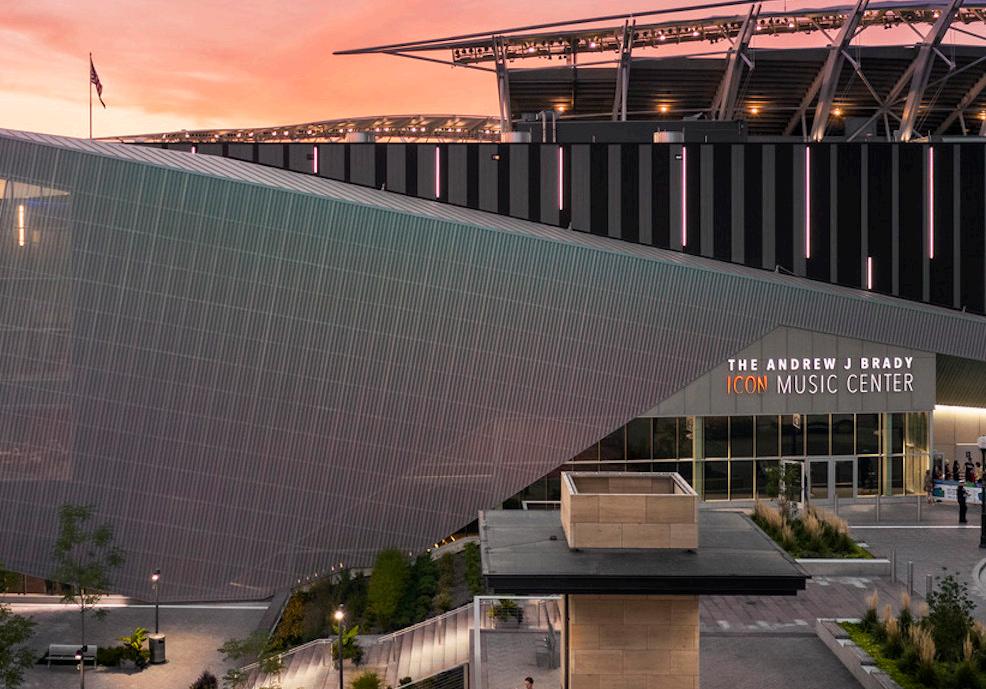
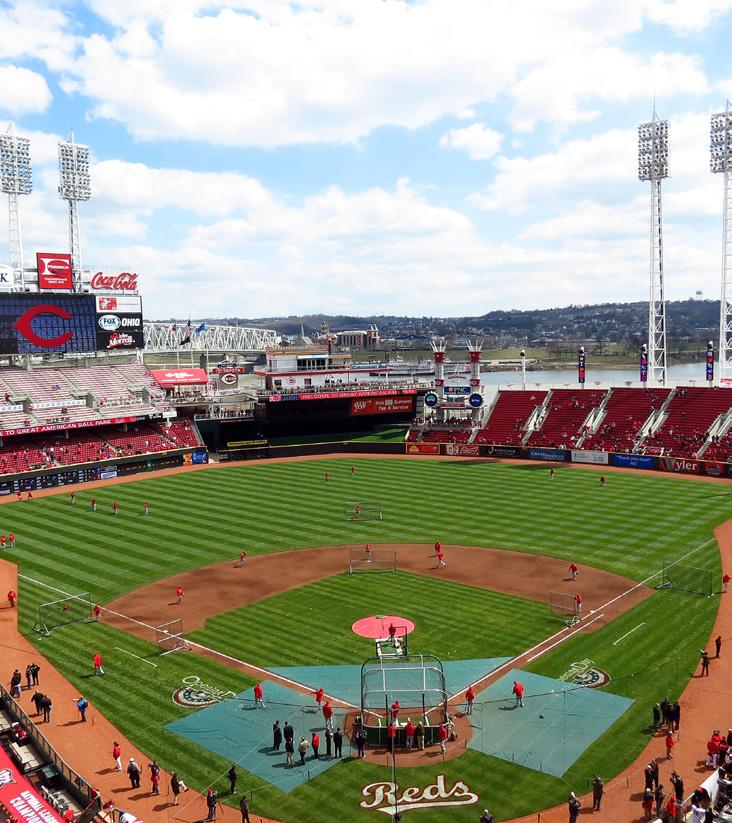
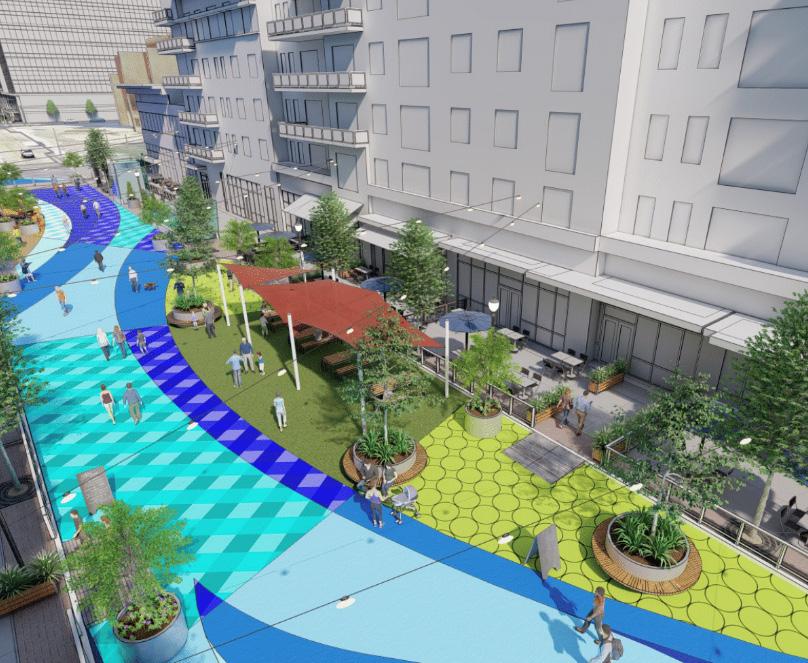
Right on the water and brimming with activity- The Banks is where you will find everything from sports events to a lively nightlife scene. Located along the Ohio River, The Banks provides spectacular riverfront views and lines the water with a family friendly park. Along with great biking, walking, and other recreational amenities during the daytime, The Banks comes alive at night. With live music and entertainment, a thriving bar scene nestled between two sports stadiums, The Banks is the place to be.
A major attraction at The Banks, the Andrew J Brady ICON Music Center was built for the audience experience, offering an intimate yet spacious setting. Offering both indoor and outdoor venues, the state-of-the-art facility hosts a wide variety of musical acts, spanning all genres. Visitors can enjoy a live concert while taking in the scenic riverfront view.
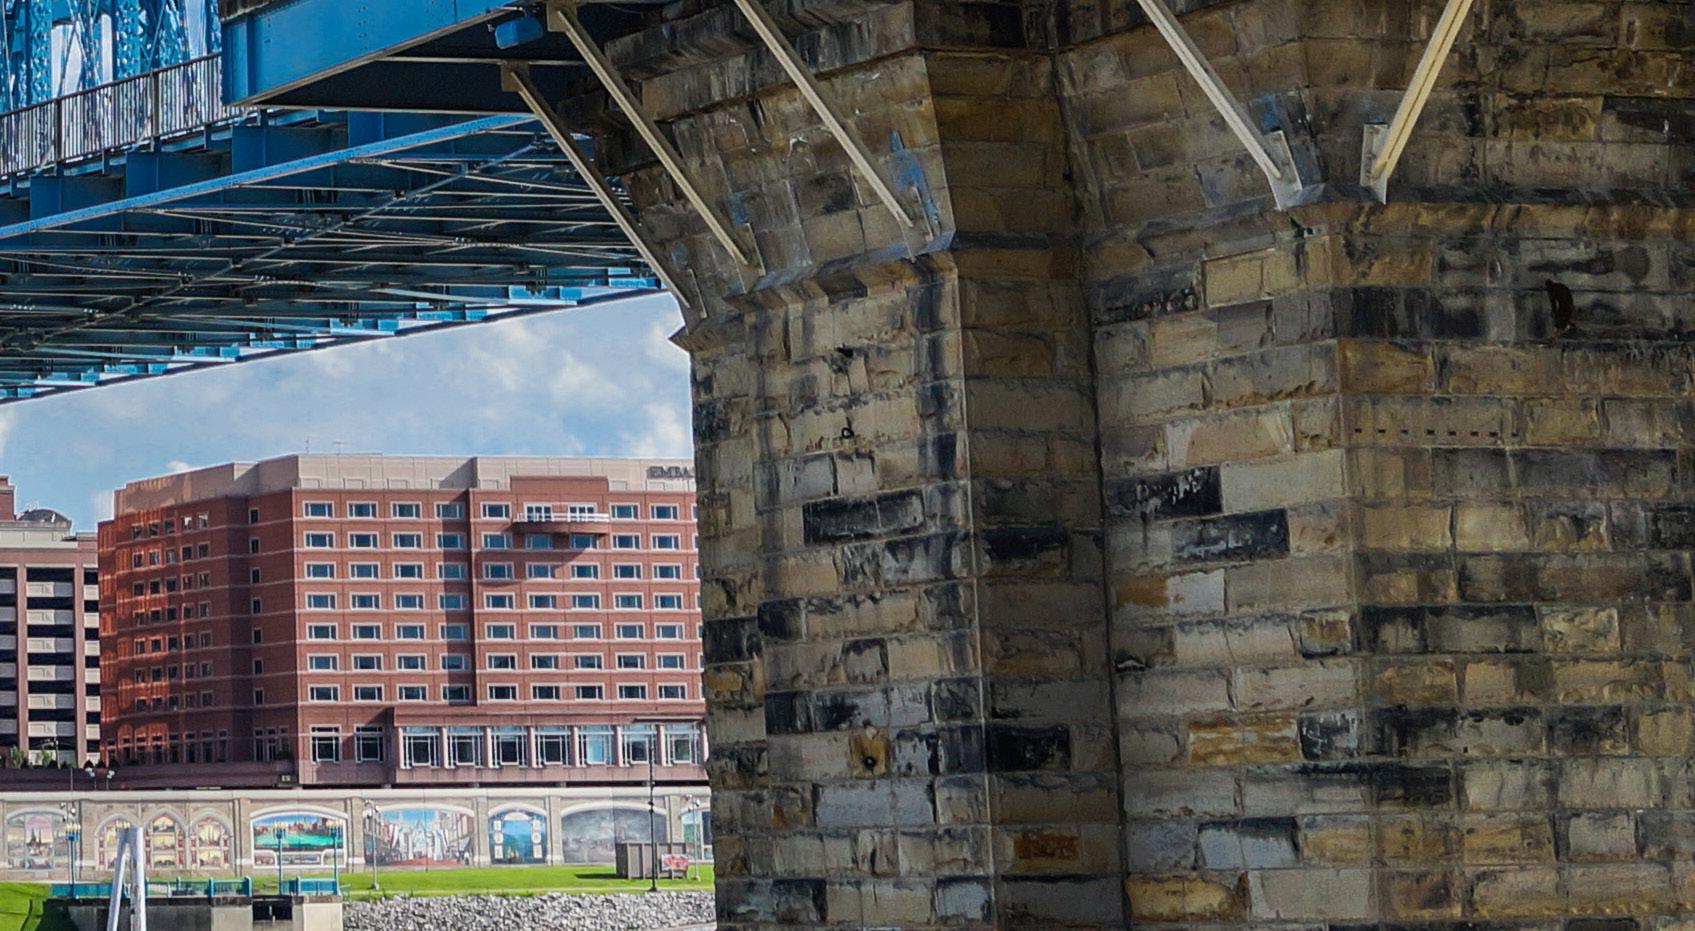
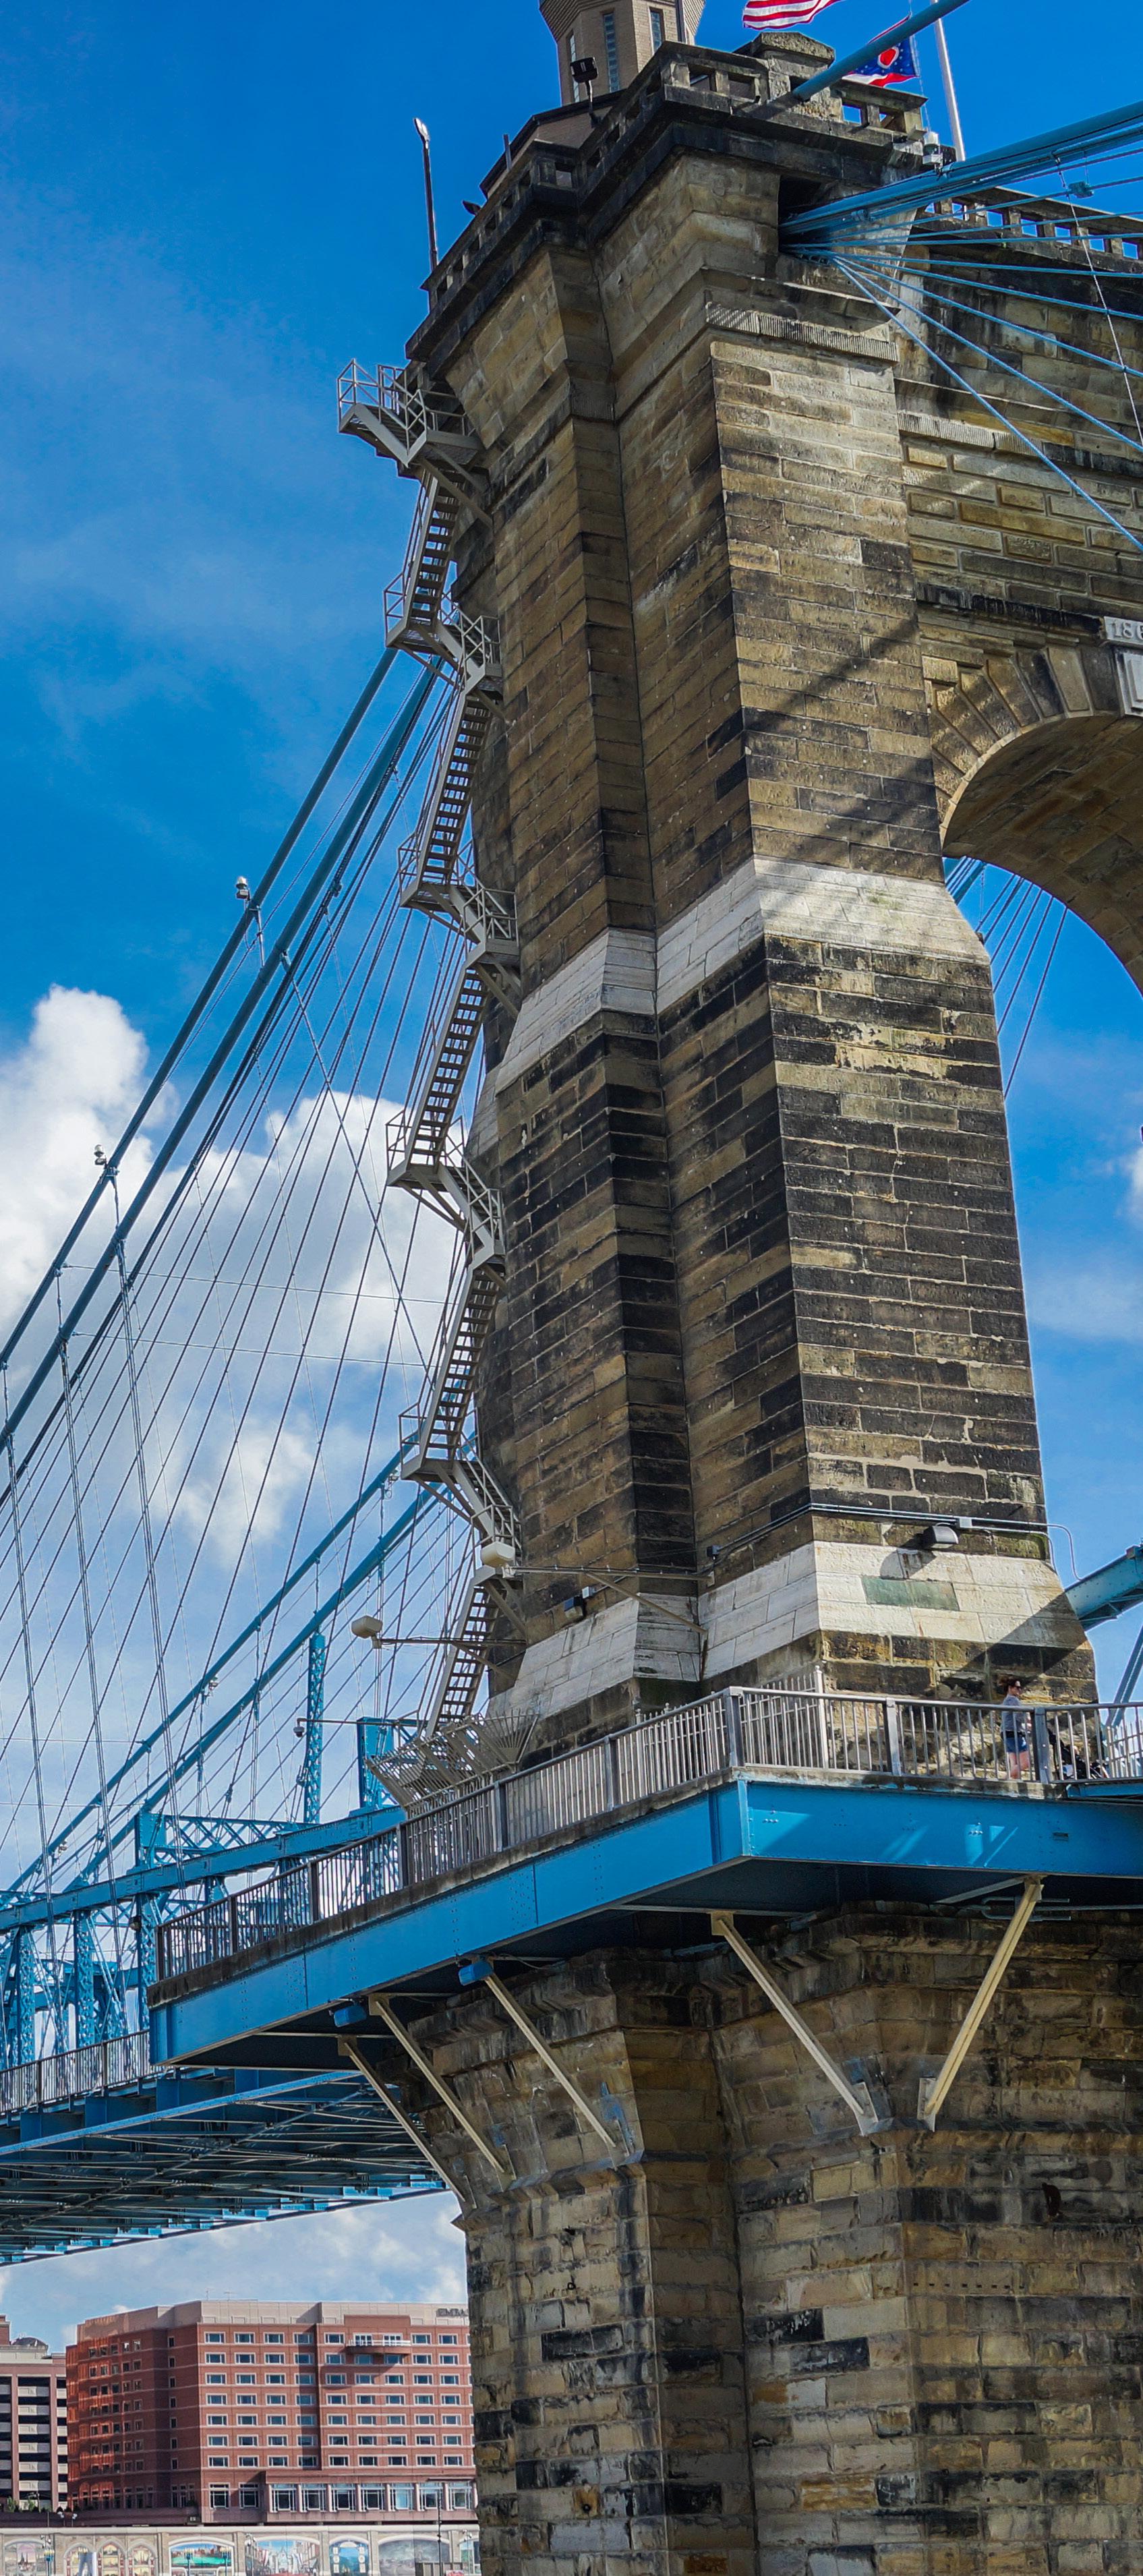
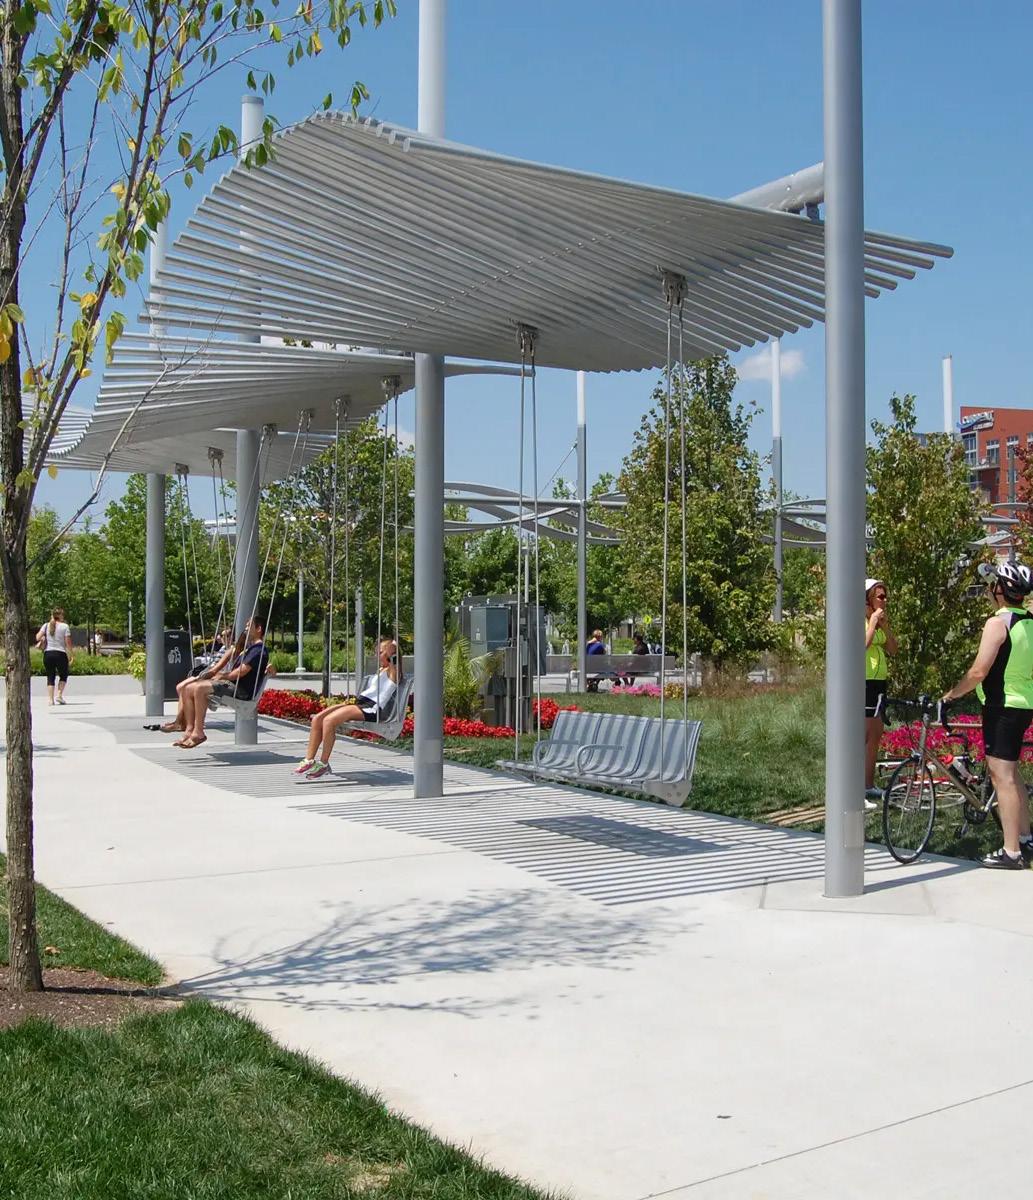
Ranked by USA Today readers as a Top 5 Riverwalk in the nation, Smale Riverfront Park offers walking trails, water features, swings, and other amenities to enjoy, while taking in the beautiful views of the Ohio River and the historic John A. Roebling Suspension Bridge. If you have kids in tow, make sure to visit Carol Ann’s Carousel, featuring 44 characters and illustrations incorporating Cincinnati landmarks. Enclosed in a glass building, the carousel is open year-round.
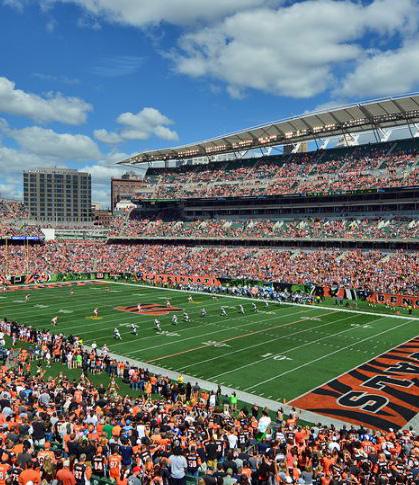
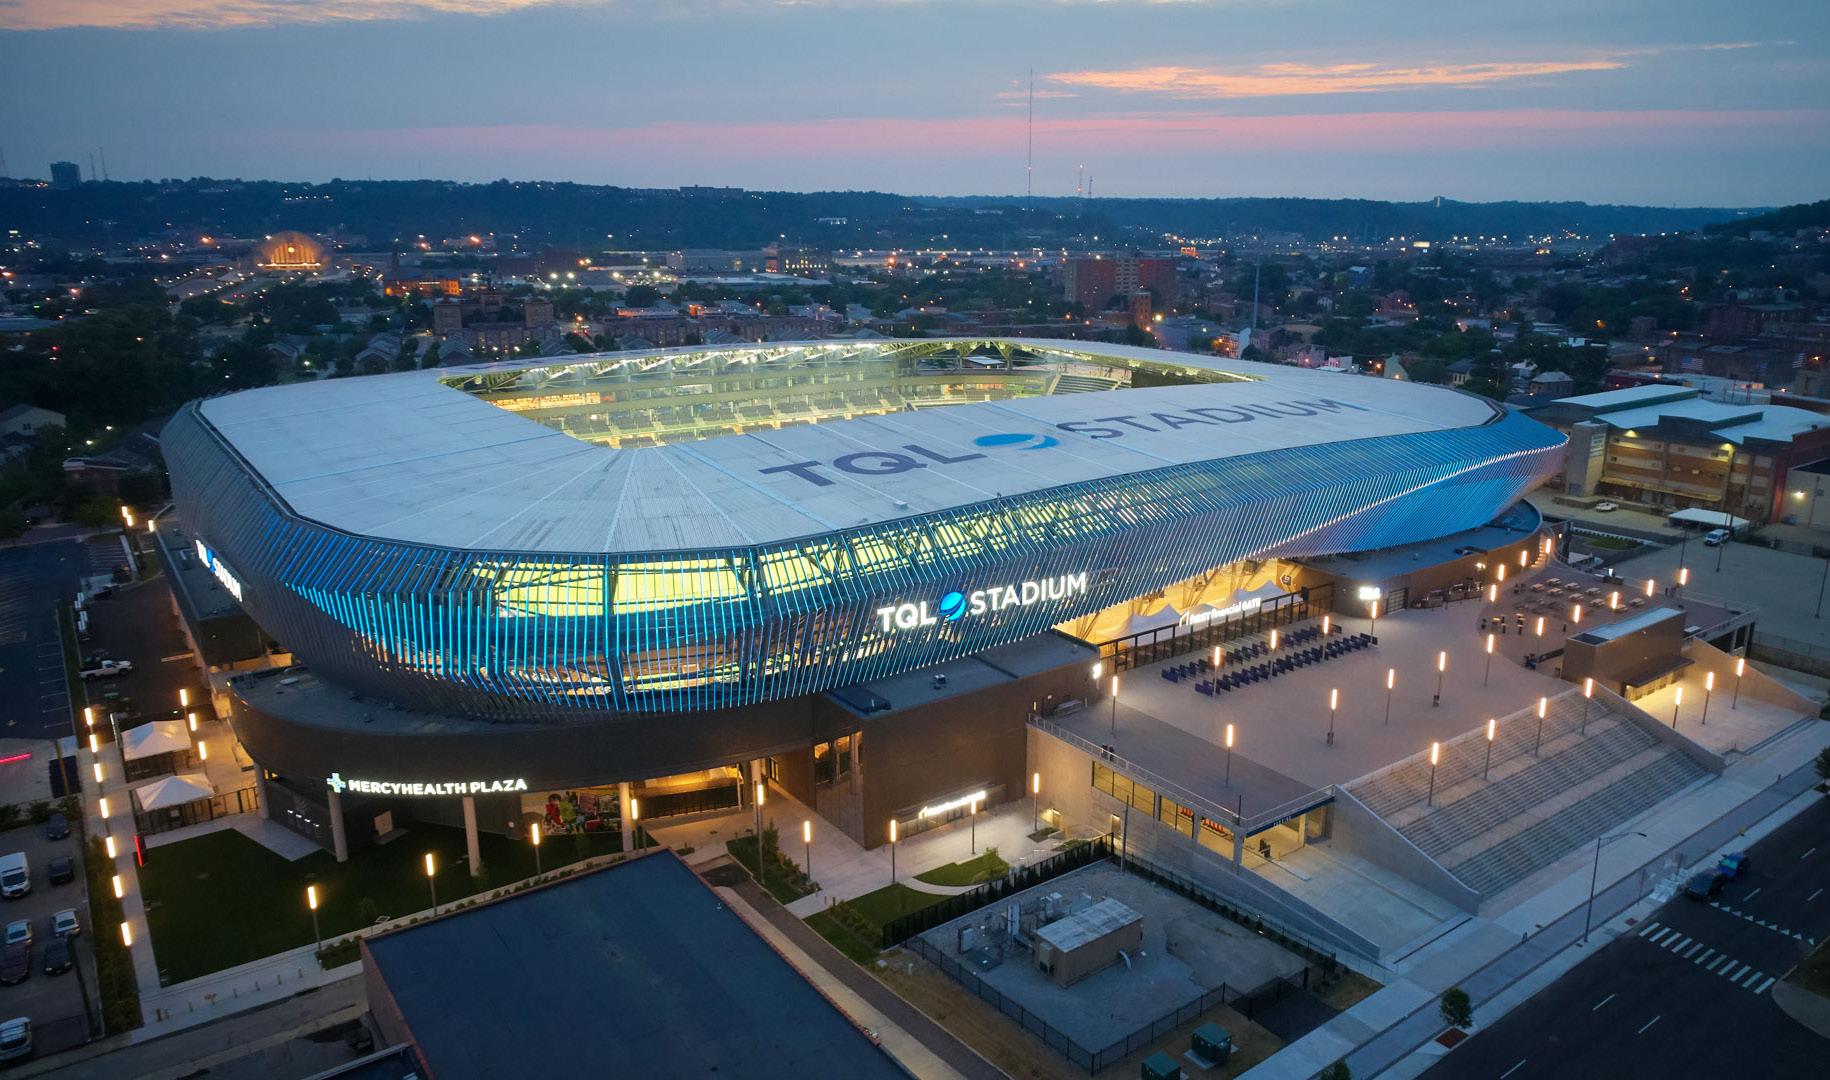
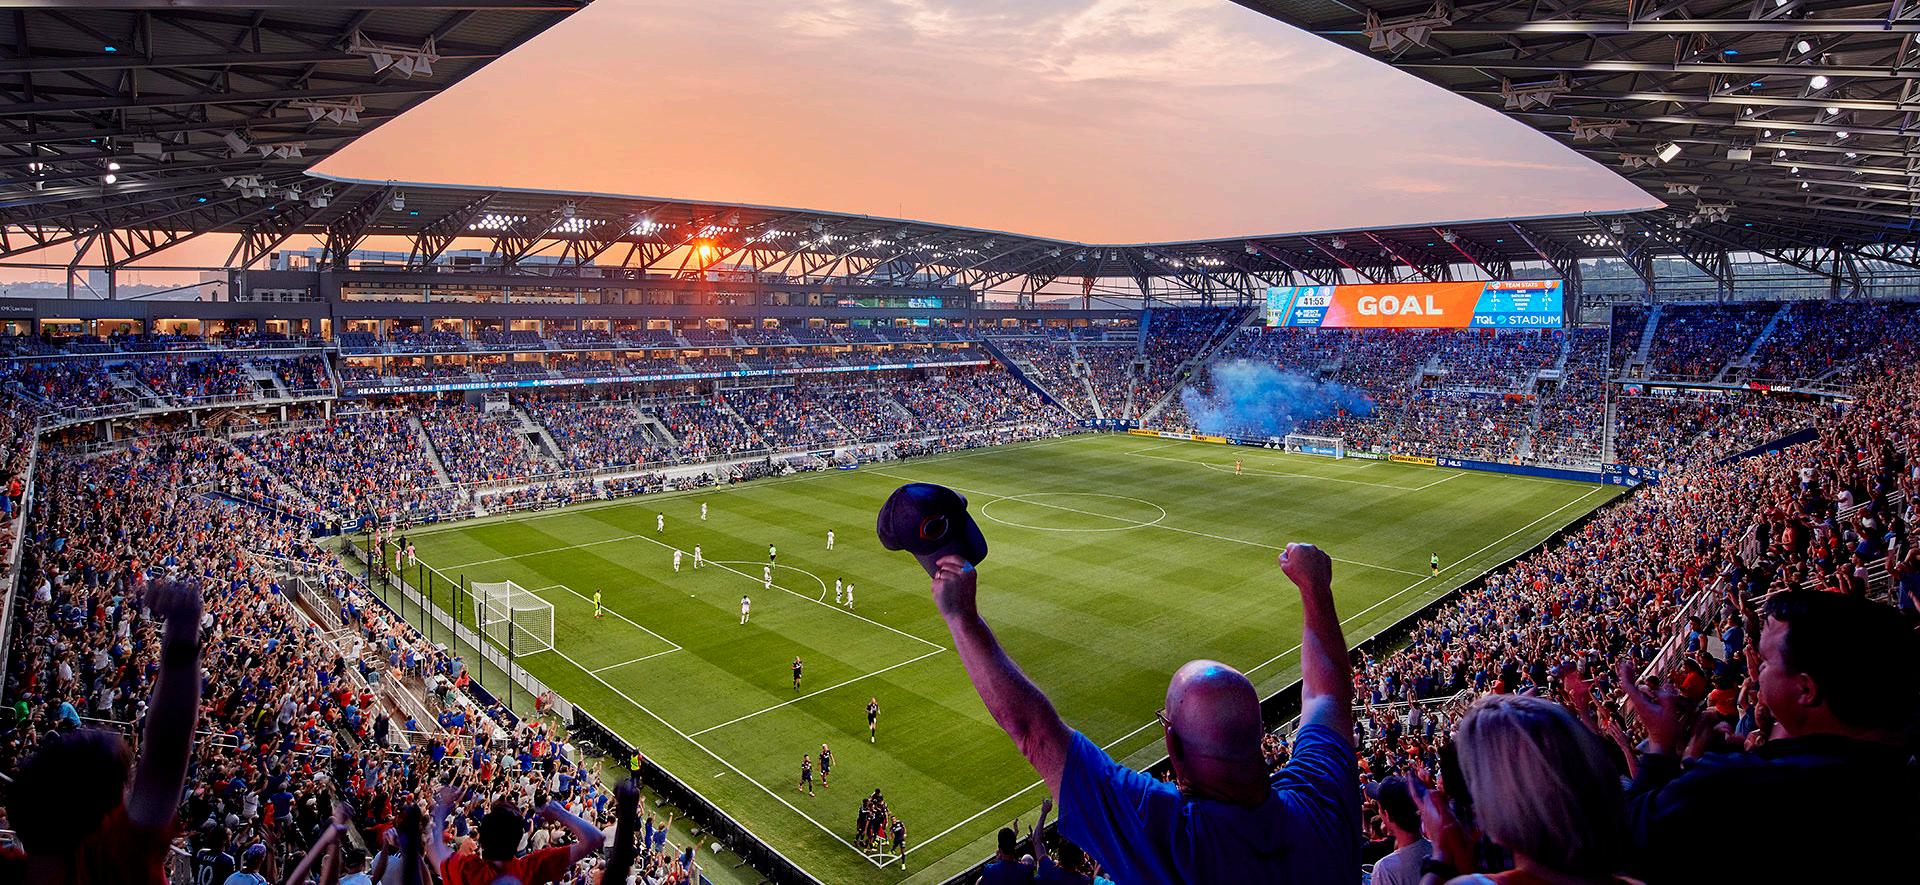
The FCC-TQL partnership brings together two Cincinnati-grown, leading businesses that share a “no limits” philosophy as well as a deep connection and commitment to our local community. There are a lot of synergies that make this alliance between TQL and FCC a perfect match and are reflected throughout the stadium from — the fin lighting to the TQL Beer District. The stadium features first-in-the-world lighting technology powered by 2.7 miles of LED lights.
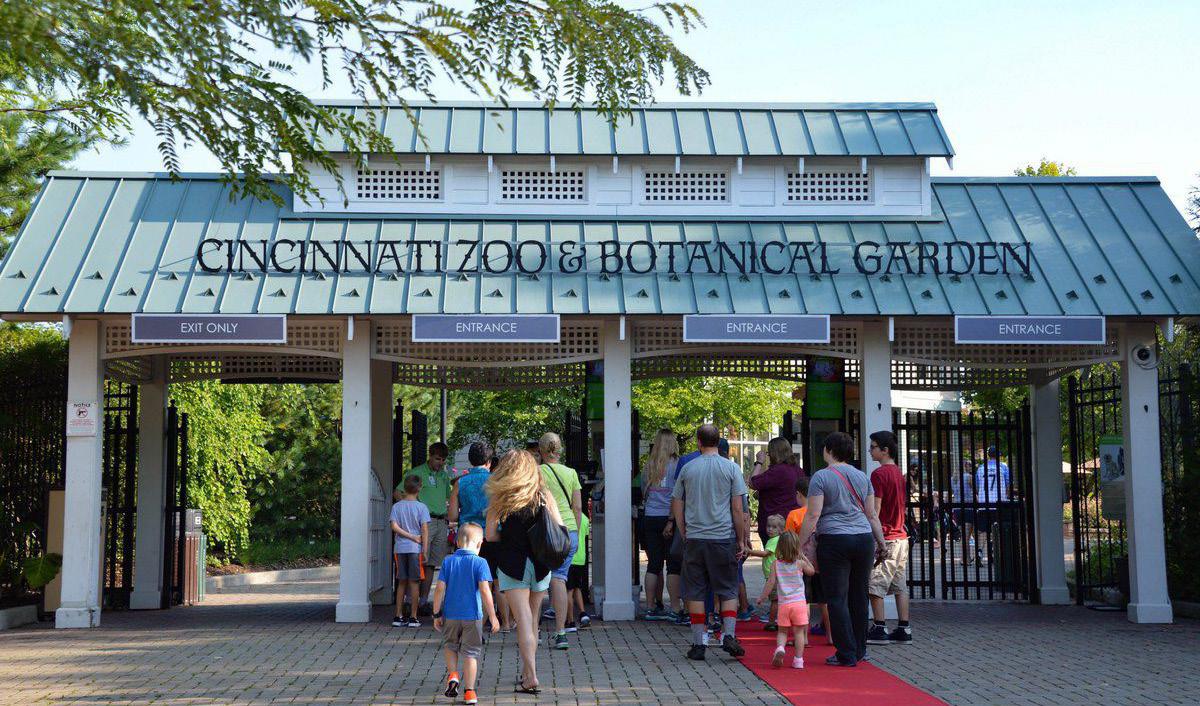
The Cincinnati Zoo & Botanical Garden is the second oldest zoo in the United States, founded in 1873 and officially opening in 1875, after the Roger Williams Park Zoo. It is located in the Avondale neighborhood of Cincinnati, Ohio. It originally began with 64.5 acres in the middle of the city, but has spread into the neighboring blocks and several reserves in Cincinnati’s outer suburbs. It was appointed as a National Historic Landmark in 1987.
From 11am – 1am daily, the 85-acre DORA district at The Banks allows guests to take their beverage purchased from one of the 18 Banks establishments and explore our public plazas and green spaces. It simply needs to be in the Official DORA Cup.
At risk of missing the first pitch? Late for the opening act? Take your beverage purchased in a DORA cup from a Banks establishment and go! Waiting for a table, or wish to picnic outside in The Banks plazas or greenspaces? Grab a DORA beverage from a Banks establishment and explore!

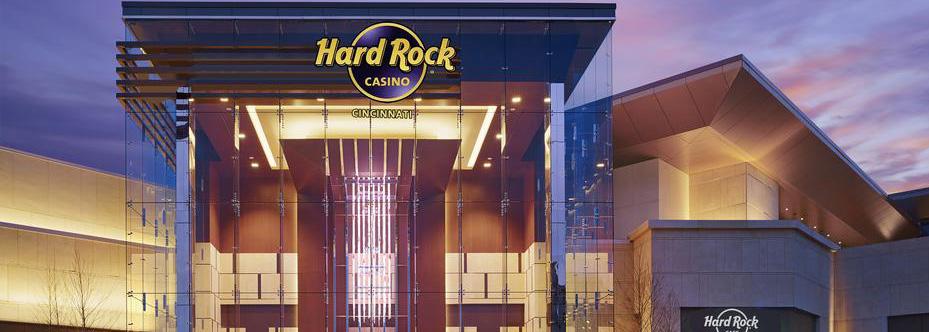
The game is always on at Hard Rock Casinos, where stars are made every night. Come try your hand at the tables, with classic games including blackjack, baccarat and poker, or tap into thousands of the hottest slots on the planet. With the world’s greatest rock memorabilia collection to enhance the thrill, plus the accompaniment of live, world-class entertainment, the atmosphere is like no other.
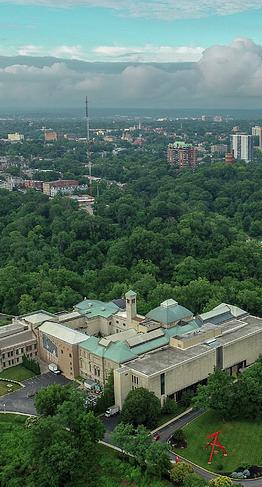
Located in scenic Eden Park, the Cincinnati Art Museum features a diverse, encyclopedic art collection of more than 67,000 works spanning 6,000 years. In addition to displaying its own broad collection, the museum also hosts several national and international traveling exhibitions each year. Visitors can enjoy the exhibitions or participate in the museum’s wide range of art-related programs, activities and special events. General admission is always free
for all. Museum members receive additional benefits. The museum is supported by the generosity of individuals and businesses that give annually to ArtsWave. The Ohio Arts Council helped fund the museum with state tax dollars to encourage economic growth, educational excellence and cultural enrichment for all Ohioans. The museum gratefully acknowledges operating support from the City of Cincinnati, as well as our museum members.
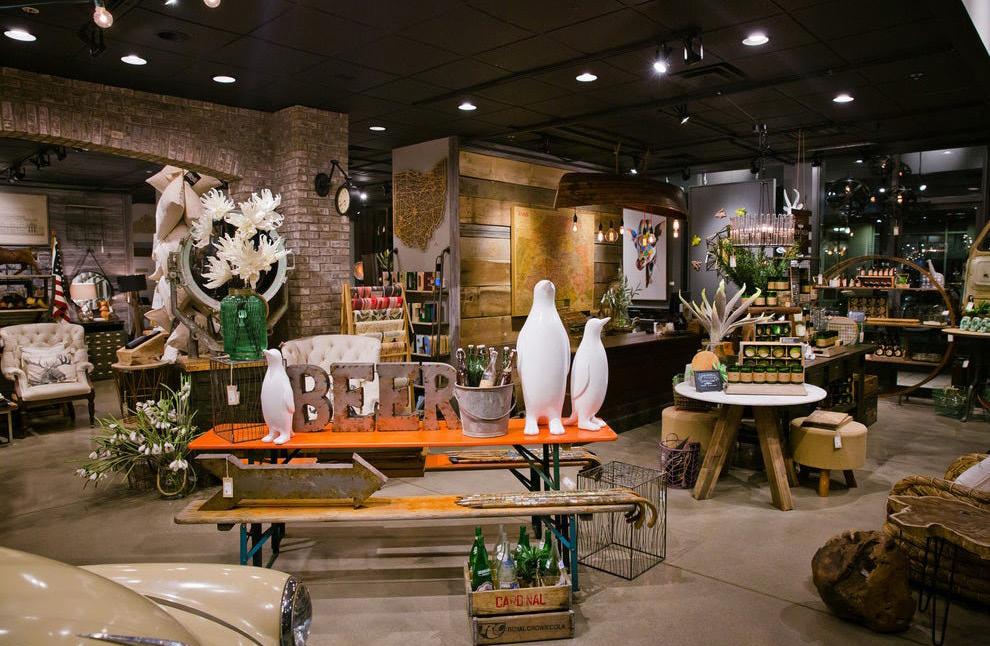

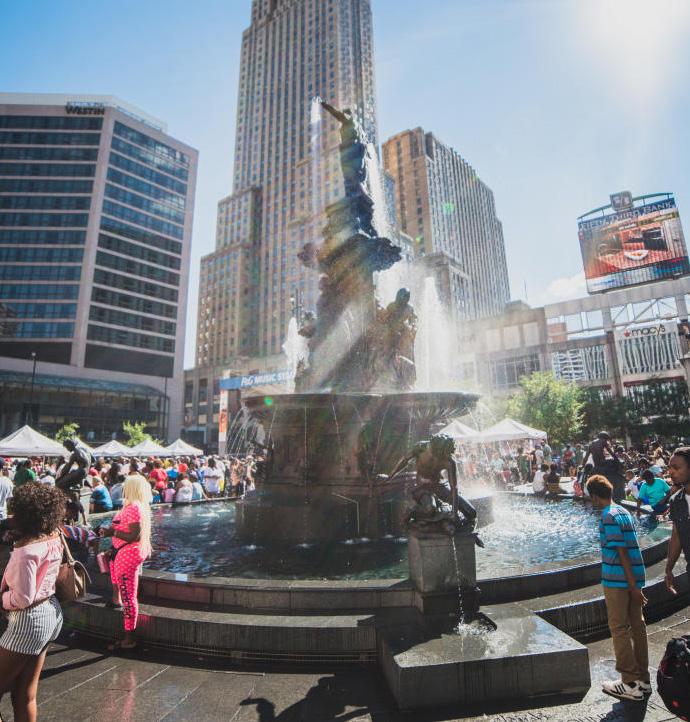
In addition to the restaurant and nightlight scene, the area has no shortage of retail options. Downtown offers both boutiques and department stores. Over-the-Rhine (OTR) is a historic, walkable district of downtown Cincinnati with many independent shops. Cincinnati’s Over-the-Rhine neighborhood was once a place where residents would not recommend to visitors, but that has changed. The restaurant and nightlife scene is now thriving, and the shopping scene is beginning to catch up. Most of the shops are in the southwest quarter of Over-the-Rhine, on either Vine or Main St. You won’t find chain stores in this walkable shopping district. MiCA 12/v and Urban Eden are a popular gift shops that sell local arts and crafts. Elm & Iron sells vintage and up-cycled items for the home. The Little Mahatma sells exotic jewelry and folk art from around the world. You’ll find several clothing boutiques, including Mannequin, a non-profit upscale and vintage boutique that benefits local charities. Park + Vine is a popular general store for environmentally-conscious shoppers; they sell a variety of merchandise including green cleaning and personal products, vegan foods, garden products and more.
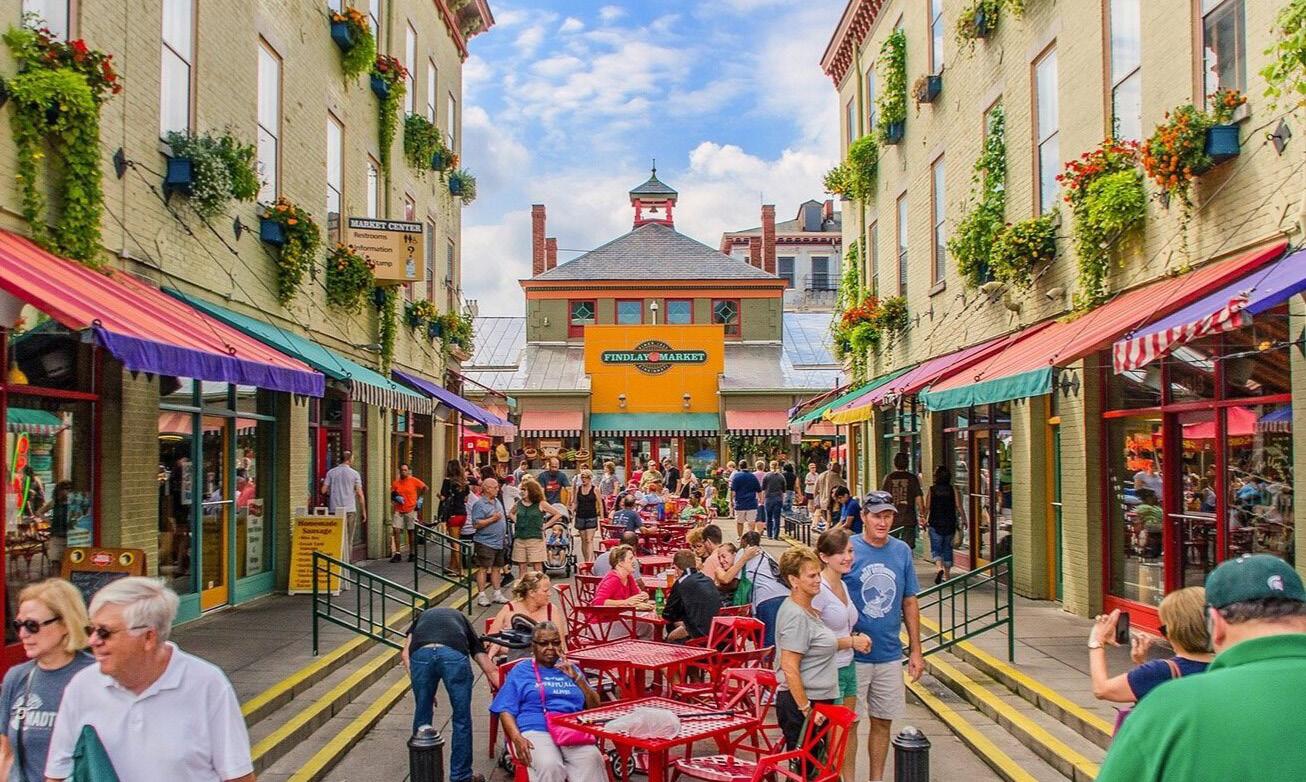
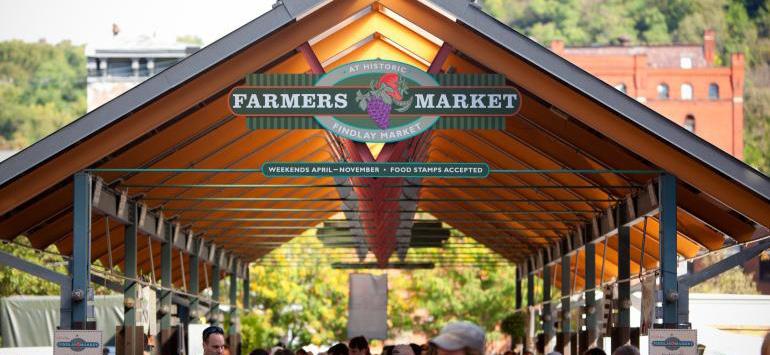
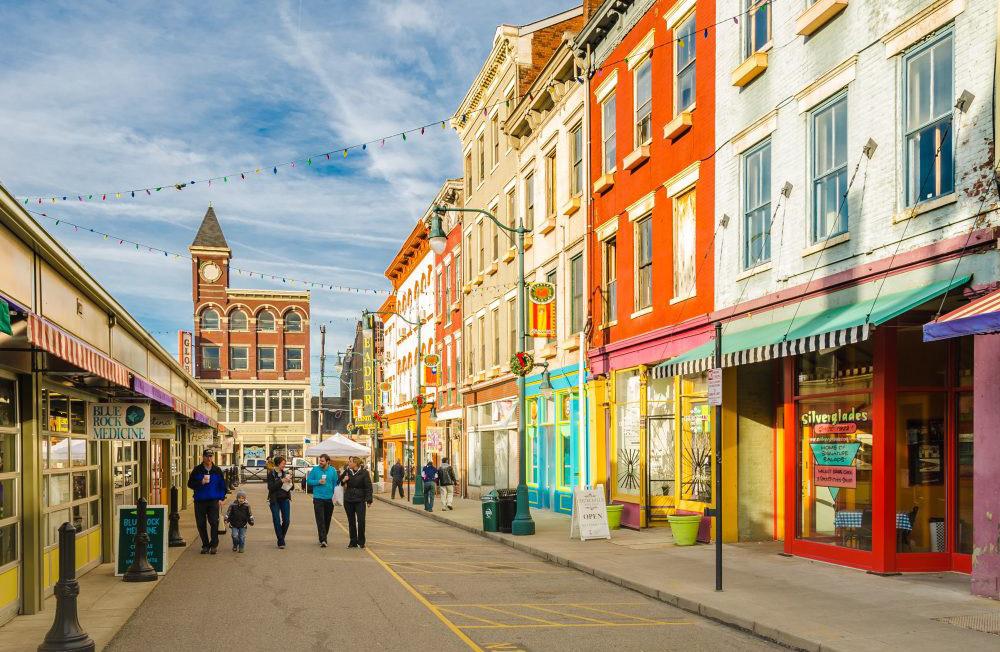
Findlay Market is Ohio’s oldest continuously operated public market and is located in the historic Over-the-Rhine neighborhood. The market is a wonderful place for locals to buy their groceries as well as a must-see historic spot for visitors to Cincinnati. Findlay Market is open year-round, Tuesday through Sunday, with a seasonal farmers market. Nearly 40 full-time businesses operate year-round, plus over 100 more vendors operate on weekends or part-time. Many vendors sell raw food while others specialize in prepared foods. Some of the merchants are new startups, while others have been in business for generations. You’ll find everything from fresh meat and produce to imported fine teas to Belgian waffles. There are restaurants as well as a beer garden, so plan to stay for lunch. Findlay Market has a fascinating history. Why not take a tour to learn more? There are several different tour options, including a culinary tour with tasty samples.