
PREPARED FOR: ANDREWS | DICKMAN GROUP GEO PORTFOLIO FEBRUARY 2023 319 UNITS


We are excited for the possibility to work with you on the marketing and sale of this asset. As you read this package, you will find that our team has had great success in executing multifamily transactions in the Midwest markets. We have an excellent track record of selling the “story” behind each asset we market. We will ensure maximum market value by identifying a diverse buyer pool, and leveraging Marcus & Millichap’s national platform to create the most competitive environment for sale.
 Nicholas Andrews
Austin Sum
Nicholas Andrews
Austin Sum
MARKET UPDATE | PAGE 4
CINCINNATI OVERVIEW | PAGE 6
Q4 MARKET | PAGE 8

PROPERTY SNAPSHOT | PAGE 10
FINANCIALS | PAGE 12
PRICING | PAGE 18
RED IQ | PAGE 20
Q&A | PAGE 28
More than $202.6 million in investments are planned in Ohio, through funding from the states Ohio Tax Credit Authority (TCA). The TCA approved 14 new projects which are slated to create $99.7 million in new payroll and 1,663 new jobs and also retain another 3,457 jobs across the state. In the Cincinnati area, the impact will be seen in Springdale, within the North Cincinnati submarket.
Here, liquid sugar company Pennsylvania-based Sugaright LLC plans to create 39 new jobs and generate $2 million in new annual payroll, according to local news. The companys new refinery in Hamilton County will produce sucrose products for baked goods and will receive a 1.066% tax credit for seven years.

As seen in many markets around the country, the Cincinnati apartment market gave back much of the absorption gains achieved in 2021 following the COVID-19 pandemic lockdowns. In the first two quarters of 2022, Cincinnati recorded basically no demand, followed by net move outs in 3rd quarter and 4th quarter. Net move-outs totaled 1,253 units in 2022, driven down by 764 net move-outs recorded in the October to December time period. Although down from doubledigit growth in the previous three quarters, annual rent growth has been at record
highs for the past six quarters. Class B led the market with an 11.0% year-overyear increase in effective asking rents, followed by a 9.2% bump in Class A rents and a 9.1% increase (a record high) in Class C units. Every submarket continued to post hefty rent hikes, ranging from 7.0% in West Cincinnati to 11.9% in North Cincinnati. Completions in Cincinnati totaled 2,249 units in 2022, and with 176 units removed from stock, inventory grew 1.3%, on net.
More than $202.6 million in investments are planned in Ohio, through funding from the states Ohio Tax Credit Authority (TCA). The TCA approved 14 new projects which are slated to create $99.7 million in new payroll and 1,663 new jobs and also retain another 3,457 jobs across the state. In the Cincinnati area, the impact will be seen in Springdale, within the North Cincinnati submarket.
One of Cincinnati’s largest public companies, biotech research organization Medpace, announced plans in December to expand, creating 1,500 new jobs and a payroll of $90 million over the next six years. The Cincinnati Business Courier reports the average salary of these new jobs would be $60,000 and would increase the company’s local employee base to 3,700, a 70% boost. Medpace plans to invest $150 million in a new 250,000-square-foot office building at its local headquarters in North Central Cincinnati and add a 1,000-space parking garage. Construction is scheduled to begin in 2023.
Quarterly Rent Growth- 0.4% Rent- $1,304
Rent/SF- $1.399
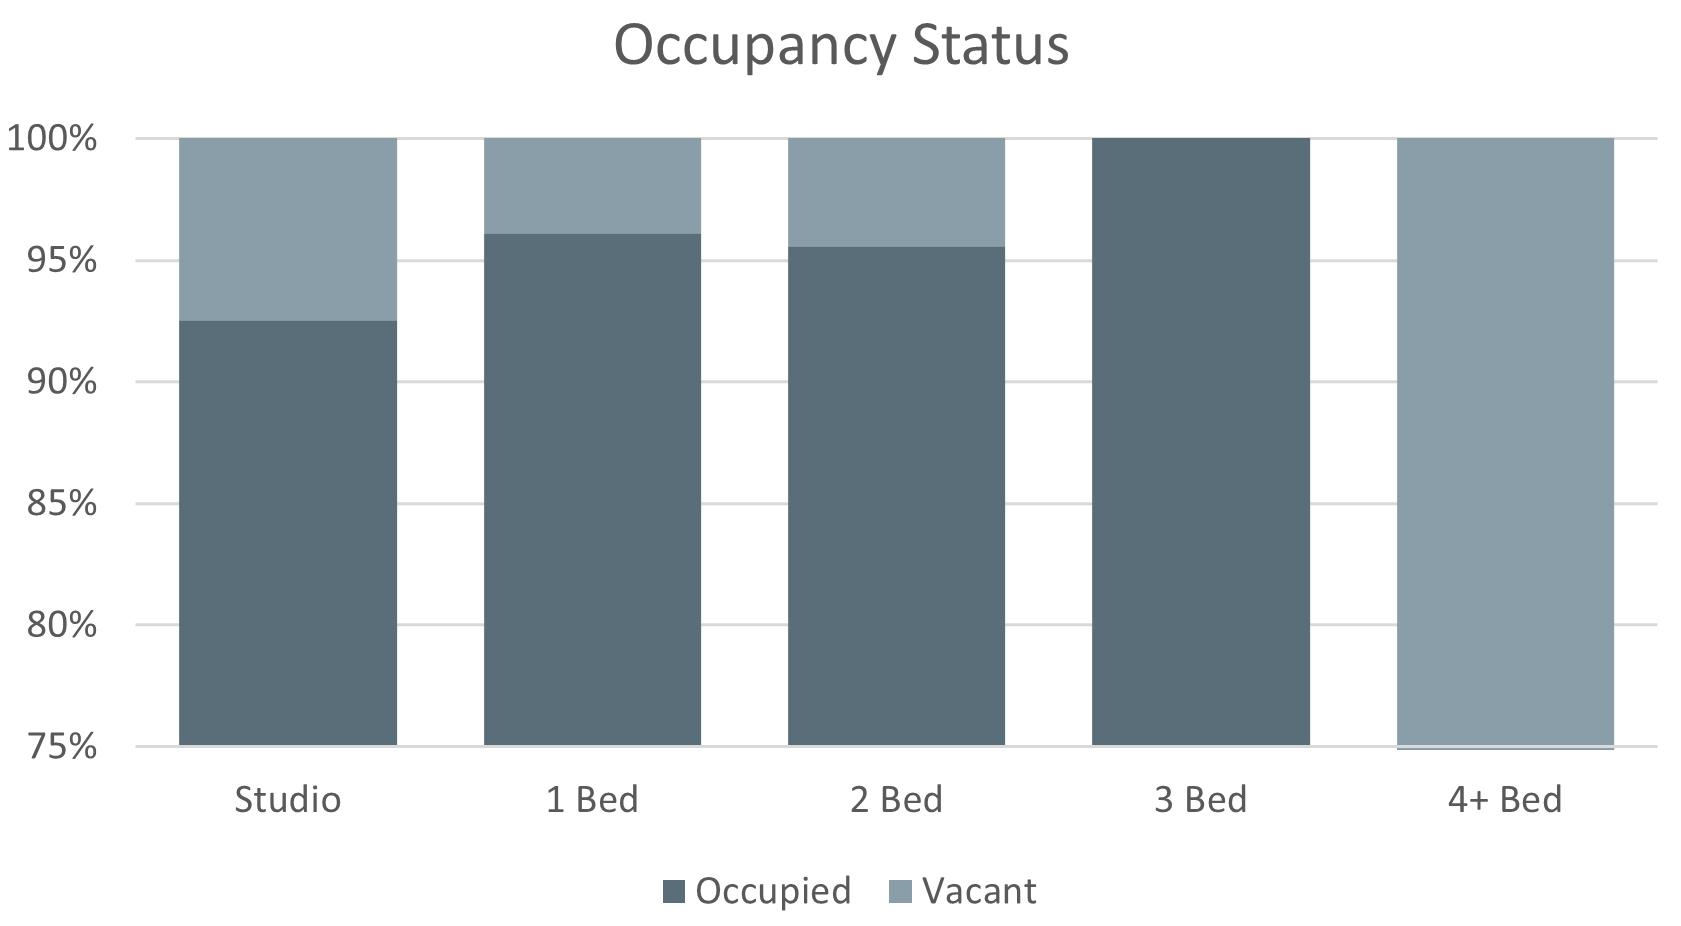
Occupancy- 96.2%
Units Completed in last 4 quarters- 2,249 Annual Supply Growth- 1.3%
under construction- 6,462 Projected Supply growth- 2.82% YTD 2022 Job Change- 12,800
Quarterly Rent Growth – 0.3% Rent- $1,077 Rent/SF- $1.182 Occupancy- 96.2%
Units Completed in last 4 quarters- 412 Annual Supply Growth- 0.7% Units under construction- 886 Projected Supply growth- 1.17% YTD 2022 Job Change- 2,900
Quarterly Rent Growth: -0.3% Rent- $1,154 Rent/SF- $1.219 Occupancy- 95.0%
Units Completed in last 4 quarters- 2,157 Annual Supply Growth- 2.3% Units under construction- 1,159 Projected Supply growth- 1.12% YTD 2022 Job Change- 28,200
Quarterly Rent Growth-: -1.1% Rent- $1,140
Rent/SF- $1.239


Occupancy- 95.2%
Units Completed in last 4 quarters- 369
Annual Supply Growth- 0.8% Units under construction- 920
Projected Supply growth- 0.8% YTD 2022 Job Change- 6,200

1| Prior to the pandemic, Cincinnati’s real gross metropolitan product grew at an average annual rate of 1.9% from 2015 to 2019. During that same fiveyear period, job growth averaged 1.4% annually, with roughly 15,500 jobs added on average each year. In 2020, COVID-19 mitigation measures and limited business activity caused the local economy to contract as much as 9.4% year-over-year in 2nd quarter. 2| In 2022, the metros inflation-adjusted economic output contracted 0.4%. At the same time, the metro recorded a net gain of 12,800 jobs, expanding the employment base 1.2%.
1| Transaction dollar volumes in Cincinnati totaled roughly $520.8 million in 2022, down about 22% year-over-year. 2| Meanwhile, the number of transactions decreased about 40% over the past year, with 31 apartment properties trading hands. 3| Transactions in 2022 yielded an average cap rate of 5.39%, down 34 basis points year-over year. By comparison, cap rates averaged 5.05% in the Midwest region and 4.54% nationally. 4| Meanwhile, the average price per unit in Cincinnati came in at roughly $170,200, up 66.0% annually.
1| Over the past five years, annual change in effective asking rents in Cincinnati ranged from 1.7% to 11.9%. 2| In 4th quarter 2022, effective asking rents for new leases were up 9.9% year-over- year. That annual rent performance was above the market’s five-year average of 5.0%. 3| Looking at product classes in Cincinnati, in 4th quarter 2022 annual effective rent change registered at 9.2% in Class A units, 11.0% in Class B units and 9.1% in Class C units. 4| Among submarkets, the strongest annual rent change performances over the past year were in North Cincinnati and Butler County. In the coming year, samestore effective asking rent change in Cincinnati is expected to slow from the current level.


1| Over the past five years, annual absorption in Cincinnati has ranged from net move-outs from 1,253 units to demand for 4,544 units, averaging 2,182 units annually during that time. 2| In 2022, the market recorded net move-outs from 1,253 units, trailing concurrent supply volumes.
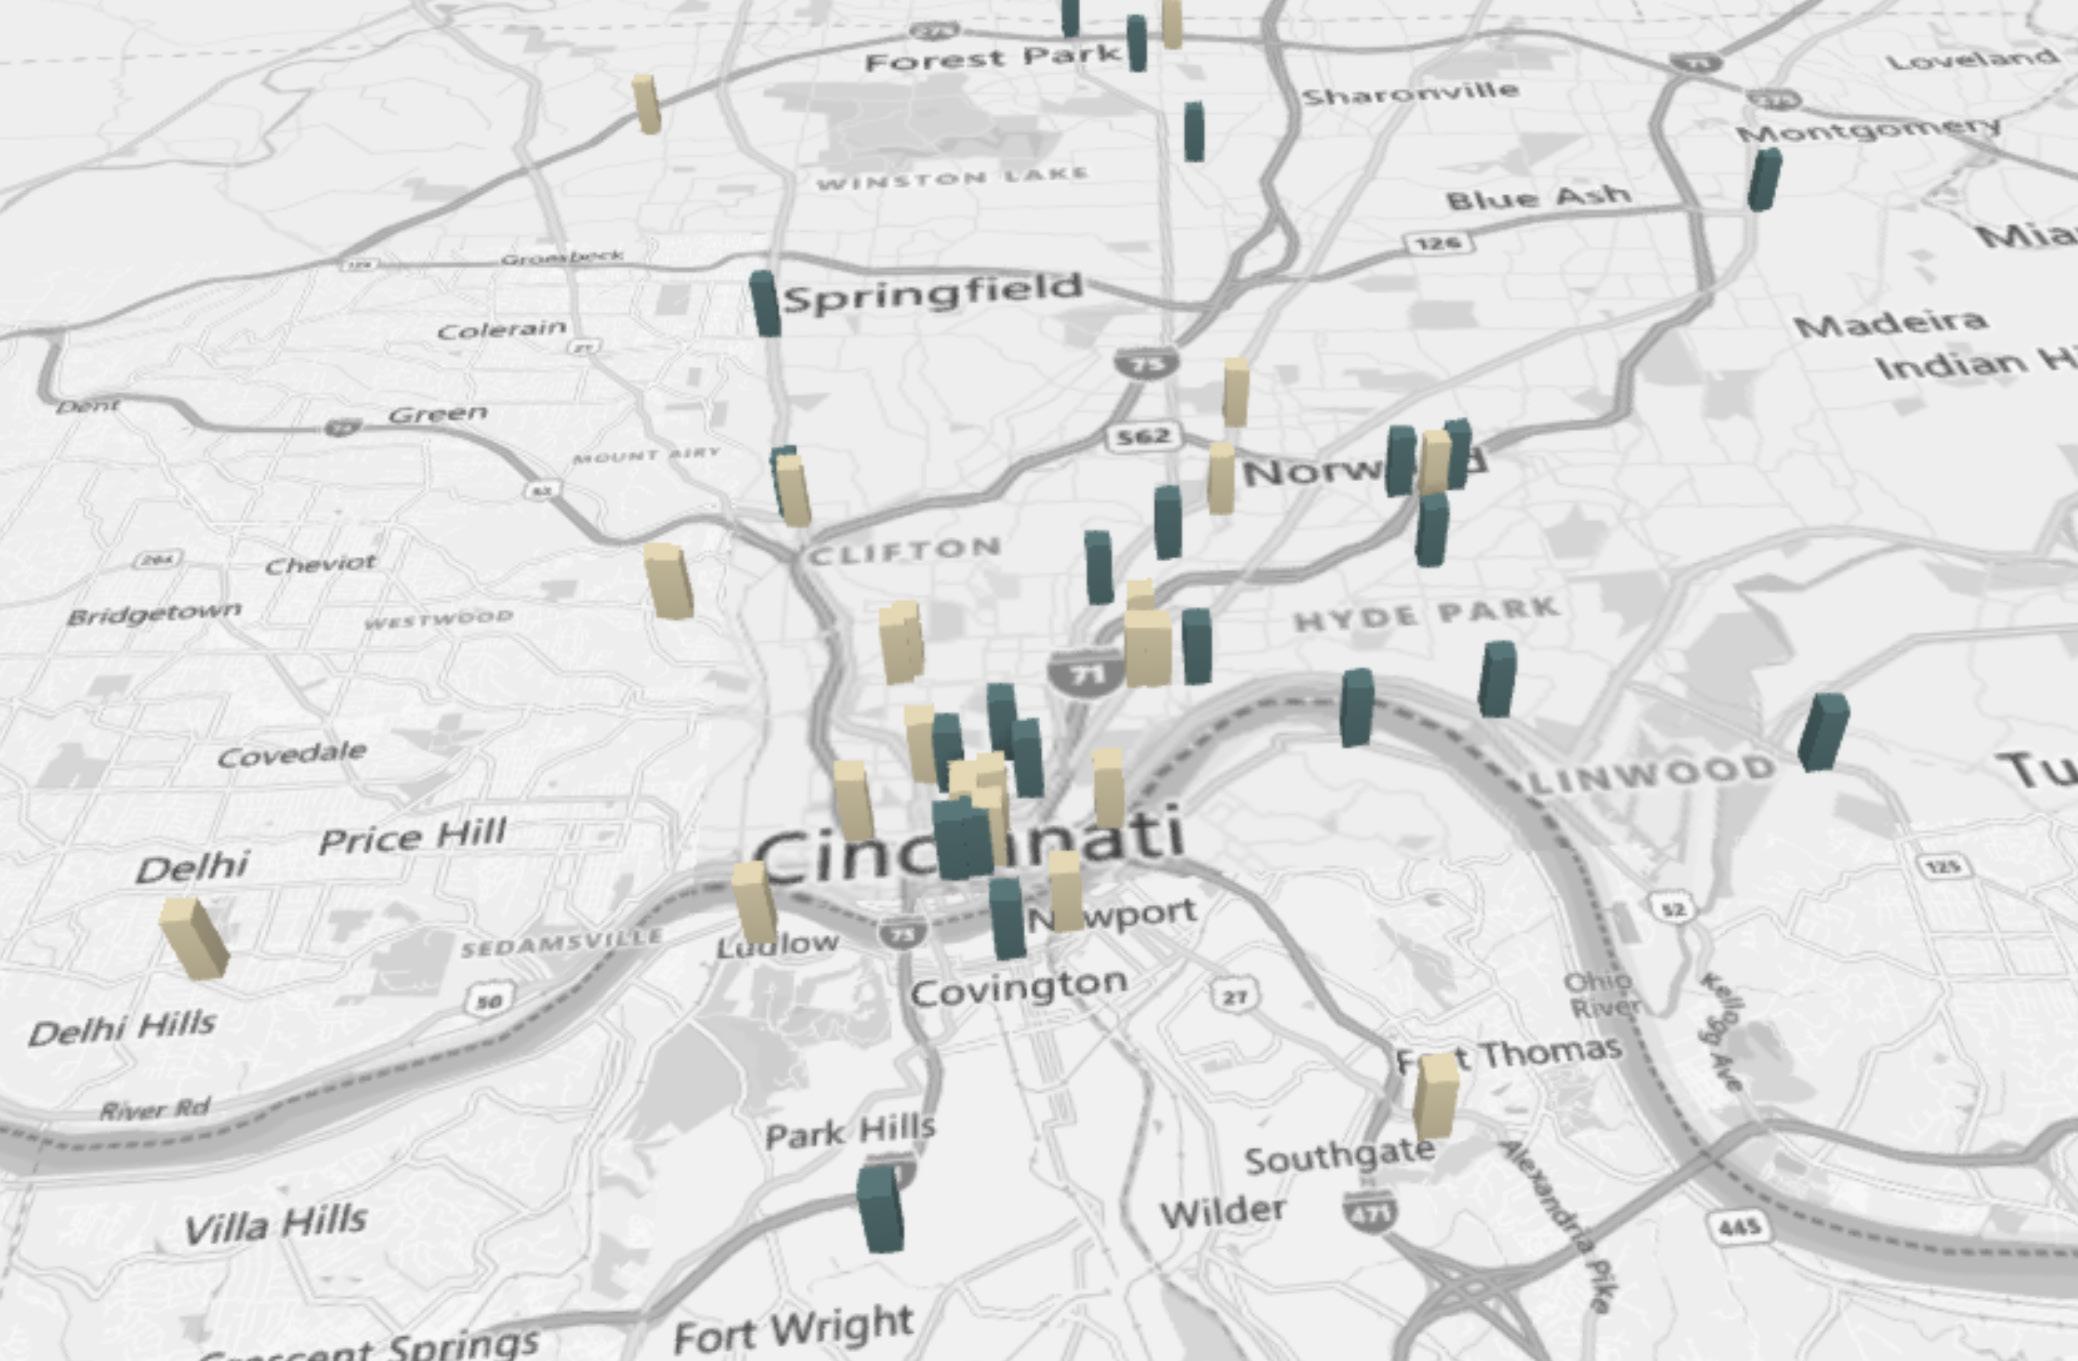
1| New apartment completions in Cincinnati were modest recently, as 2,249 units delivered in 2022. That annual completion volume was a six-year high. With 176 units removed from existing stock over the past year, the local inventory base grew 1.3%. 2| In the past year, supply was greatest in Central Cincinnati and Campbell/Kenton Counties. 3| New supply was concentrated in Central Cincinnati, Campbell/Kenton Counties and Northeast Cincinnati/Warren County, which received 66% of the markets total completions. 4| At the end of 2022, there were 6,462 units under construction with 4,669 of those units scheduled to complete in the next four quarters. Scheduled deliveries in the coming year are expected to be concentrated in North Central Cincinnati and Butler County.
2,249 units completed in past 12 months
6,462 units currently in progress
PLANNED


*Calculated as a percentage of Gross Potential Rent | **Calculated as a percentage of Effective Gross Income
Marketing the asset without a specific price allows us to customize our sales approach to each investor’s specific rehab costs, cost of debt and minimum return requirements. Thus facilitating a competitive bidding environment and ultimately maximizing the value of the Property.
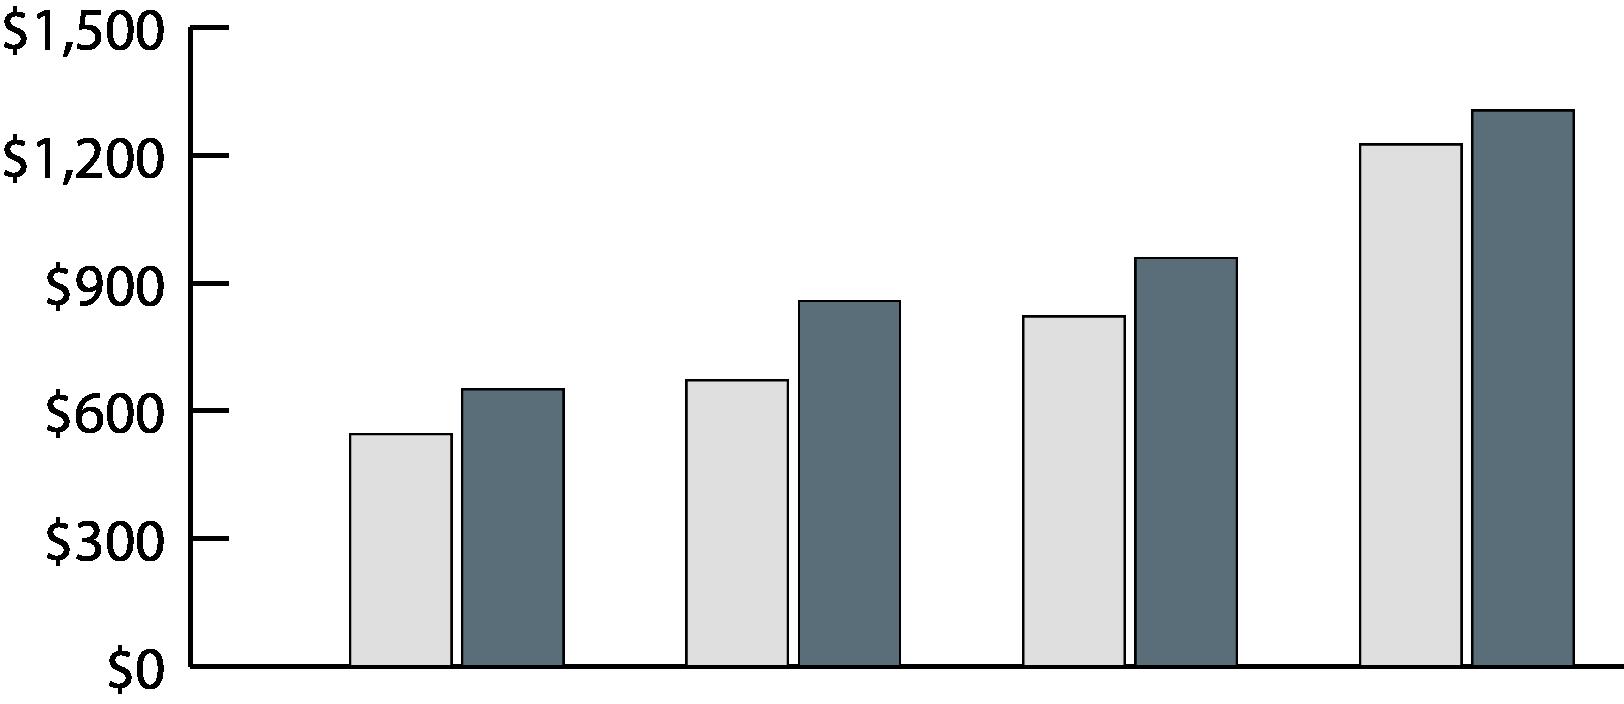
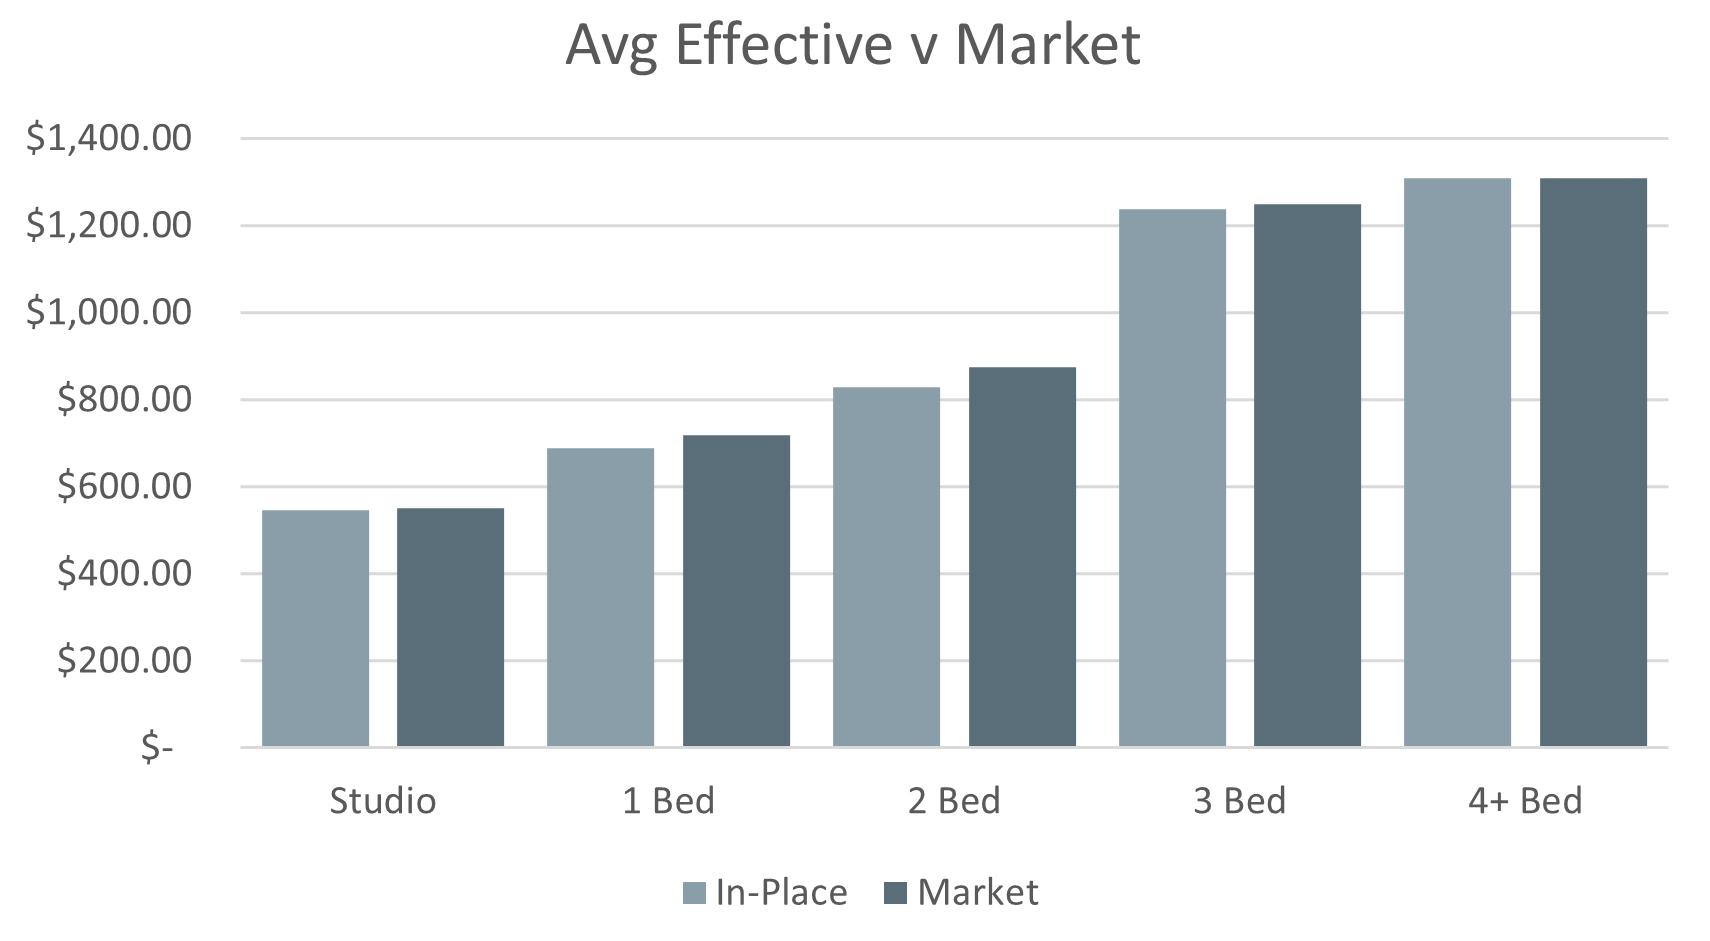
AVG MARKET RENT AT TIME OF ANALYSIS
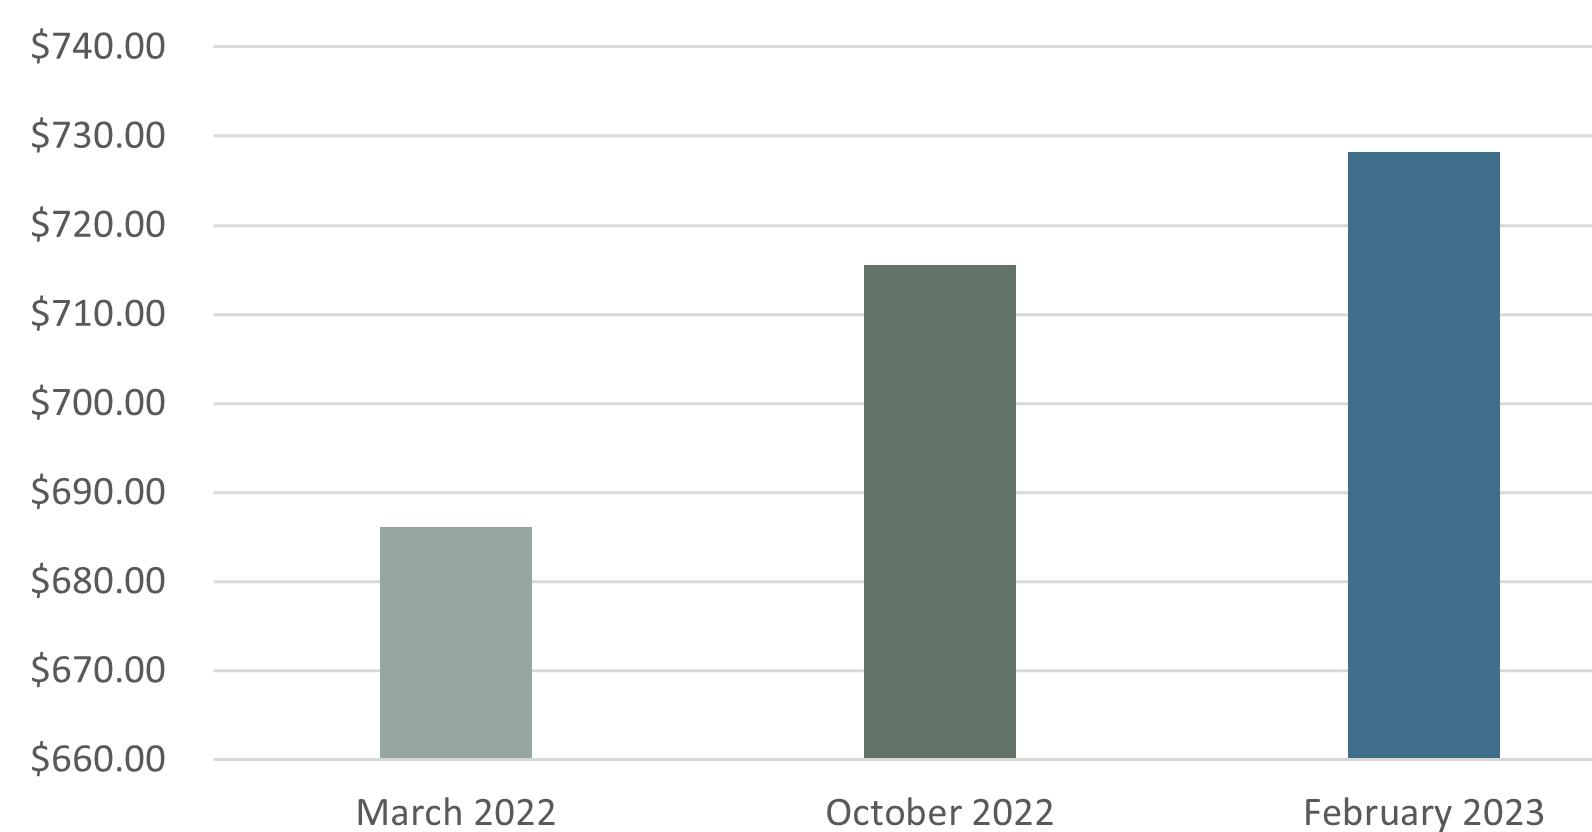
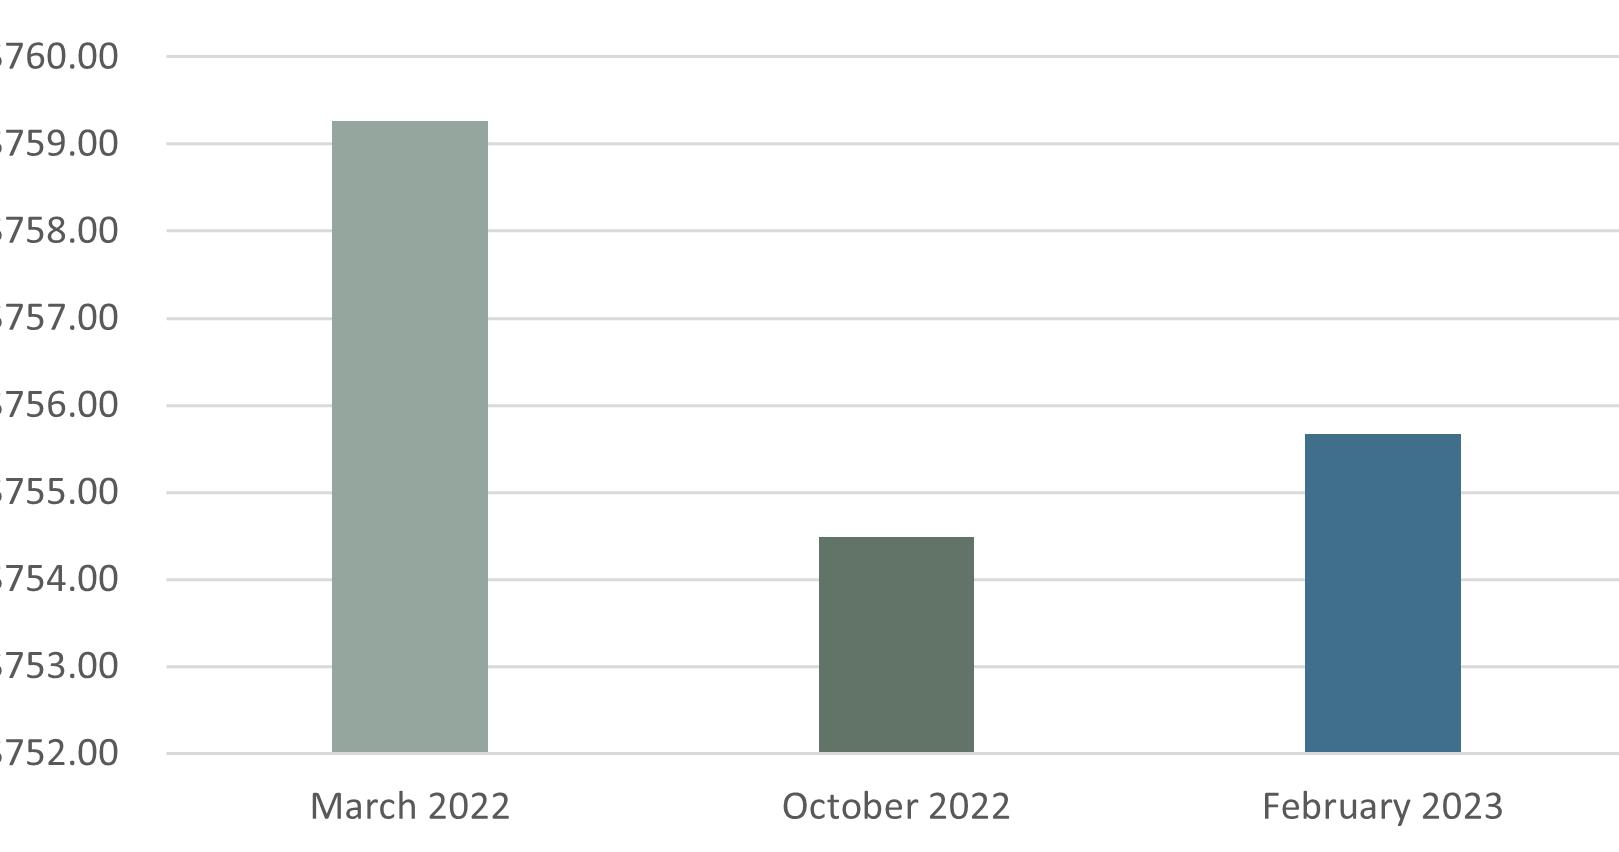
AVG EFF RENT AT TIME OF ANALYSIS
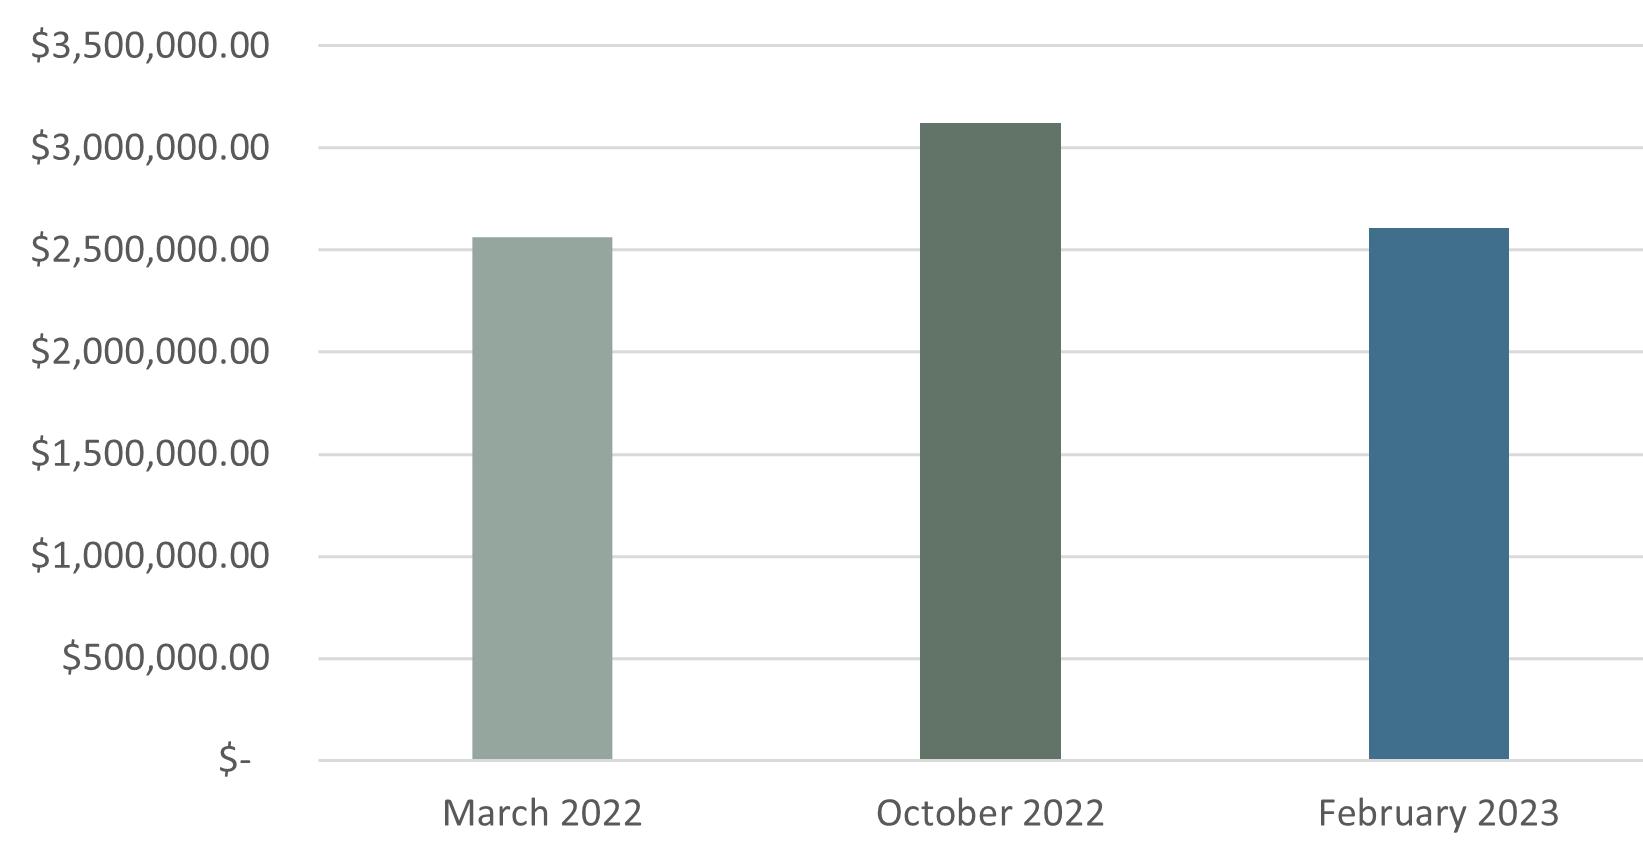
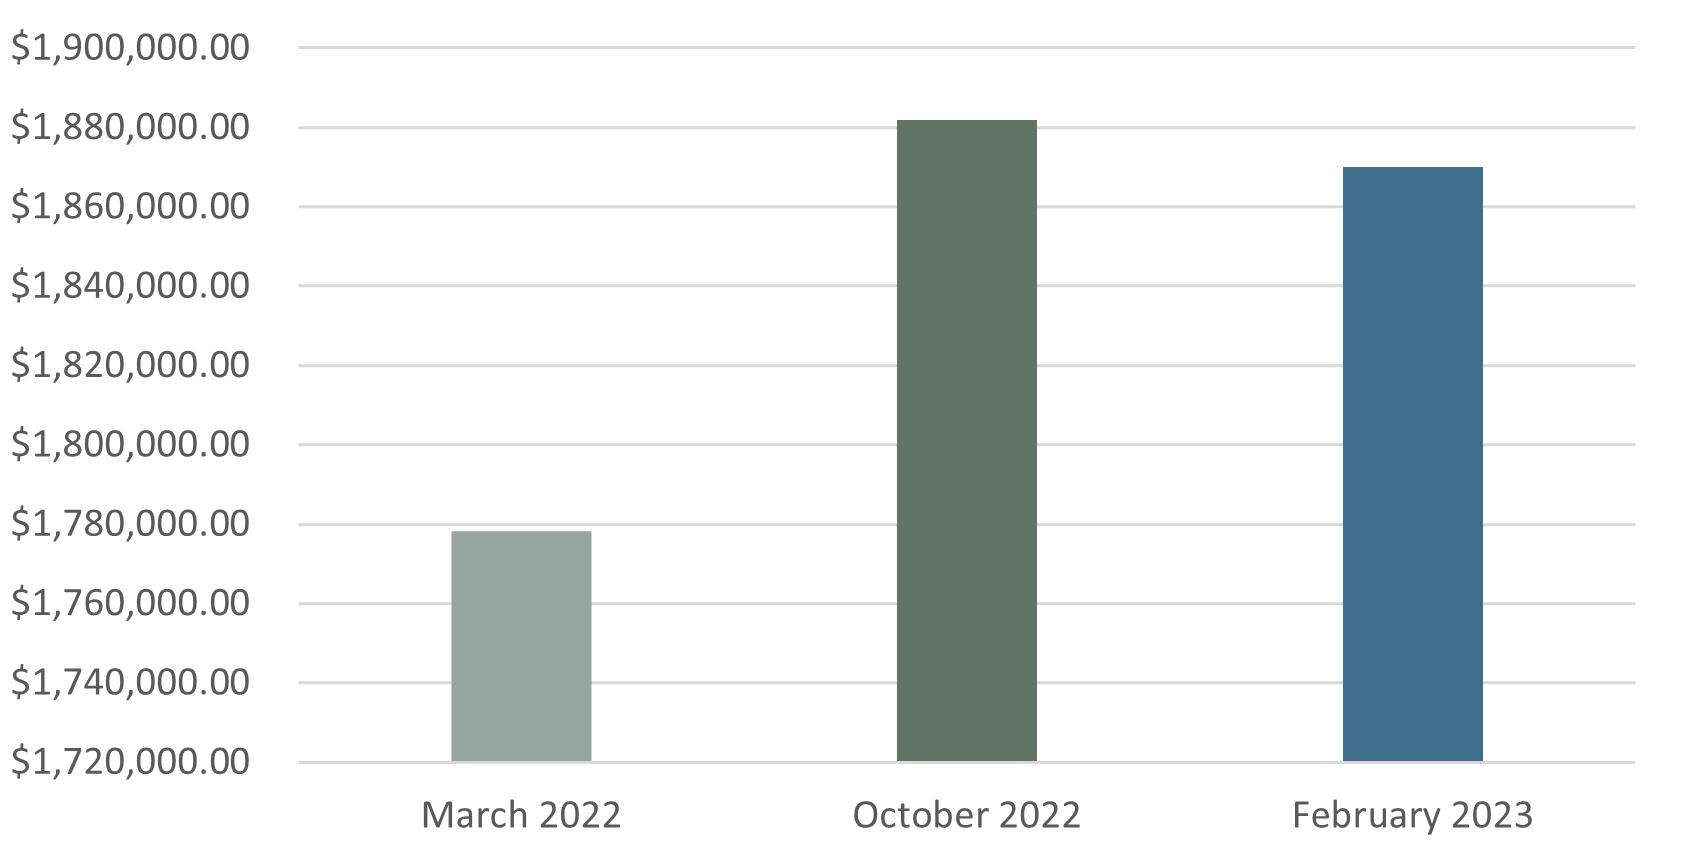
EFFECTIVE INCOME AT TIME OF ANALYSIS
MARCH 22’
OCTOBER 22’
FEBRUARY 23’
TRAILING NOI PER UNIT TRAILING EXPENSES AT TIME OF ANALSIS
ECONOMIC VACANCY AT TIME OF ANALYSIS
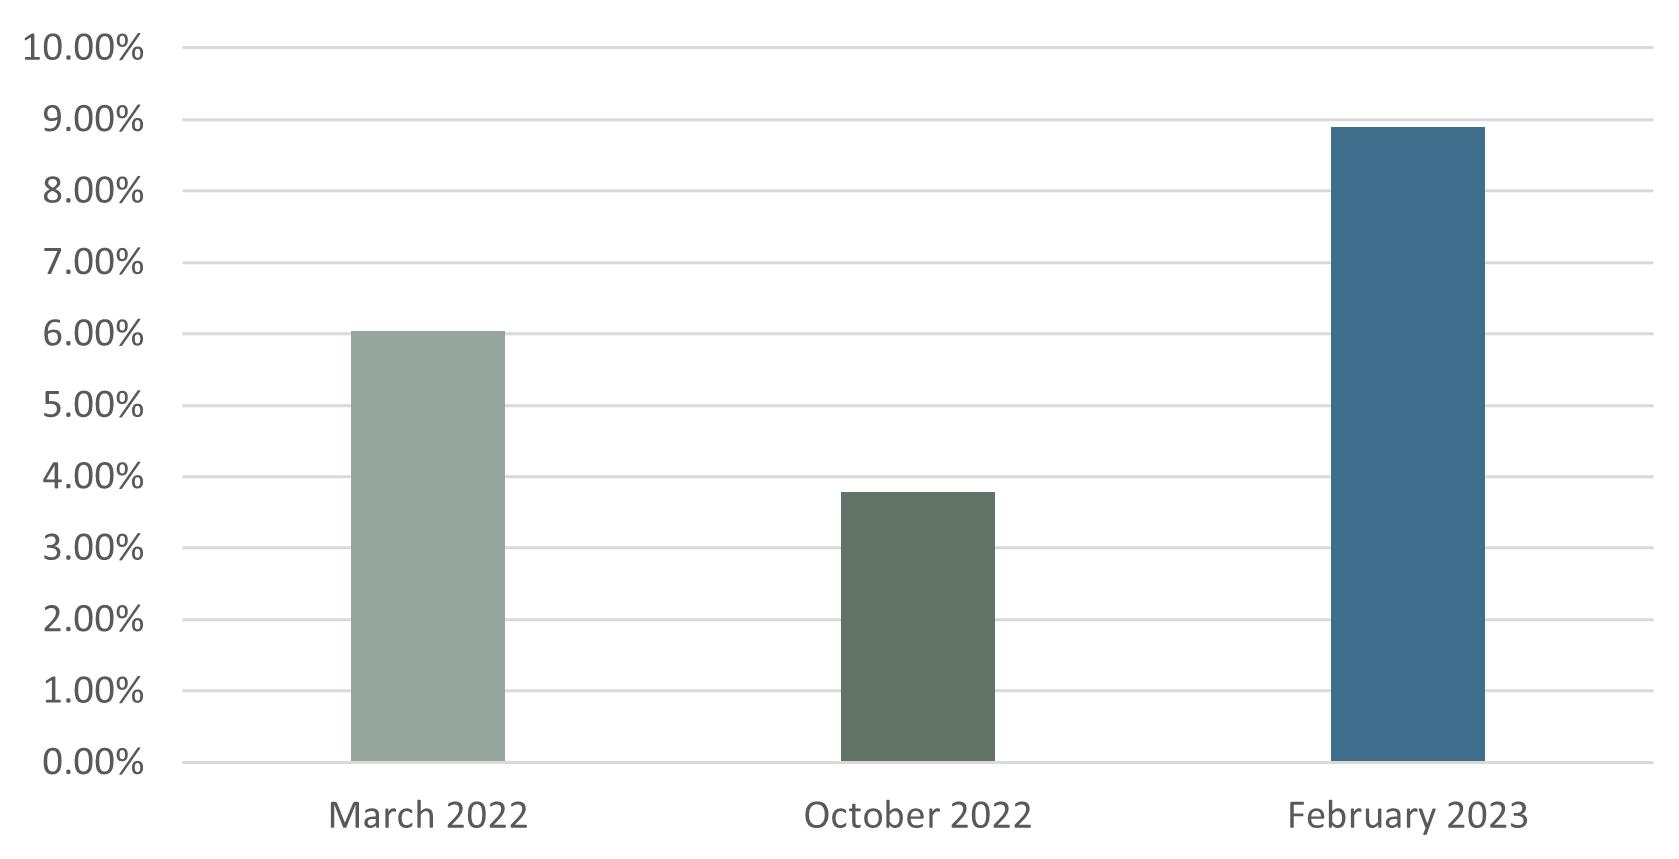
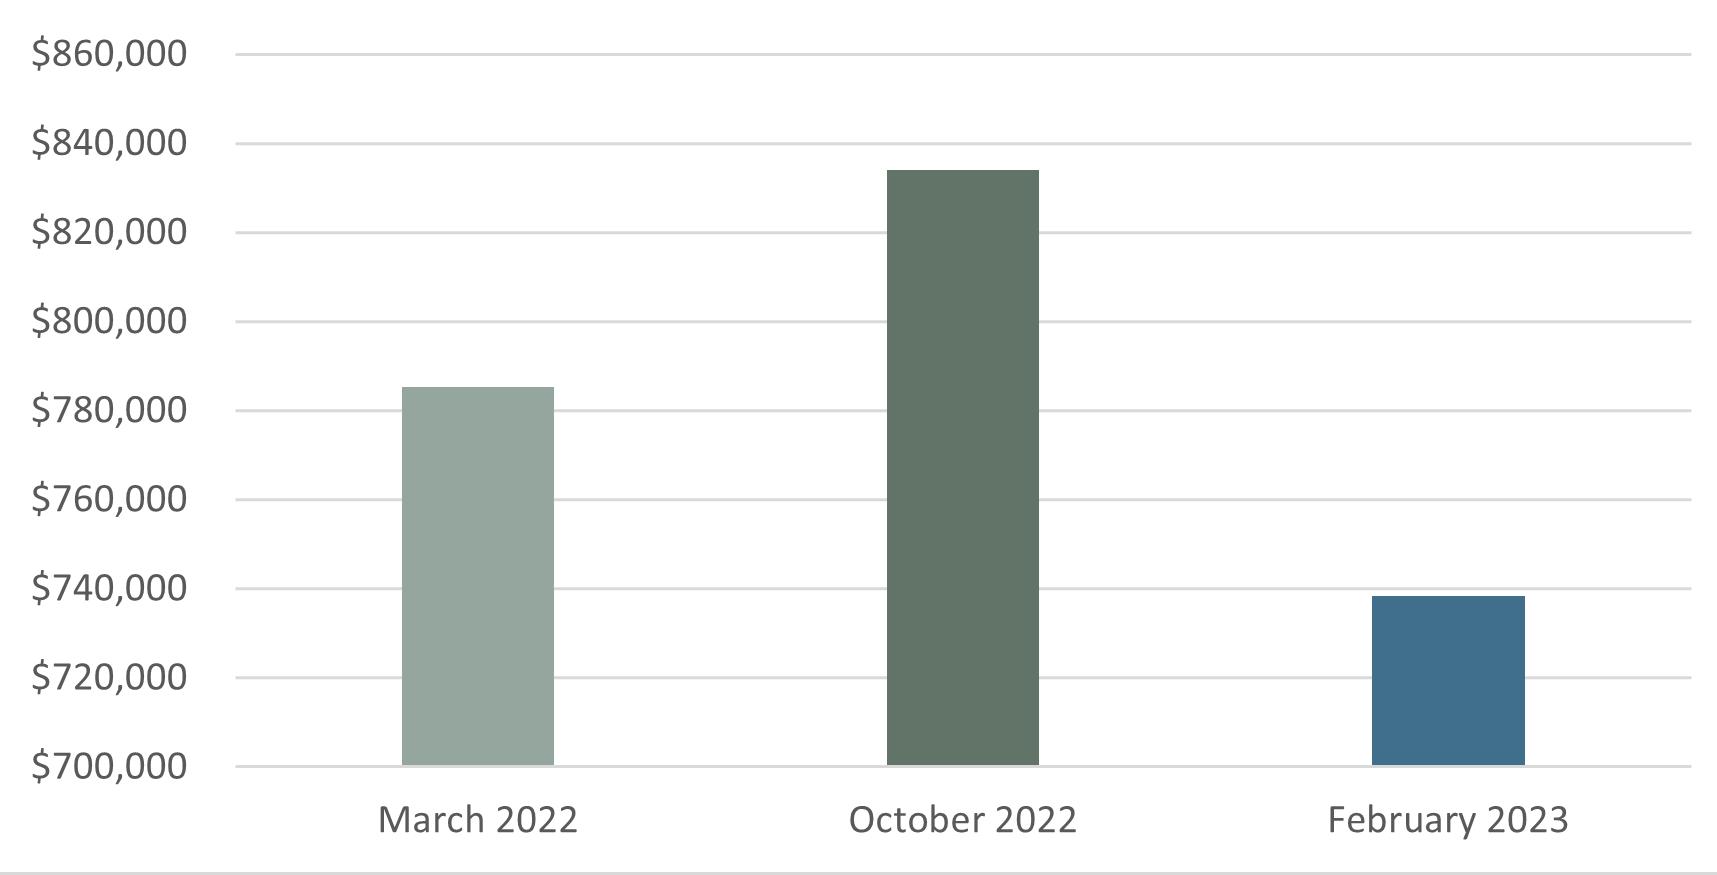
MARCH 22’
OCTOBER 22’
FEBRUARY 23’
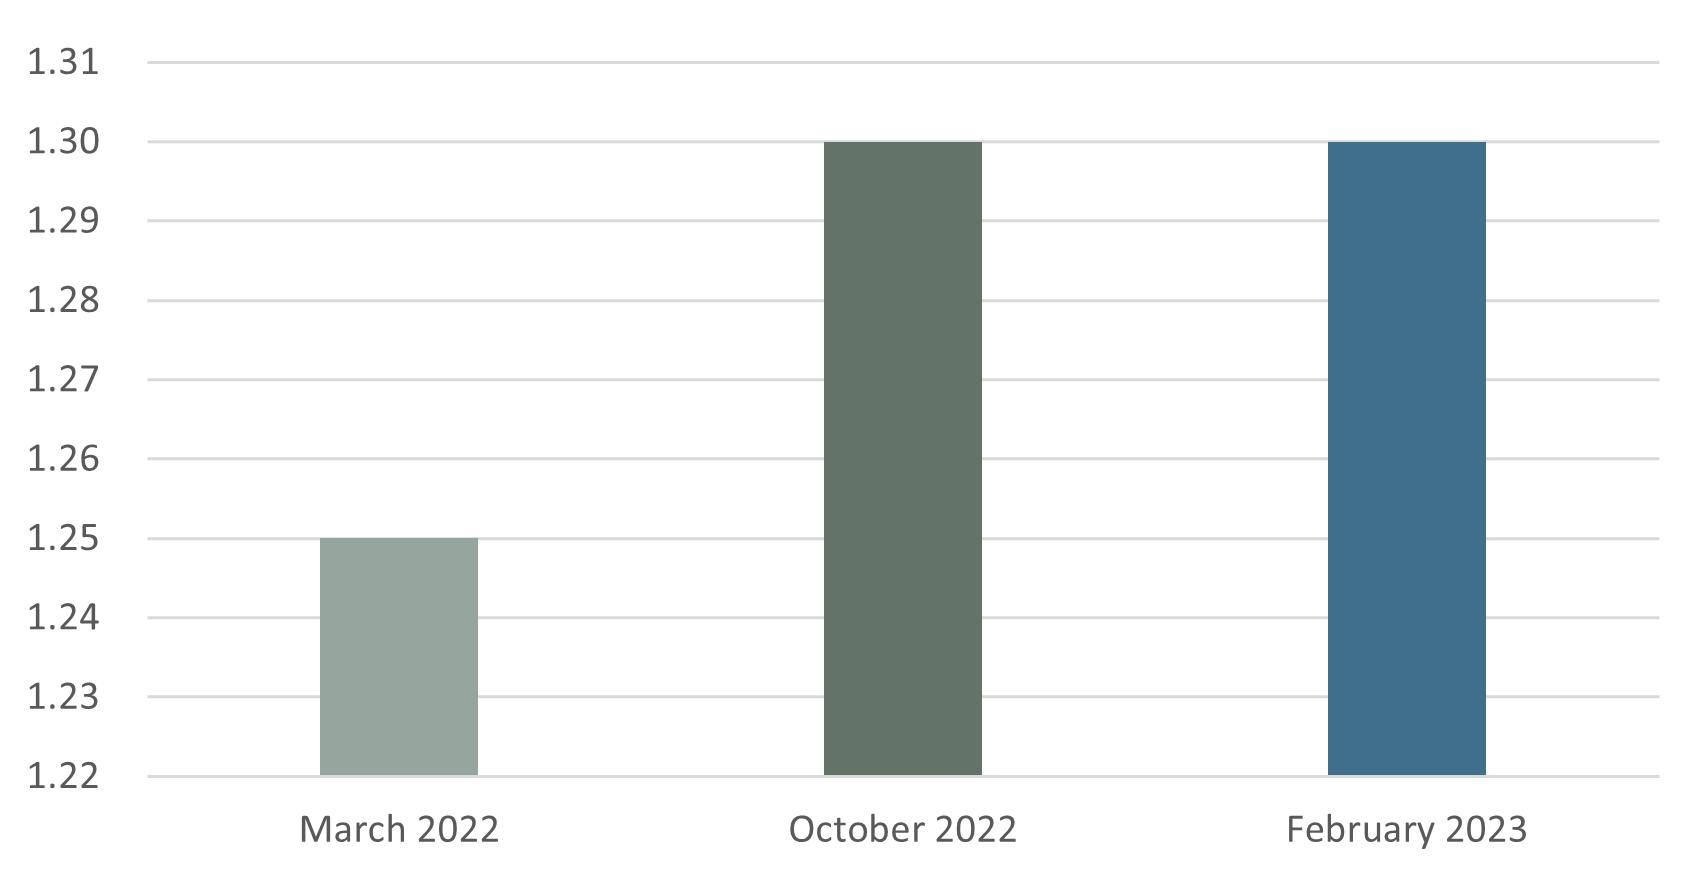
DSCR AT TIME OF ANALYSIS
INTERST RATES | 10 YEAR
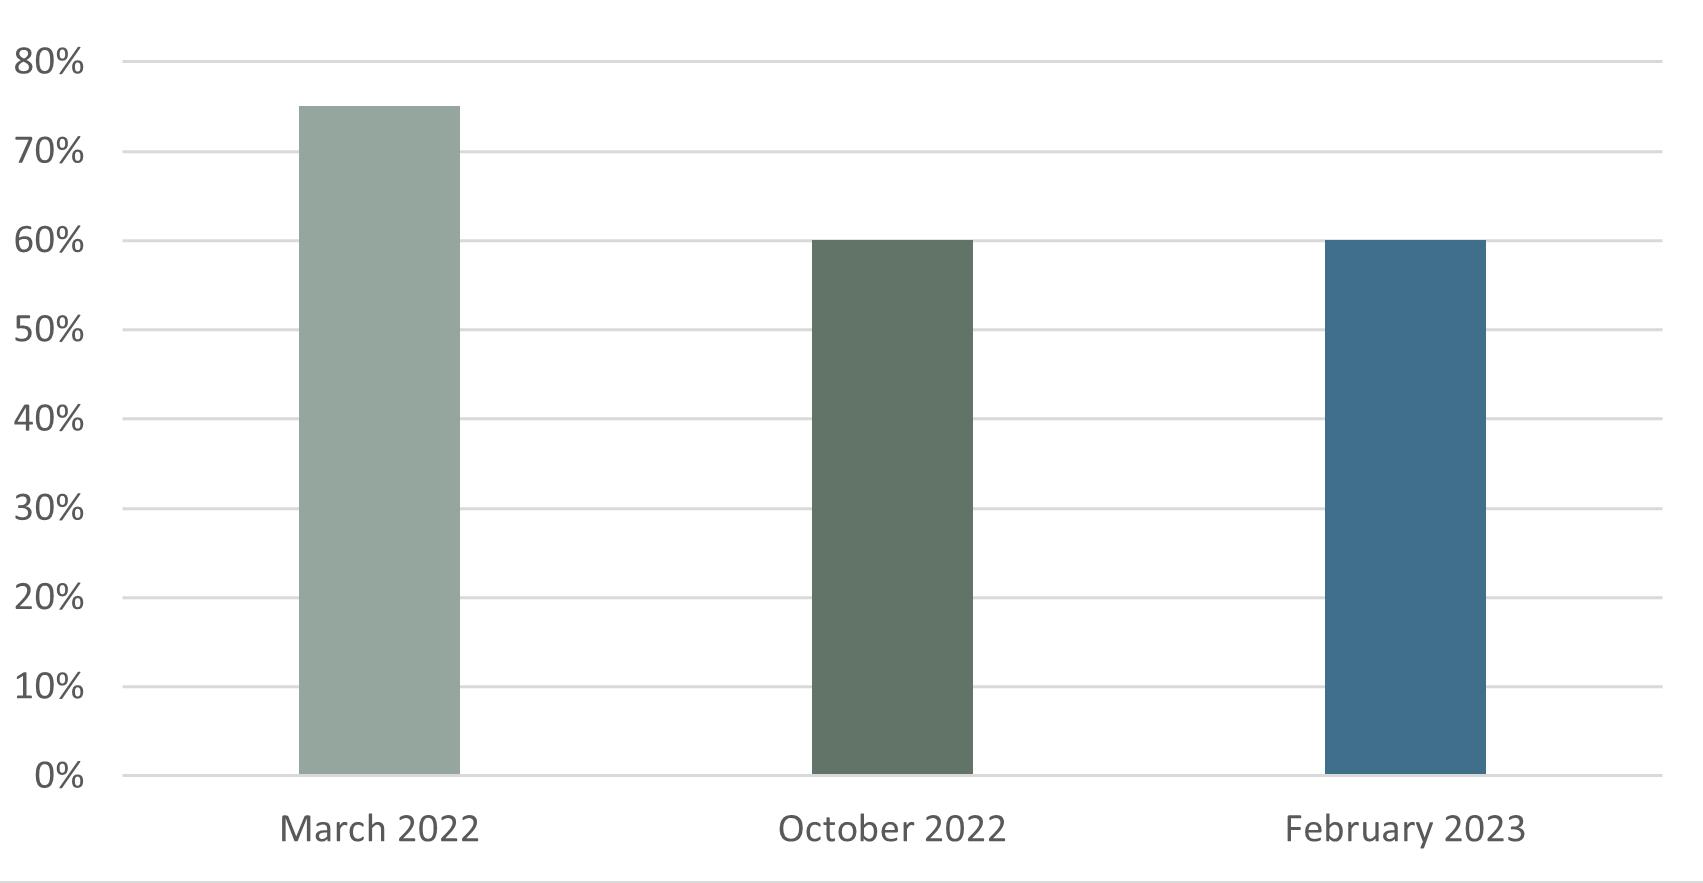
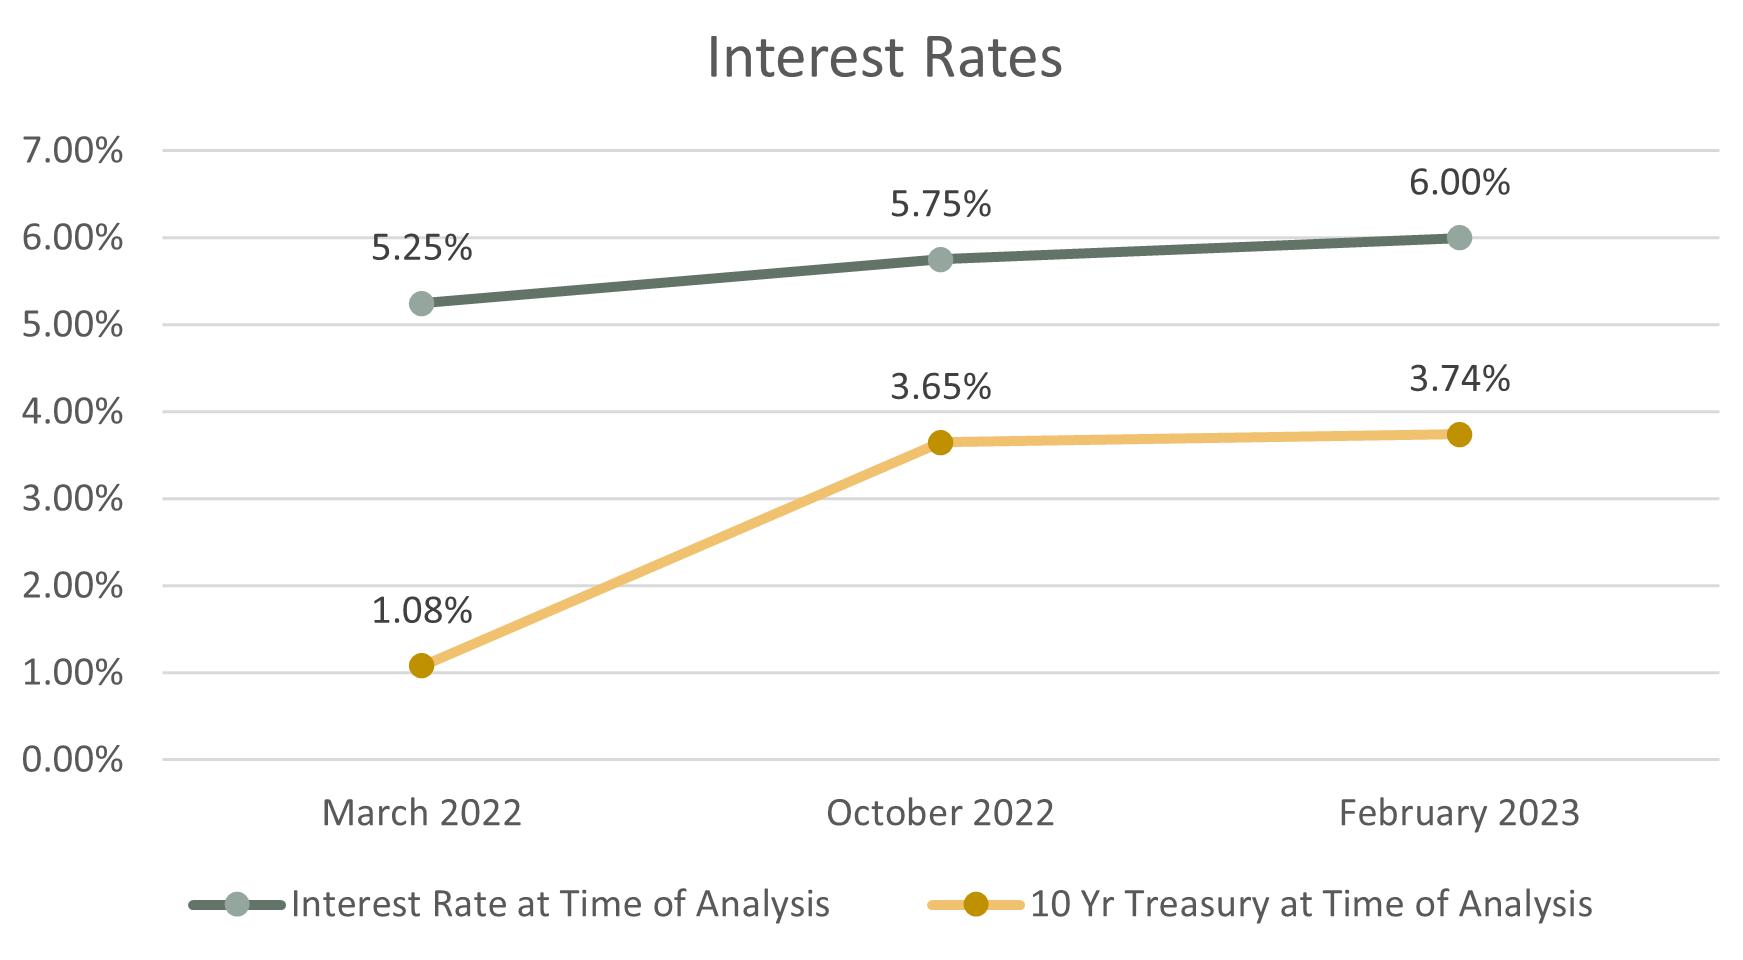
LTV AT TIME OF ANALYSIS
TREASURY AT TIME OF ANALYSIS

MARCH 22’
OCTOBER 22’
FEBRUARY 23’


* INFO UNAVAILABLE WITH GIVEN RENT ROLL - ABOVE INFORMATION IS FROM OCTOBER 22’ RENT ROLL
* INFO UNAVAILABLE WITH GIVEN RENT ROLL - ABOVE INFORMATION IS FROM OCTOBER 22’ RENT ROLL

• Is there a contract falling into the ‘Office Supplies & Software’ gl account? That account has the same charge every month.
o Brookwood, College Crest, Reading, Vernon, and Westwood all have consistent charges through the 12 months. Is this your Property software?
o Yes. Property and Accounting Software.
• What is the ‘Lender Repair Reimbursement’ gl account?
o Brookwood had a 1 time negative expense of almost $14k in Sep21
o This is not an operational line item. Money is withheld by lender and disbursed once repairs and turns are done. The negative means the lender has paid out. Please ignore this line in when assessing operational P&L.
• What is the gl account ‘Unapplied Cash Bi
o It is how accounting software accounts for pre-payment of certain bills. Again, this is not an operational expense. These are typically utilities bills that are pre-paid/ reimbursed. Ignore this line item to avoid double counting as these are going to picked up in the actual utilities lines.
• Roof repair on Vernon was over $12k for the LTM, any CAPEX in there?
o Bulk of expenses were last summer
o Almost all of it CAPEX
Payroll: Reason for labor being high at Brookwood?
They had high labor expenses for the last 7 months.
o Lots of units being turned over so we can change over tenants and leases to higher market rents. This is a good thing. They should be one-time and will be much lower once stabilized.
• Pest control: Higher expenses for LTMs at Brookwood and College Crest. Reason for higher expenses?
o Turnover related. Should be lower and comparable to other properties as it stabilizes.
• What is bonus income?
All properties but College Crest had income through the LTMs
• Additional income from Cincinnati Housing Authority given as incentives to landlords to accept Section 8 tenants.
• Difference between “insurance escrow” and “insurance”? Seems like insurance escrow is the actual insurance expense.
o Brookwood, Reading, Vernon had small dollars in the ‘Insurance’ gl code
o “Insurance escrow” is the actual insurance expense. It is escrowed and then paid out at the end of the year. Use this as the expense. “Insurance” number is small and one-time additional expenses, not related to on-going operations.

Our commitment is to help our clients create and preserve wealth by providing them with the best real estate investment sales, financing, research and advisory services available www.adgmultifamily.com