CARDINAL HILL GARDENS proposal


Tim VanWingerden

Associate
Cincinnati Office
D. 513.878.7750
tim.vanwingerden@marcusmillichap.com
Jordan Dickman
First Vice President Investments
Cincinnati Office
D. 513.878.7735
jordan.dickman@marcusmillichap.com
Nick Andrews
First Vice President Investments

Cincinnati Office
D. 513.878.7741

nicholas.andrews@marcusmillichap.com
Austin Sum
Senior Associate


Cincinnati Office

D. 513.878.7747
austin.sum@marcusmillichap.com
“OUR COMMITMENT IS TO HELP OUR CLIENTS CREATE


AND PRESERVE WEALTH BY PROVIDING THEM WITH
THE BEST REAL ESTATE INVESTMENT SALES, FINANCING, RESEARCH AND ADVISORY SERVICES AVAILABLE.”

THIS IS A BROKER PRICE OPINION OR COMPARATIVE MARKET ANALYSIS OF VALUE AND SHOULD NOT BE CONSIDERED AN APPRAISAL. This information has been secured from sources we believe to be reliable, but we make no representations or warranties, express or implied, as to the accuracy of the information. References to square footage or age are approximate. Buyer must verify the information and bears all risk for any inaccuracies.

Marcus & Millichap is not affiliated with, sponsored by, or endorsed by any commercial tenant or lessee identified in this marketing package. The presence of any corporation’s logo or name is not intended to indicate or imply affiliation with, or sponsorship or endorsement by, said corporation of Marcus & Millichap, its affiliates or subsidiaries, or any agent, product, service, or commercial listing of Marcus & Millichap, and is solely included for the purpose of providing tenant lessee information about this listing to prospective customers.


Thank you for allowing Marcus & Millichap the opportunity to provide a current Broker Pricing Opinion (Proposal) for Cardinal Hill Gardens located in Louisville, Kentucky.


We are excited for the possibility to work with you on the marketing and sale of this asset. As you read this package, you will find that our team has had great success in executing multifamily transactions in the Midwest markets. We have an excellent track record of selling the “story” behind each asset we market. We will ensure maximum market value by identifying a diverse buyer pool, and leveraging Marcus & Millichap’s national platform to create the most competitive environment for sale.
 Nicholas Andrews Tim VanWingerden Austin Sum
Austin Sum
Senior Associate
JD Schmerge

Associate
Tim VanWingerden
Associate
Brian Johnston
Associate
Austin Hall Associate
Alden Simms
Associate
RESEARCH & EVALUATION
Sam Petrosino
Financial Analyst
CLIENT RELATIONS
Skyler Wilson
Client Relations Manager
MARKETING
Alex Papa
Marketing Coordinator
OPERATIONS
Brittany Campbell-Koch
Director of Operations


JORDAN DICKMAN
FIRST VICE PRESIDENTS DIRECTOR, NMHG
NICK ANDREWS
FIRST VICE PRESIDENTS DIRECTOR, NMHG
AUSTIN SUM
SENIOR INVESTMENT ASSOCIATE
JD SCHMERGE INVESTMENT ASSOCIATE
BRIAN JOHNSTON INVESTMENT ASSOCIATE
TIM VANWINGERDEN INVESTMENT ASSOCIATE
AUSTIN Hall INVESTMENT ASSOCIATE
ALDEN SIMMIS INVESTMENT ASSOCIATE
SAM PETROSNIO
VALUATION & RESEARCH
LIZ POPP
MIDWEST OPERATIONS MANAGER
JOSH CARUANA
VICE PRESIDENT
REGIONAL MANAGER
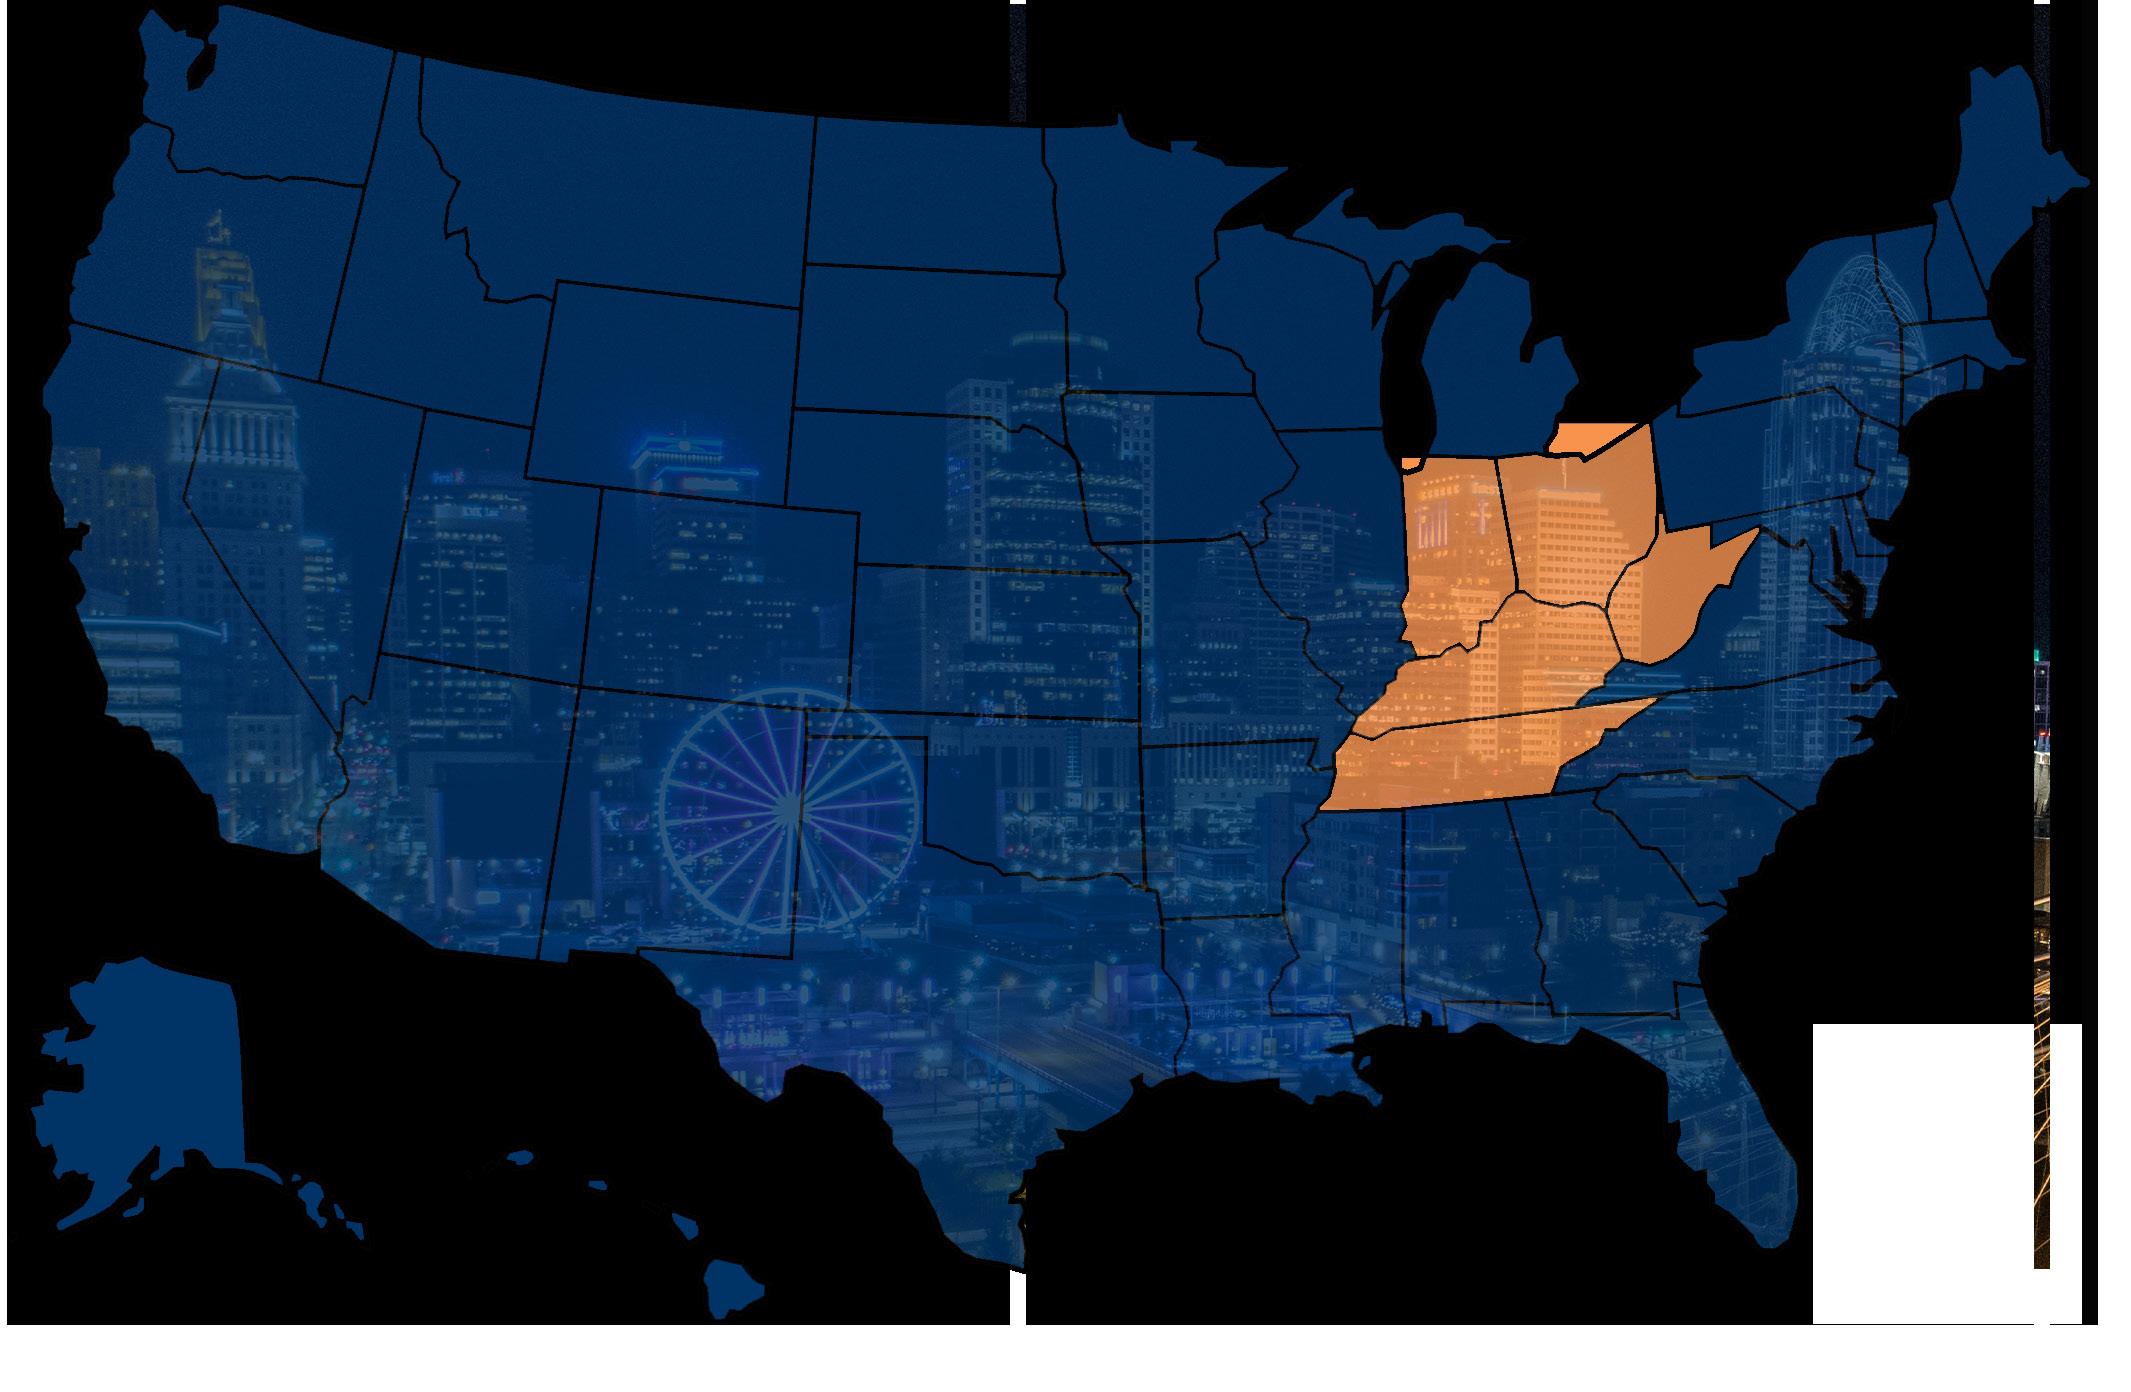
INDIANAPOLIS | CINCINNATI | LOUISVILLE | ST LOUIS | KANSAS CITY
JOHN SEBREE
SENIOR VICE PRESIDENT
NATIONAL DIRECTOR
NATIONAL MULTI HOUSING GROUP
MICHAEL GLASS
SENIOR VICE PRESIDENT
MIDWEST DIVISION MANAGER
NATIONAL DIRECTOR, MANUFACTURED HOME COMMUNITIES GROUP
SKLYER WILSON
CLIENT RELATIONS MANAGER
BRITTANY CAMPBELL-KOCH
DIRECTOR OF OPERATIONS
ALEX PAPA
MARKETING COORDINATOR
Value of recently closed
$84.4 billion
transactions in most recent year


Marcus & Millichap is the premier commercial real estate investment services firm in the United States. Founded in 1971 on a unique model that matches each property with the largest pool of pre-qualified investors, we leverage nearly five decades’ worth of experience and relationships to handle all of your commercial real estate needs. Our team of more than 2,000 professionals in the U.S. and Canada focuses exclusively on real estate investment sales, financing, research, and advisory services.
FOUNDED IN 1971 ON A UNIQUE METHODOLOGY
LARGEST POOL OF PRE-QUALIFIED INVESTORS IN THE INDUSTRY
MOVES CAPITAL ACROSS OUR NETWORK OF INVESTMENT PROFESSIONALS
MORE THAN 2,000 INVESTMENT PROFESSIONALS IN THE U.S. & CANADA
ACCESS TO THE INDUSTRY’S

MATCHING BUYERS & SELLERS
RESULTING IN THE MOST EFFICIENT PROCESS OF LOCALLY, REGIONALLY & NATIONALLY.
WITH AN EXCLUSIVE FOCUS ON REAL ESTATE INVESTMENT SALES, FINANCING, RESEARCH, AND ADVISORY SERVICES
LARGEST POOL OF PRIVATE & INSTITUTIONAL INVESTORS
Marcus & Millichap is the premier commercial real estate investment services firm in the United States. Founded in 1971 with a unique model that matches each property with the largest pool of pre-qualified investors, we leverage nearly five decades of experience and relationships to handle all your commercial real estate needs. Our team of more than 2,000 professionals in the United States and Canada focuses exclusively on real estate investment sales, financing, research and advisory services.
13,255 Transactions


In most recent year
6.74 Transactions closed Every Business Hour MOVING CAPITAL. MAXIMIZING VALUE.
We execute more tax-deferred exchanges than any other firm in the United States (32% of total transactions), and our market share is a direct benefit to clients. Over the years, we have developed the skills and expertise to maximize value and meet sensitive timelines required in a 1031 Exchange. With billions of dollars of commercial real estate exclusively listed with us at any time, motivated exchange buyers seek out Marcus & Millichap for quality investment opportunities. Through our industry-leading inventory, we deliver the best of both worlds – we maximize the value of your asset through our unparalleled marketing. We then help identify appropriate upleg options to execute a successful tax deferral acquisition.


The success of Marcus & Millichap is based on our collaborative culture of information sharing across our network of more than 2,000 investment professionals, which maximizes value for each of our clients.
Working with a unique platform that is antithetical to the concept of “pocket listings,” our investment professionals share all listings with the entire Marcus & Millichap team. Each professional specializes in a property type and has a database of local properties and owners, which is leveraged in every client assignment. Because each local agent specializes in a single product type in a specific geographic region, our clients have exposure across the U.S. and Canada with every investment..
Our foundation of information sharing maximizes pricing for our clients and gives us the largest inventory of any firm in the industry.
THE SIZE AND ACCESSIBILITY OF OUR INVENTORY ENABLES YOU TO SELL YOUR PROPERTY AND QUICKLY MOVE INTO ANOTHER PROFITABLE INVESTMENT.

2,000+ $84.4B
VALUE OF RECENTLY CLOSED TRANSACTIONS IN MOST RECENT YEAR


INBOUND / OUTBOUND
$2.1B - MW. OUTBOUND
$3.8B - MW. INBOUND
$9.2BB - W. OUTBOUND
$1.6B - W. INBOUND
$3.1B - S. OUTBOUND
$7.8B - S. INBOUND
$1.8B - TX/OK OUTBOUND

$6.4B - TX/OK INBOUND
$6.4B - NE. OUTBOUND
$1.4B - NE. INBOUND
$3.3B - MOUNTAIN OUTBOUND
$5.0B - MOUNTAIN INBOUND

The Marcus & Millichap GLOBE Capital Group provides the opportunity to expose your property to more foreign buyers with the guided expertise of our senior investment specialists. Our firm is comprised of 80+ offices throughout the US and Canada, and we provide investors with exclusive investment opportunities, financing capabilities, research, and advisory services.
With more inventory than any other firm, buyers seek Marcus & Millichap to fulfill their investment acquisition needs.
Our structured marketing process, coupled with the industry’s largest sales force, creates a competitive bidding environment for your listing
We maintain active relationships with the industry’s largest pool of 1031 exchange buyers, the most coveted buyers in the market.
This is why clients choose Marcus & Millichap over local, regional, or other national firms


Marcus & Millichap’s National Multi Housing Group (NMHG) provides the industry’s most dynamic and effective marketplace for the acquisition and disposition of apartment properties. With multifamily specialists in offices throughout the U.S. and Canada, NMHG is the industry leader in apartment transactions, having successfully executed on our clients’ behalf more than $106 billion of sales volume in the past five years.

Whether you’re looking to buy, sell, refinance, or hold, Marcus & Millichap leverages real-time market research to assess local and national trends, with specialized focus on individual property types. Backed by the collaborative culture of industry experts, your local investment professional will walk you through each phase of your investment strategy.
• Is holding my asset the most profitable choice in this market?
• How can I best take advantage of the capital markets to maximize my returns?
• Based on my investment risk tolerance and objectives, what opportunities should I consider?
• Is now the right time to sell?
• How can I leverage the capital markets to maximize my results?
• How do I optimize my position via a disposition?

• What alternatives and associated

• When is the right time to buy?
• What investment opportunities are available for my consideration?
• What are the risks in the current market?
• What are my financing options?
• How will an acquisition impact my portfolio’s returns?
• Strategic “hold” analysis

• Refinance and capitalization options
• Quarterly investment return analysis
• Ongoing market and submarket research
• Ongoing product-specific research

• Value and market positioning analysis
• Disposition buyer financing
• New acquisition financing
• 1031 exchange investment alternatives analysis

• Pre-acquisition analysis
• Financial investment analysis
• Market and submarket research
• Product-specific research

MMCC—our fully integrated, dedicated financing arm—is committed to providing superior capital market expertise, precisely managed execution, and unparalleled access to capital sources, providing the most competitive rates and terms.
We leverage our prominent capital market relationships with commercial banks, life insurance companies, CMBS, private and public debt/equity funds, Fannie Mae, Freddie Mac, and HUD to provide our clients with the greatest range of financing options.

Our dedicated, knowledgeable experts understand the challenges of financing and work tirelessly to resolve all potential issues for the benefit of our clients.
Optimum financing solutions to enhance value
Enhanced control through MMCC’s ability to qualify investor finance contingencies
Enhanced control through quickly identifying potential debt/equity sources, processing, and closing buyer’s finance alternatives
CLOSED 1,943 DEBT AND EQUITY FINANCINGS IN MOST RECENT YEAR
NATIONAL PLATFORM OPERATING WITHIN THE FIRM’S BROKERAGE OFFICES

$7.67 BILLION TOTAL NATIONAL VOLUME IN MOST RECENT YEAR
Enhanced control through MMCC’s ability to monitor investor/due diligence and underwriting to ensure timely, predictable closings
ACCESS TO MORE CAPITAL SOURCES THAN ANY OTHER FIRM IN THE INDUSTRY


Our cutting-edge market research helps us advise our clients of existing asset performance and future opportunities.


To successfully execute a marketing campaign, it is critical to understand the likely buyer profiles that will be attracted to the asset, in addition to their respective approval process, corporate structure and underwriting methodology.


Whether it be a private investor, pension fund advisor, sponsored capital group, family office, or a discretionary fund manager, every investment group has an approval process/corporate structure that dictates their ability to process with a transaction. We pride ourselves on maintaining vast and deep relationships with each of the buyer profiles that are active in the market place today coupled with a thorough under standing of their required investor returns and standards of underwriting.

Pension funds, advisors, banks, REITs, and life insurance companies
Syndicates, developers, merchant builders, general partnerships, and professional investors

Foreign investors seeking domestic opportunities and technology enablers that direct foreign demand
1031


Investors seeking acquisition opportunities for capital gains tax deferral

Opportunistic investors seeking diversification in other real estate property types
Private, individual investors who account for the majority of transactions in the marketplace
days
ProActive In-Person Meetings
Direct Phone Calls & Emails
Strategic Property
E-Campaigns
Distribution of offering Materials
On-site Property Tours

Weekly Seller Updates
Offering Procurement
Field Initial Offers
Best & Final Offering Round
Conduct Buyer Interviews
Select Buyer
Negotiate Contract
Days

COMMERCIAL REAL ESTATE

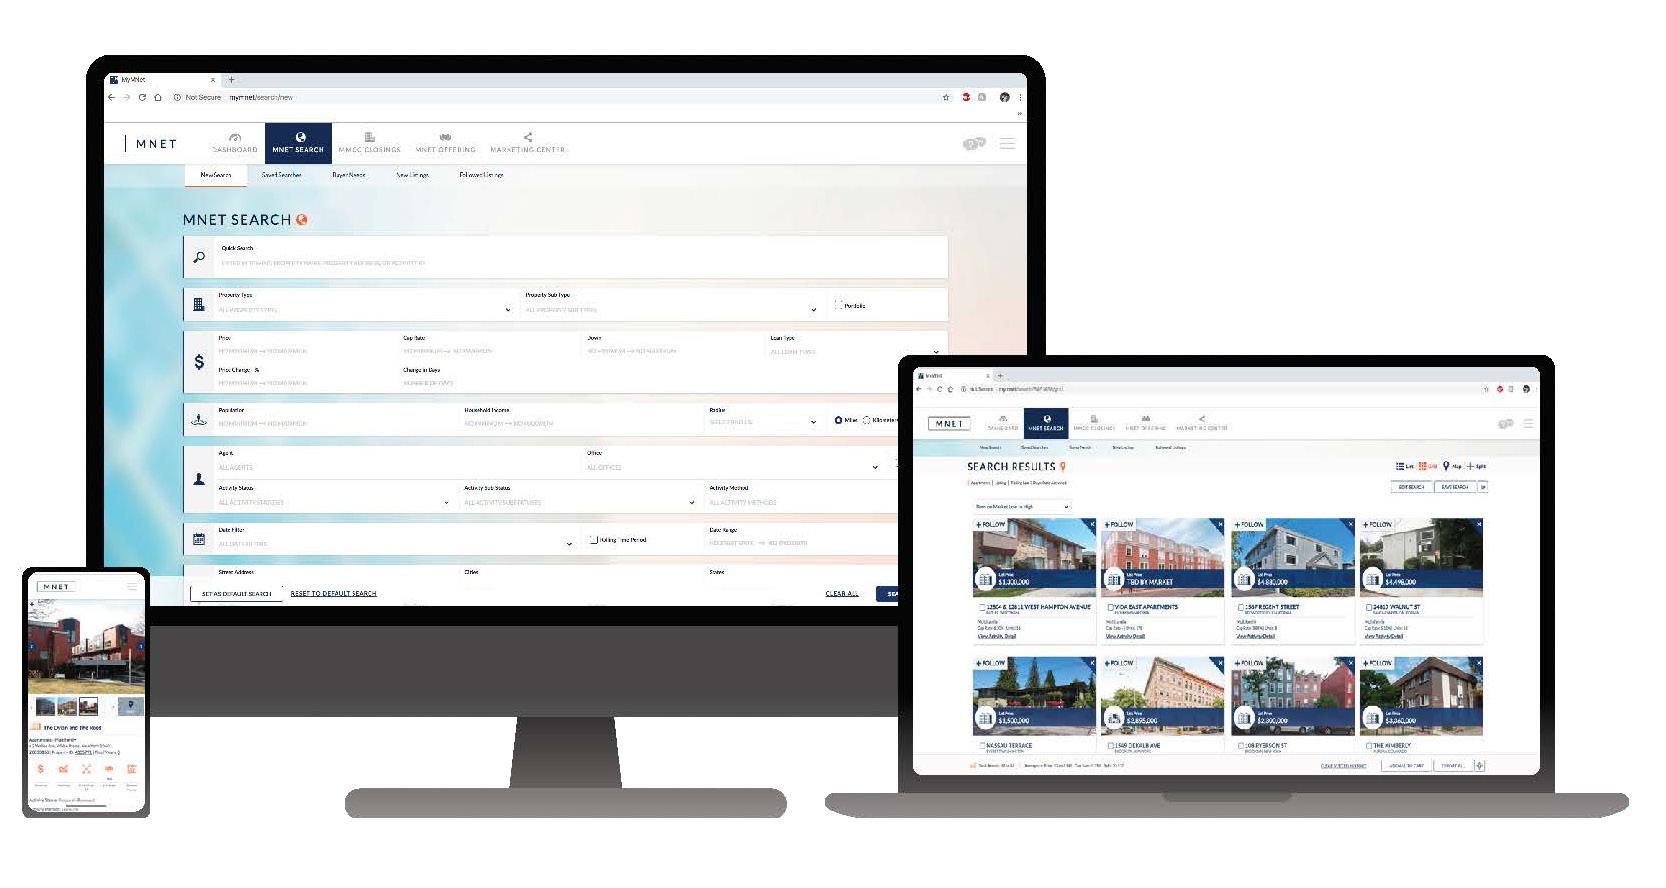
OUR PROPRIETARY TECHNOLOGY PLATFORM, MNET, IS A GAME-CHANGER. NO OTHER FIRM OFFERS ANYTHING LIKE IT OR THE POWERFUL PROPERTY SEARCH TOOLS AND AUTOMATED PROPERTY MATCHING CAPABILITIES IT FEATURES.
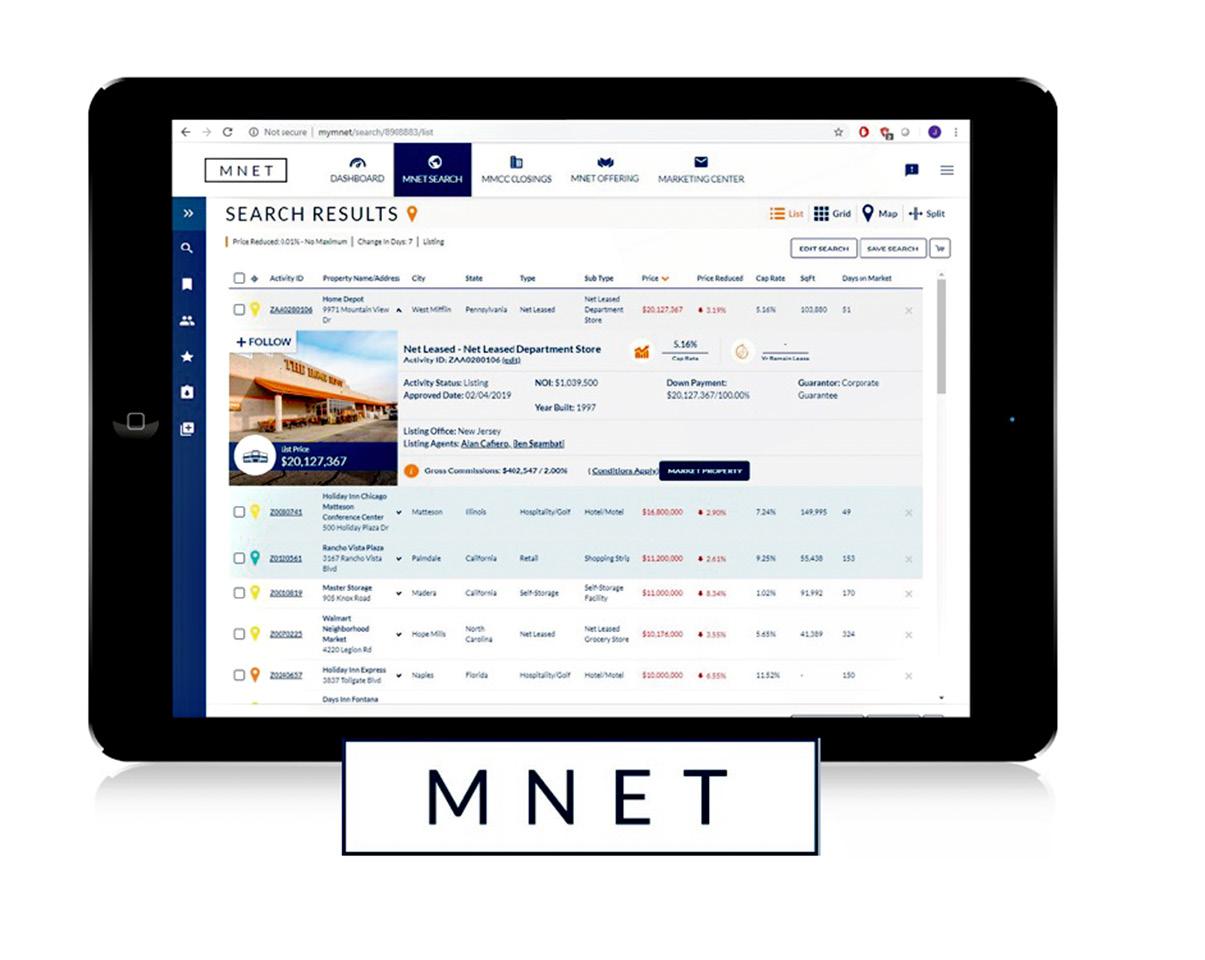
ADVANCE SEARCH CAPABILITIES
$18B +
OF CURRENT INVENTORY
1.2M
SEARCHES ANNUALLY
3,500 +
EXCLUSIVE LISTINGS

Commercial Real Estate Exchange, Inc. (CREXI) is the commercial real estate industry’s fastest-growing marketplace, advanced technology and data platform dedicated to sup porting the CRE industry and its stakeholders. Crexi enables commercial real estate pro fessionals to quickly streamline, manage, grow their businesses, and ultimately close deals faster. Since launching in 2015, Crexi has quickly become the most active market place in the industry. With millions of users, the platform has helped buyers, tenants and brokers transact and lease on over 500,000 commercial listings totaling more than $1 trillion in property value.

Real Capital Markets (RCM) is the GLOBE marketplace for buying and selling CRE. RCM increases the speed, exposure, and security of CRE sales through its streamlined online platform. Solu tions include integrated property marketing, trans action management, and business intelligence tools to unify broker-level and firm-level data and work flows.


The main advantage of digital marketing is that a targeted audience can be reached in a cost-effective and measurable way. Over the course of the past several years, our team has managed to collect over twenty thousand emails of potential investors, in a variety of states across the US. This database allows us to tailor future investment opportunity to each investor, and their desired goal. Not only does this database allow us to personalize emails, but it also allows us to measure the results of our out reach.
EMAILS SENT THIS CURRENT MONTH
EMAIL OPENS OVER 60K IN OUR MAILING LIST OVER 20K
INDUSTRY AVERAGE
OPEN RATE: 29.97%
CLICK RATE: .75%
ADG OPEN RATE
34%
ADG CLICK RATE
1.5% OVER 1.2K CLICK THROUGH
“Email has an ability many channels don’t: creating valuable personal touches - at scale.”
Social media helps us engage with our potential clients and find out what is being said about our business. We also use social media for advertising, attracting clients, get client feedback, build better customer loyalty, increase our market reach, develop our brand etc. Social media is a great tool to use in our industry, especially for building new relationships and keeping up with the market.

ADG IS ON
6


OVER 1K NEW RELATIONSHIPS MADE
MONTHLY IMPRESSIONS ON ISSUU
OVER 1.2K
OVER 3K IMPRESSIONS ON LINKEDIN
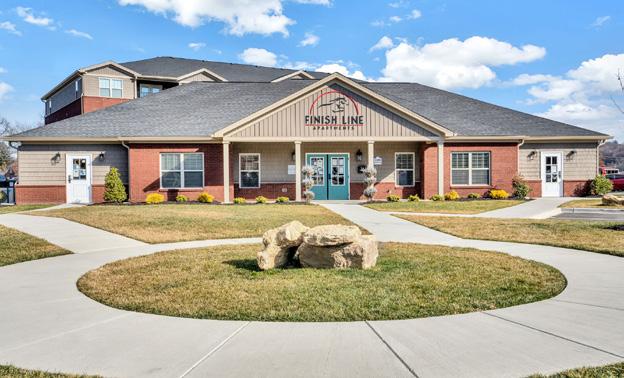
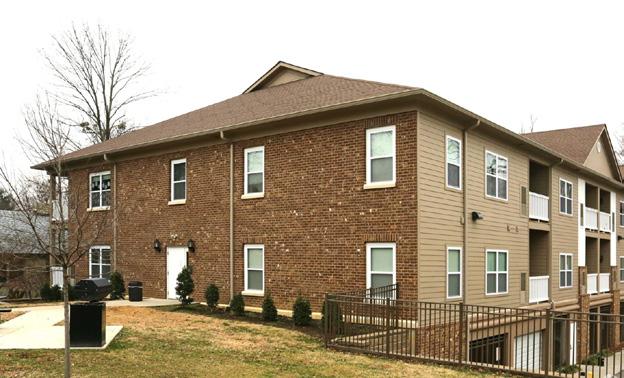
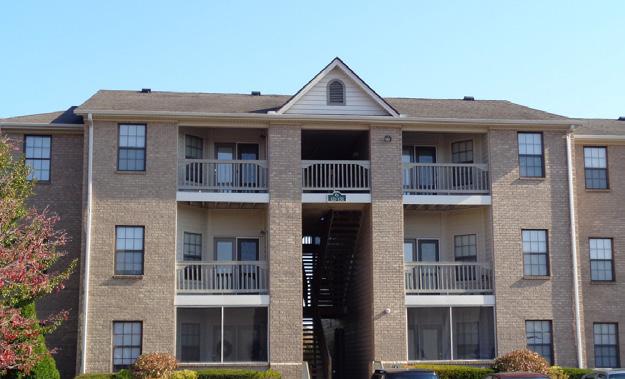
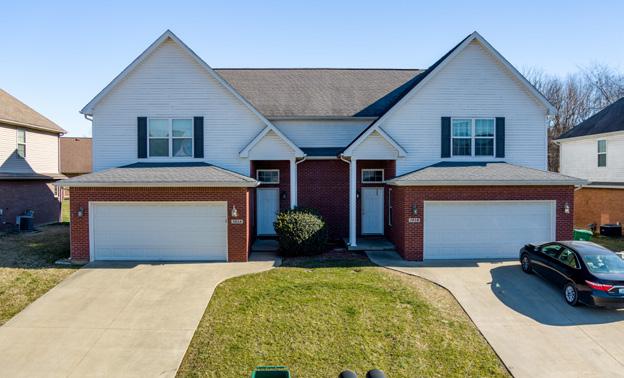
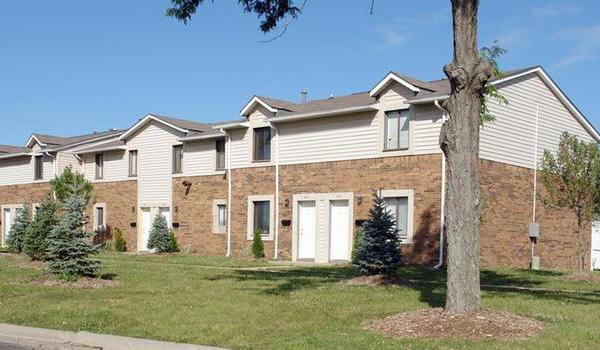
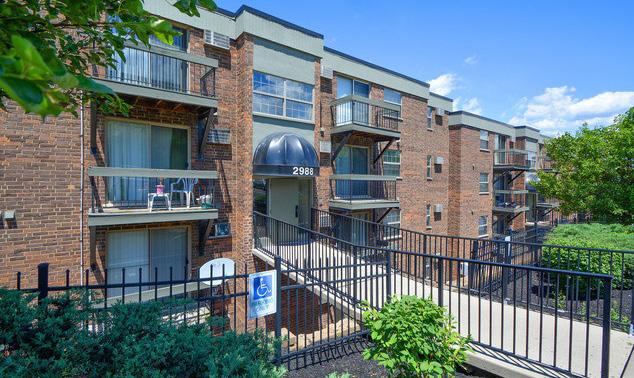
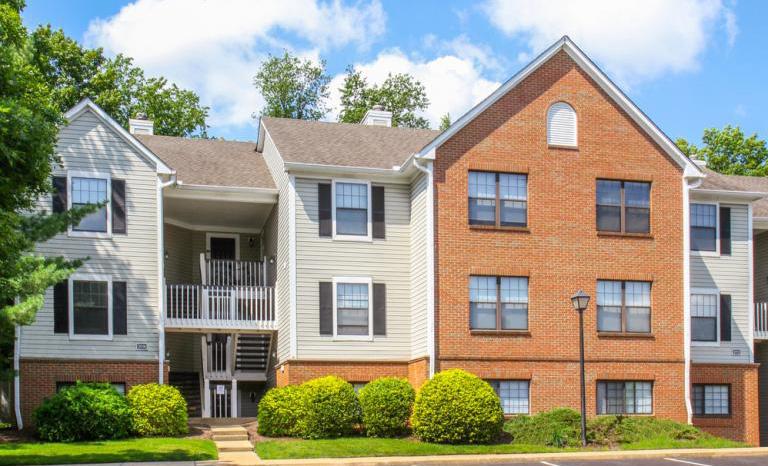
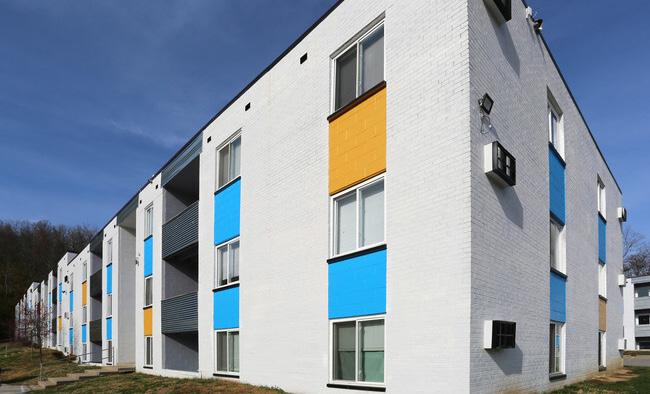
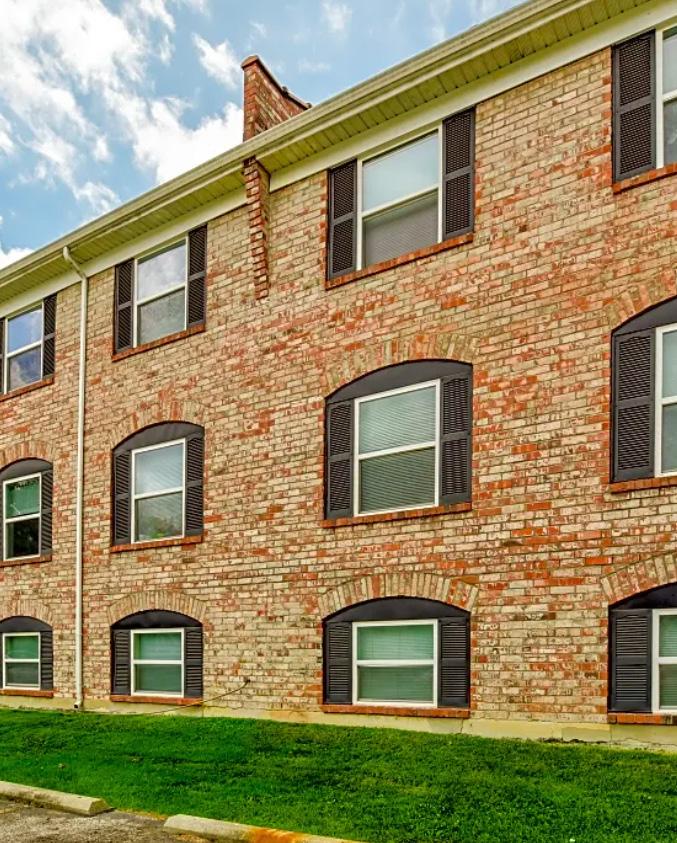
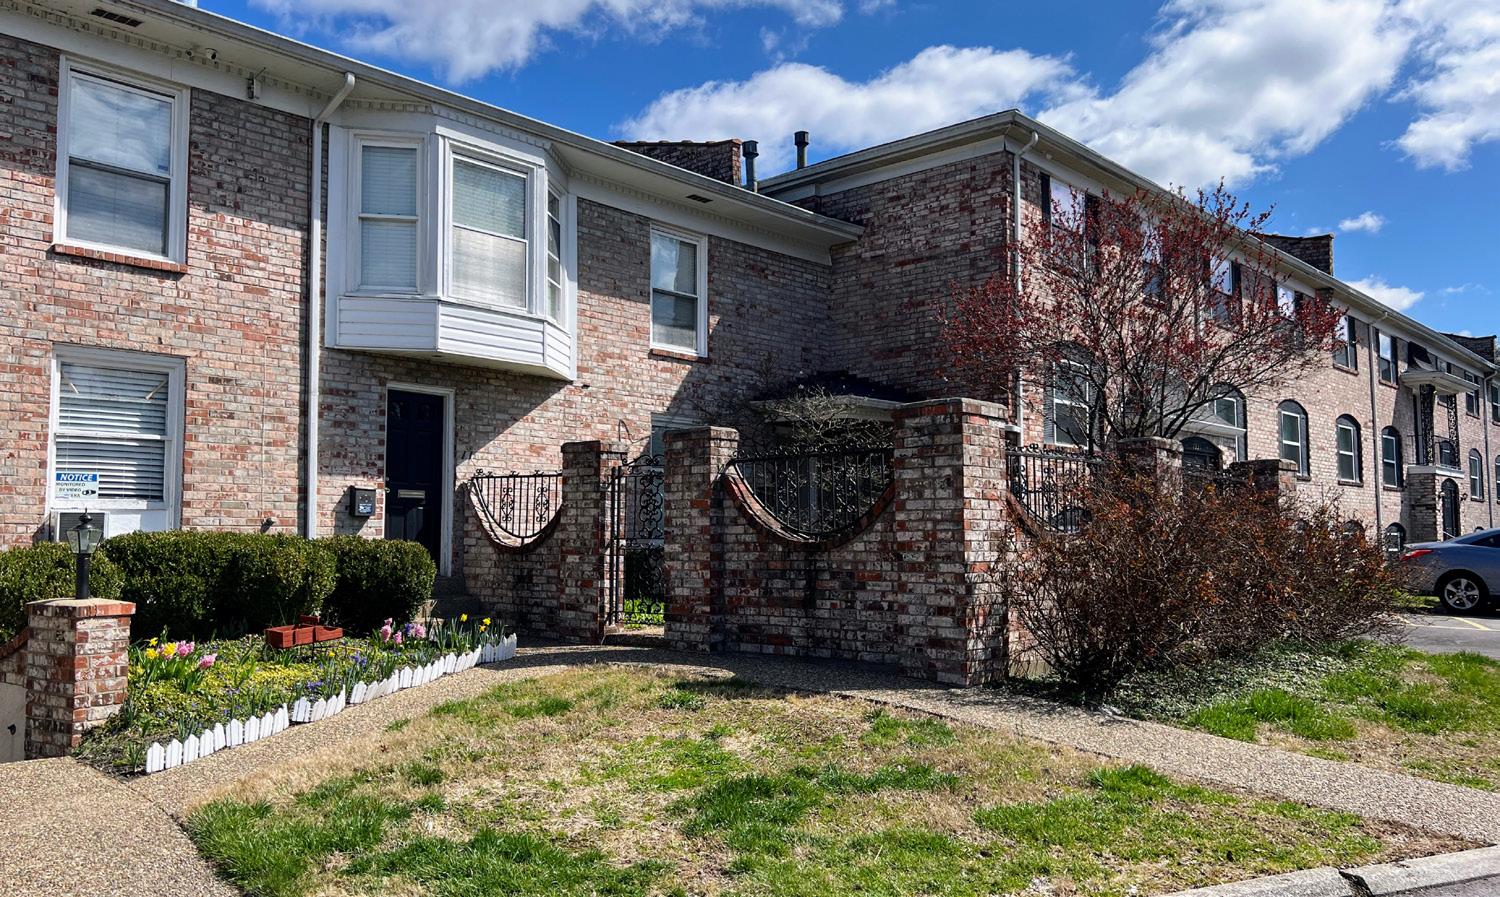
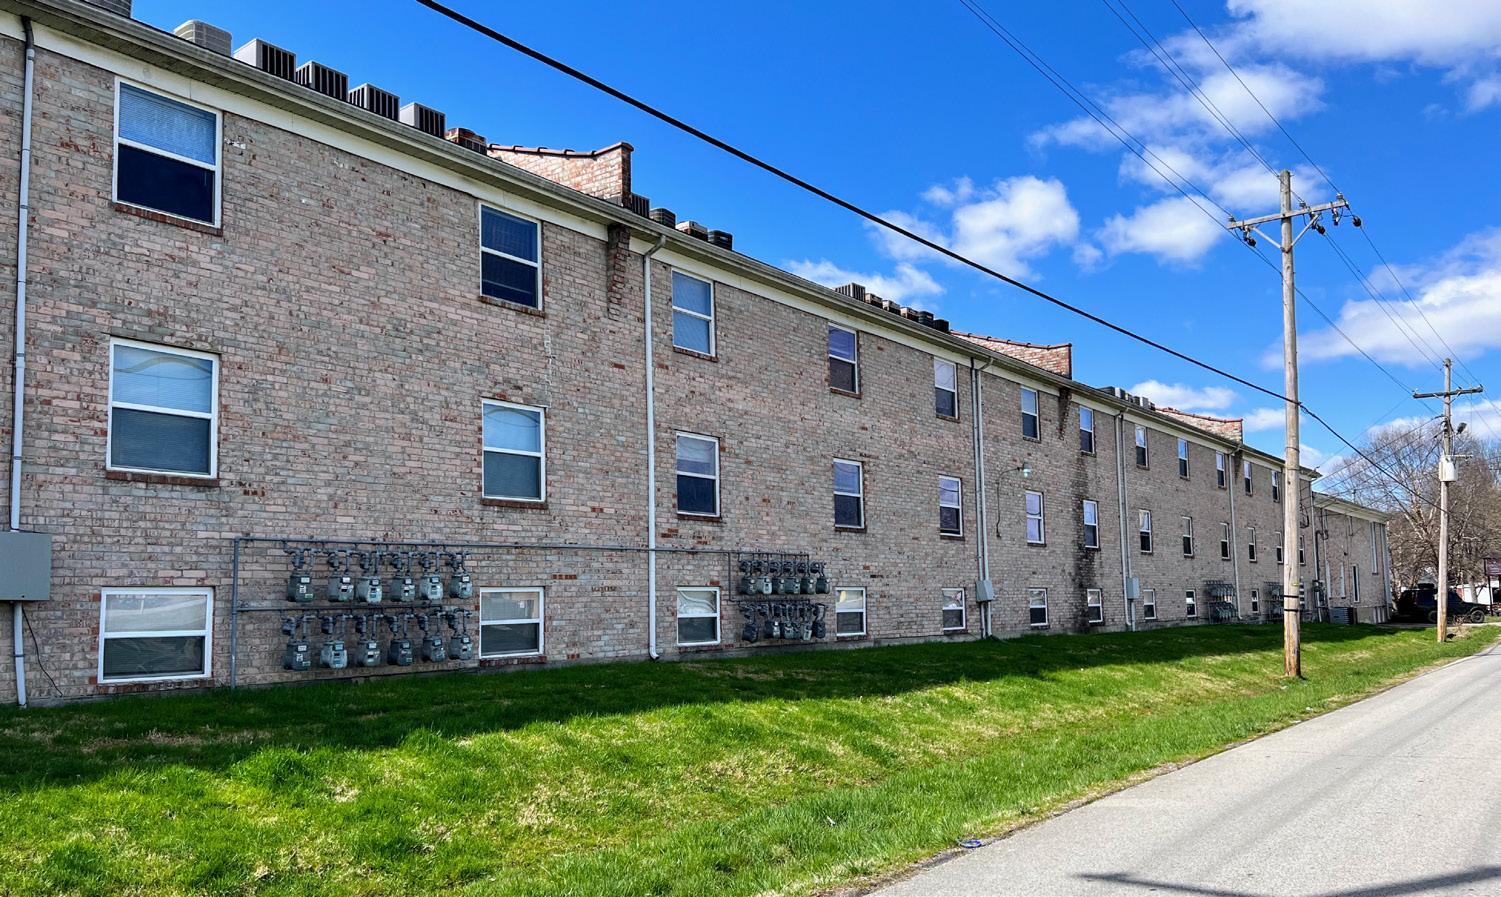
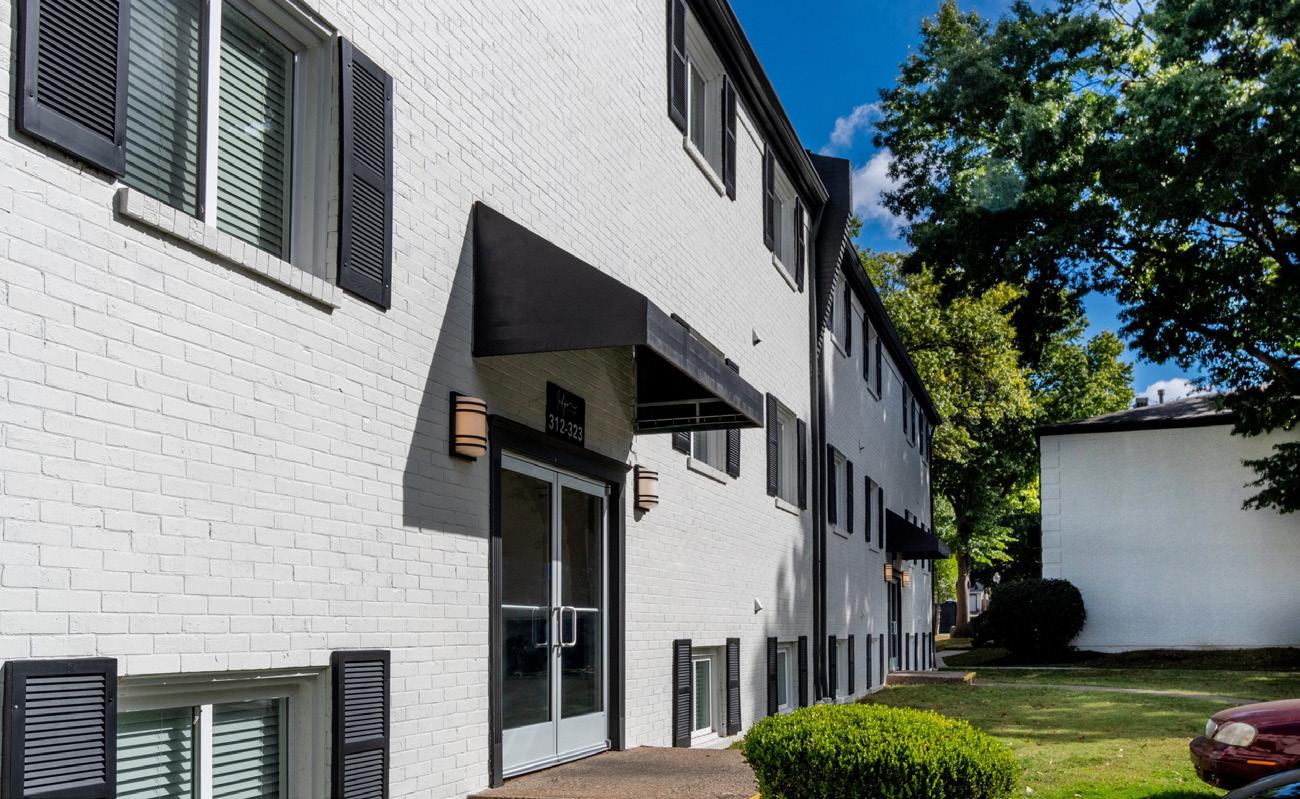
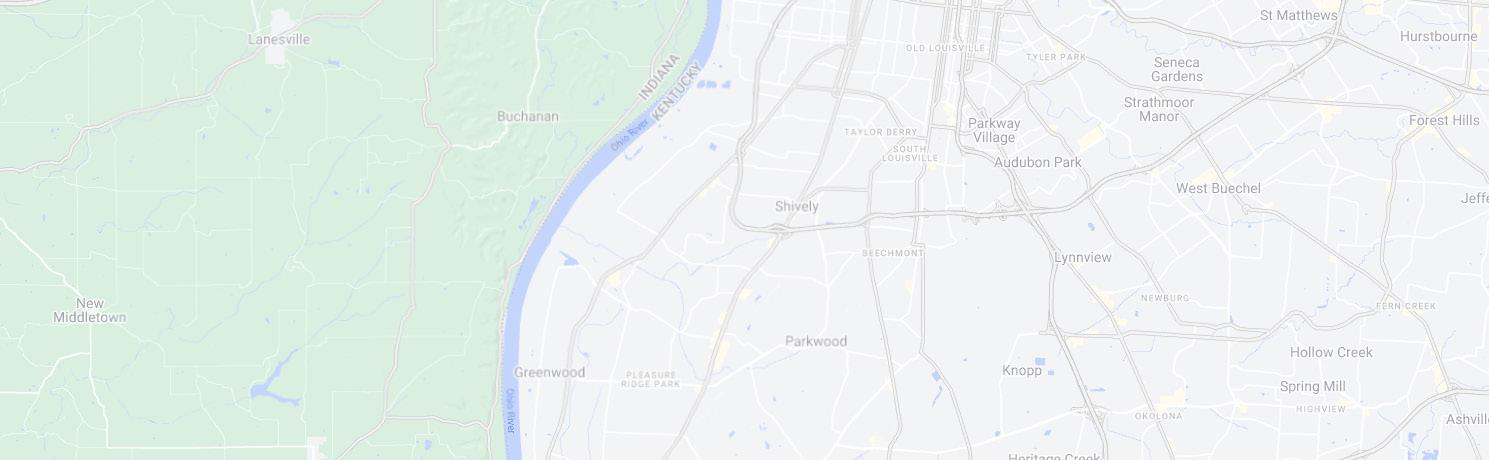
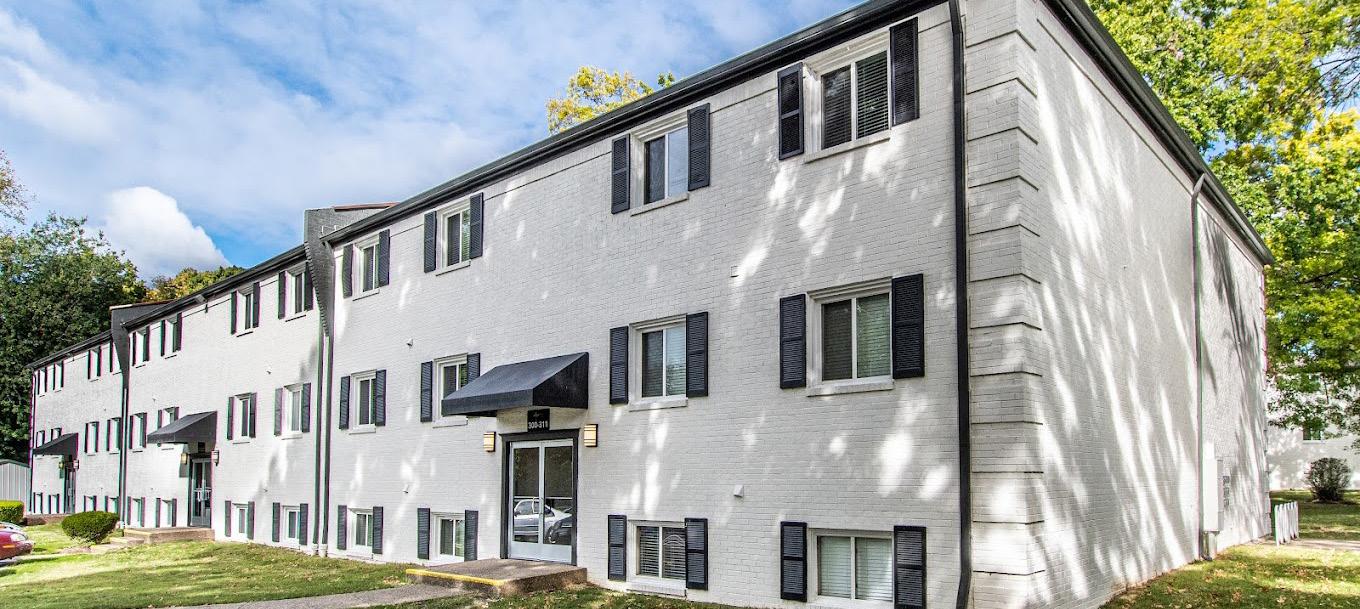
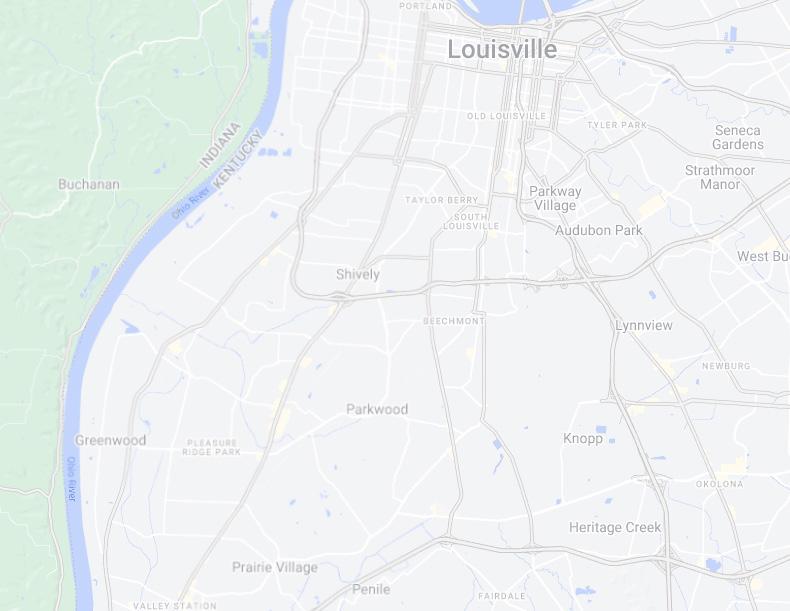
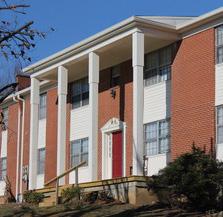
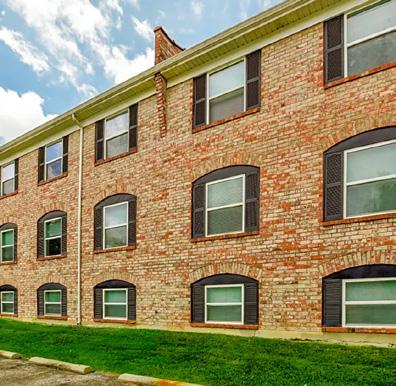
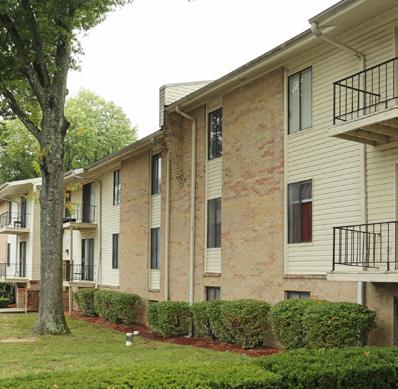
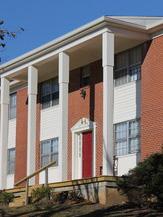
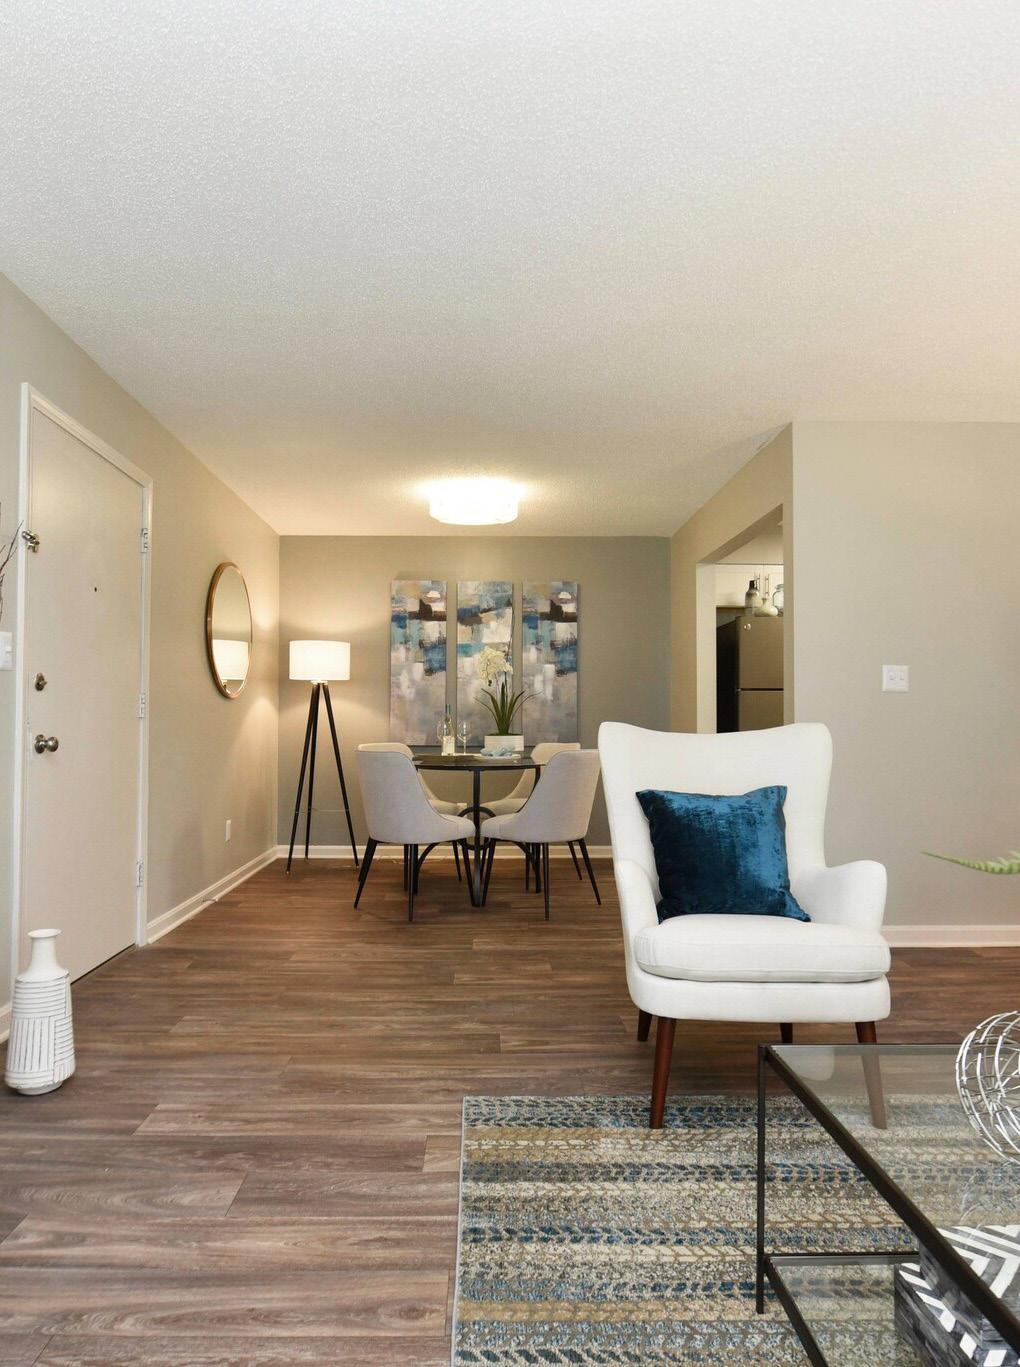
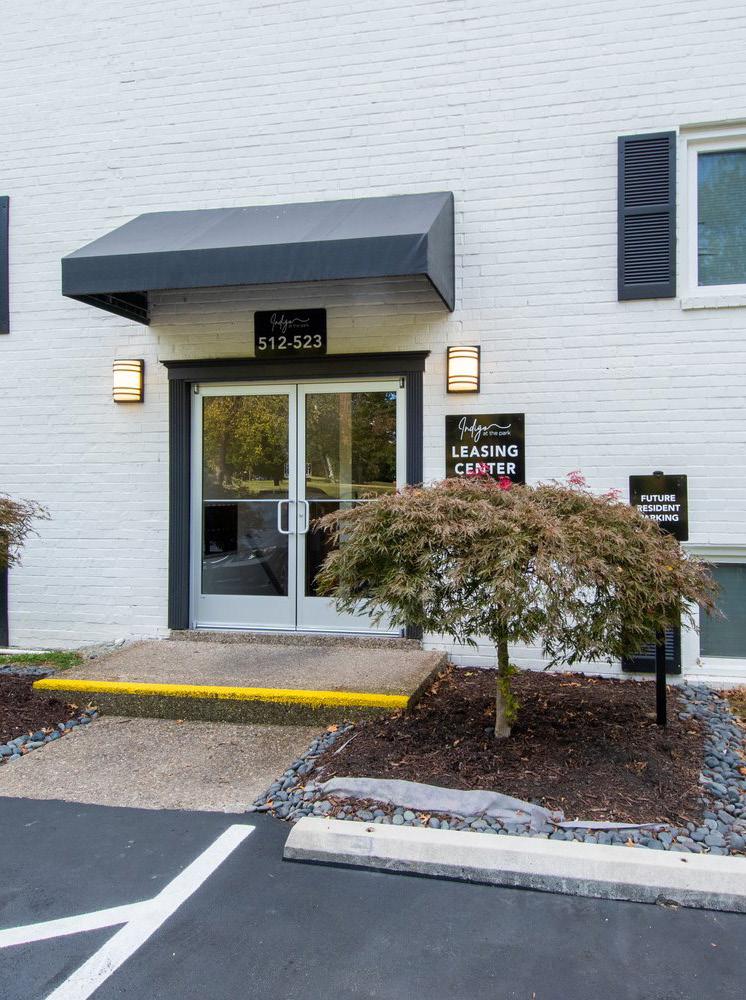
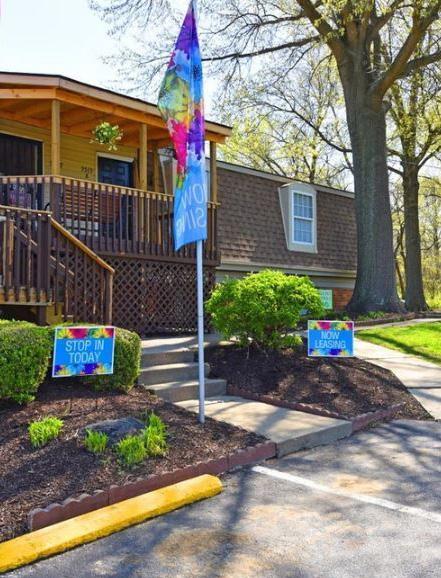
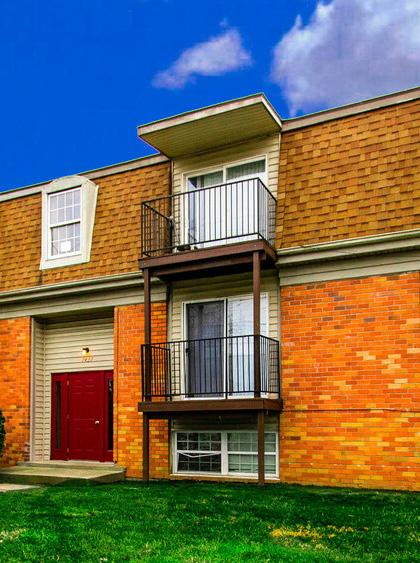
2325 CARDINAL HILL GARDENS, LOUISVILLE, KY
Original Ownership of 50+ Years
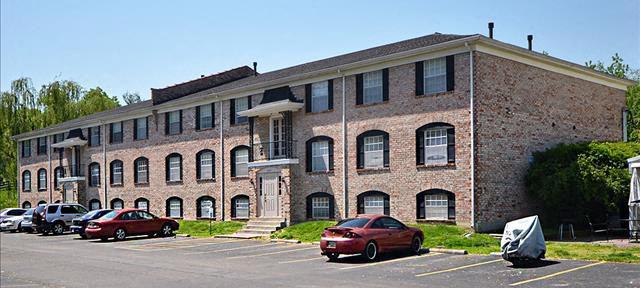
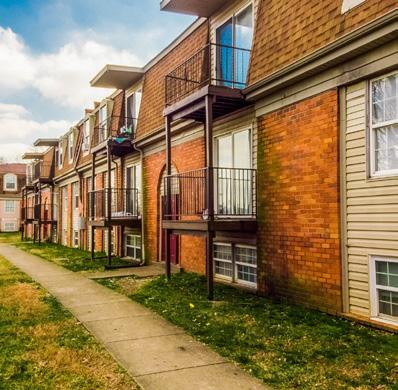
Meticulously Maintained Asset
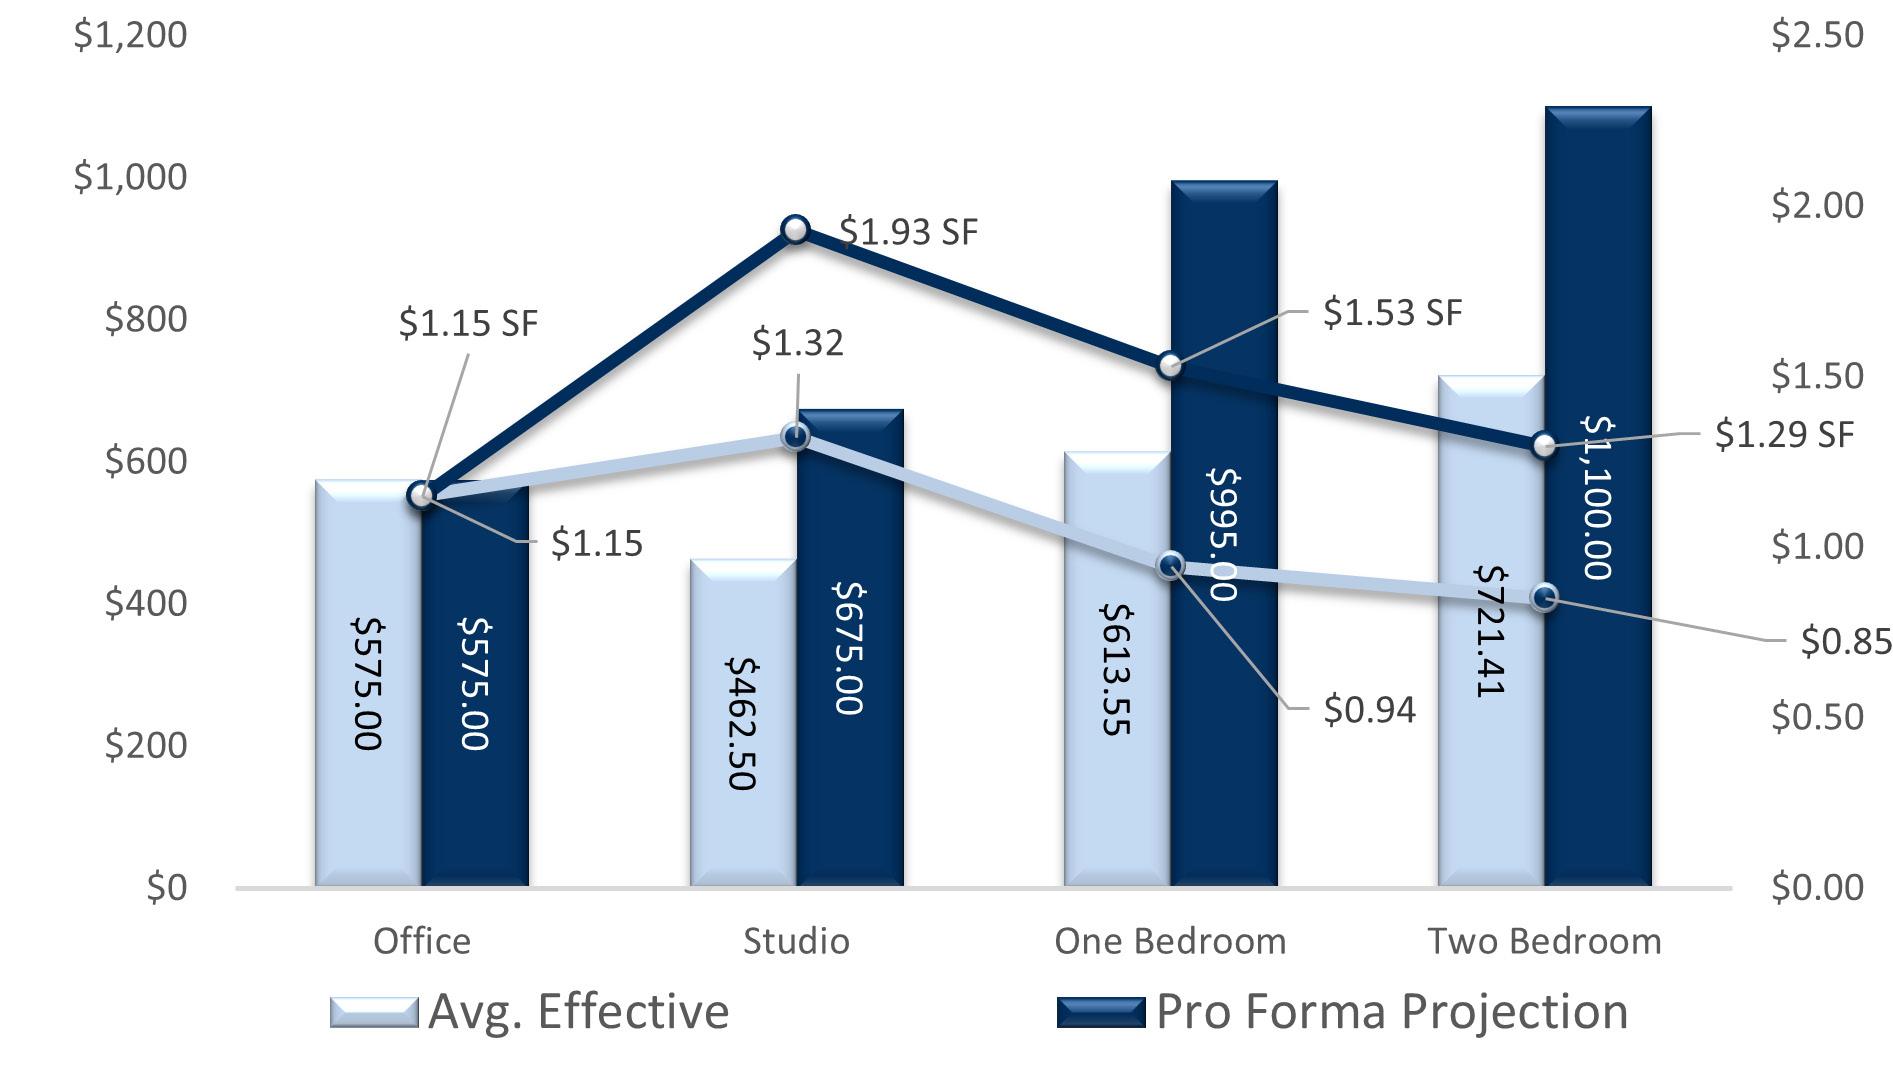
Rents Significantly Below Market Average
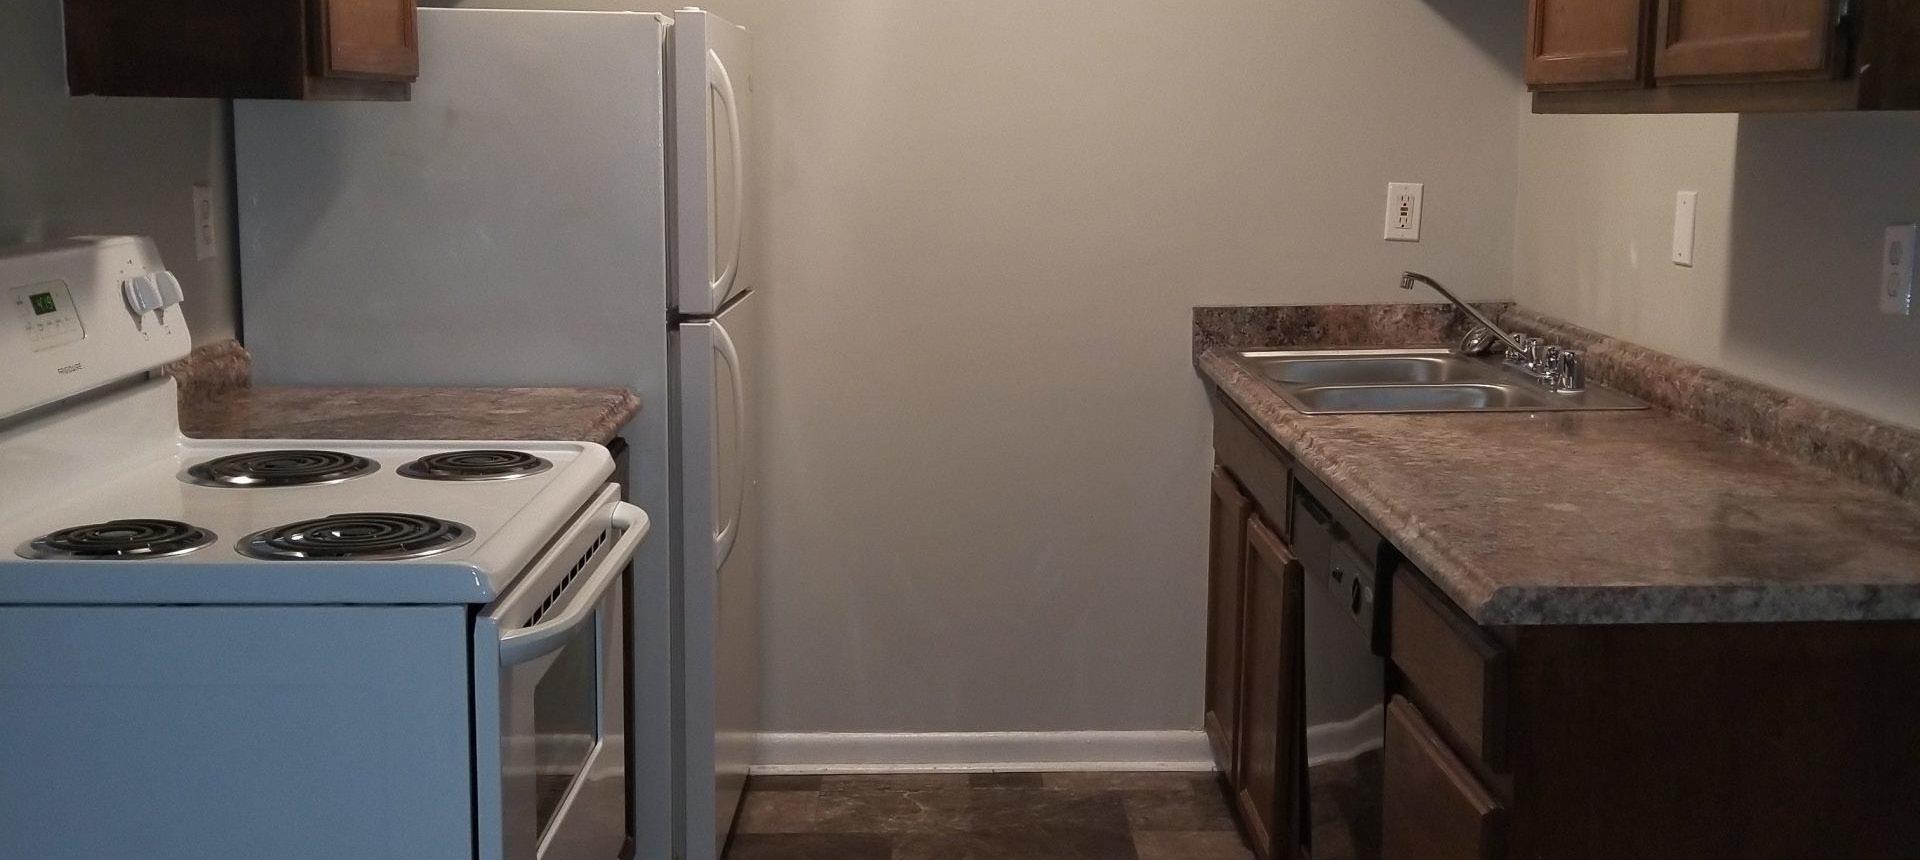
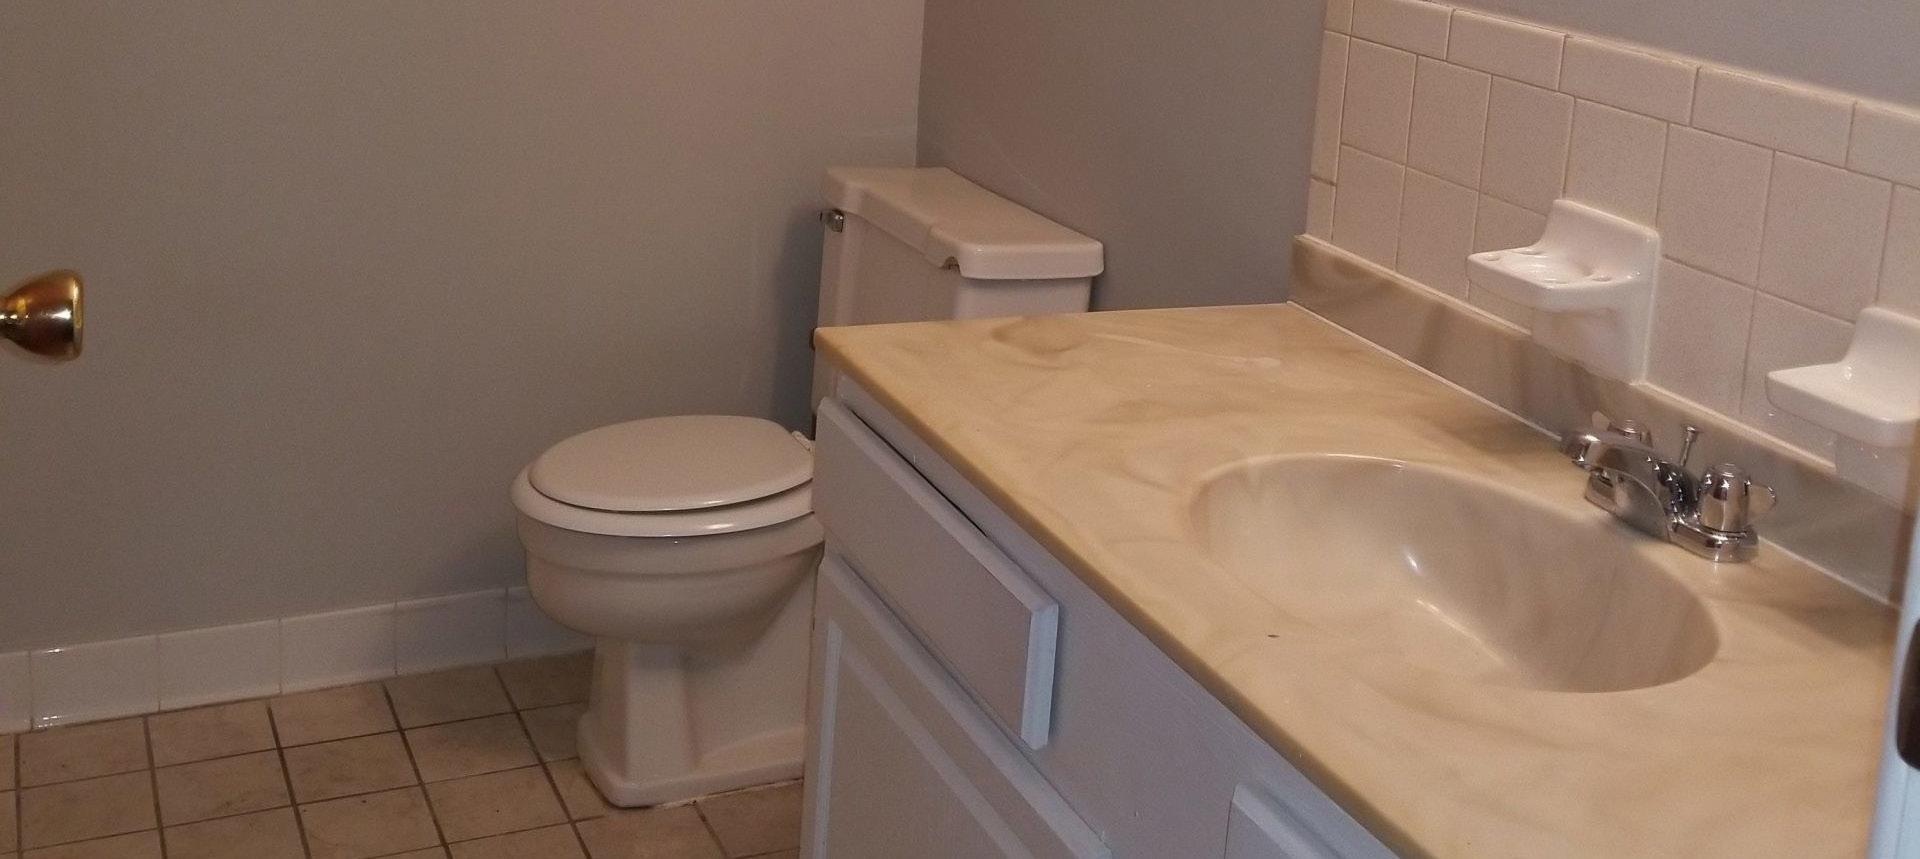
Proposed Interior Renovations for Significant Upside
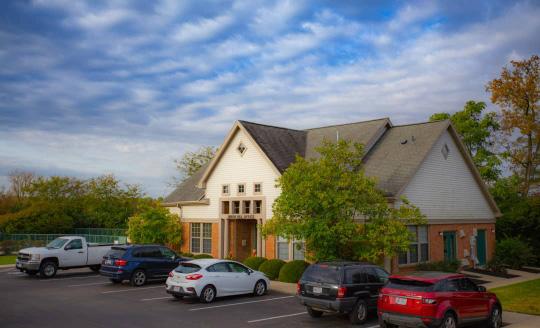
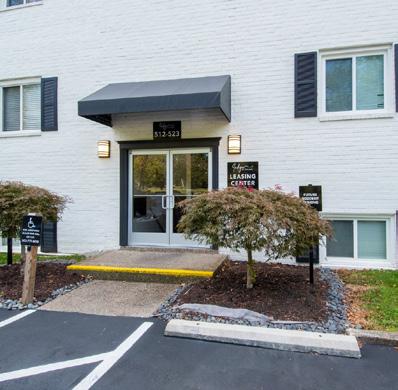
Opportunity for Professional Property Management
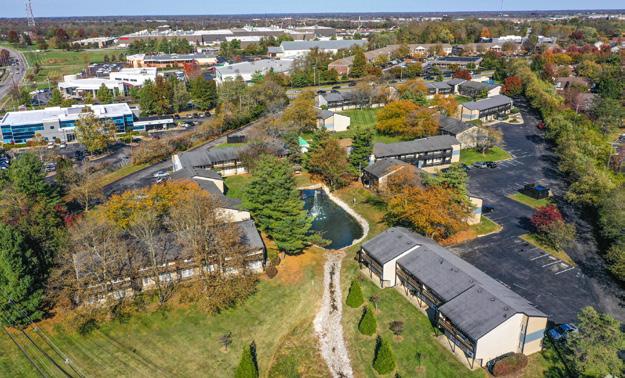
Ideal Location with Top-Notch Employment

Property Address: 7329 Saint Andrews Church Rd
City, State, Zip: Louisville, KY 40214
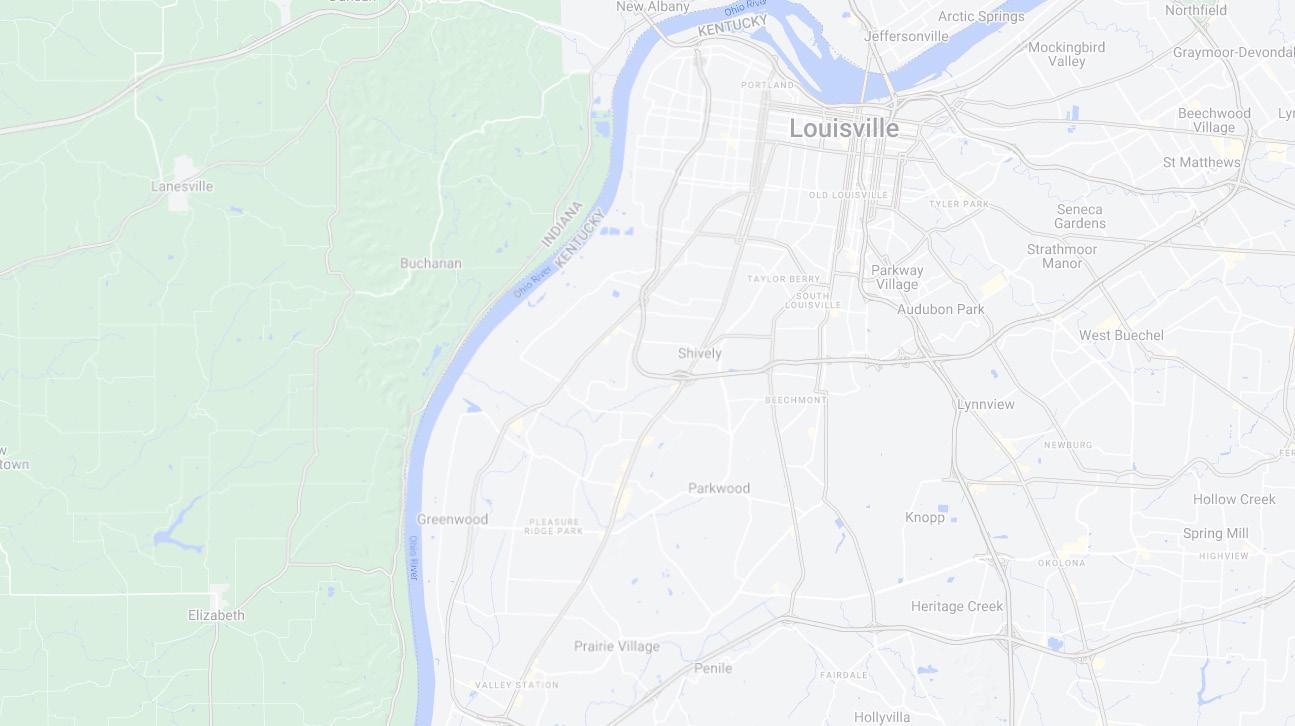
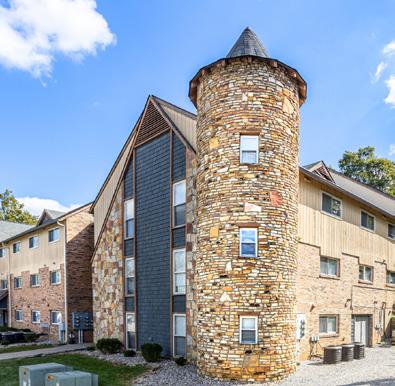
Submarket: South Louisville
County: Jeffersonville
Year Built: 1973
Number Of Units: 134
Avg Unit Size: 764
Rentable Sqft: 40,000
Number of Parcels: 1
Lot Size (Acres): 5.47
# of Buildings: 5
# of Stories: 3
Plumbing: Original
HVAC: Central
Water Heater: Boiler System
Wiring: Copper
CONSTRUCTION:
Foundation: Concrete
Framing: Wood
Roofs: Pitched Shingle
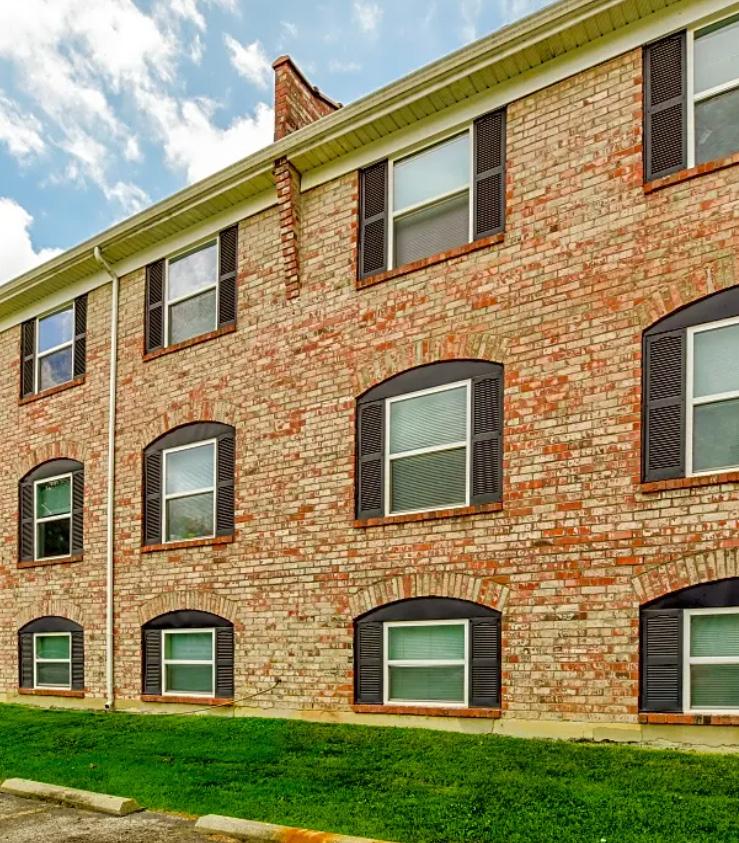
Exterior of Building: Brick
Laundry: Onsite Laundry
utilities
Electric: Tenant Paid
Gas: Tenant Paid
Water Owner Paid
Sewer Owner Paid
Trash: Owner Paid
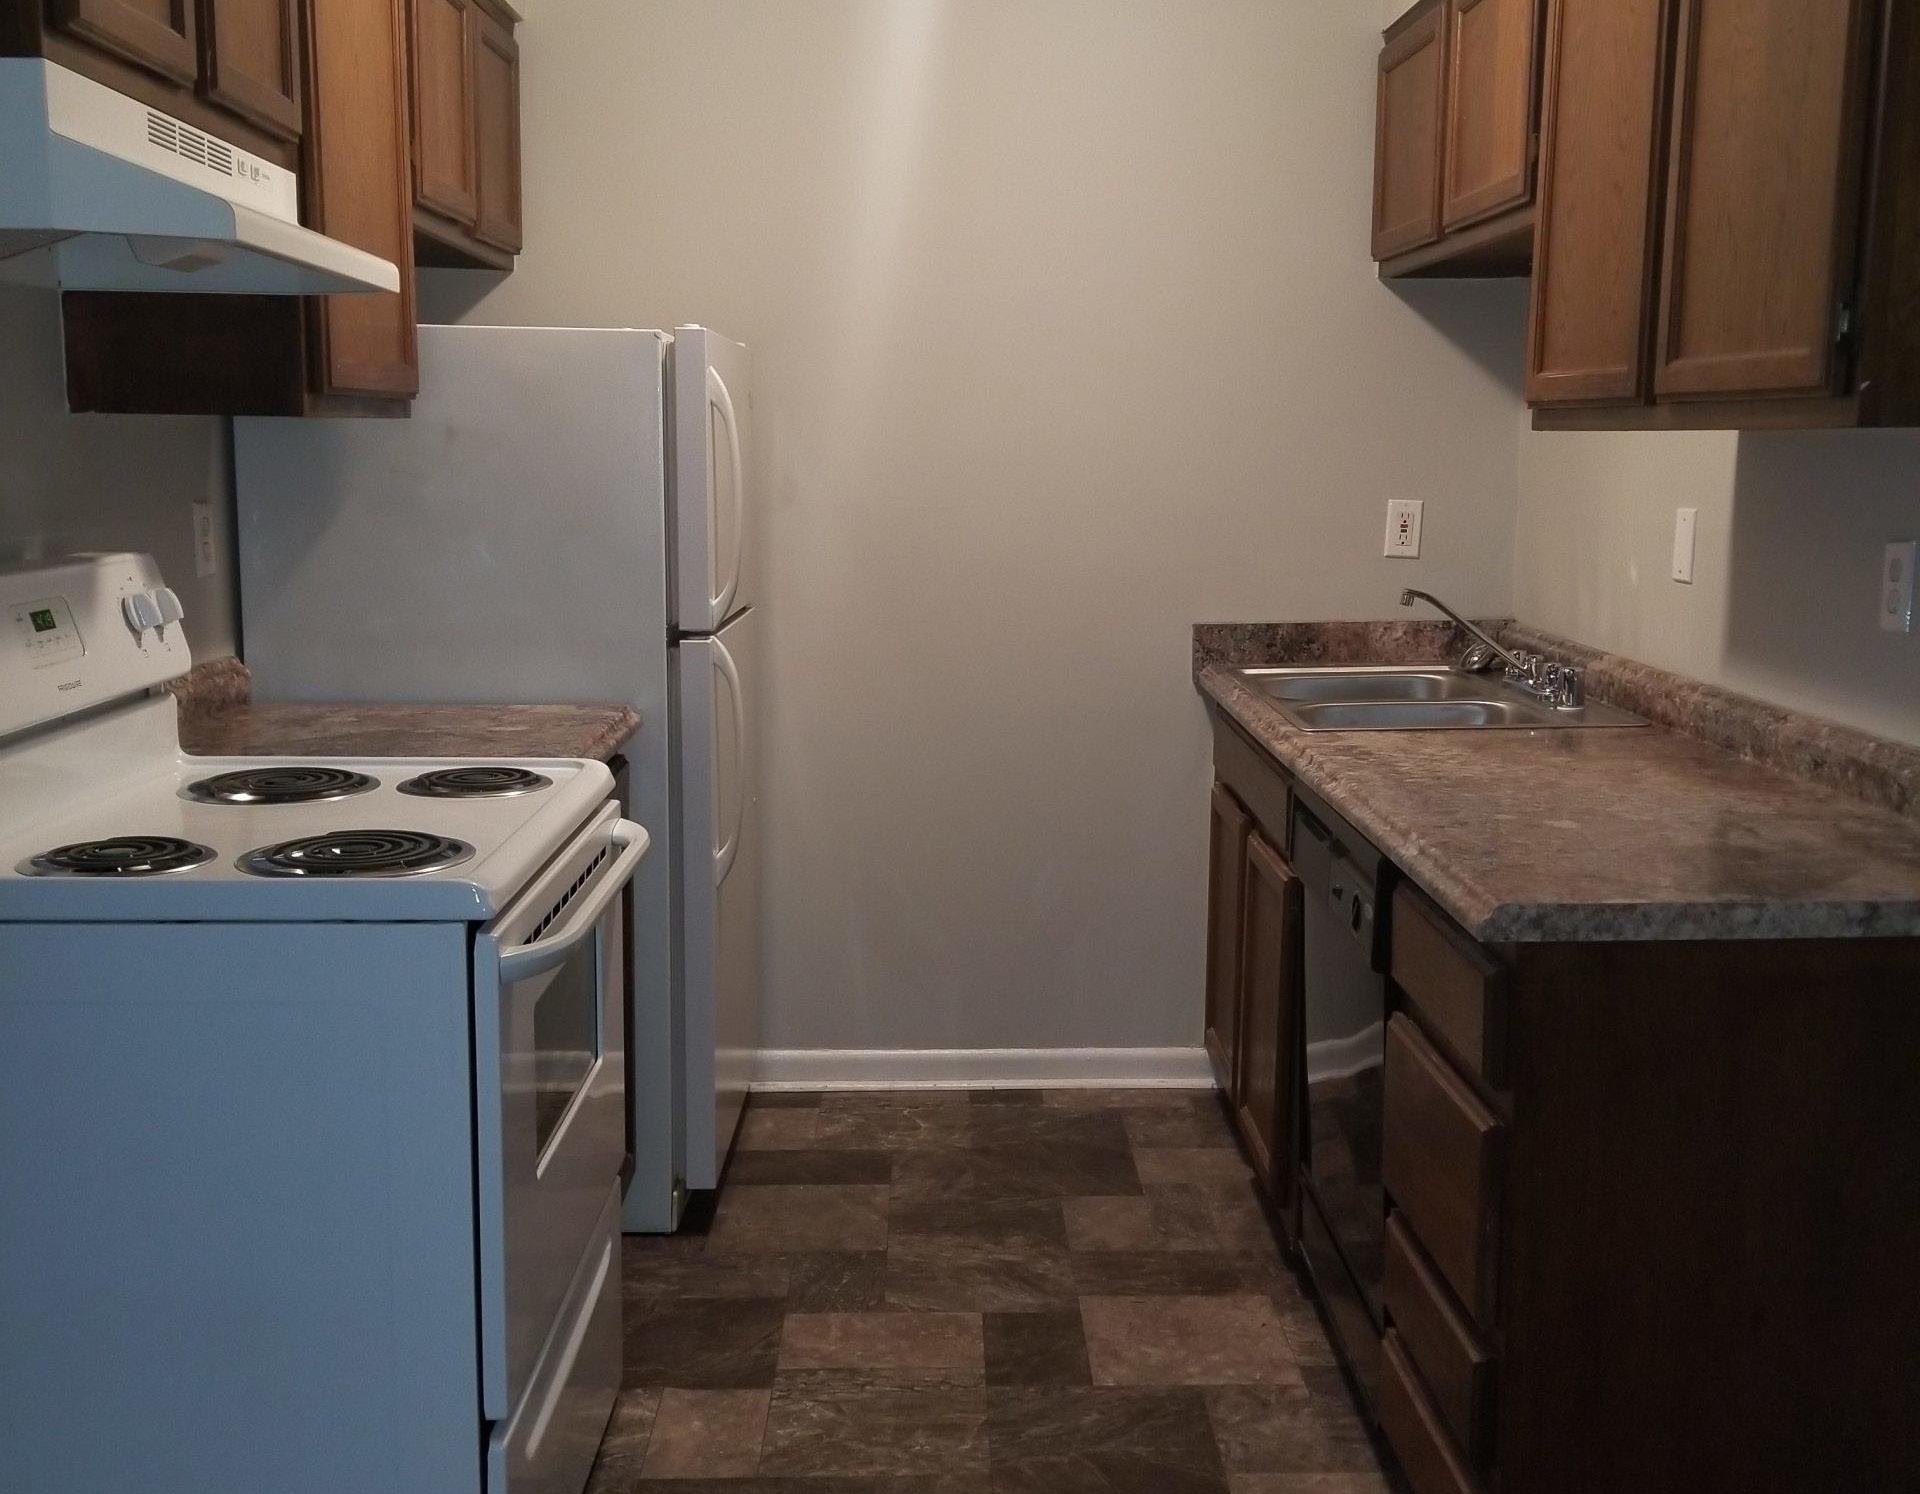
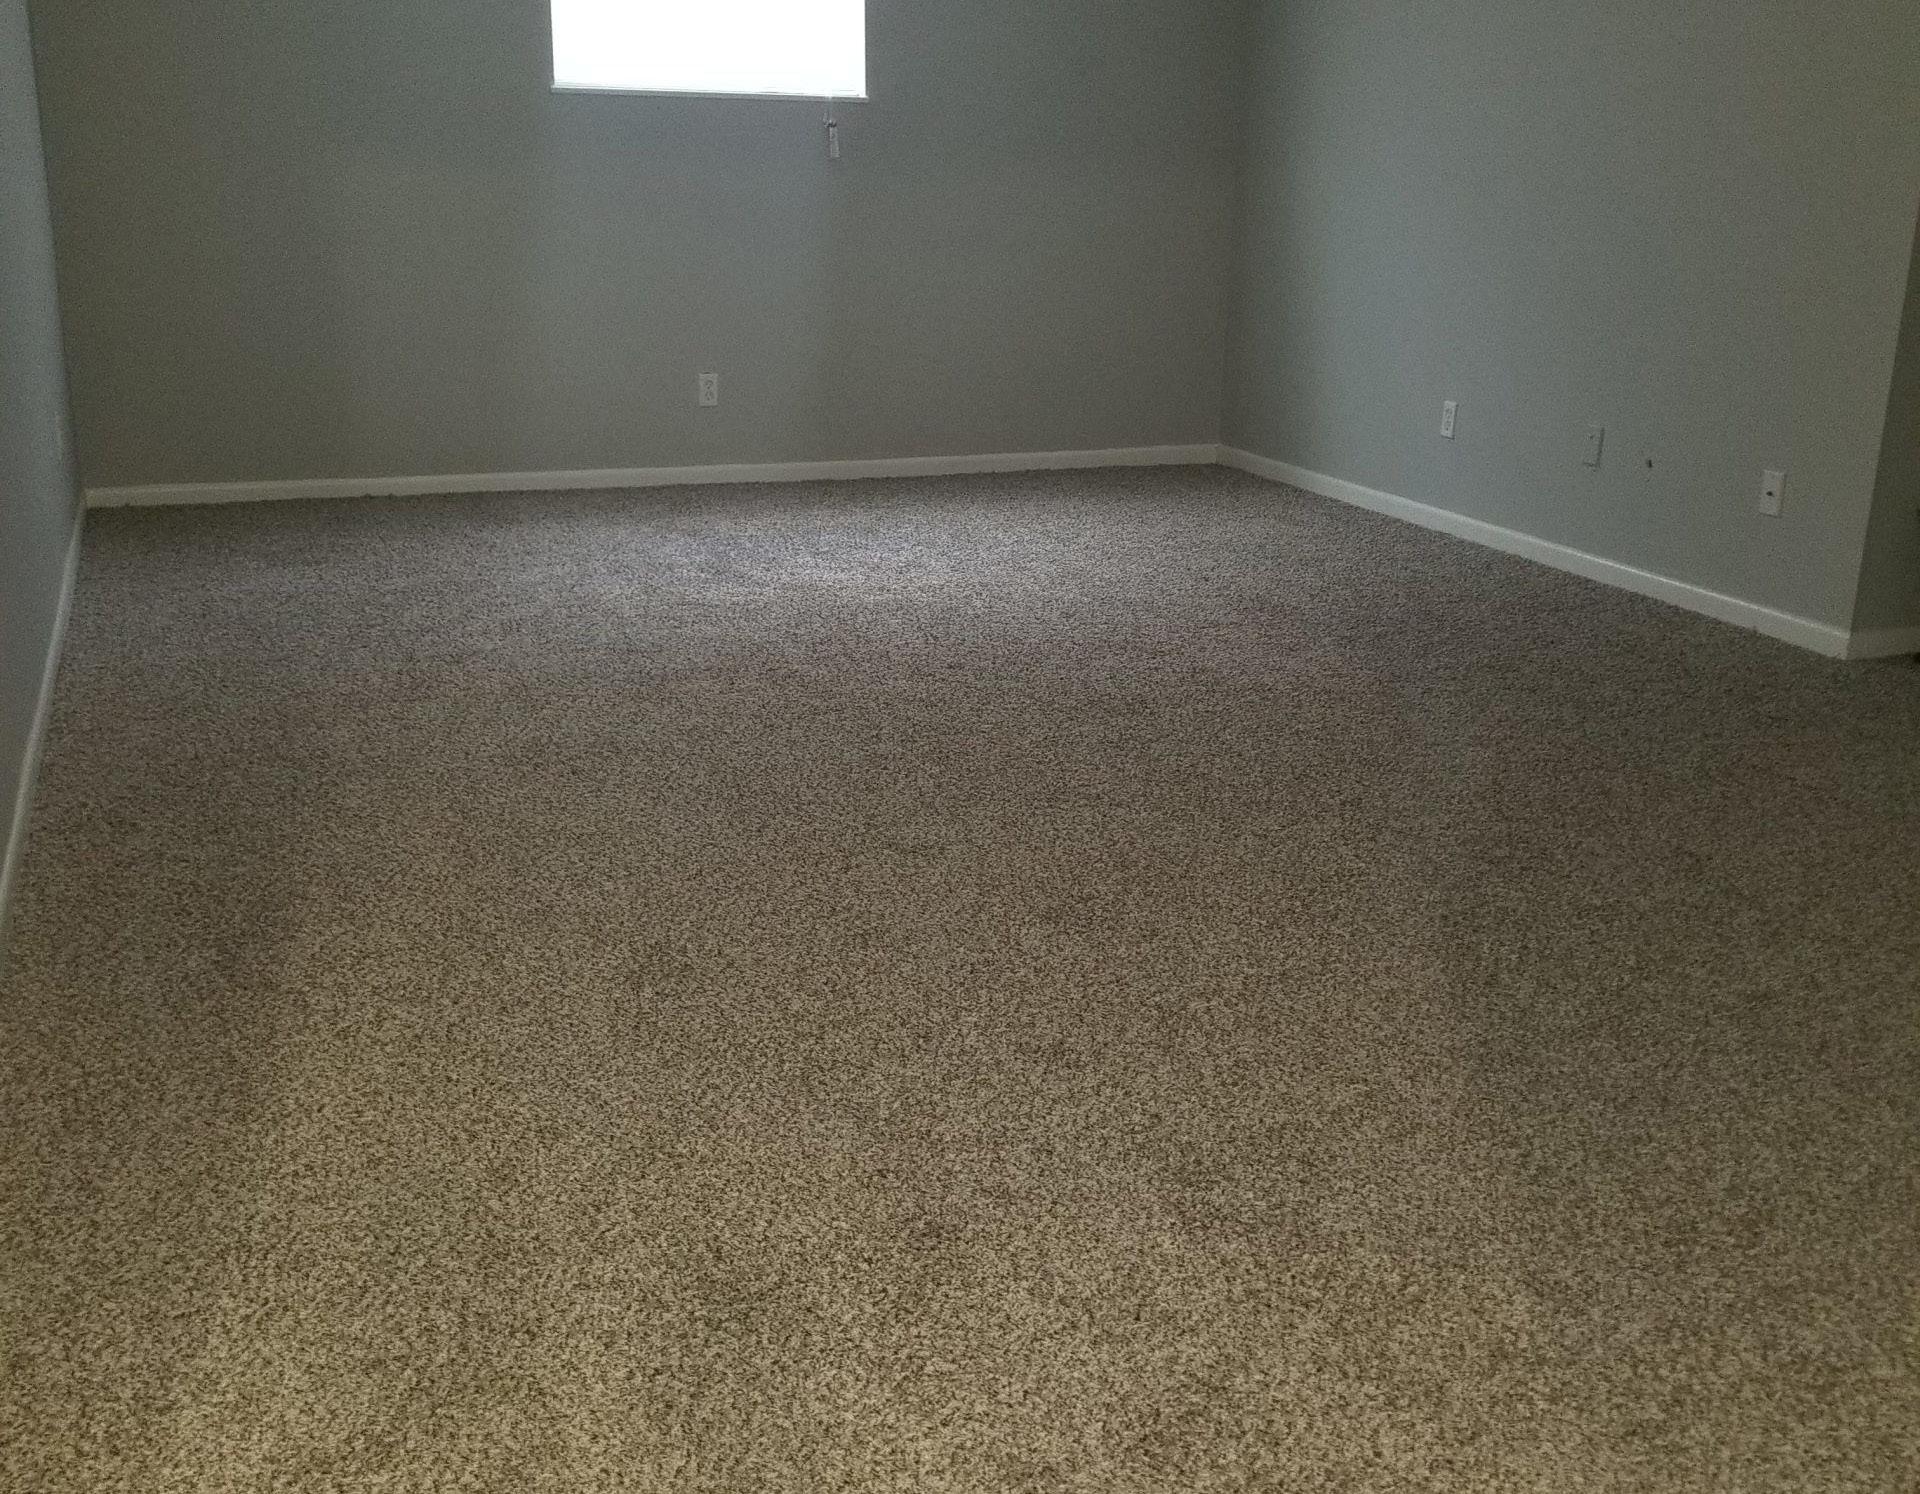
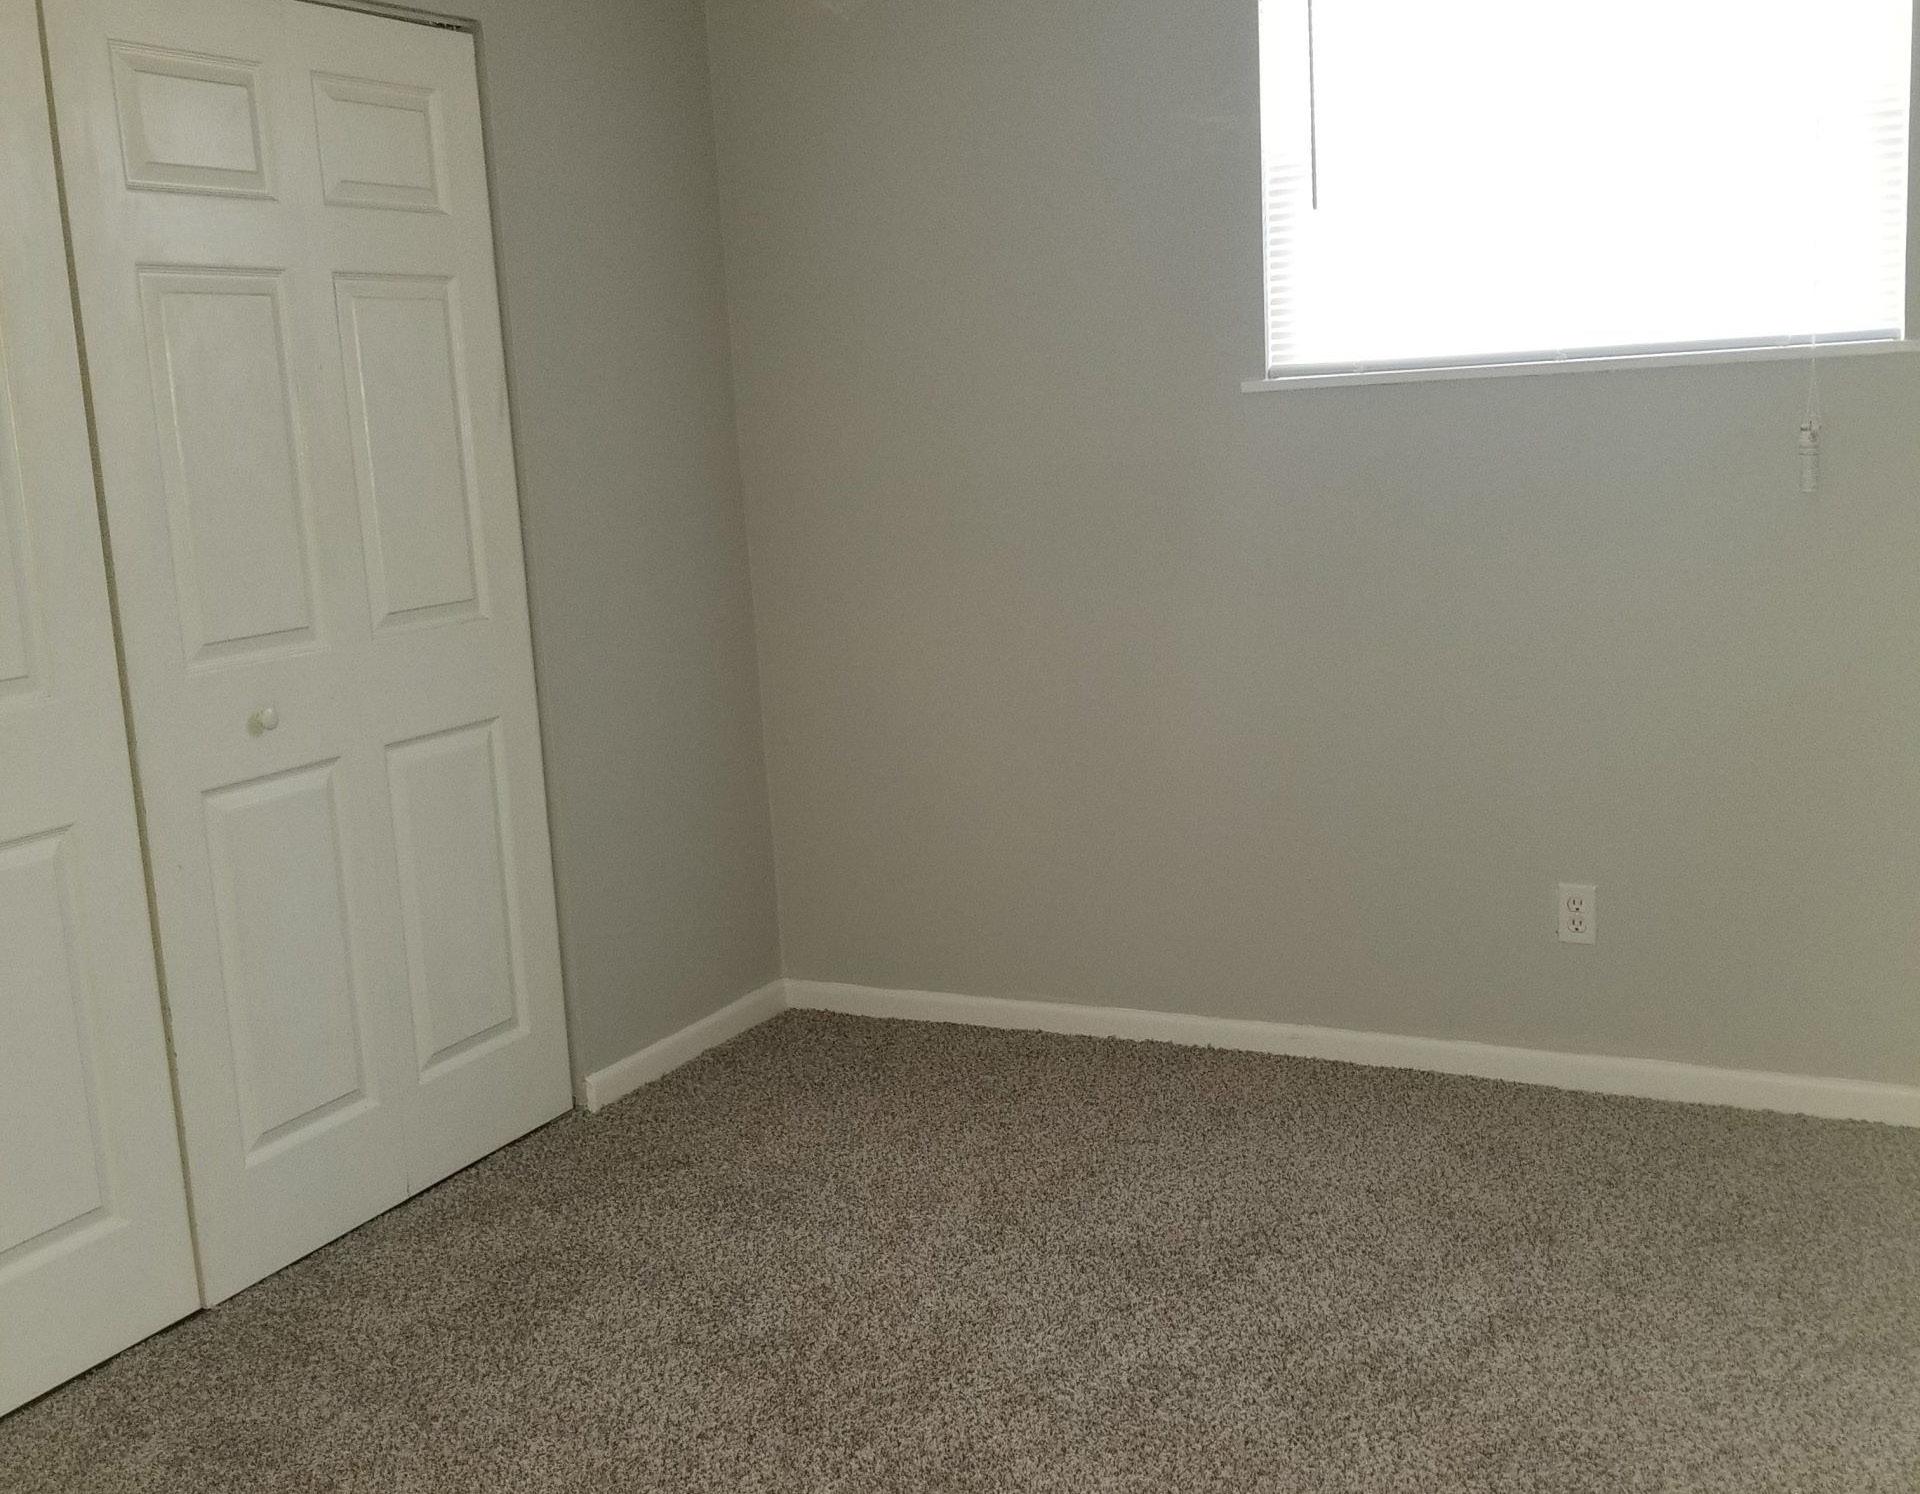
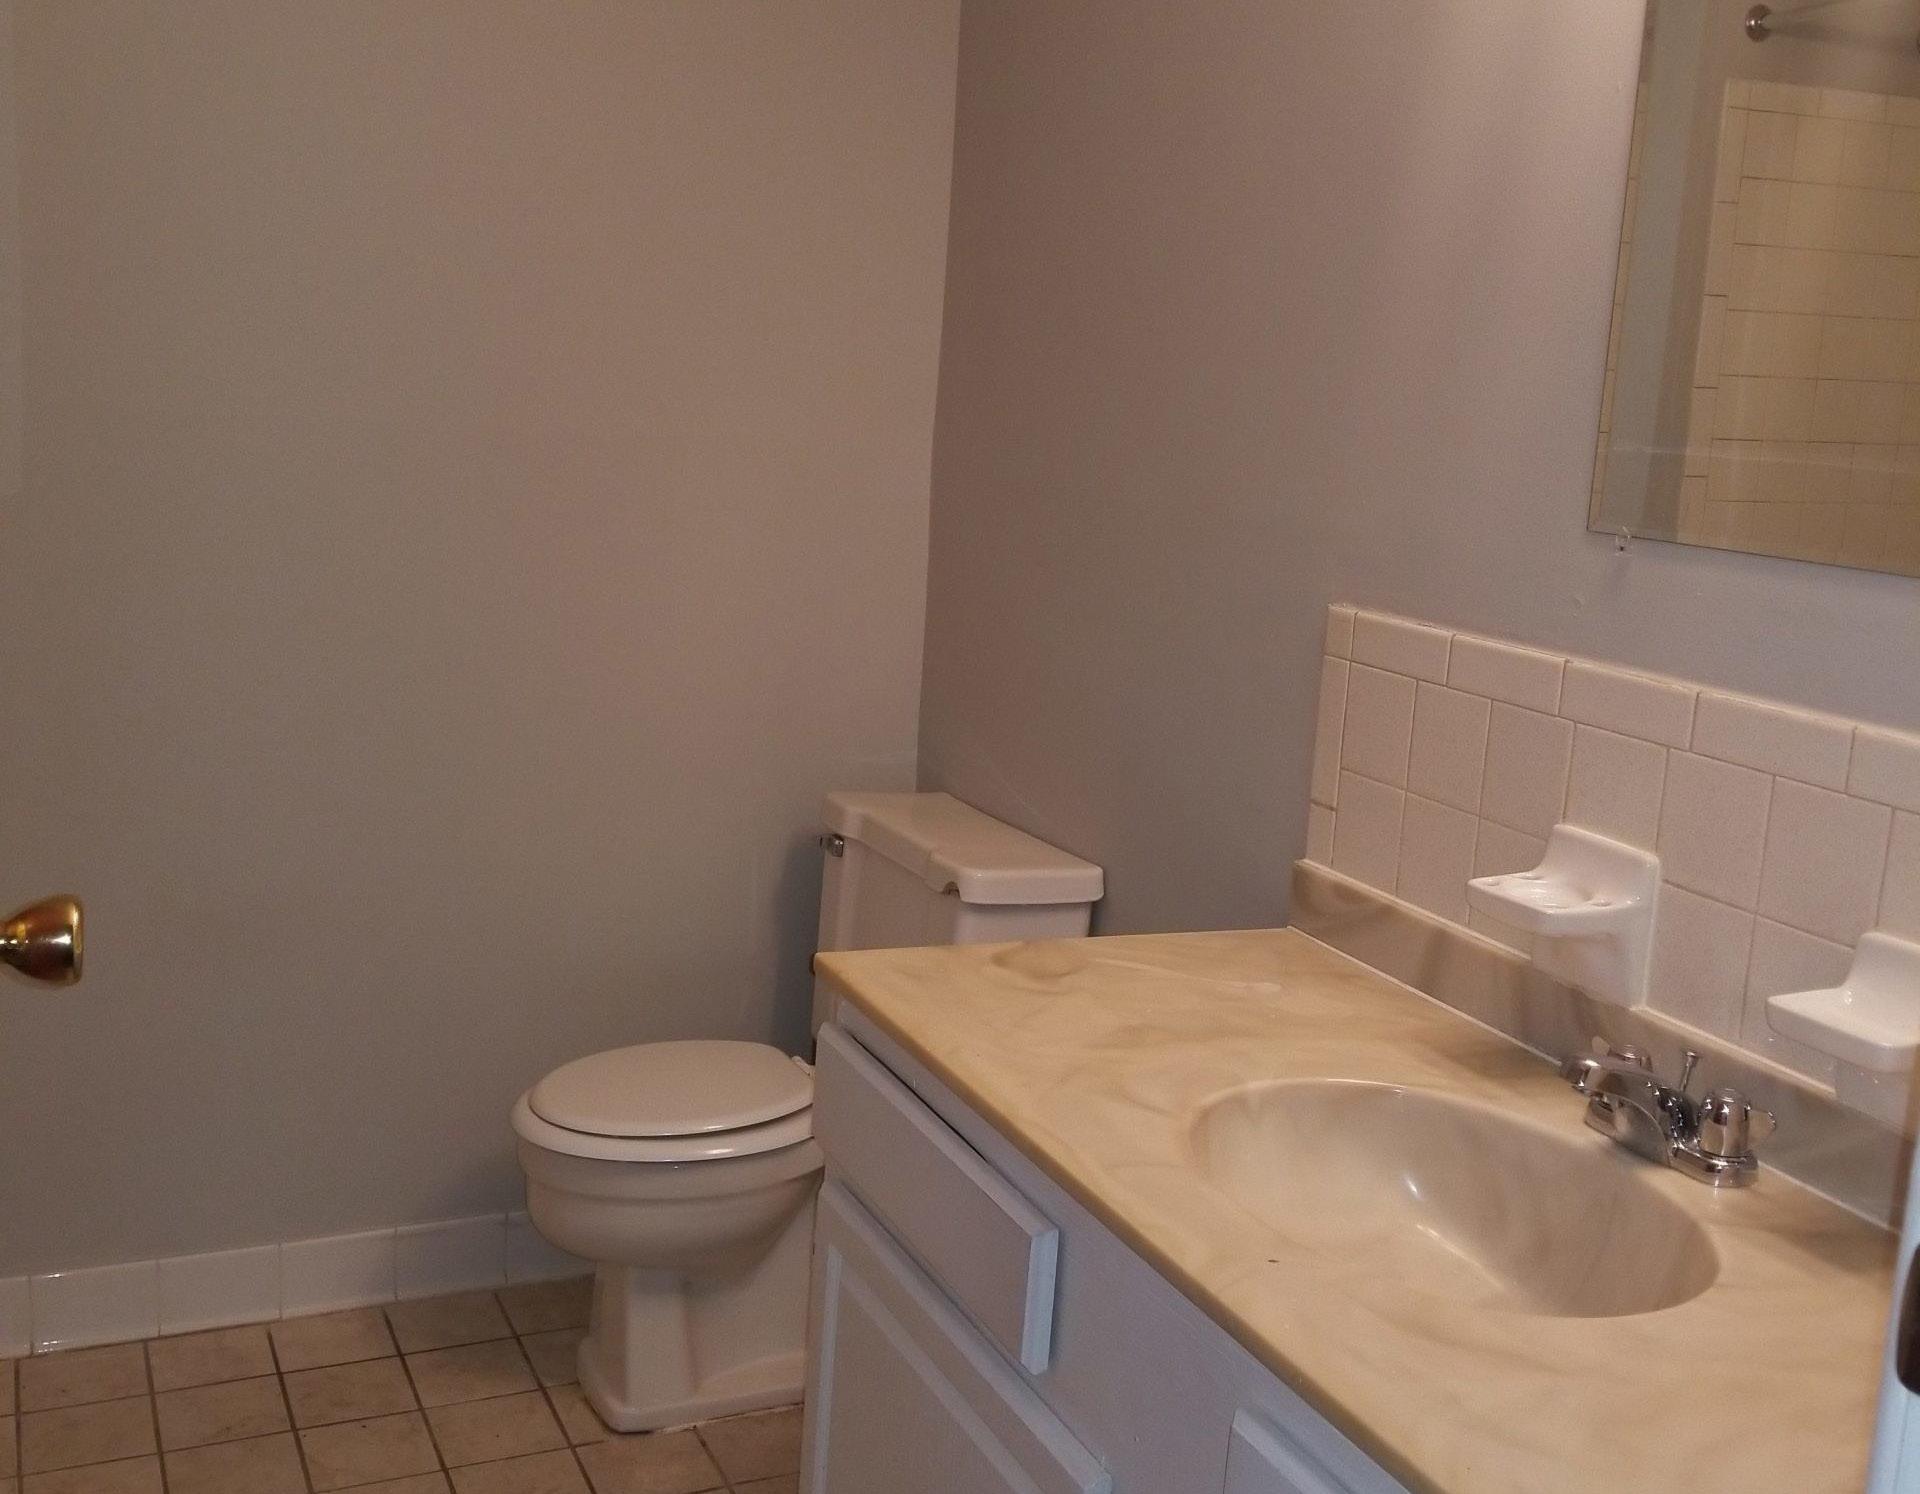
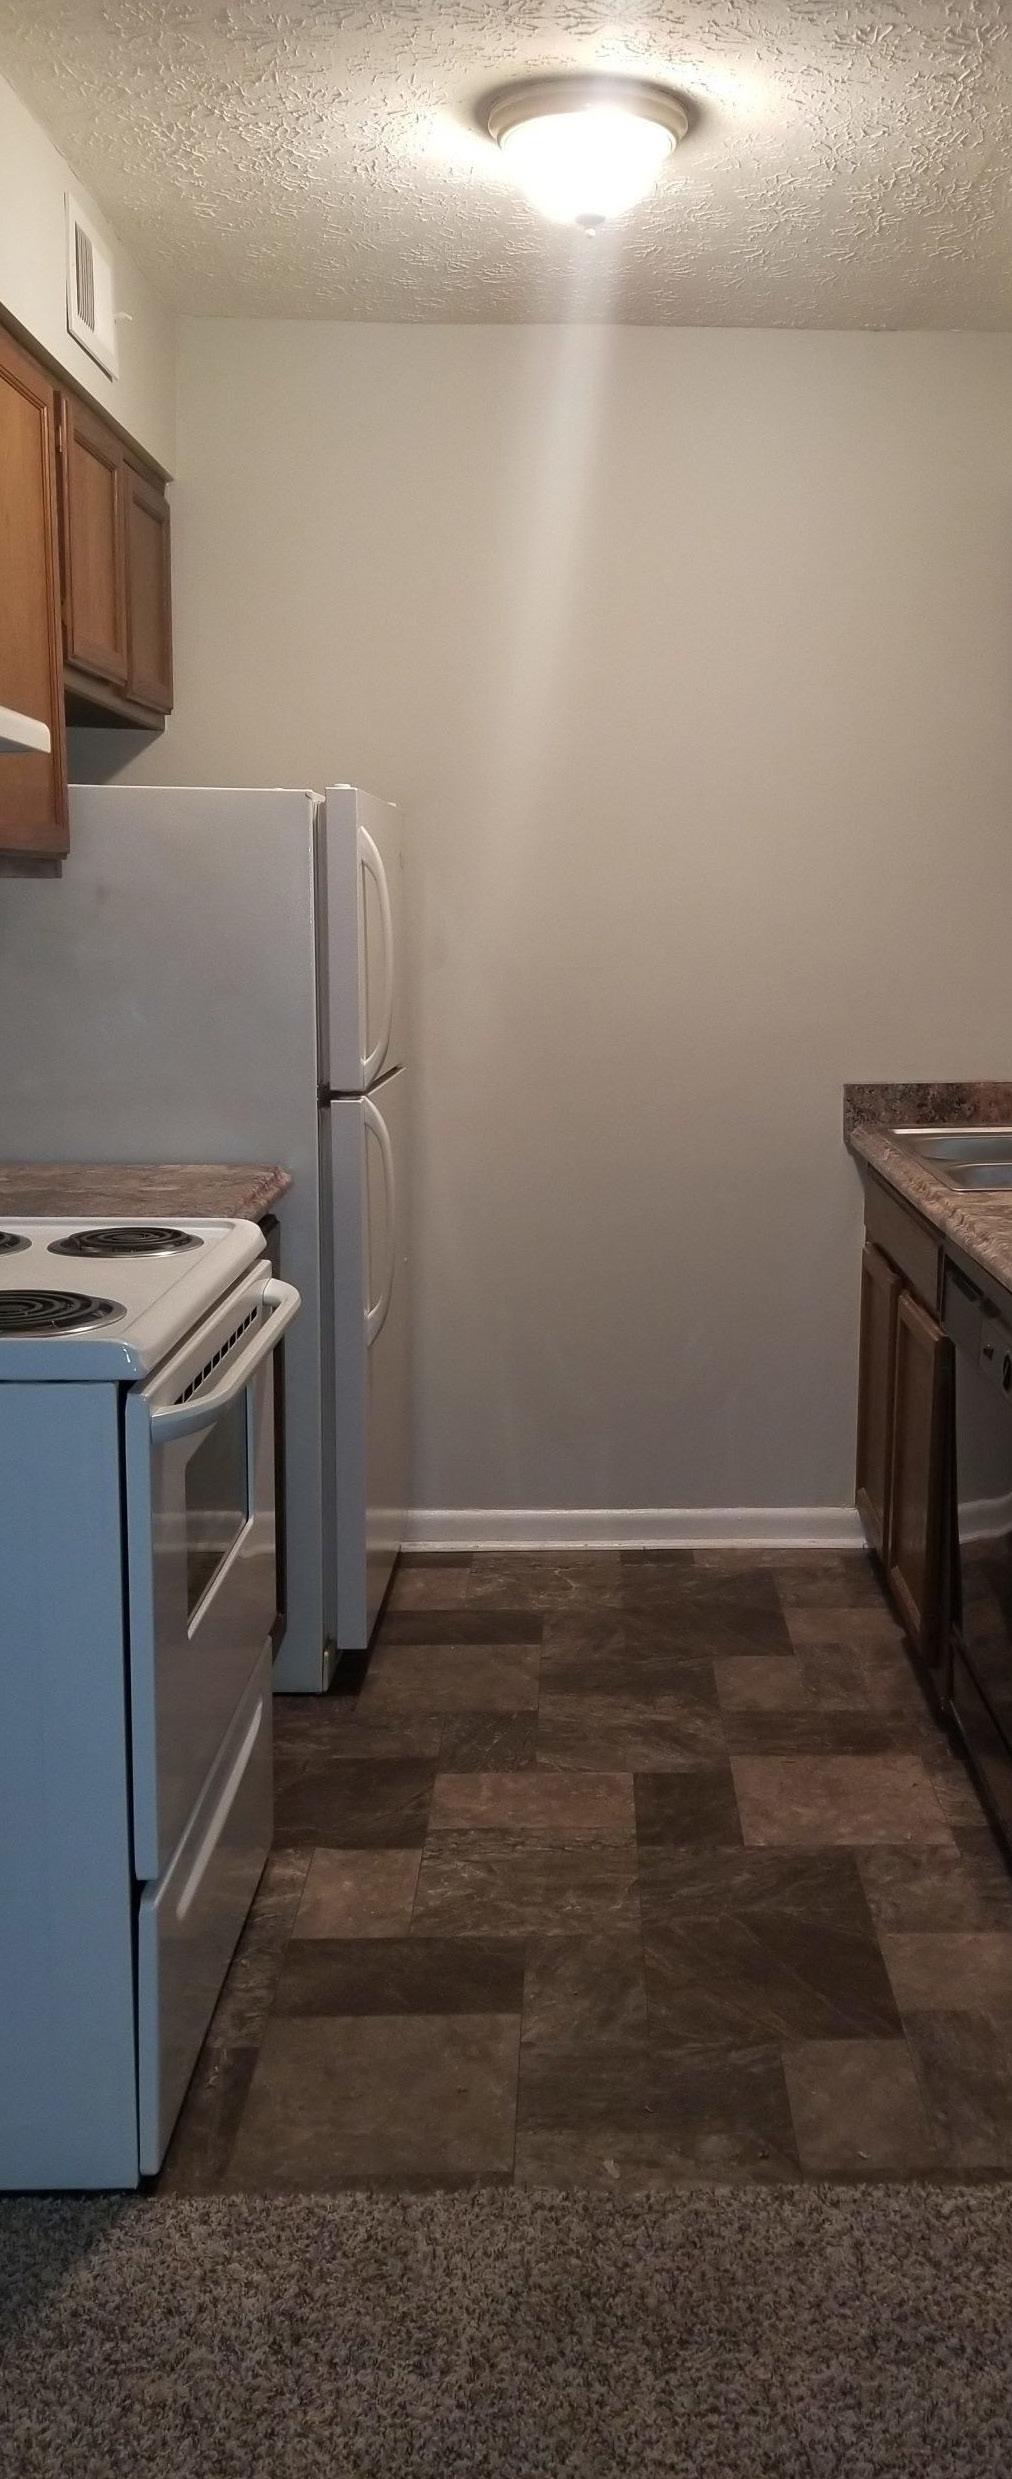
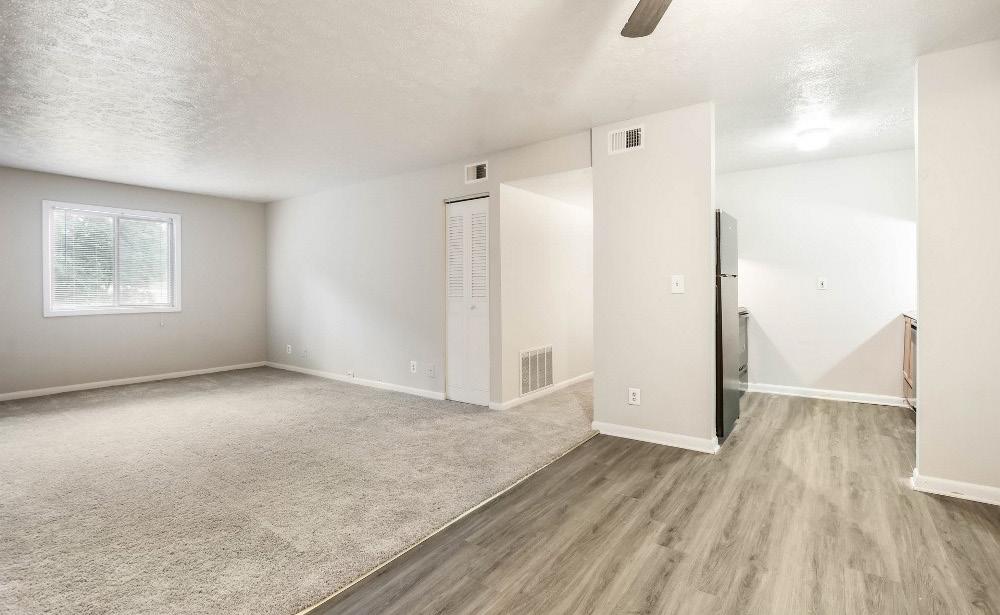
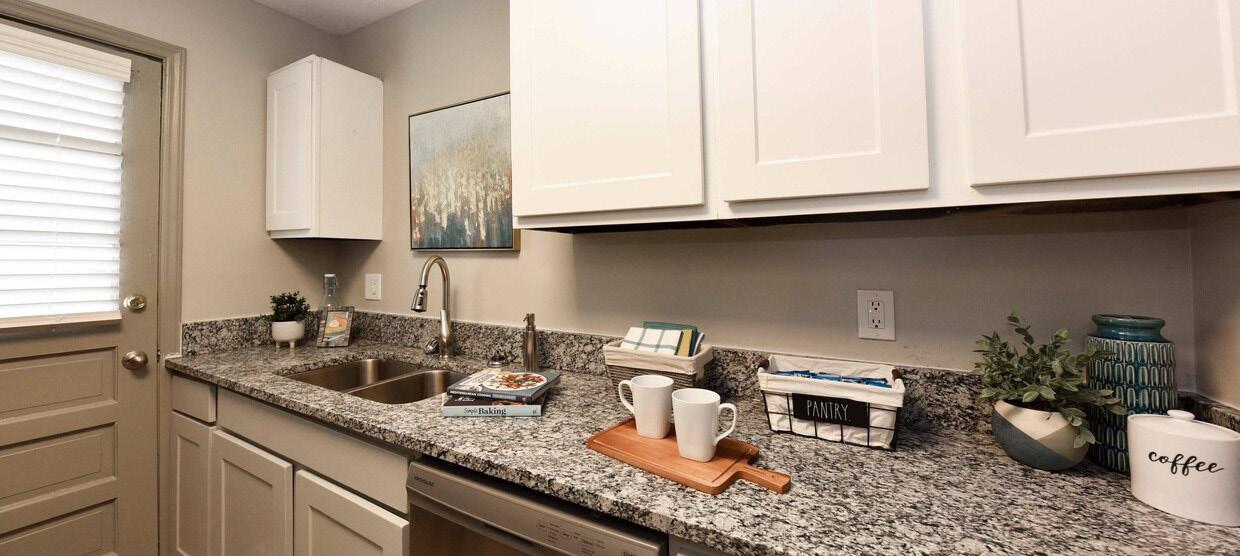
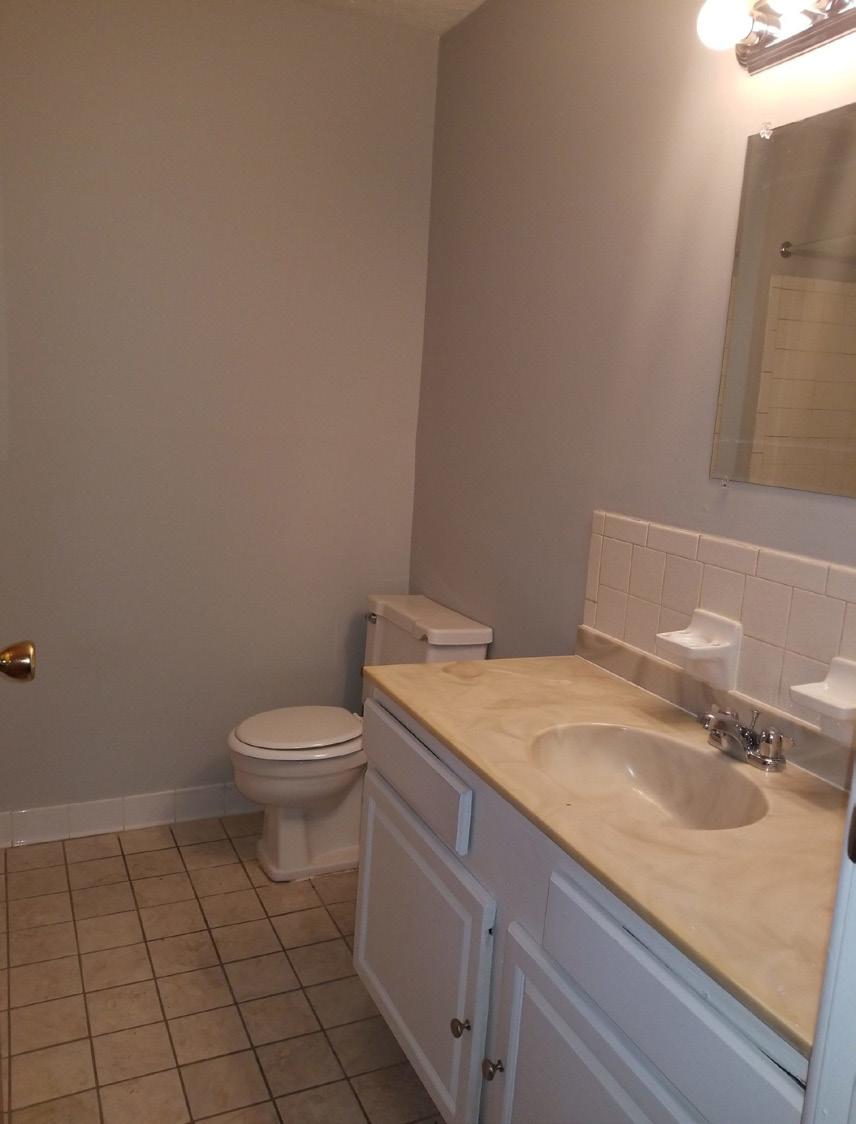
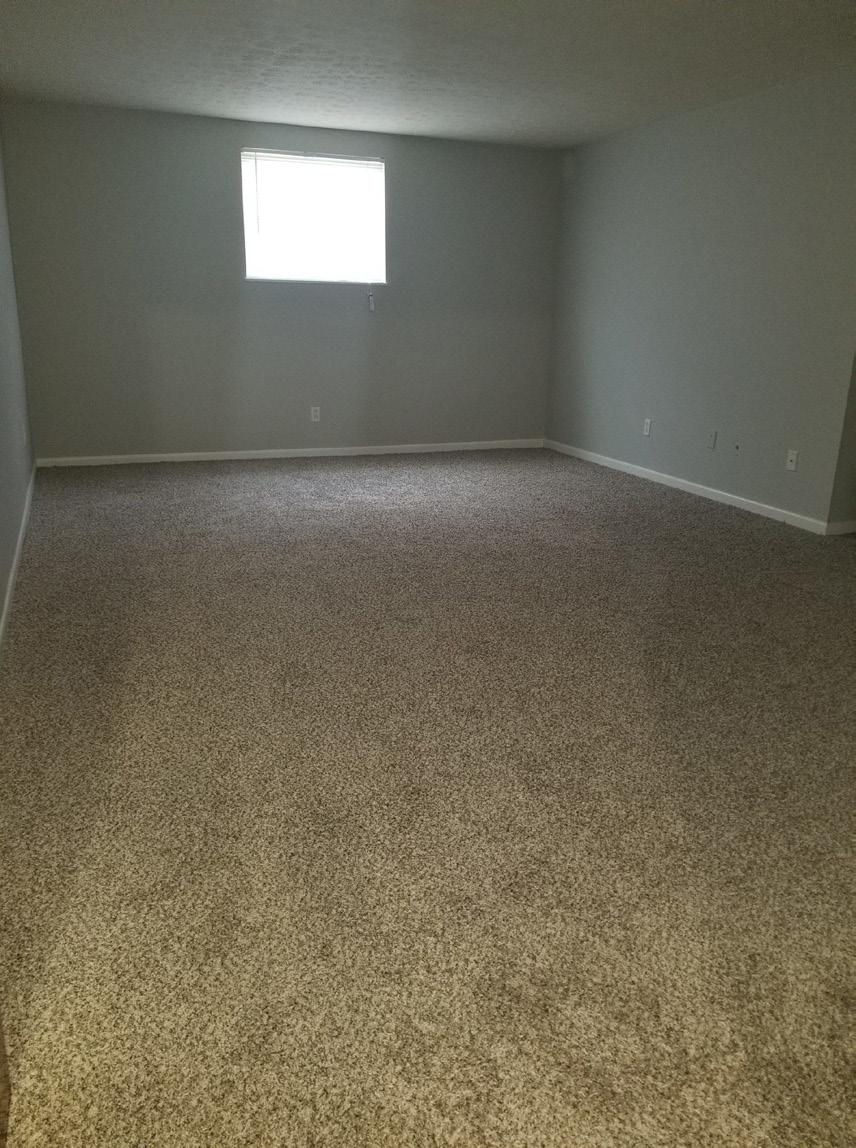
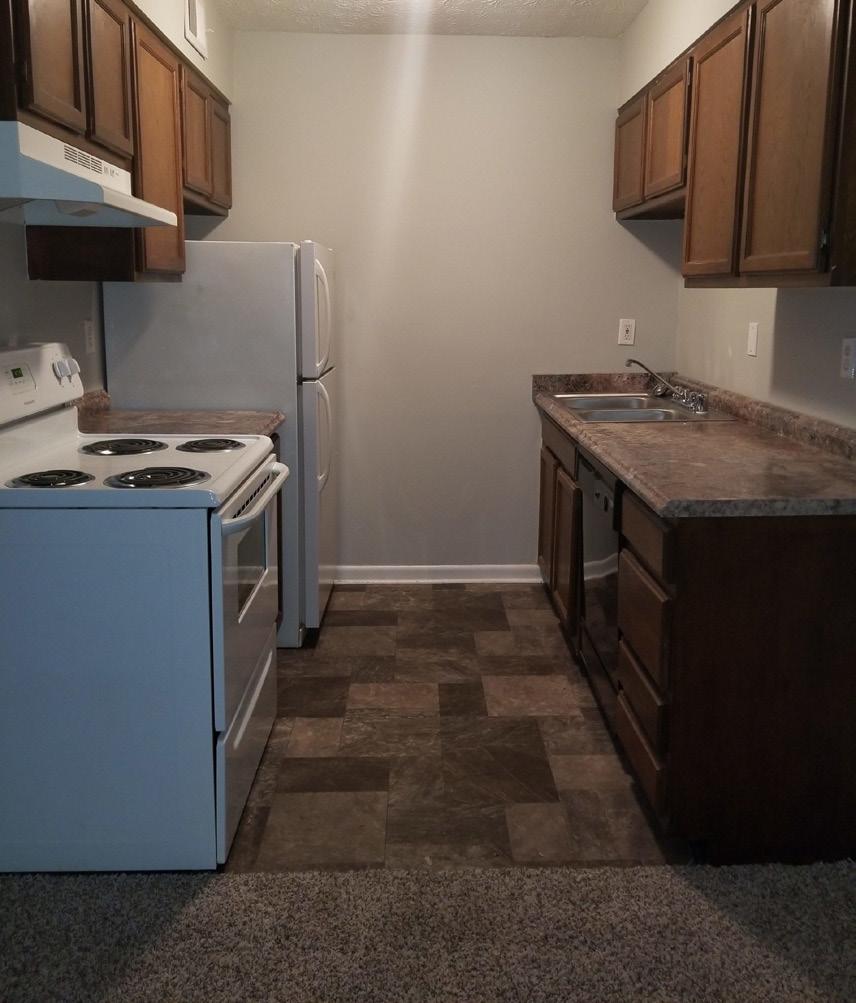
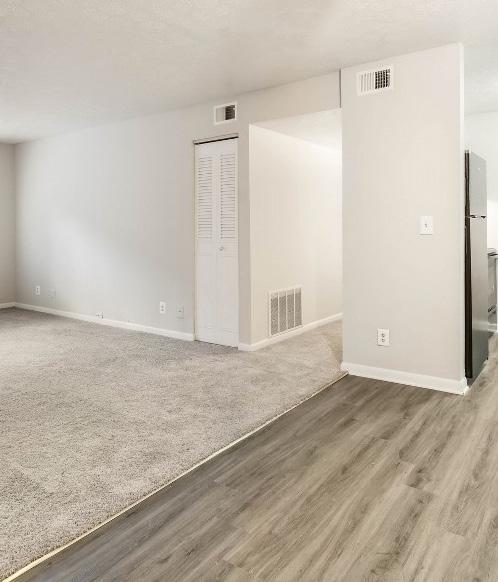
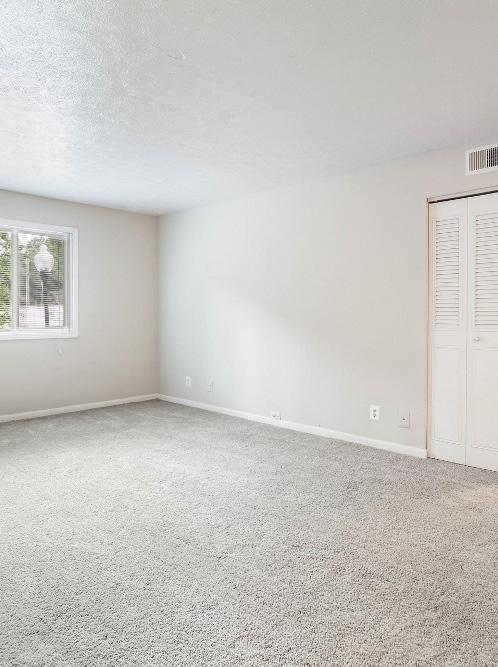
Marcus & Millichap is pleased to present Cardinal Hill Gardens, a 134unit community in Louisville, KY. This property is bursting with potential with rents well-below the market average, and additional rental upside available through interior renovations. This provides an incoming investor with multiple avenues for NOI growth. One, they could focus on improving operational efficiencies through professional property management and bring rents closer to market levels, and two, implement a renovation program to compete with newer construction in the market and further boost their bottom line.
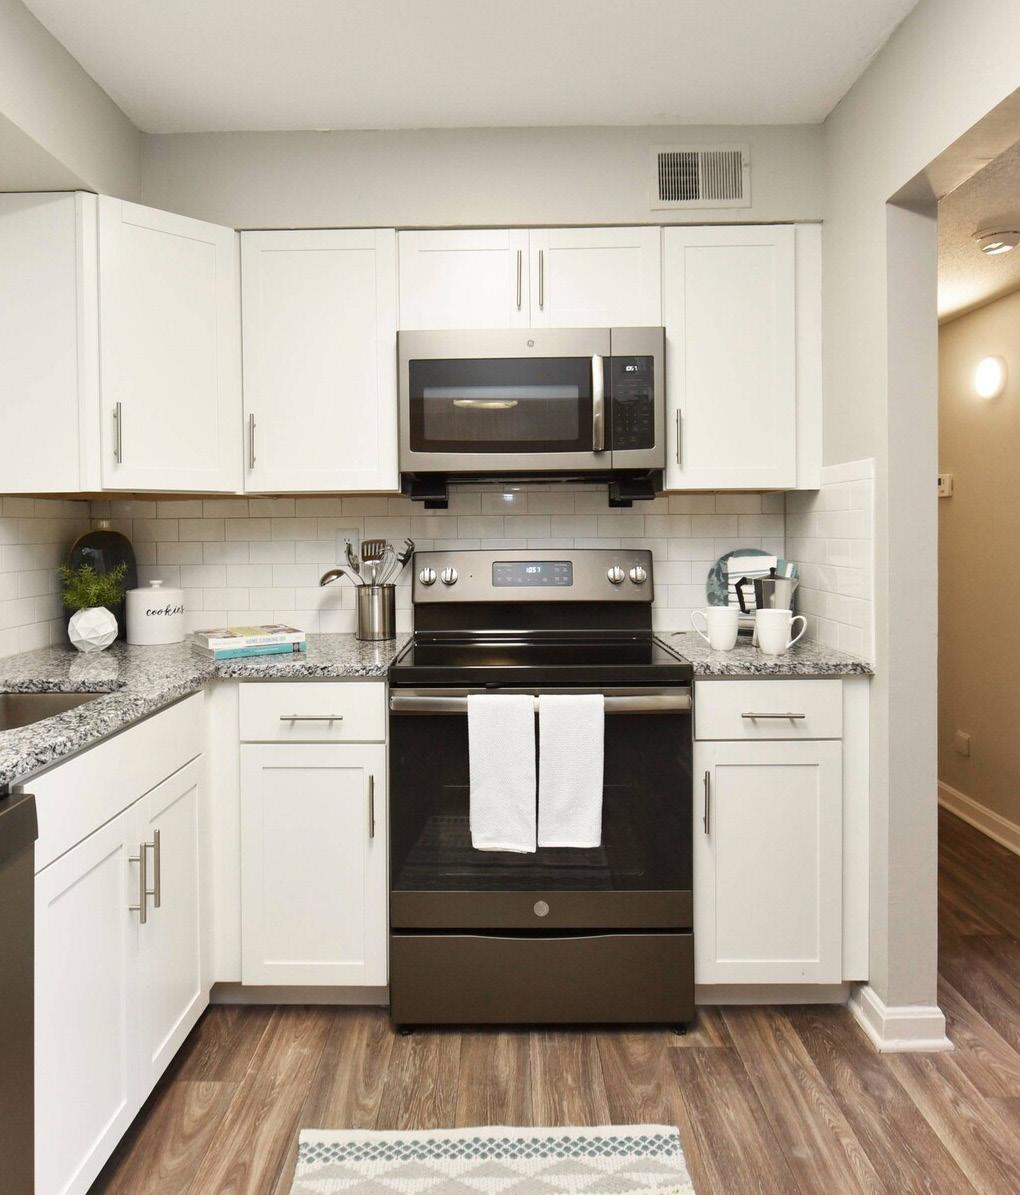
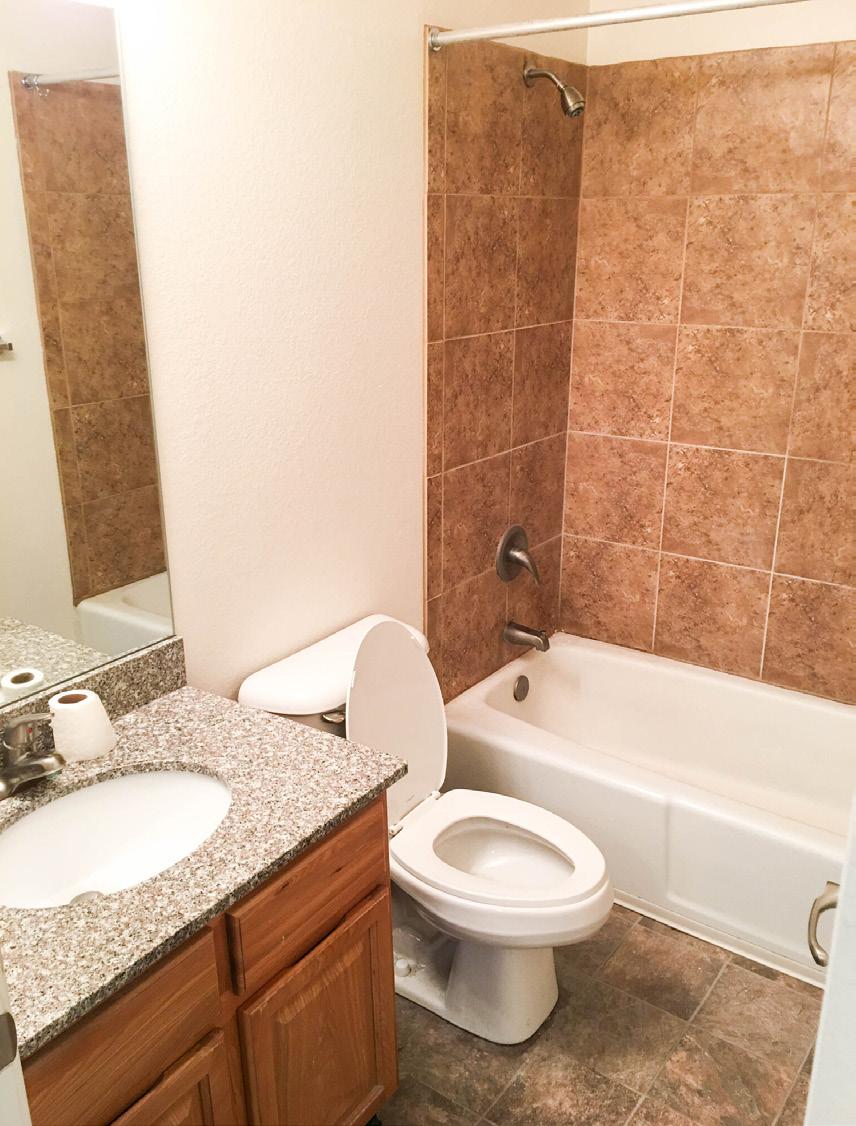
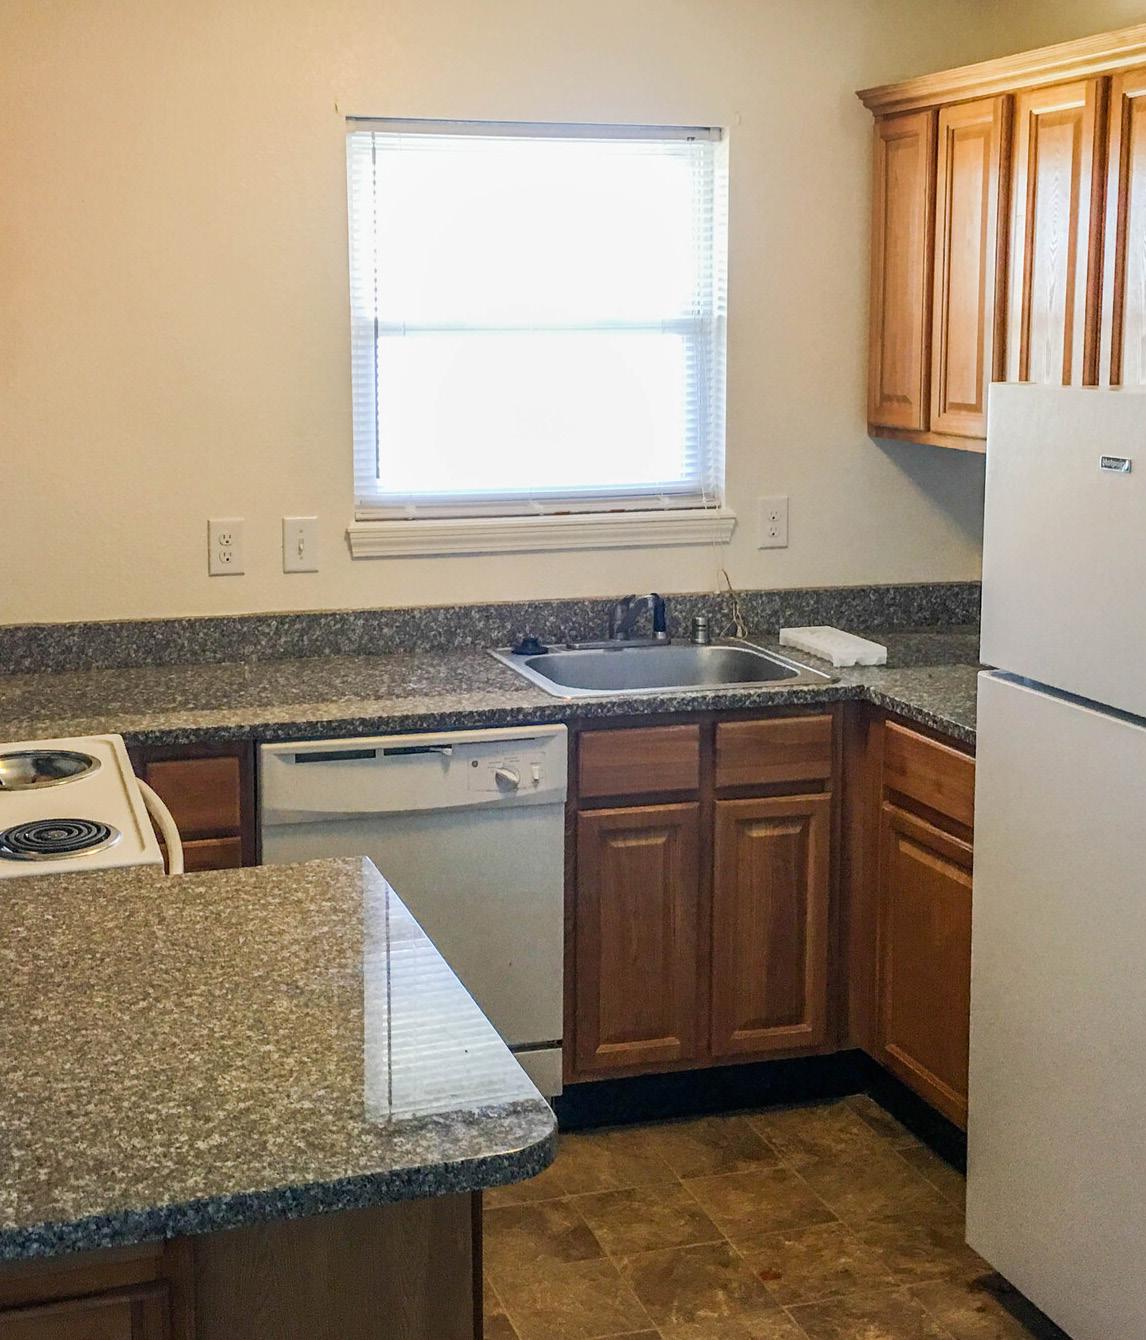
Interior Renovation: New Cabinets, Granite Countertops, Washer / Dryer Hookups: Install washer / dryer hookups
Utility RUB: Charge a utility billback for water, sewer and trash
Utilities: Install in-unit water heaters
THE MARKET: STRONG RENT & JOB GRO
Louisville has experienced strong rental growth in the past 12 month’s largely driven by strong economic fundamentals and pent-up demand from Covid. The metro recorded a net gain of 22,400 jobs as the market recovers from Covid, expanding the employment base by 3.5%.
The top industries in Louisville’s employment sector are Trade & Transportation (23.3%), Education & Health (14.6%), Manufacturing (12.4%), and Professional Services (12.1%). Some of the largest employers in the area include Yum! Brands, Kindred Healthcare, Humana, and Ford. It is also home to UPS Worldport, the world’s largest package handling facility.
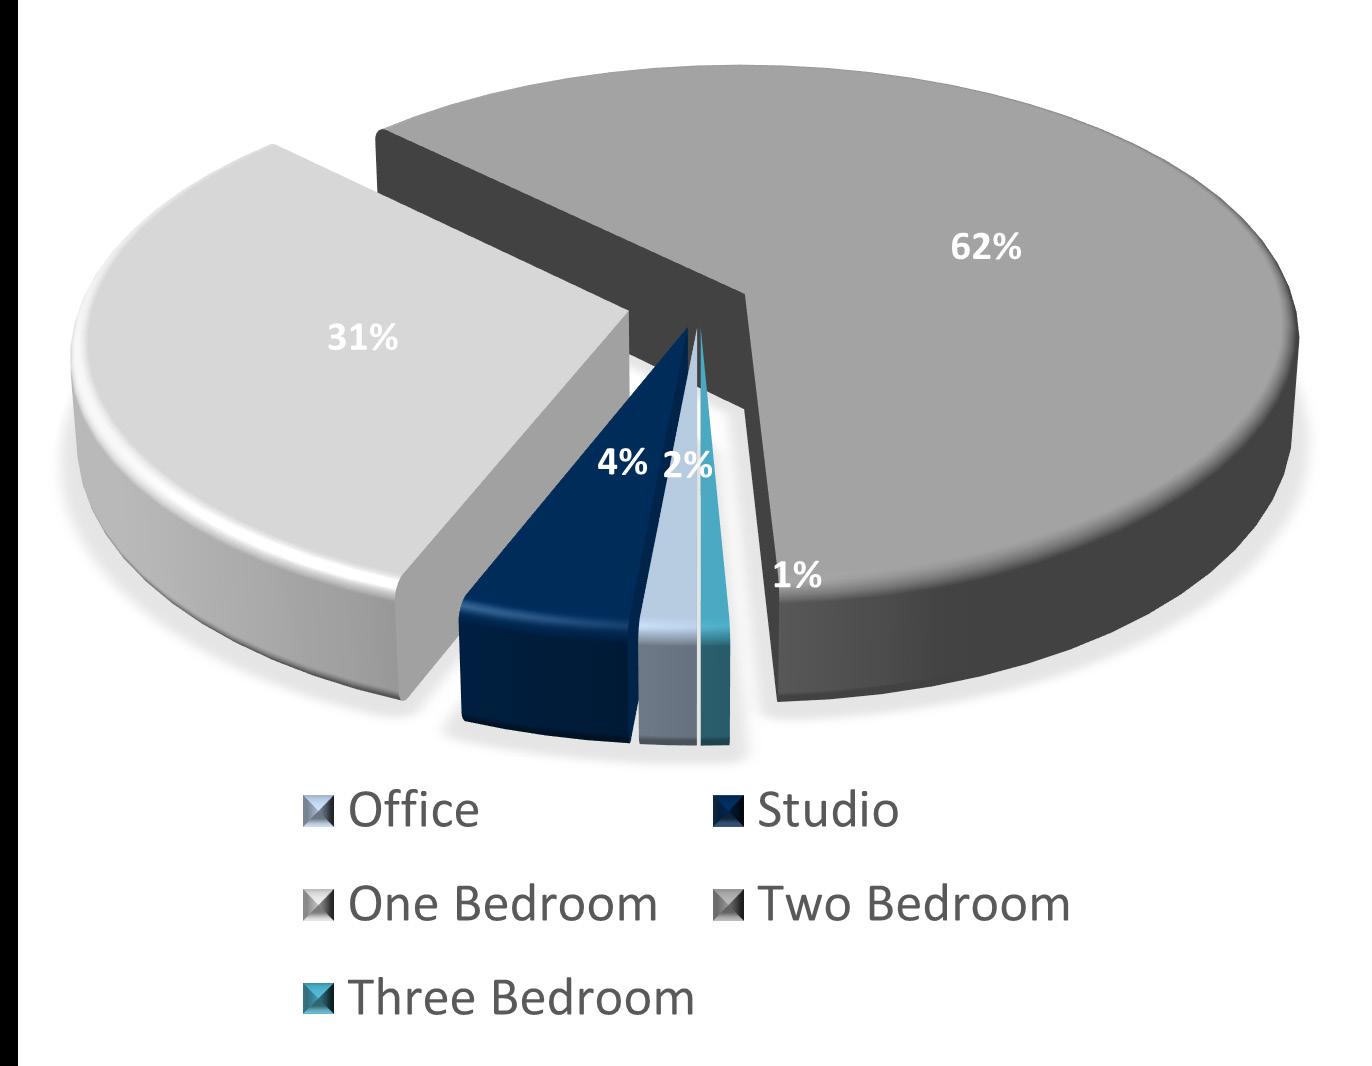
RENTABLE SQUARE FEET TOTAL UNITS AVG EFF RENT
CARDINAL HILL GARDENS *
• Cardinal Hill Gardens presents the opportunity for incoming investor to purchase a property built in the 60s that is still owned within the family of the original developer.
• There have been no new deliveries in this submarket for the past 12 years.
• The Kenwood submarket experienced a YOY rent increase of 14.5%, outperforming the Louisville market by 550 basis points.

• There is strong market market rents. Multiple have undergone renovations $938 for 1 and 2-bedroom


• Cardinal Hill Gardens ket average of $938, initiative and drive rents
• Cardinal Hill Gardens nity for an investor professional property
market support to renovate units and raise Multiple properties of similar vintage and style renovations and are achieving on average 2-bedroom rents.
Gardens monthly rents are $261 below the marproviding an opportunity for a renovation rents to be in line with market competitors. Gardens is self-managed providing an opportuimprove operational efficiencies through property management.
• Rental market has softened a little as the market reels from unprecedented rent growth. There could be some trepidation regarding an aggressive renovation and rent push.

• The trailing performance of Cardinal Hill has a larger than average expense load, so from a lending standpoint bridge debt would be required to execute the strategy. Bridge debt usually has terms that are less favorable.

• While there have not been any deliveries in the past 12 years in this submarket, there are 450 affordable units in planning, along with 150 units under construction in the immediate submarket. There could be a concern that the market becomes over saturated with rents that are competing for rates in the C+, B- realm.

Cardinal Hill Gardens is well-positioned for a value-add interior renovation with the market outperforming Cardinal Hill by 44%. The provides an excellent opportunity for an incoming investor to implement a value-add renovation strategy to bring rents to market.
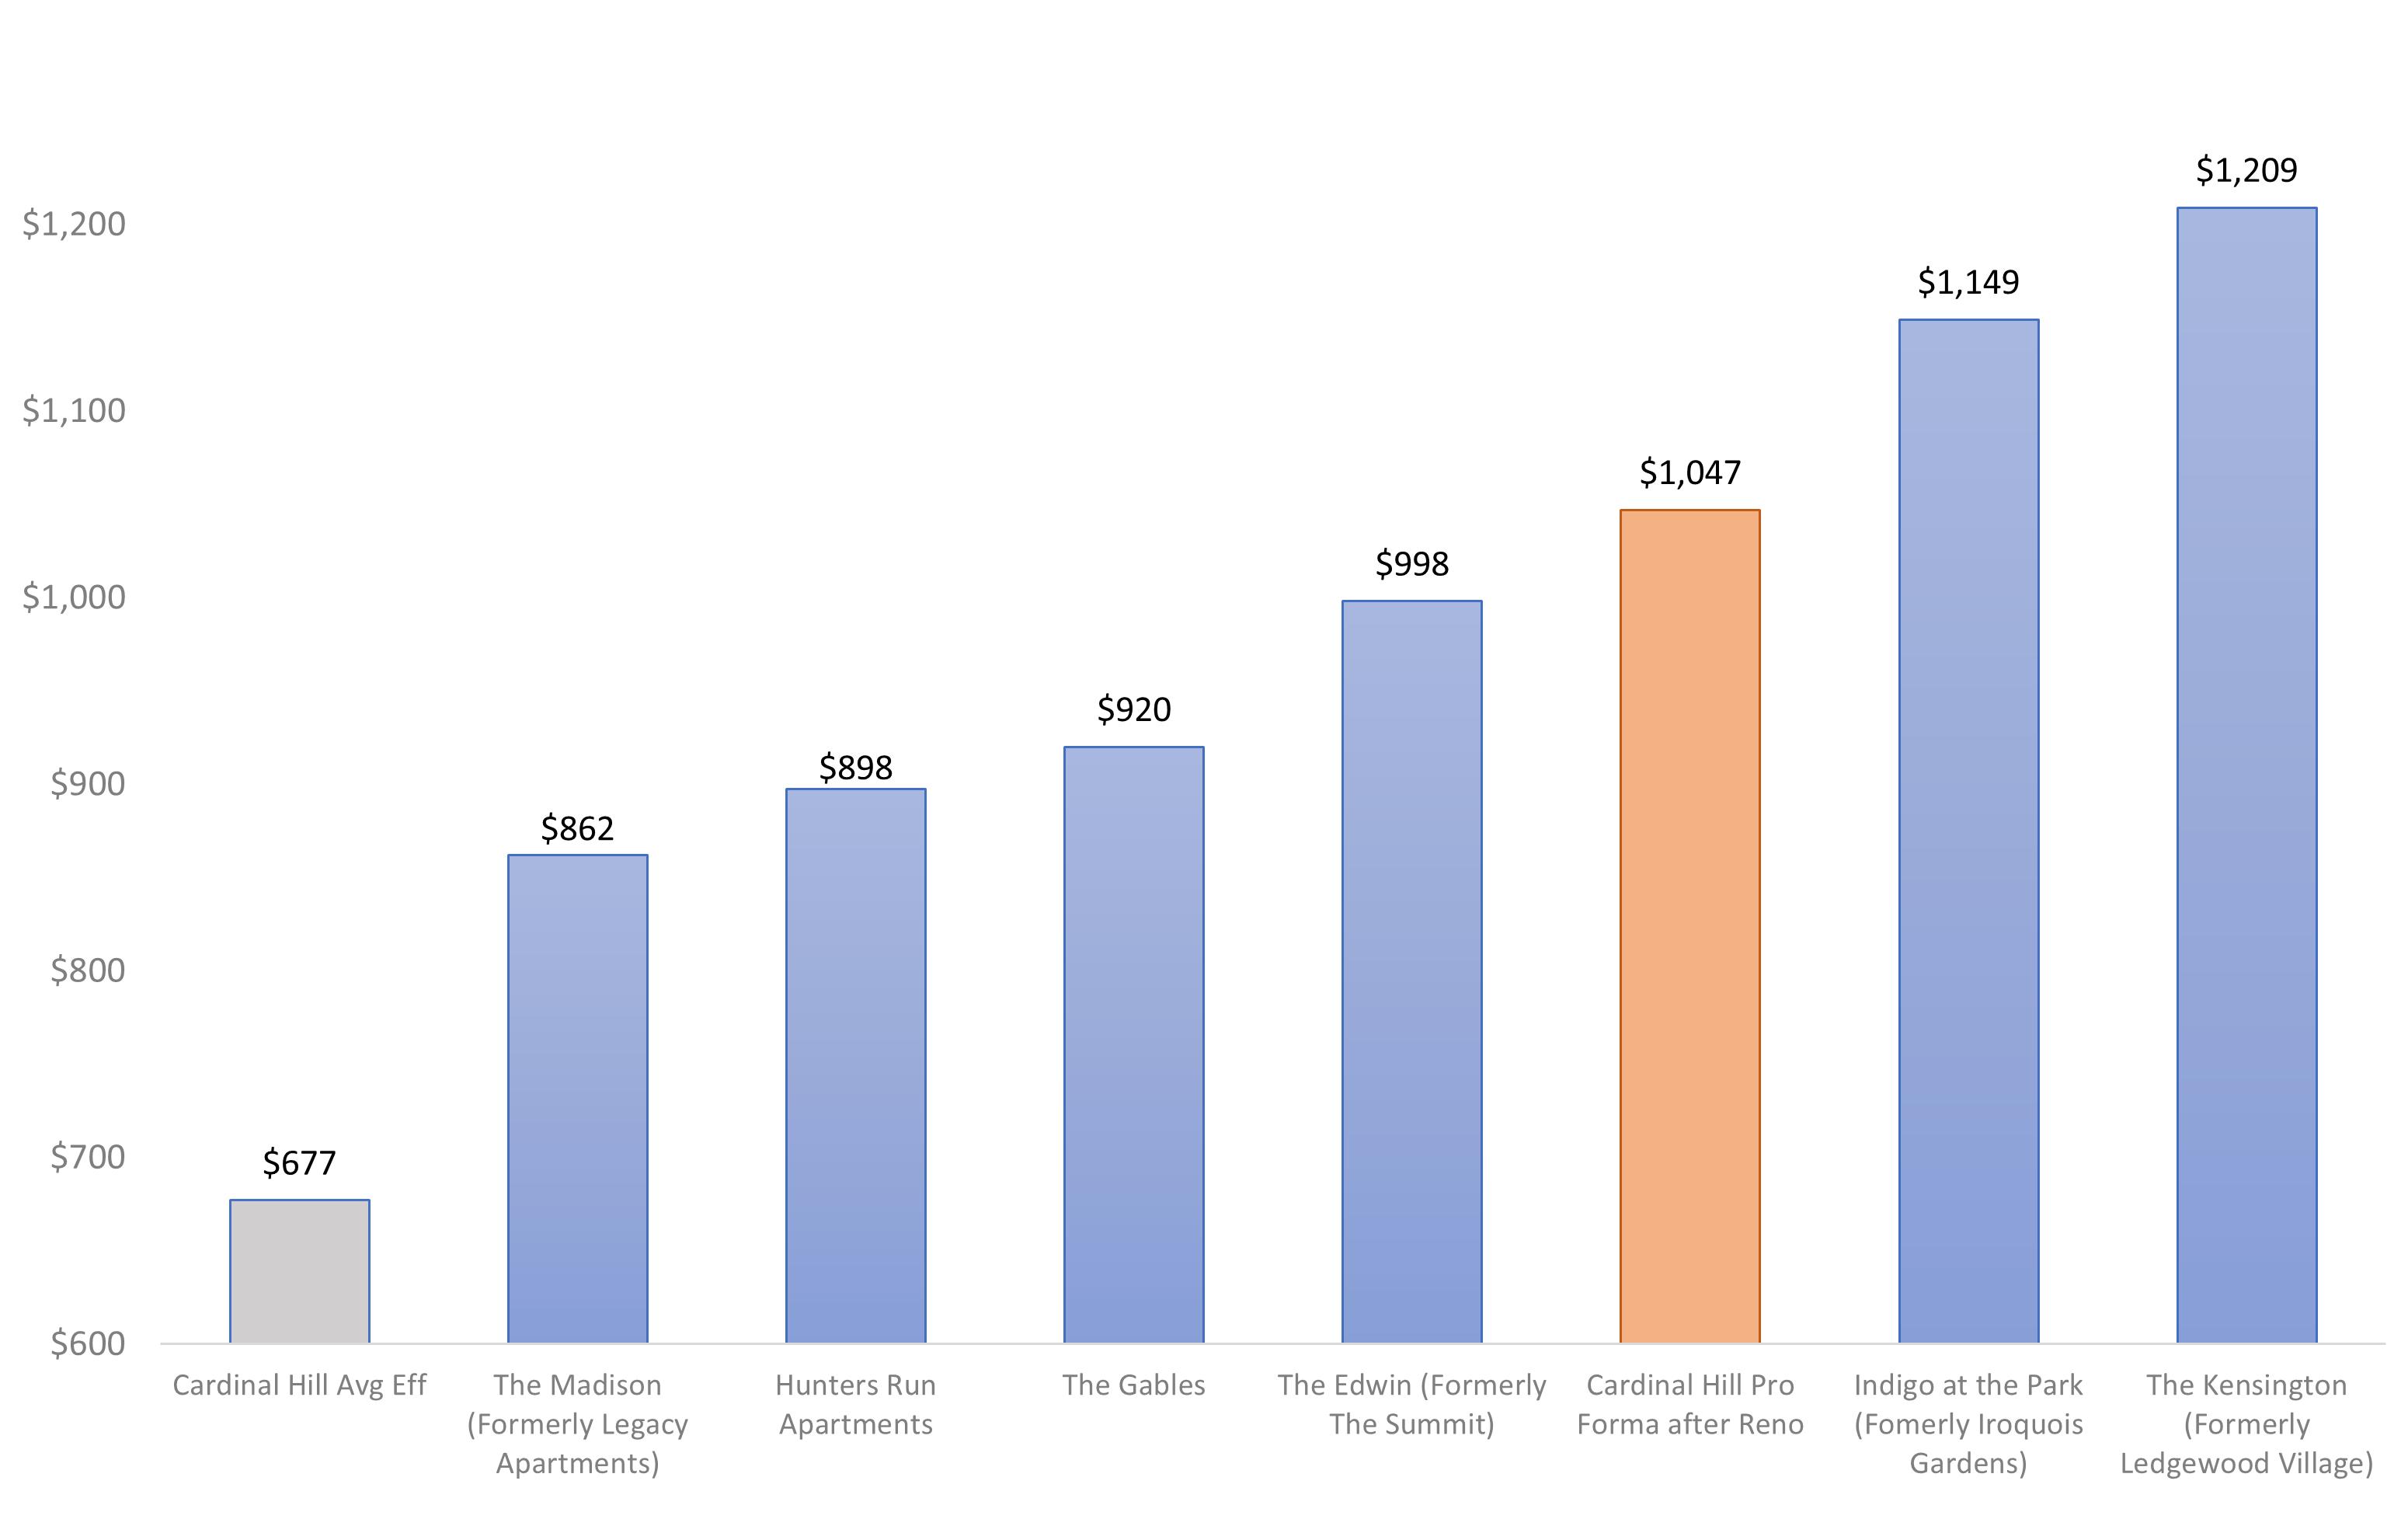
$532
IN-PLACE RENTS TRAILING MARKET LEADER
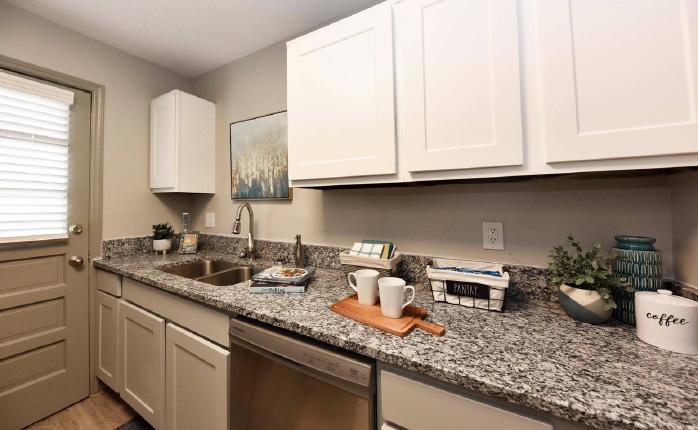
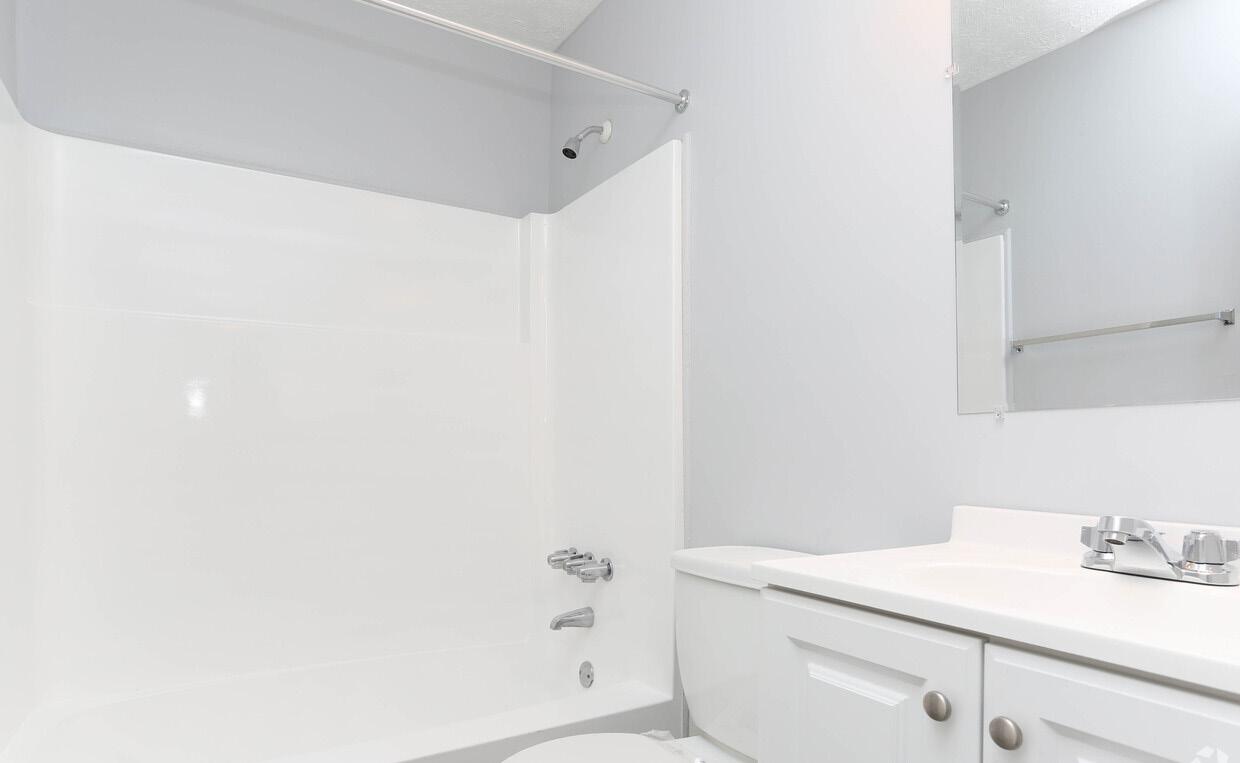
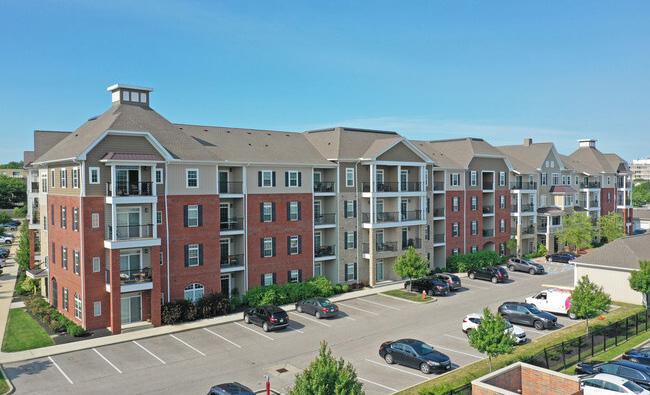
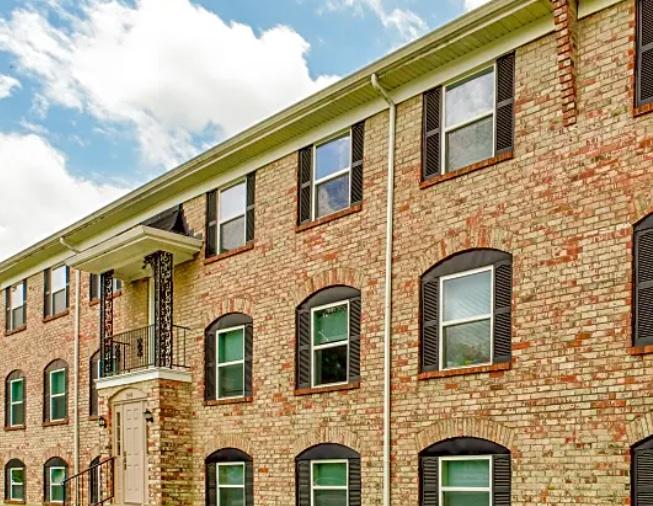
The competitive set in the market have renovated apartments of similar construction and vintage and are acheiving $879 (1 bed) and $1,078 (2 bed) per month. This provides strong market support for a value-add renovation initiative. Using these as a case study, there is significant value add opportunity to remodel Cardinal Hill Apartments with similar style upgrades. Upgrades from the competitive set include exterior paint and landscaping, and interior upgrades of: stainless appliances, modern light fixtures, granite countertops, new cabinets, upgraded bathrooms and flooring.
$9.5K/UNIT AVG RENO COST
$364/MONTH AVG RENT INCREASE
45.9% ROI
APARTMENTS
CARDINAL HILL GARDENS *


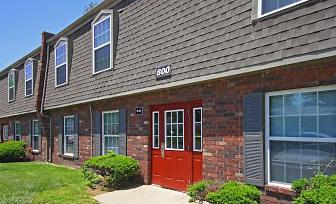
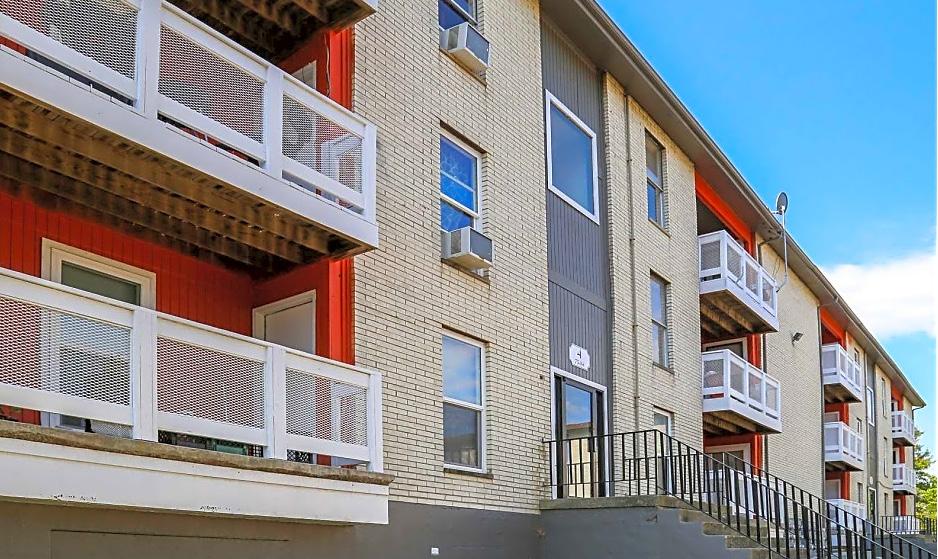
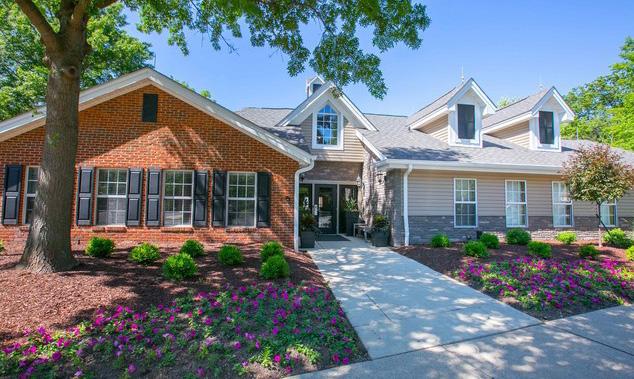
formerly iroquois gardens
6100 Ledgewood Pky Louisville, KY 40214
2022 Renovations Include: New Windows, Granite Countertops, Wood Laminate Floors, Updated Cabinetry, New Stainless Appliances, New Carpeting
Common Area Amenities
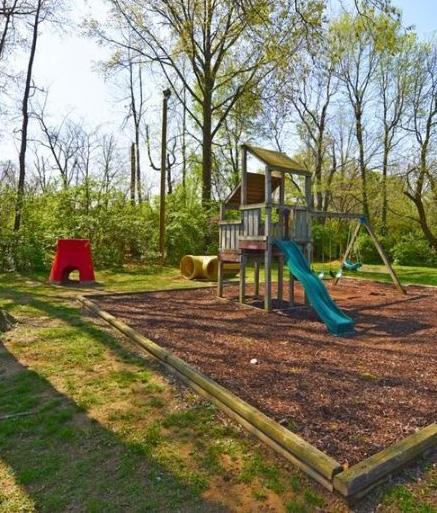
24 Hour Access, Picnic and Grilling Area (UPDATED), Laundry Facilities, Playground (UPDATED),Maintenance on site, Property Manager on Site
Apartment Interior Amenities


Fully Equipped Kitchen With Built-in Microwave
Walk-In Pantry, Washer/Dryer Connections, Air Conditioning, Cable Ready, Recreation Room, Dishwasher


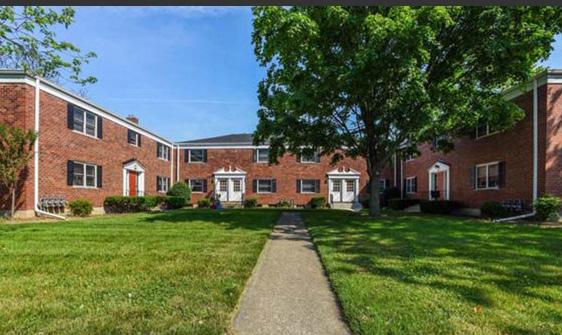
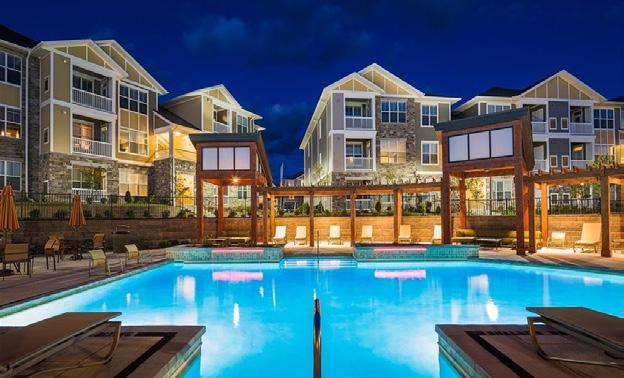
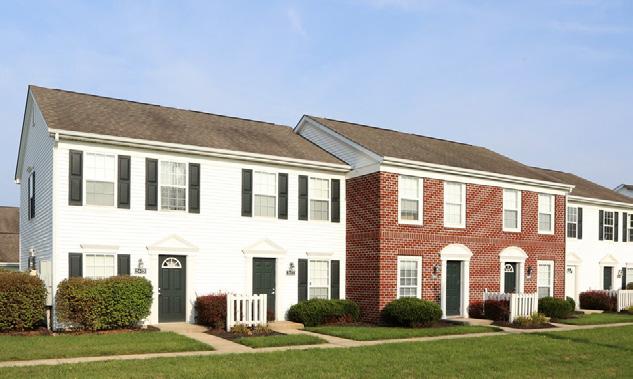
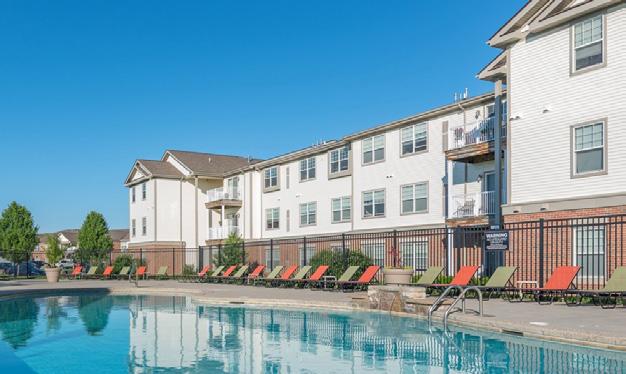
formerly summit apartments
2814 De Mel Ave Louisville, KY 40214
2022 Renovations Include: New Appliances, New Carpeting, Wood Laminate Floors, Updated Cabinetry, Granite Countertops, Updated Bathrooms
Common Area Amenities
Pet Play Area, Swimming Pool, Property Manager on site, Laundry Facilities (New 2022), Maintenance on site
Apartment Interior Amenities Cable Ready, Ceiling Fan, Window Coverings, High-speed Internet Access, Air Conditioning, , Walk-in Closets, Washer/ Dryer Hookup

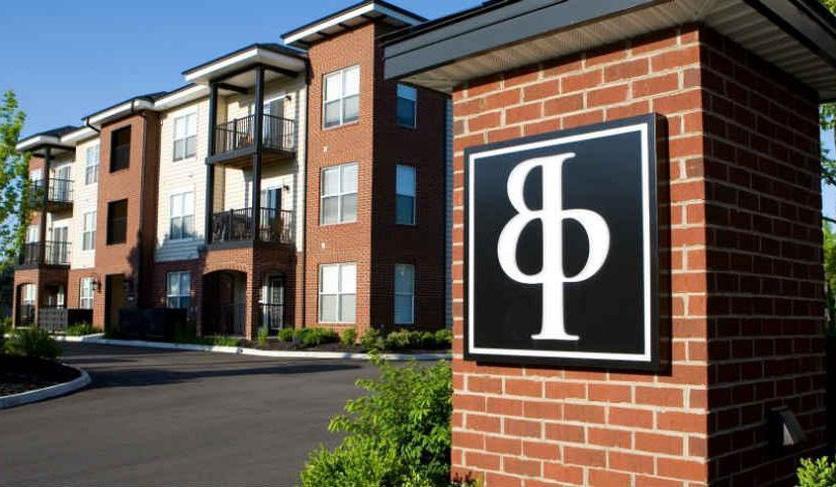
2022 Renovations Include: New Windows, New Appliances, New Carpeting, Wood Laminate
Floors, Updated Cabinetry
Common Area Amenities
Bike Rack/Storage, Picnic and Grilling Area, Courtyard, Swimming Pool
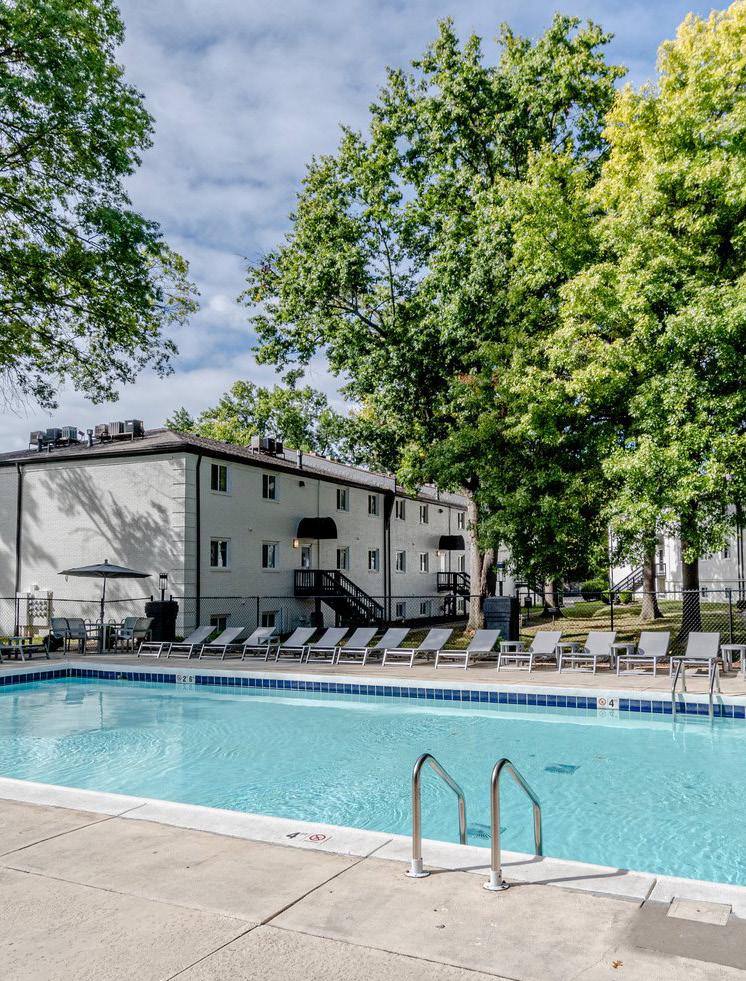
(UPDATED 2022), Access to Hiking and Biking Trails, Basketball Court, Playground, Property Manager on Site, Tennis Court, Laundry Facilities
Apartment Interior Amenities Cable Ready, Ceiling Fan, Electronic Thermostat, High-speed
Internet Access , Air Conditioning, Storage Units, Walkin Closets
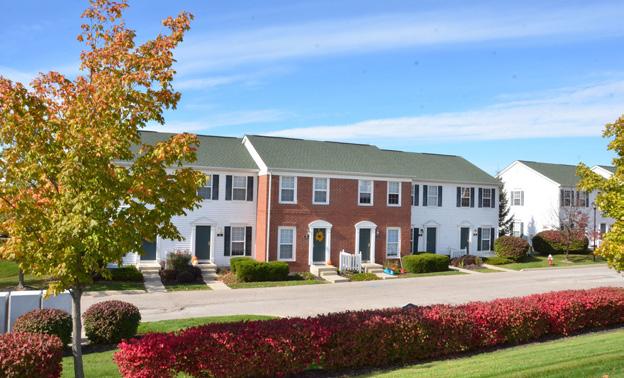
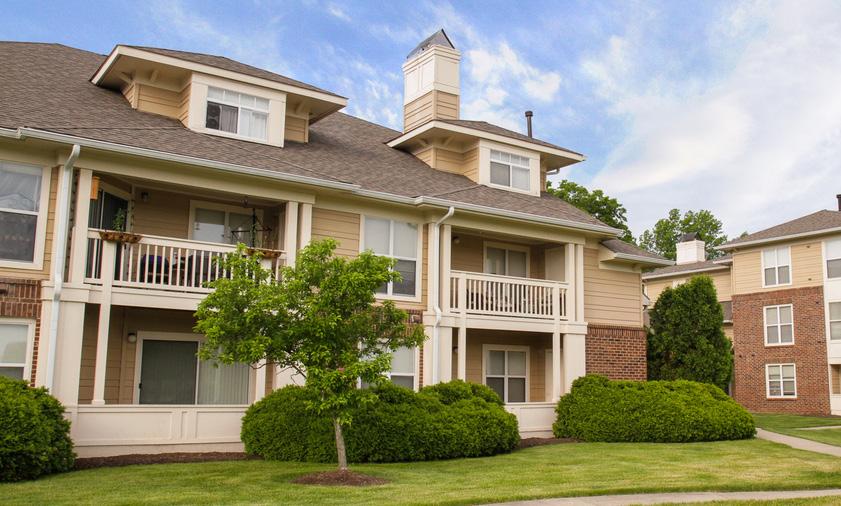
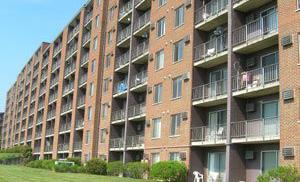
5515 Hunt Club Ln Louisville, KY 40214
2022 Renovations Include:
Fully renovated apartment units.
Common Area Amenities
Picnic and Grilling Area, Laundry
Facilities, Playground (New 2022), Maintenance on site, Property Manager on Site
Apartment Interior Amenities Air Conditioning, Kitchen, Balcony, Oven, Carpet, Range
Ceiling Fans, Refrigerator, Freezer, Tub/Shower, Heating, Window Coverings
2022 Renovations Include: New Appliances, New Carpeting, Updated Cabinetry, Granite Countertops, Updated Bathrooms
Common Area Amenities Courtyard, Laundry Facilities
Apartment Interior Amenities Air Conditioning, Walk-in Closets, Washer/Dryer Hookup

1 Replacement & Reserves: added based on market norm of $255 per unit per year

Marketing the asset without a specific price allows us to customize our sales approach to each investor’s specific rehab costs, cost of debt and minimum return requirements. Thus facilitating a competitive bidding environment and ultimately maximizing the value of the Property.

Situated on the banks of the Ohio River, Louisville is a progressive community of 1.3 million people. Louisville is one of the most uniquely authentic destinations in the world. It is Kentucky’s largest city and offers hundreds of one-of-a-kind attractions. Whether you are north, south, east, or west – Louisville offers a slew of attractions and historic architecture in every direction. Three of the state’s six Fortune 500 companies call Louisville home – Humana, Kindred Health, and Yum! Brands.
The area provides an attractive business environment for companies due to its location and low cost of doing business, while allowing employees to enjoy a relatively affordable place to live. The economy has transitioned from traditional manufacturing and shipping to health-
care, tourism, and technology. Tourism in the state of Kentucky has a $3.5 billion economic impact from Louisville alone. While the economic impact is very significant, the results are even more so, as they positively affect the quality of life in Louisville. Through maintaining its commitment to the tourism industry, Louisville can enrich and nurture its infrastructure, allowing it to consistently rank as one of the top cities in the nation for quality of life. Foodies and food trucks, brew masters and bourbon, sports, tradition, and transformation - it’s all happening in Louisville. With such a vibrant quality of life, Louisville is a great place to call home.
• Amazon building new $5.5MM last-mile delivery station at prime Louisville property adding close to 2,000 new jobs (March 2021).

• GE Appliances completes $60MM expansion adding 245 new jobs (July 2021)

• Ge Appliances set to invest $450MM at its Appliance park in the next 2 years adding over 2,000 new jobs (Oct 2021)
• QSR Automations opens new global headquarters in Louisville, KY (Nov 2021)

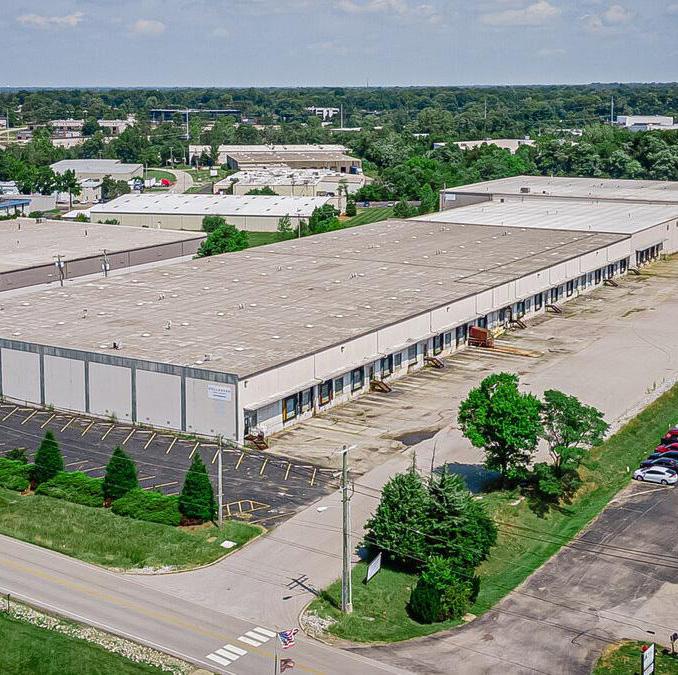
• KCC Manufacturing breaks ground on 700-job operation in Shelby County (Nob 2021)
• Republic National Distributing Co. breaks ground on a relocation and expansion project that will create 30 full-time jobs with a $50 million investment (Sep 2021).
• Baptist Health to build $42M rehabilitation hospital in Jeffersontown (Nov 2021)

Population: 1,300,000
Median age: 39.2
• Prior to the pandemic, Louisville/Jefferson County’s real gross metropolitan product grew at an average annual rate of 1.8% from 2015 to 2019. During that same fiveyear period, job growth averaged 1.5% annually, with roughly 9,800 jobs added on average each year. In 2020, COVID· 19 mitigation measures and limited business activity caused the local economy to contract as much as 9.0% year-over-year in 2nd quarter.

• In 3rd quarter 2022, the metro’s inflation-adjusted economic output was unchanged year-over-year.
• At the same time, the metro recorded a net gain of 22,600 jobs, expanding the employment base 3.4%.
• During the past year, job gains in Louisville/Jefferson County were most pronounced in the Professional/Business Services sector followed by Education/Health Services.
• Despite job losses stemming from the pandemic, Louisville/Jefferson County’s current employment base now sits roughly 16,600 jobs or about 3% above the pre-pandemic level in February 2020.
Msa median hhi: $57,405
1 - Year growth: 1.77%
Msa median home value: $173,500
1 - Year growth: 4.83%
Average occupancy: 96.4%
Rent growth:6%
New apartment completions in Louisville/Jefferson County were moderate recently, as 1.958 units deliv ered in the year-ending 3rd quarter 2022. Completions over the past year expanded the local inventory base 2.1%. In the past year, supply was greatest in Northwest Louisville and Northeast Louisville. At the end of 3rd quarter 2022, there were 1,896 units under construc tion with 1,516 of those units scheduled to complete in the next four quarters. Scheduled deliveries in the com ing year are expected to be concentrated in Northwest Louisville and Southwest Louisville.

Occupancy in the past year, occupancy lost 0.6 points, with the 3rd quarter 2022 rate landing at 95.8%. Look ing at product classes in Louisville/Jefferson County, 3rd quarter 2022 occupancy registered at 94.8% in Class A units, 95.8% in Class B units and 97.0% in Class C units. Among submarkets, 3rd quarter 2022 occupancy was strongest in Northwest Louisville and Southeast Lou isville. The weakest readings were seen in Central Louisville and Southwest Louisville. Over the past five years, Northwest Louisville generally led for occupancy. During the coming year, occupancy in Louisville/Jeffer son County is expected to register around 95.5%.

Batter up! It takes a special place to craft the #1 Bat in Major League Baseball. At Louisville Slugger Museum & Factory, experience history-in-the-making as you stroll through the actual factory where world-famous Louisville Slugger bats are created. The award-winning factory tour is a highlight of the visit here, but there’s plenty more to enjoy along with it.

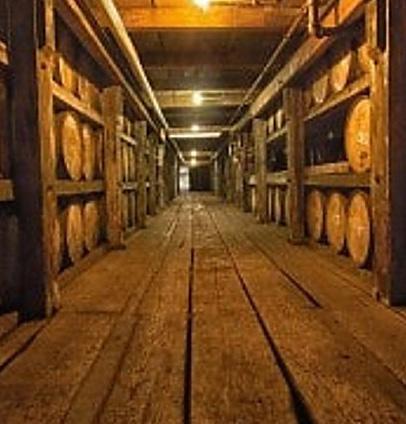
In 1783, our namesake opened Kentucky’s First Distillery on the banks of the Ohio River. Many years and barrels later, we still produce Bourbon the right way, using the same time-honored methods.

Fourth Street Live! is Louisville’s premier dining and entertainment destination, located in the heart of downtown Louisville, Kentucky. A short walk from historic downtown hotels, the Kentucky International Convention Center, Waterfront Park, the KFC YUM Center, Slugger Field, and much more, Fourth Street Live!


We are a city of hot browns and Ali, riverfront parks and Slugger bats. We throw parties for horse races and pronounce Louisville like we’ve already had a taste of bourbon.
We are a place of unique offerings and world-class attractions –and our Bourbon District is no exception.

Located in Downtown Louisville, the Bourbon District is a walkable urban experience for anyone looking for a taste of Kentucky. In the Bourbon District, you’re never more than 5 minutes away from the next attraction, so planning that group tour or birthday celebration just got a lot easier.


Attractions

Enjoy the Bourbon District, Downtown’s unique walkable experience. Whether you’re a Louisville native on an afternoon stroll, in town on business with a couple hours to spare, or a bourbon connoisseur looking to expand your palate, our Bourbon District distilleries will transport you through generations of history, community, and passion.


165,000 FACILITY CAPACITY
Located in South Louisville, Churchill Downs is a Thoroughbred racetrack known for hosting the annual Kentucky Derby. It is the world’s most legendary racetrack. The first Kentucky Derby and Kentucky Oaks were both held in 1875, which was the year that the racetrack opened. The racetrack at Churchill Downs is 147 acres and features a seven-furlong turf racecourse and a one-mile dirt, oval racetrack. The racetrack can accommodate over 165,000 guests on Derby Day.
147 ACRES OCCUPIED BY RACETRACK
$373M DIRECT ECONOMIC IMPACT
146 YEARS RUNNING