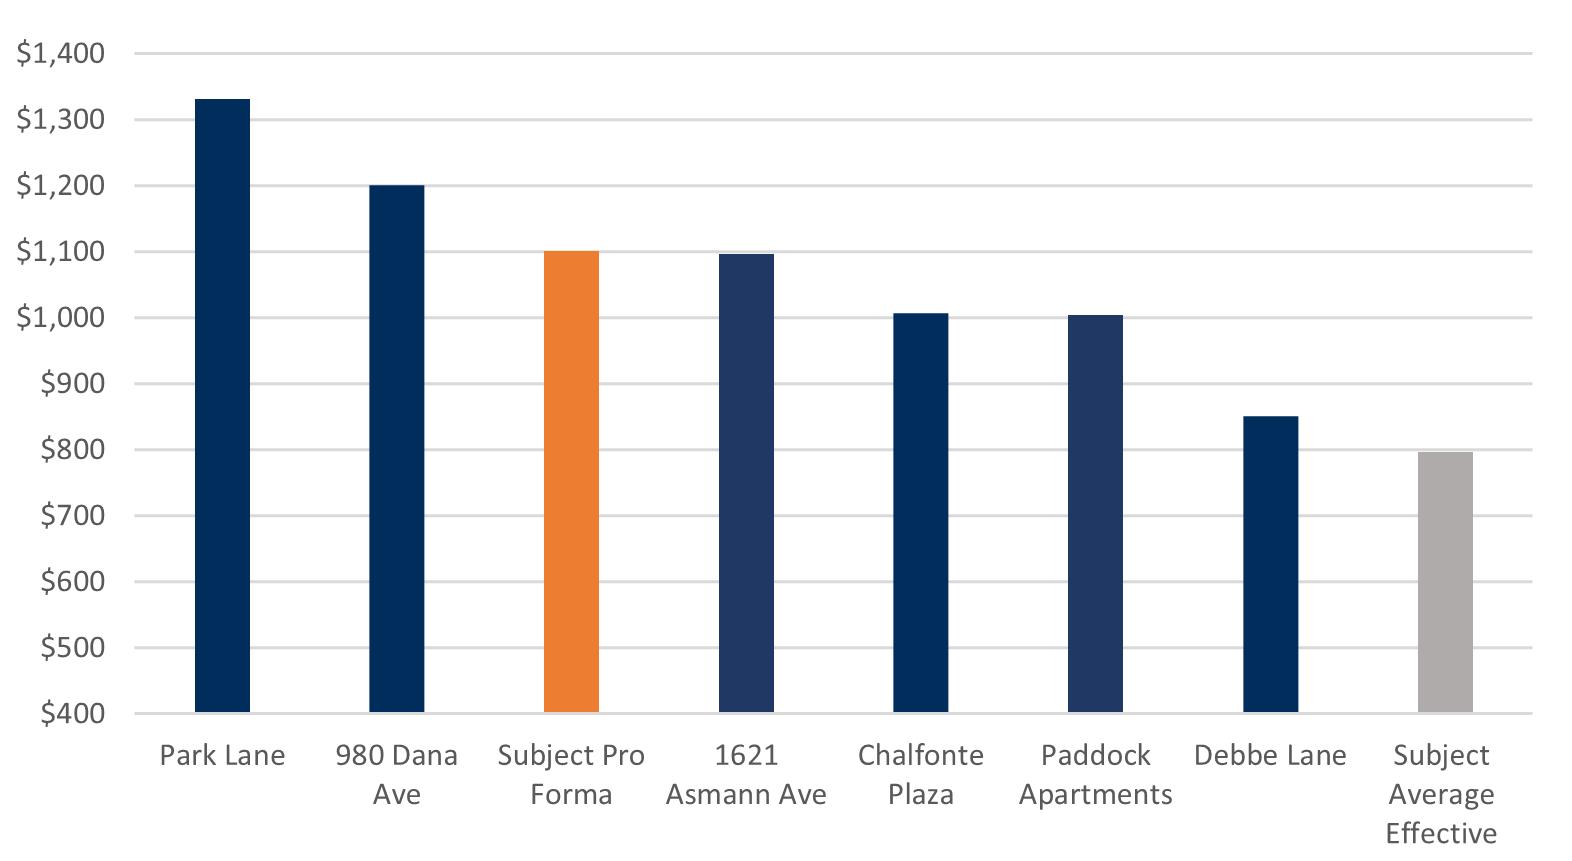
Asmann OM

Page 1

ASMANN 2024 OFFERING MEMORANDUM 1607 ASMANN AVE, CINCINNATI, OH

Alden Simms

Associate

Cincinnati Office

D. 513.878.7759

alden.simms@marcusmillichap.com

Austin Sum

Senior Associate

Cincinnati Office

D. 513.878.7747

austin.sum@marcusmillichap.com

Jordan Dickman

First Vice President Investments

Cincinnati Office

D. 513.878.7735

jordan.dickman@marcusmillichap.com

Nick Andrews

First Vice President Investments

Cincinnati Office

D. 513.878.7741

nicholas.andrews@marcusmillichap.com

LEAD
CONTENTS
AGENTS
The Investment Local Competitors Financials 06 10 14 SECTIONS
“OUR
COMMITMENT
HELP OUR CLIENTS CREATE
PRESERVE WEALTH BY PROVIDING THEM WITH
BEST REAL ESTATE INVESTMENT SALES, FINANCING, RESEARCH AND ADVISORY SERVICES AVAILABLE.” 300 WEST 4TH STREET, CINCINNATI, OH
IS TO
AND
THE

TOTAL VALUE OF RECENT LISTINGS CLOSED SALES IN MOST RECENT YEAR CLOSED FINANCINGS IN MOST RECENT YEARS

$86.3B $12.8B 12,272 2,143 VALUE OF RECENTLY CLOSED TRANSACTIONS
CALABASAS, CALIFORNIA | HQ 2,500 | EMPLOYEES 80+ | OFFICES
CINCINNATI DAYTON LEXINGTON LOUISVILLE
GLOBAL REACH, LOCAL EXPERTISE

YOUR TEAM

JORDAN DICKMAN

FIRST VICE PRESIDENTS DIRECTOR, NMHG

NICK ANDREWS

FIRST VICE PRESIDENTS DIRECTOR, NMHG

AUSTIN SUM

SENIOR INVESTMENT ASSOCIATE

AUSTIN Hall

INVESTMENT ASSOCIATE

ALDEN SIMMS

INVESTMENT ASSOCIATE

CORPORATE SUPPORT

LIZ POPP

MIDWEST OPERATIONS MANAGER

JOSH CARUANA

VICE PRESIDENT

REGIONAL MANAGER

INDIANAPOLIS | CINCINNATI | LOUISVILLE | ST LOUIS | KANSAS CITY

JOHN SEBREE

SENIOR VICE PRESIDENT

NATIONAL DIRECTOR

NATIONAL MULTI HOUSING GROUP

MICHAEL GLASS

SENIOR VICE PRESIDENT

MIDWEST DIVISION MANAGER

NATIONAL DIRECTOR, MANUFACTURED HOME COMMUNITIES GROUP

BROKER SUPPORT

SAM PETROSino

VALUATION & RESEARCH

BRETT MARTIN

INTERNAL ACCOUNTANT

BRITTANY CAMPBELL-KOCH

DIRECTOR OF OPERATIONS

ALEX PAPA

MARKETING COORDINATOR

DATA SUMMARY

Property Address: 1607 Asmann Ave. City, State, Zip: Cincinnati, OH 45229 Submarket: North Avondale County: Hamilton Year Built: 1945 Number Of Units: 29 Avg Unit Size: 852 Rentable Sqft: 24,700 Number of Parcels: 1 Lot Size (Acres): 1.184 # of Buildings: 1 # of Stories: 2 Current Occupancy: 72% Foundation: Concrete Framing: Wood Roof Type/Age: Pitch-Shingled Exterior of Building: Brick Windows Age/Pane: Double-Hung Wiring: Copper
01 SECTION - THE INVESTMENT

RENT MATRIX | ONE BED

Parkview Manor $750 1625 Asmann Ave $950 Asmann $709 Paddock Apts $746 Chalfonte Plaza $850 985 Dana Ave $999 Park Lane $1,128 Debbe Lane $750
02 SECTIONLOCAL COMPETITORS One Bedroom Property Year Built # Units Avg SF Avg Rent Avg Rent/SF Park Lane 1964 150 575 $1,128 $1.96 985 Dana Avenue 1900 7 600 $999 $1.67 1625 Asmann Ave 1940 16 750 $950 $1.27 Subject Pro Forma 1963 29 650 $900 $1.38 Chalfonte Plaza 1965 45 750 $850 $1.13 Park View Manor 1905 48 725 $750 $1.03 Debbe Lane 1938 20 560 $750 $1.34 Paddock Apartments 1961 45 667 $746 $1.12 Subject Average Effective 1963 29 650 $709 $1.09 Market Average 1944 43 659 $865 $1.33

RENT MATRIX | TWO BED

1625 Asmann Ave $1,095 980 Dana Ave $1,200 Paddock Apts $1,004 Chalfonte Plaza $1,006 Park Lane $1,330 Debbe Lane $850 Dana Square $995 Asmann $796
02 SECTIONLOCAL COMPETITORS
Property Year Built # Units Avg SF Avg Rent Avg Rent/SF Park Lane 1964 150 750 $1,330 $1.77 980 Dana Ave 1920 5 700 $1,200 $1.71 Subject Pro Forma 1963 29 900 $1,100 $1.22 1621 Asmann Ave 1940 18 850 $1,095 $1.29 Chalfonte Plaza 1965 45 900 $1,006 $1.12 Paddock Apartments 1961 45 1000 $1,004 $1.00 Debbe Lane 1938 48 825 $850 $1.03 Subject Average Effective 1963 29 900 $796 $0.88 Market Average 1952 46 841 $1,035 $1.26
Two Bedroom

UNIT MIX BREAKDOWN

AVERAGE EFFECTIVE MARKET PROJECTED UNIT TYPE NO. OF UNITS RENTABLE SF TOTAL SF RENT/UNIT RENT/SF TOTAL RENT POTENTIAL RENT/UNIT RENT/SF TOTAL RENT POTENTIAL RENT/UNIT RENT/SF TOTAL RENT POTENTIAL One Bedroom 1BR/1BA 8 Units 650 SF 5,200 SF $709.38 $1.09 SF $5,675 $750.00 $1.15 SF $6,000 $900.00 $1.38 SF $7,200 Totals / Wtd. Averages 8 Units 650 SF 5,200 SF $709.38 $1.09 SF $5,675 $750.00 $1.15 SF $6,000 $900.00 $1.38 SF $7,200 Two Bedroom 2BR/1BA 20 Units 900 SF 18,000 SF $795.83 $0.88 SF $15,917 $950.00 $1.06 SF $19,000 $1,100.00 $1.22 SF $22,000 Totals / Wtd. Averages 20 Units 900 SF 18,000 SF $795.83 $0.88 SF $15,917 $950.00 $1.06 SF $19,000 $1,100.00 $1.22 SF $22,000 Four Bedroom 4BR/1BA 1 Units 1,500 SF 1,500 SF $1,200.00 $0.80 SF $1,200 $1,200.00 $0.80 SF $1,200 $1,500.00 $1.00 SF $1,500 Totals / Wtd. Averages 1 Units 1,500 SF 1,500 SF $1,200.00 $0.80 SF $1,200 $1,200.00 $0.80 SF $1,200 $1,500.00 $1.00 SF $1,500 Summary One Bedroom 8 Units 650 SF 5,200 SF $709.38 $1.09 $5,675 $750.00 $1.15 SF $6,000 $900.00 $1.38 SF $7,200 Two Bedroom 20 Units 900 SF 18,000 SF $795.83 $0.88 $15,917 $950.00 $1.06 SF $19,000 $1,100.00 $1.22 SF $22,000 Four Bedroom 1 Units 1,500 SF 1,500 SF $1,200.00 $0.80 $1,200 $1,200.00 $0.80 SF $1,200 $1,500.00 $1.00 SF $1,500 Totals / Wtd. Averages 29 Units 852 SF 24,700 SF $785.92 $0.92 SF $22,792 $903.45 $1.06 SF $26,200 $1,058.62 $1.24 SF $30,700 03 SECTION - THE FINANCIALS
ASMANN - financials
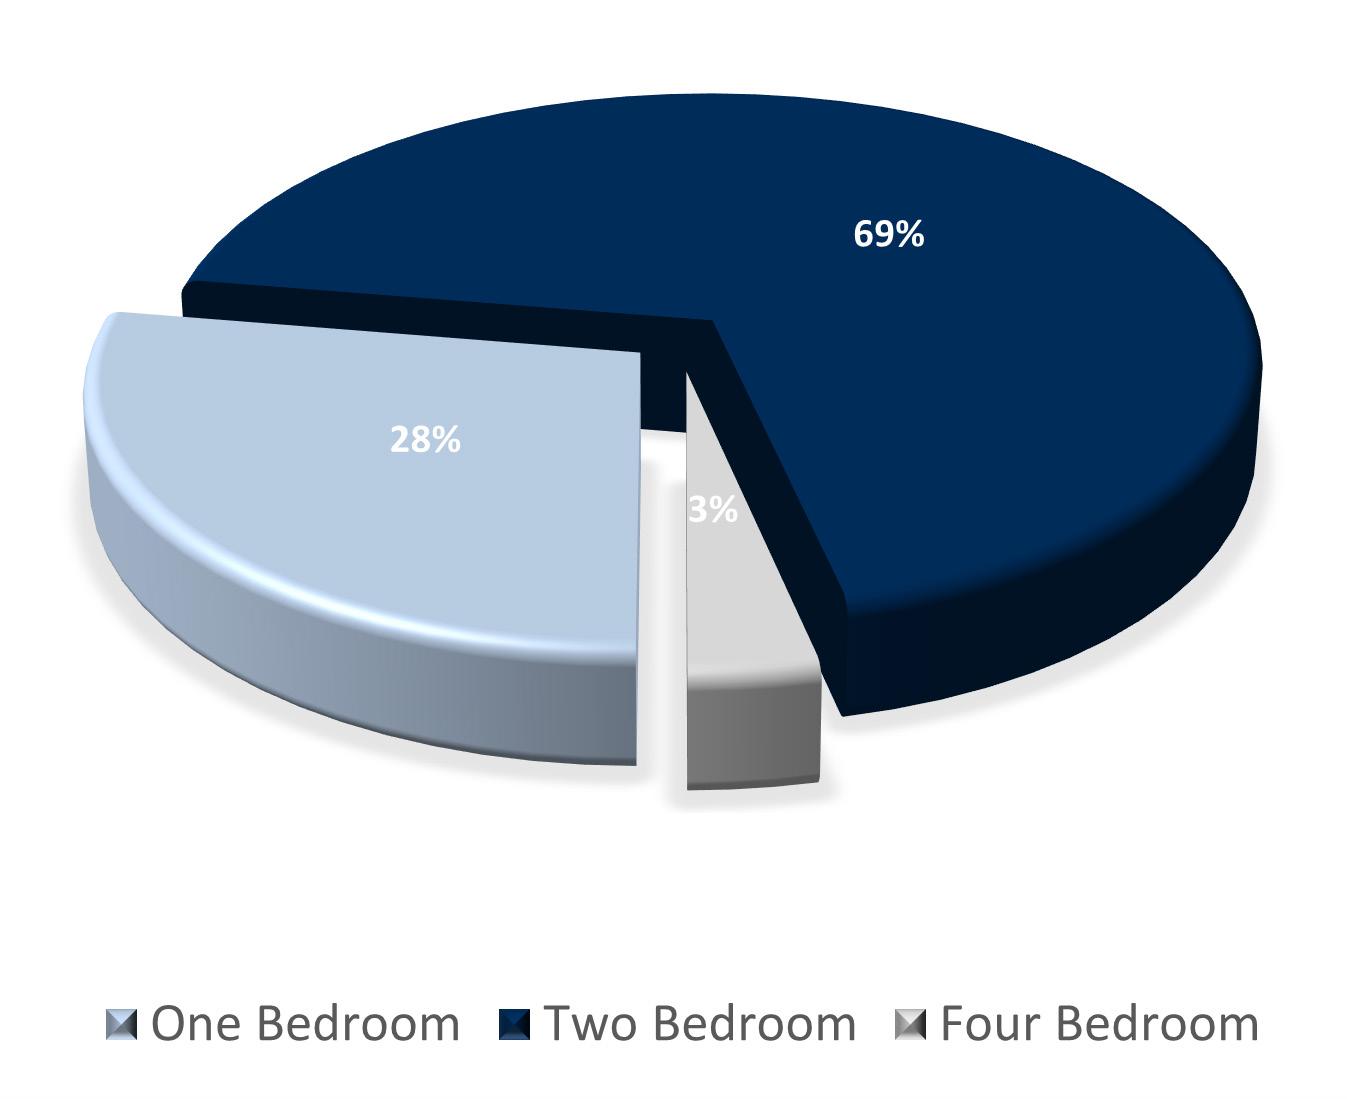
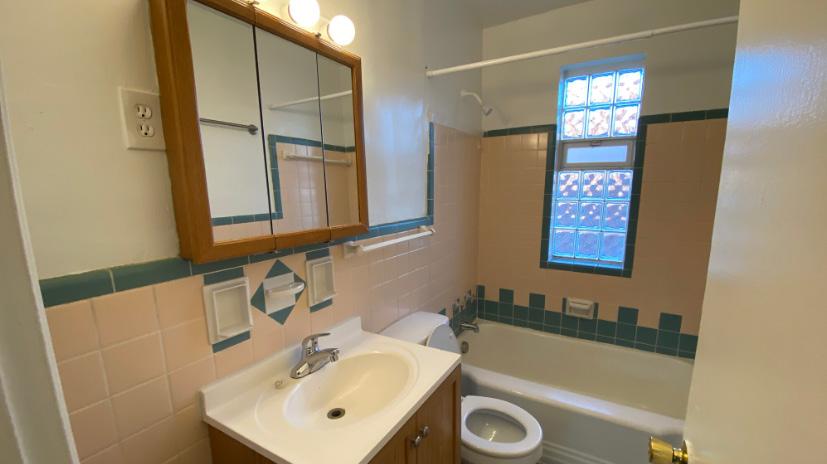
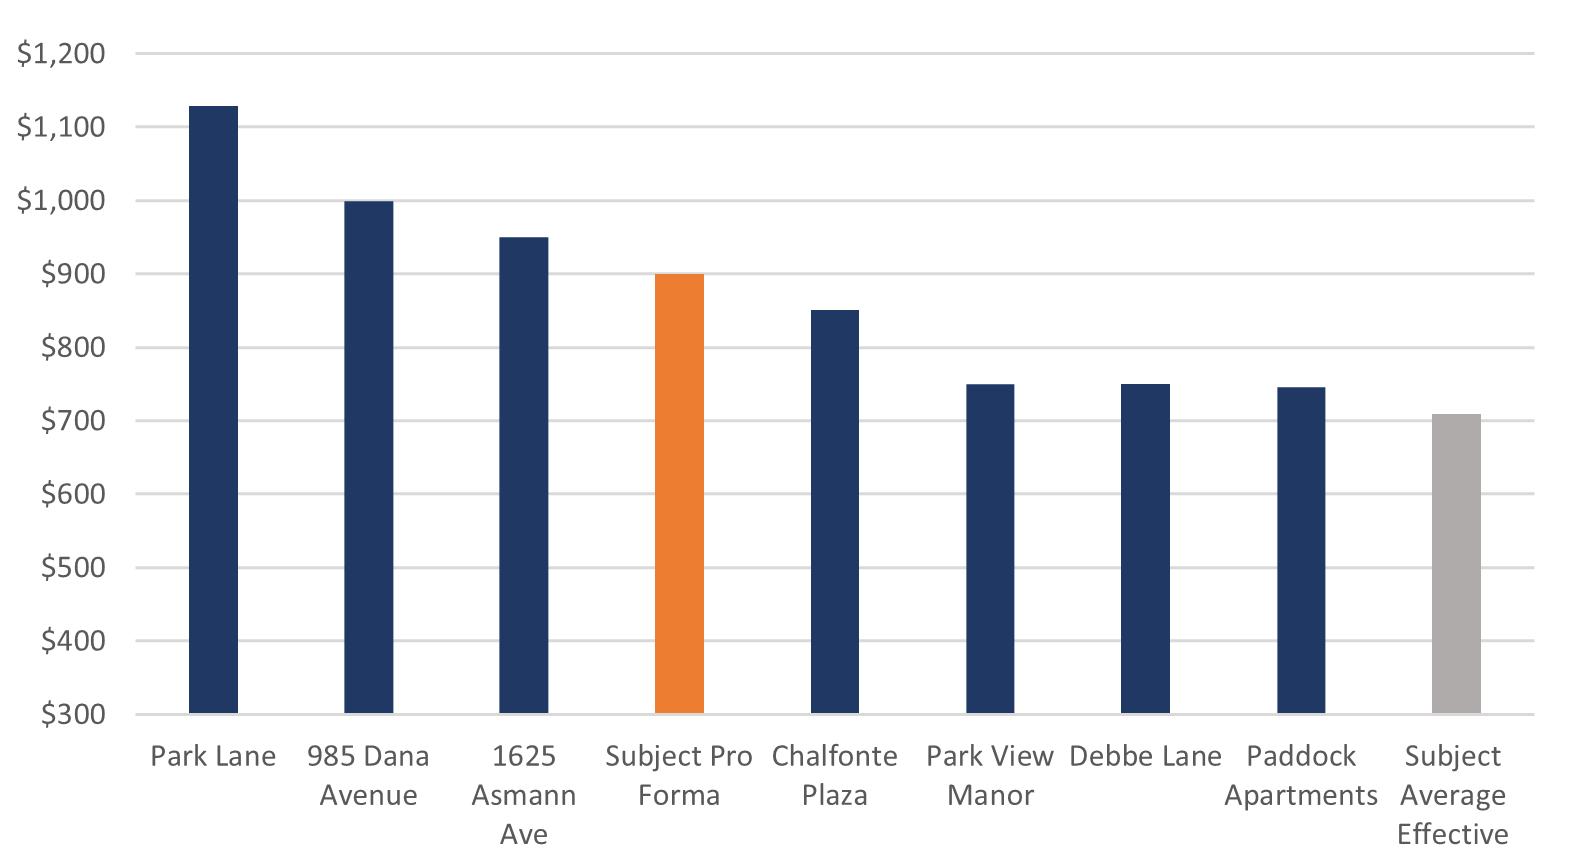
UNIT DISTRIBUTION UNIT RENTS

NON-CONTROLLABLE

CONTROLLABLE

CURRENT RENT ROLL: AS OF MARCH 1, 2024 INCOME AND EXPENSES: JANUARY 2023 - DECEMBER 2023 GROSS POTENTIAL RENT % of GPR Per Unit All Units at Market Rent $243,456 T12 8,395 Gain (Loss) to Lease ($890) T12 0.37% (31) GROSS SCHEDULED RENT $242,566 T12 8,364 TOTAL OTHER INCOME $1,810 0.75% 62 GROSS POTENTIAL INCOME $244,376 8,427 Physical Vacancy ($54,925) T12 22.64% (1,894) Bad Debt ($36,500) T12 15.05% (1,259) EFFECTIVE GROSS INCOME $152,951 61.94% 5,274
ASMANNfinancials
Real Estate Taxes % of EGI Per Unit 2023 Taxes $12,653 Auditor 8.27% 436 Total Real Estate Taxes $12,653 8.27% 436 Insurance $6,667 T12 4.36% 230 Utilities Gas & Electric $14,143 T12 9.25% 488 Water & Sewage $12,127 T12 7.93% 418 Trash Removal $4,622 T12 3.02% 159 Utilities $30,892 20.20% 1,065 Total Non-Controllable $50,213 32.83% 1,731
Contract Services Security Expense $1,800 T12 1.18% 62 Landscaping/Grounds/Snow $4,879 T12 3.19% 168 Pest Control $3,415 T12 2.23% 118 Total Contract Services $10,094 6.60% 348 Repairs & Maintenance $38,553 T12 25.21% 1,329 Marketing & Promotion $0 0.00% 0 Labor $750 T12 0.49% 26 General & Administrative $0 0.00% 0 Management Fee $10,254 T12 6.70% 354 Replacement & Reserves $8,700 Note 1 5.69% 300 Total Controllable $68,351 44.69% 2,357 TOTAL EXPENSES $118,564 77.52% 4,088 NET OPERATING INCOME $34,388 22.48% 1,186 EXPENSE INCOME UNDERWRITING NOTES # NOTE 1 Replacement & Reserves: added based on market norm of $255 per unit per year
YEAR 1 YEAR 2 YEAR 3 % of GPR Per Unit % of GPR Per Unit % of GPR Per Unit $368,400 12,703 $379,452 13,085 $390,836 13,477 ($18,420) 5.00% (635) ($7,589) 2.00% (262) ($7,817) 2.00% (270) $349,980 12,068 $371,863 12,823 $383,019 13,208 $1,865 0.53% 64 $1,921 0.52% 66 $1,978 0.52% 68 $351,845 12,133 $373,783 12,889 $384,997 13,276 ($34,998) 10.00% (1,207) ($18,593) 5.00% (641) ($19,151) 5.00% (660) ($7,000) 2.00% (241) ($7,437) 2.00% (256) ($7,660) 2.00% (264) $309,847 83.00% $347,753 91.00% 11,991 $358,186 91.00% 12,351 % of EGI % of EGI Per Unit % of EGI $12,653 4.43% 436 $12,653 3.95% 436 $12,653 3.95% 436 $12,653 4.43% 436 $12,653 3.95% 436 $12,653 3.95% 436 $11,600 4.06% 400 $11,832 3.69% 408 $12,069 3.76% 416 $14,426 5.05% 497 $14,714 4.59% 507 $15,009 4.68% 518 $12,370 4.33% 427 $12,617 3.93% 435 $12,869 4.01% 444 $4,715 1.65% 163 $4,809 1.50% 166 $4,905 1.53% 169 $31,510 11.03% 1,087 $32,140 10.02% 1,108 $32,783 10.22% 1,130 $55,763 19.51% 1,923 $56,625 17.66% 1,953 $57,505 17.93% 1,983 $1,740 0.61% 60 $1,775 0.55% 61 $1,810 0.56% 62 $2,900 1.01% 100 $2,958 0.92% 102 $3,017 0.94% 104 $1,450 0.51% 50 $1,479 0.46% 51 $1,509 0.47% 52 $6,090 2.13% 210 $6,212 1.94% 214 $6,336 1.98% 218 $17,400 5.62% 600 $17,748 5.10% 612 $18,103 5.21% 624 $1,450 0.47% 50 $1,479 0.43% 51 $1,509 0.43% 52 $26,100 8.42% 900 $26,622 7.66% 918 $27,154 7.81% 936 $2,900 0.94% 100 $2,958 0.85% 102 $3,017 0.87% 104 $20,140 6.50% 694 $22,604 6.50% 779 $23,282 6.50% 779 $8,874 2.86% 306 $9,051 2.60% 312 $9,233 2.65% 318 $82,954 26.77% 2,860 $86,674 24.92% 2,989 $88,634 25.29% 3,033 $138,717 44.77% 4,783 $143,300 41.21% 4,941 $146,139 42.02% 5,039 $171,130 55.23% 5,901 $204,453 58.79% 7,050 $212,047 60.98% 7,312
CURRENT YR 1 YR 2 YR 3 YR 4 YR 5 YR 6 YR 7 YE APR-2025 YE APR-2026 YE APR-2027 YE MAR-2028 YE MAR-2029 YE MAR-2030 YE MAR-2031 GROSS POTENTIAL RENT All Units at Market Rent $243,456 $368,400 $379,452 $390,836 $402,561 $414,637 $427,077 $439,889 Gain (Loss) to Lease ($890) ($18,420) ($7,589) ($7,817) ($8,051) ($8,293) ($8,542) ($8,798) GROSS SCHEDULED RENT $242,566 $349,980 $371,863 $383,019 $394,509 $406,345 $418,535 $431,091 TOTAL OTHER INCOME $1,810 $1,865 $1,921 $1,978 $2,018 $2,058 $2,099 $2,141 GROSS POTENTIAL INCOME $244,376 $351,845 $373,783 $384,997 $396,527 $408,403 $420,634 $433,232 Physical Vacancy ($54,925) ($34,998) ($18,593) ($19,151) ($19,725) ($20,317) ($20,927) ($21,555) Bad Debt ($36,500) ($7,000) ($7,437) ($7,660) ($7,890) ($8,127) ($8,371) ($8,622) EFFECTIVE GROSS INCOME $152,951 $309,847 $347,753 $358,186 $368,911 $379,959 $391,337 $403,056 Real Estate Taxes $12,653 $12,653 $12,653 $12,653 $12,906 $13,164 $13,428 $13,696 Insurance $6,667 $11,600 $11,832 $12,069 $12,310 $12,556 $12,807 $13,063 Utilities $30,892 $31,510 $32,140 $32,783 $33,439 $34,108 $34,790 $35,485 Contract Services $10,094 $6,090 $6,212 $6,336 $6,463 $6,592 $6,724 $6,858 Repairs & Maintenance $38,553 $17,400 $17,748 $18,103 $18,465 $18,834 $19,211 $19,595 Marketing & Promotion $0 $1,450 $1,479 $1,509 $1,539 $1,570 $1,601 $1,633 Labor $750 $26,100 $26,622 $27,154 $27,698 $28,251 $28,817 $29,393 General & Administrative $0 $2,900 $2,958 $3,017 $3,078 $3,139 $3,202 $3,266 Management Fee $10,254 $20,140 $22,604 $23,282 $23,979 $24,697 $25,437 $26,199 Replacement & Reserves $8,700 $8,874 $9,051 $9,233 $9,417 $9,606 $9,798 $9,994 TOTAL EXPENSES $118,564 $138,717 $143,300 $146,139 $149,293 $152,517 $155,813 $159,183 NET OPERATING INCOME $34,388 $171,130 $204,453 $212,047 $219,619 $227,441 $235,524 $243,873 INCOME EXPENSE ASMANNfinancials CASH
Tax Breakdown Property Address Parcel ID Year Built Acres Market Value Assessed Value Tax Rate Taxes Payable Land Use Code 1607 Asmann Ave. 109-0005-0069-00 1945 1.18 $438,240 $153,380 82.074213 $12,653.12 402 - Apartment, 20-39 Units Total 1.18 $438,240 $153,380 $12,653.12
FLOW
CASH FLOW PROJECTION GROWTH RATE ASSUMPTIONS YR 1 YR 2 YR 3 YR 4 YR 5 INCOME Gross Potential Rent 51.32% 3.00% 3.00% 3.00% 3.00% (Loss) / Gain to Lease* 5.00% 2.00% 2.00% 2.00% 2.00% Other Income 3.00% 3.00% 3.00% 3.00% 3.00% EXPENSES Expenses 2.00% 2.00% 2.00% 2.00% Management Fee** 6.50% 6.50% 6.50% 6.50% 6.50% CASH FLOW PROJECTION GROWTH RATE ASSUMPTIONS YR 1 YR 2 YR 3 YR 4 YR 5 Physical Vacancy 10.00% 5.00% 5.00% 5.00% 5.00% Non-Revenue Units 0.00% 0.00% 0.00% 0.00% 0.00% Bad Debt 2.00% 2.00% 2.00% 2.00% 2.00% Concessions Allowance 0.00% 0.00% 0.00% 0.00% 0.00% Total Economic Loss 12.00% 7.00% 7.00% 7.00% 7.00%

CINCINNATI

THE ECONOMY

1| Prior to the pandemic, Cincinnati’s real gross metropolitan product grew at an average annual rate of 2.1% from 2015 to 2019. During that same five-year period, job growth averaged 1.4% annually, with roughly 15,500 jobs added on average each year. In 2020, COVID-19 mitigation measures and limited business activity caused the local economy to contract as much as 8.4% year-over-year in 2nd quarter. 2| In 2023, the metro’s inflation-adjusted economic output expanded 2.3%. 3| The metro recorded a net gain of 21,100 jobs, expanding the employment base 1.8%. 4| Cincinnati’s unemployment rate in November 2023 was unchanged year-over-year at 3.0%, below the national average of 3.5%. 5| Despite job losses stemming from the pandemic, Cincinnati’s current employment base now sits roughly 63,700 jobs or about 6% above the pre-pandemic level in February 2020.

3,263 units completed in past 12 months

5,184 units currently in progress

HIGHEST OVERALL PERFORMING SUBMARKET

RENT

1| Over the past five years, annual change in effective asking rents in Cincinnati ranged from 2.0% to 11.9%. 2| In 4th quarter 2023, effective asking rents for new leases were up 3.6% year-over- year. That annual rent performance was below the market’s five-year average of 5.7%. 3| Cincinnati’s recent annual rent change performance ranked #10 in the Midwest region and #27 nationally. 4| Looking at product classes in Cincinnati, Class B led for rent performance over the past five years. In 4th quarter 2023, annual effective rent change registered at 2.5% in Class A units, 3.4% in Class B units and 5.8% in Class C units. 5| Among submarkets, the strongest annual rent change performances over the past year were in West Cincinnati and Southeast Cincinnati. 6| The weakest performances were in Central Cincinnati, Butler County and North Central Cincinnati. Over the past five years, rent growth was strongest in Southeast Cincinnati.

LOCAL MARKET
Q4 2023 MARKET
Pre-1970s 1970s 1980s 1990s 2000+ Occupancy 93.8% 95.4% 96.2% 94.8% 94.7% Y-O-Y Rent Growth 5.2% 3.5% 3.4% 3.0% 3.5% Average Rent Per Unit $1,094 $1,148 $1,283 $1,367 $1,732
SNAPSHOT
SUBMARKETS RENT OCCUPANCY YOY Dent/Harrison $1,147 97.6% 11.0% Roselawn $1,022 92.5% 8.5% Mt Washington $1,155 94.7% 8.3% Mt Healthy $1,123 96.7% 8.1% Middletown/Franklin $969 94.1% 7.3%

SUPPLY

OCCUPANCY

SCAN FOR MORE

1| New apartment completions in Cincinnati were moderate recently, as 3,263 units delivered in 2023. That annual completion volume was a 24-year high. 2| With 150 units removed from existing stock over the past year, the local inventory base grew 1.9%. In the past year, supply was greatest in North Central Cincinnati. 3| Annual new supply averaged 1,754 units, and annual inventory growth averaged 1.0% over the past five years. During that period, new supply was concentrated in Central Cincinnati and Campbell/Kenton Counties, which received 42% of the market’s total completions. 4| At the end of 2023, there were 5,184 units under construction with 3,531 of those units scheduled to complete in the next four quarters. Scheduled deliveries in the coming year are expected to be concentrated in Central Cincinnati. 1| Occupancy in the Cincinnati apartment market has ranged from 94.9% to 98.2% over the past five years, averaging 96.4% during that period. 2| Over the past year, occupancy lost 1.2 points, with the 4th quarter 2023 rate landing at 94.9%. 3| Looking at product classes in Cincinnati, 4th quarter 2023 occupancy registered at 94.1% in Class A units, 94.9% in Class B units and 95.6% in Class C units. 4| Occupancy in Class C product was generally tightest over the past five years. 5| Among submarkets, 4th quarter 2023 occupancy was strongest in Southeast Cincinnati and Campbell/Kenton Counties. 6|

The weakest readings were seen in Central Cincinnati and North Central Cincinnati. During the coming year, occupancy in Cincinnati is expected to register around 95%.

UNDER CONSTRUCTION SECTOR UNITS Central Cincinnati 1,747 Northeast Cincinnati/Warren County 811 Boone County/Erlanger 769 Campbell/Kenton Counties 497 Butler County 482 TOTAL FUTURE INVENTORY GROWTH SUBMARKET CHANGE Central Cincinnati 11.9% Boon County/Erlanger 7.0% Northeast Cincinnati/Warren County 4.8% Campbell/Kenton Counties 2.9% Butler County 2.4%
UNITS
SUBMARKETS RENT OCCUPANCY YOY Dent/Harrison $1,147 97.6% 11.0% Roselawn $1,022 92.5% 8.5% Mt Washington $1,155 94.7% 8.3% Mt Healthy $1,123 96.7% 8.1% Middletown/Franklin $969 94.1% 7.3%
HIGHEST OVERALL PERFORMING SUBMARKET
SUBMARKETS RENT OCCUPANCY YOY Fort Mitchell/Crescent Springs $1,162 96.1% 1.0% Fairfield $1,291 94.2% 1.0% Covington/Newport $1,608 93.9% 0.8% Clifton $1,038 90.6% -0.5% Downtown $1,786 94.6% -0.8
LOWEST OVERALL PERFORMING SUBMARKETS

ASMANN

Turn static files into dynamic content formats.

Create a flipbook
Asmann OM by Jordan.Dickman - Issuu