315 BALLPARK offering memorandum


Brian Johnston
Associate
Cincinnati Office
D. 513.878.7704

brian.johnston@marcusmillichap.com
Jordan Dickman
First Vice President Investments
Cincinnati Office
D. 513.878.7735
jordan.dickman@marcusmillichap.com
Nick Andrews
First Vice President Investments
Cincinnati Office
D. 513.878.7741
nicholas.andrews@marcusmillichap.com
Austin Sum
Senior Associate

Cincinnati Office

D. 513.878.7747
austin.sum@marcusmillichap.com
“OUR COMMITMENT IS TO HELP OUR CLIENTS CREATE


AND PRESERVE WEALTH BY PROVIDING THEM WITH
THE BEST REAL ESTATE INVESTMENT SALES, FINANCING, RESEARCH AND ADVISORY SERVICES AVAILABLE.”
06 16 28 36


THIS IS A BROKER PRICE OPINION OR COMPARATIVE MARKET ANALYSIS OF VALUE AND SHOULD NOT BE CONSIDERED AN APPRAISAL. This information has been secured from sources we believe to be reliable, but we make no representations or warranties, express or implied, as to the accuracy of the information. References to square footage or age are approximate. Buyer must verify the information and bears all risk for any inaccuracies.
Marcus & Millichap is not affiliated with, sponsored by, or endorsed by any commercial tenant or lessee identified in this marketing package. The presence of any corporation’s logo or name is not intended to indicate or imply affiliation with, or sponsorship or endorsement by, said corporation of Marcus & Millichap, its affiliates or subsidiaries, or any agent, product, service, or commercial listing of Marcus & Millichap, and is solely included for the purpose of providing tenant lessee information about this listing to prospective customers.

JORDAN DICKMAN
FIRST VICE PRESIDENTS DIRECTOR, NMHG
NICK ANDREWS
FIRST VICE PRESIDENTS DIRECTOR, NMHG
LIZ POPP
MIDWEST OPERATIONS MANAGER
JOSH CARUANA
VICE PRESIDENT
REGIONAL MANAGER
INDIANAPOLIS | CINCINNATI | LOUISVILLE | ST LOUIS | KANSAS CITY
AUSTIN SUM
SENIOR INVESTMENT ASSOCIATE
BRIAN JOHNSTON
INVESTMENT ASSOCIATE
AUSTIN Hall
INVESTMENT ASSOCIATE
ALDEN SIMMIS
INVESTMENT ASSOCIATE
SAM PETROSino
VALUATION & RESEARCH
SKLYER WILSON
CLIENT RELATIONS MANAGER
JOHN SEBREE
SENIOR VICE PRESIDENT
NATIONAL DIRECTOR
NATIONAL MULTI HOUSING GROUP
MICHAEL GLASS
SENIOR VICE PRESIDENT
MIDWEST DIVISION MANAGER
NATIONAL DIRECTOR, MANUFACTURED HOME COMMUNITIES GROUP
BRITTANY CAMPBELL-KOCH
DIRECTOR OF OPERATIONS
ALEX PAPA
MARKETING COORDINATOR

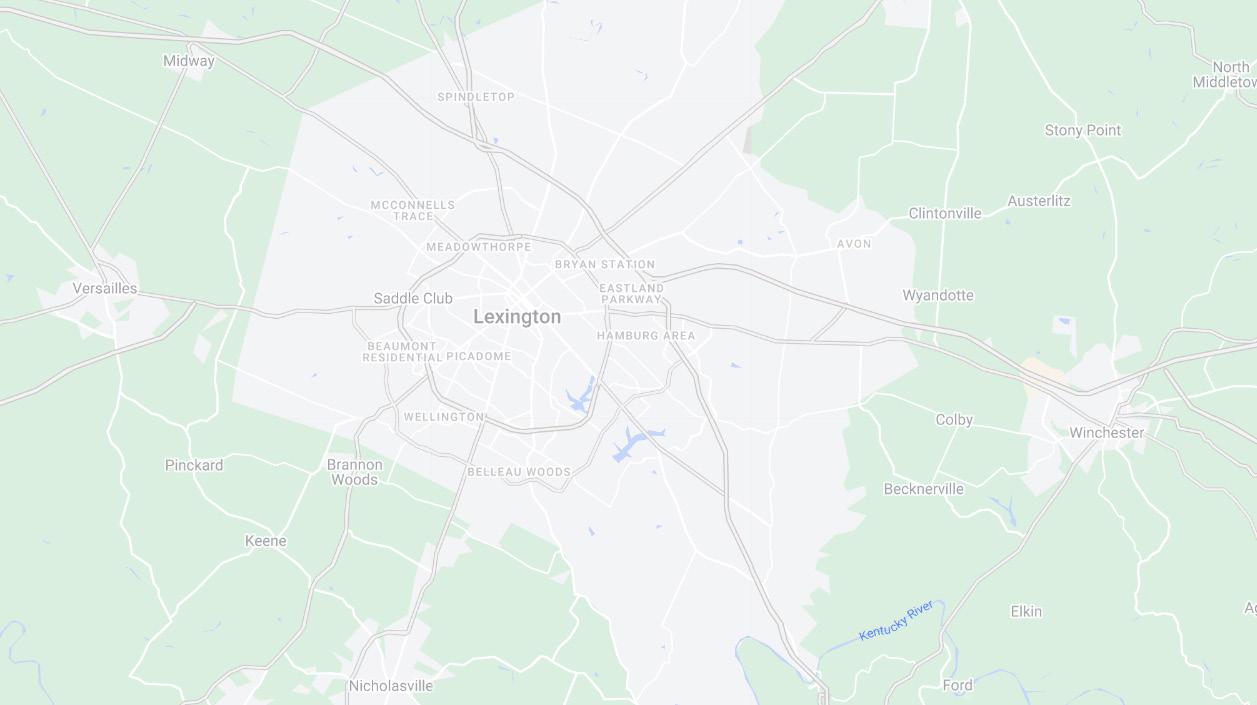
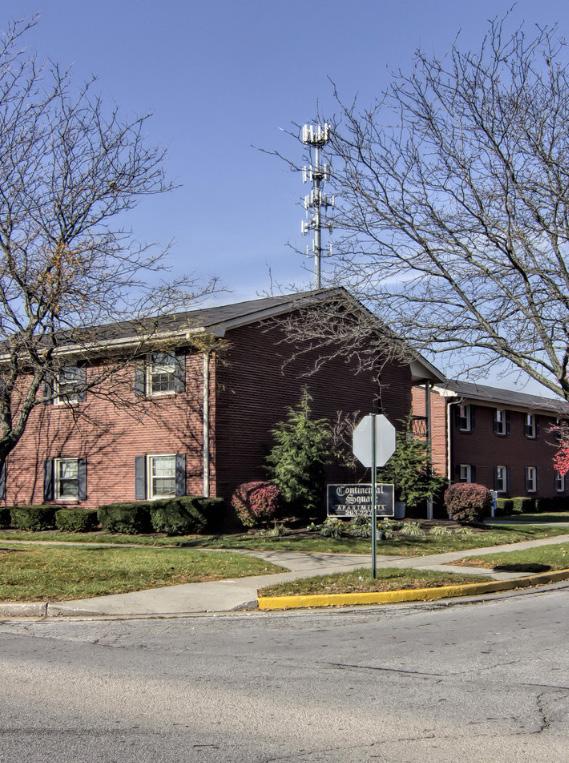
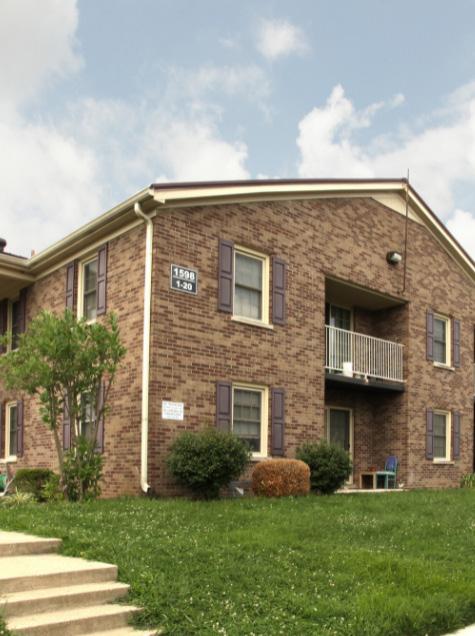
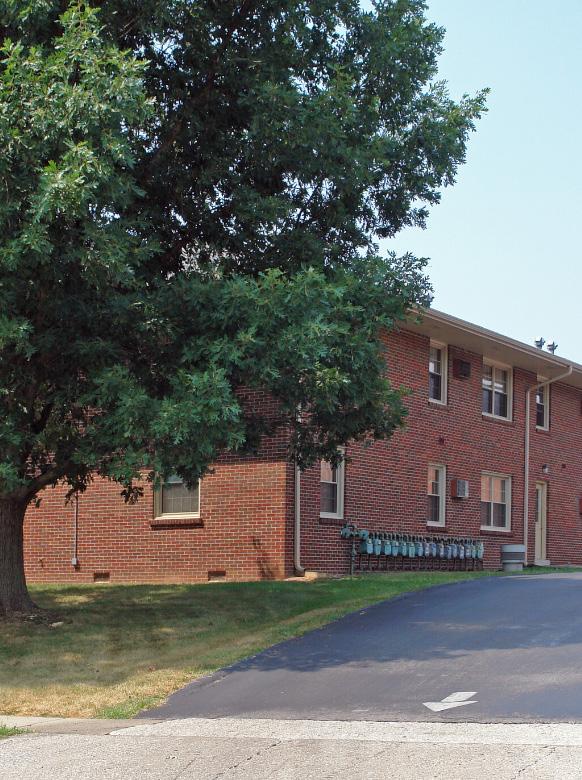
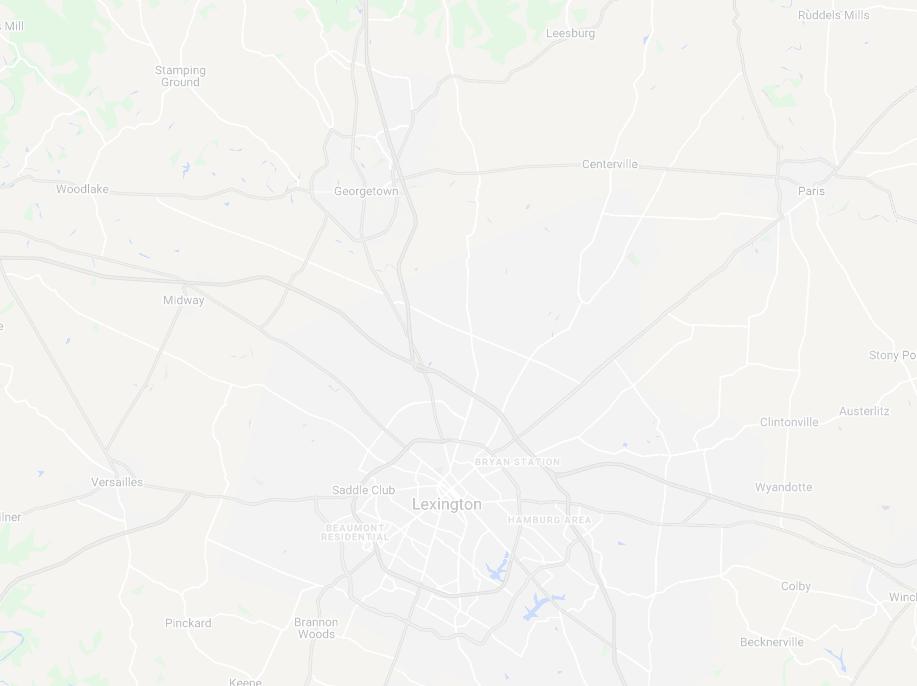
Property Address: 315 Ballpark Dr.
City, State, Zip: Lexington, KY 40505
County: Fayette
Year Built/Reno: 1963/2021
Number Of Units: 18
Avg Unit Size: 528
Rentable Sqft: 9500
Number of Parcels: 1
Lot Size (Acres): 0.1745
Density: 103.1518625
# of Buildings: 1
# of Stories: 2
Current Occupancy: 89%
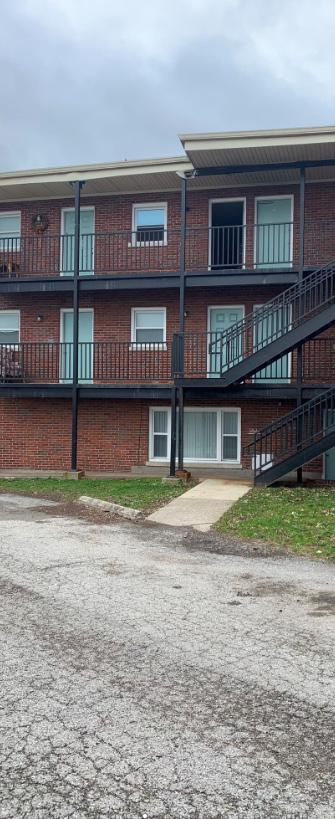
Parking Type: Off-Street & Street
Parking Surface: Concrete Foundation: Concrete
Framing: Wood
Roof Type/Age: Flat-Rubberized
Exterior of Building: Brick
Windows Age/Pane: Double-Hung / 2021
Wiring: Copper
UTILITIES
Electric: Owner
Gas: Owner
Water/Sewer: Owner
Cable/Internet: Tenant
Trash: Owner
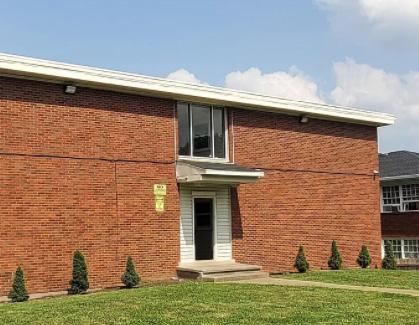
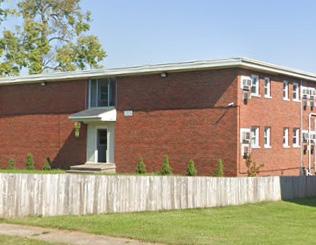
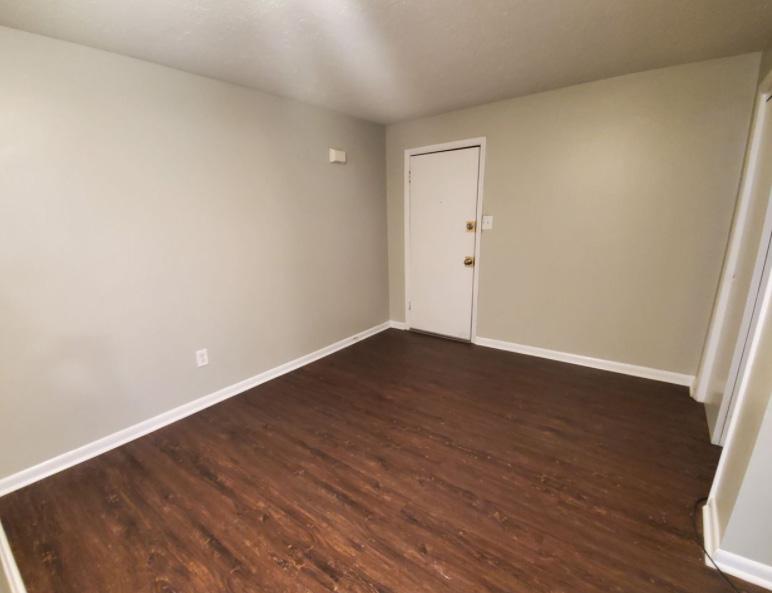
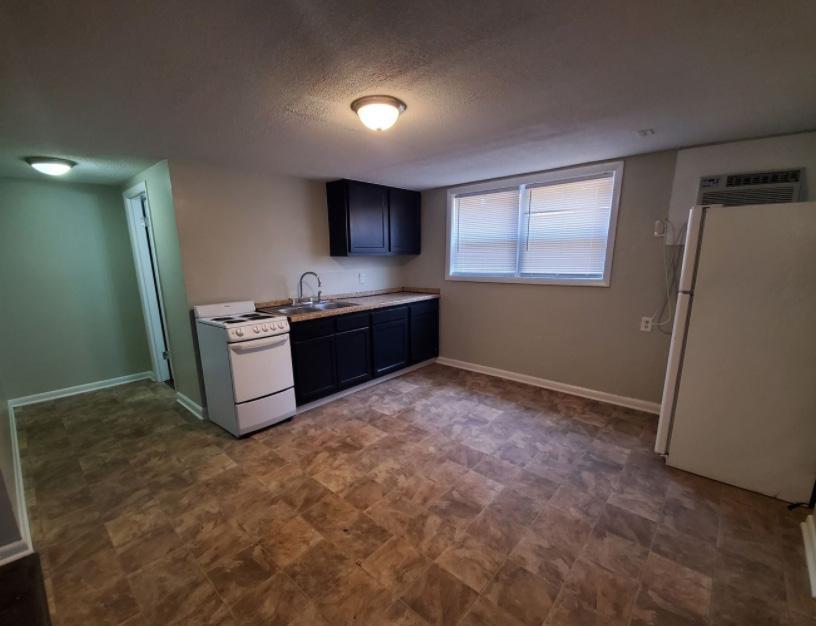
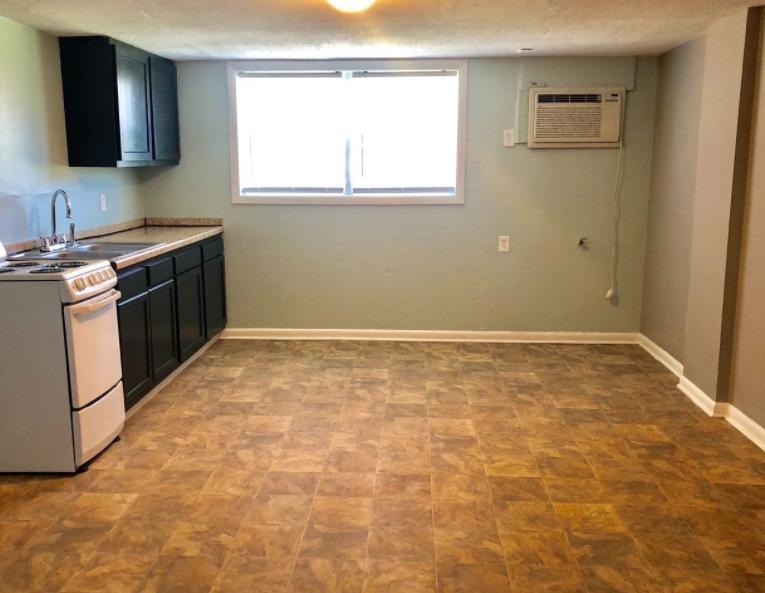
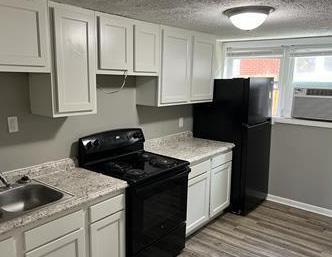
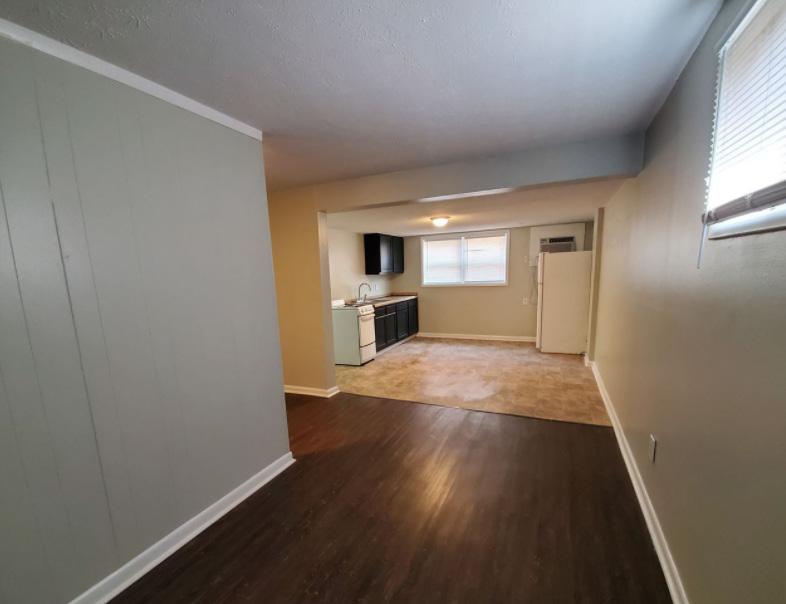
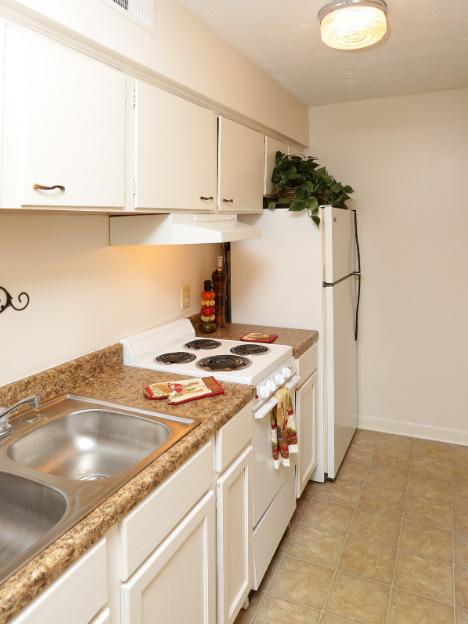
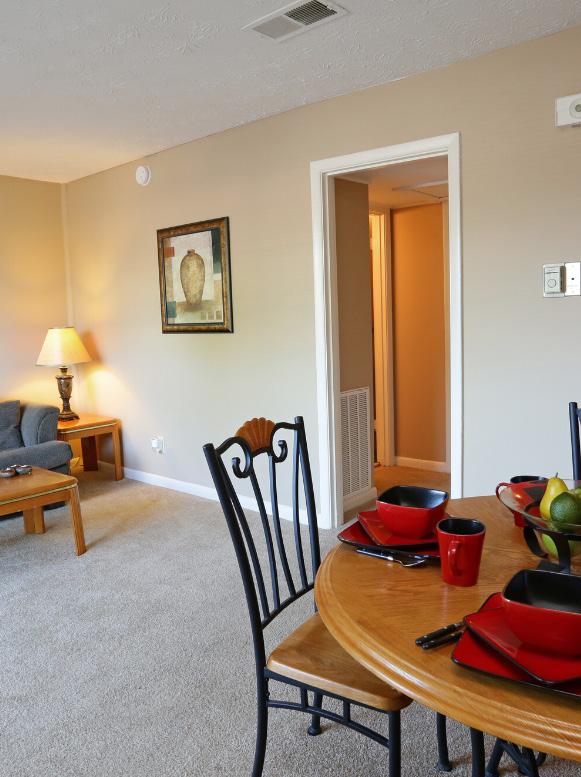
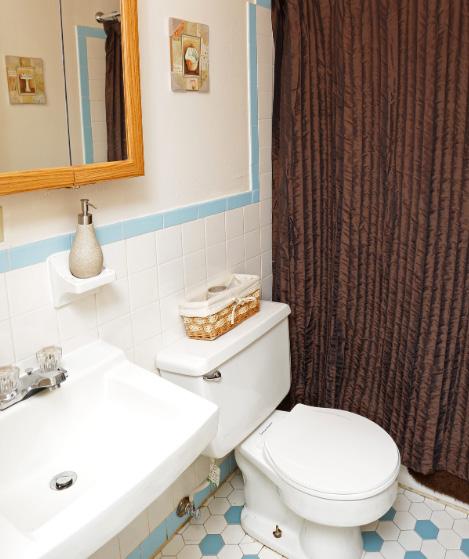
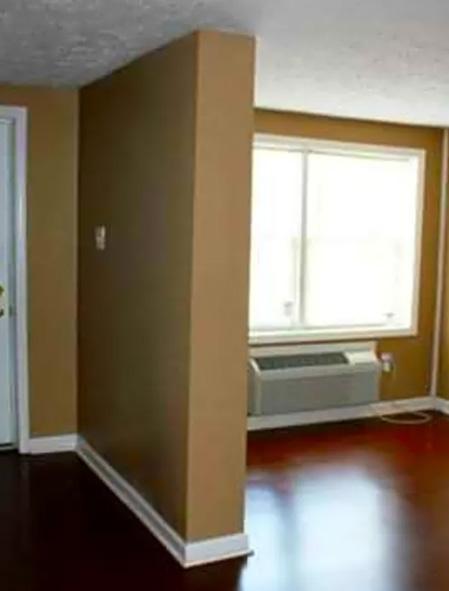
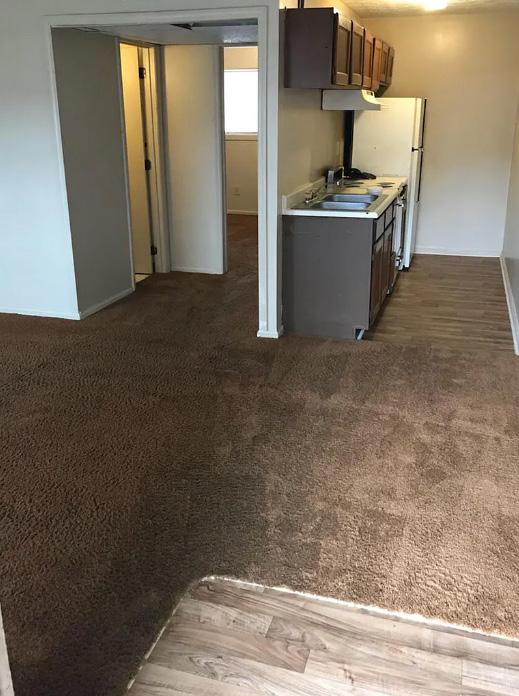
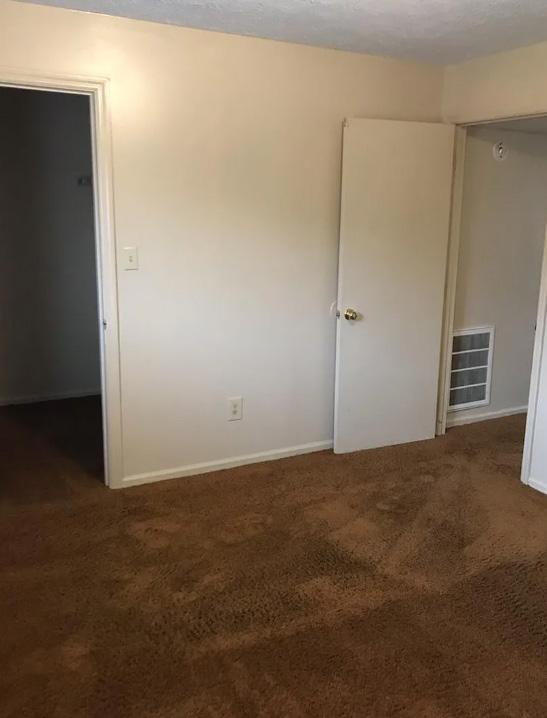
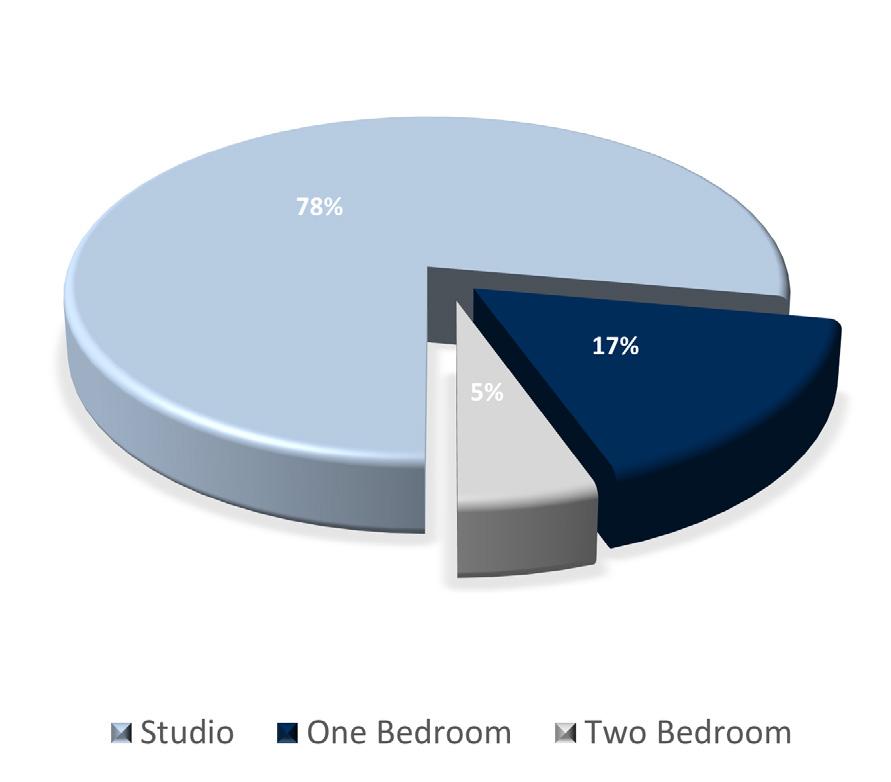
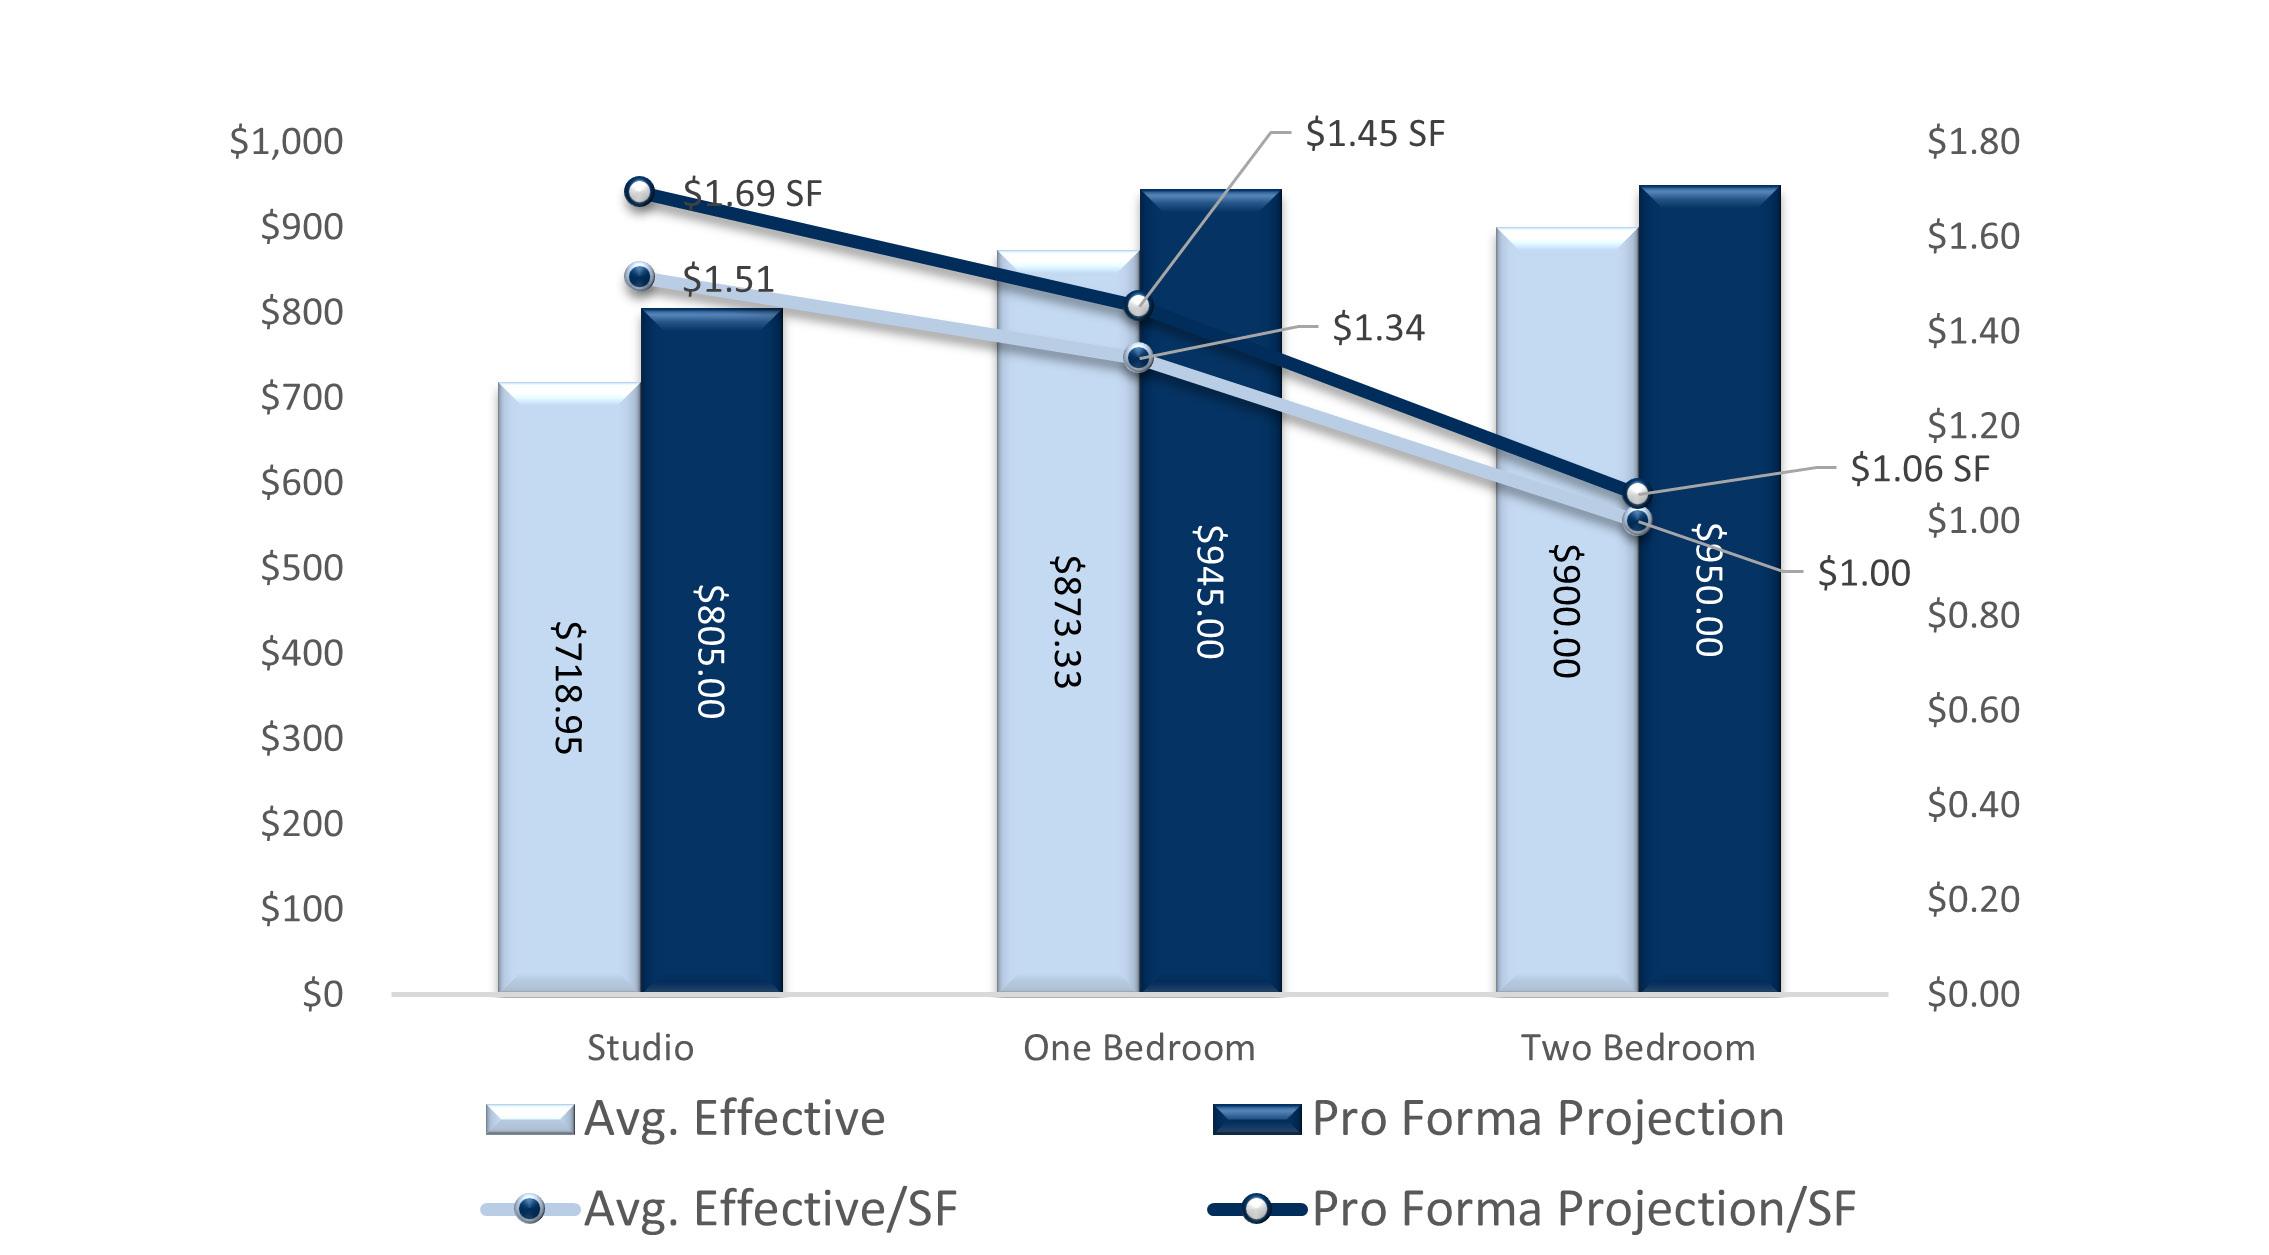
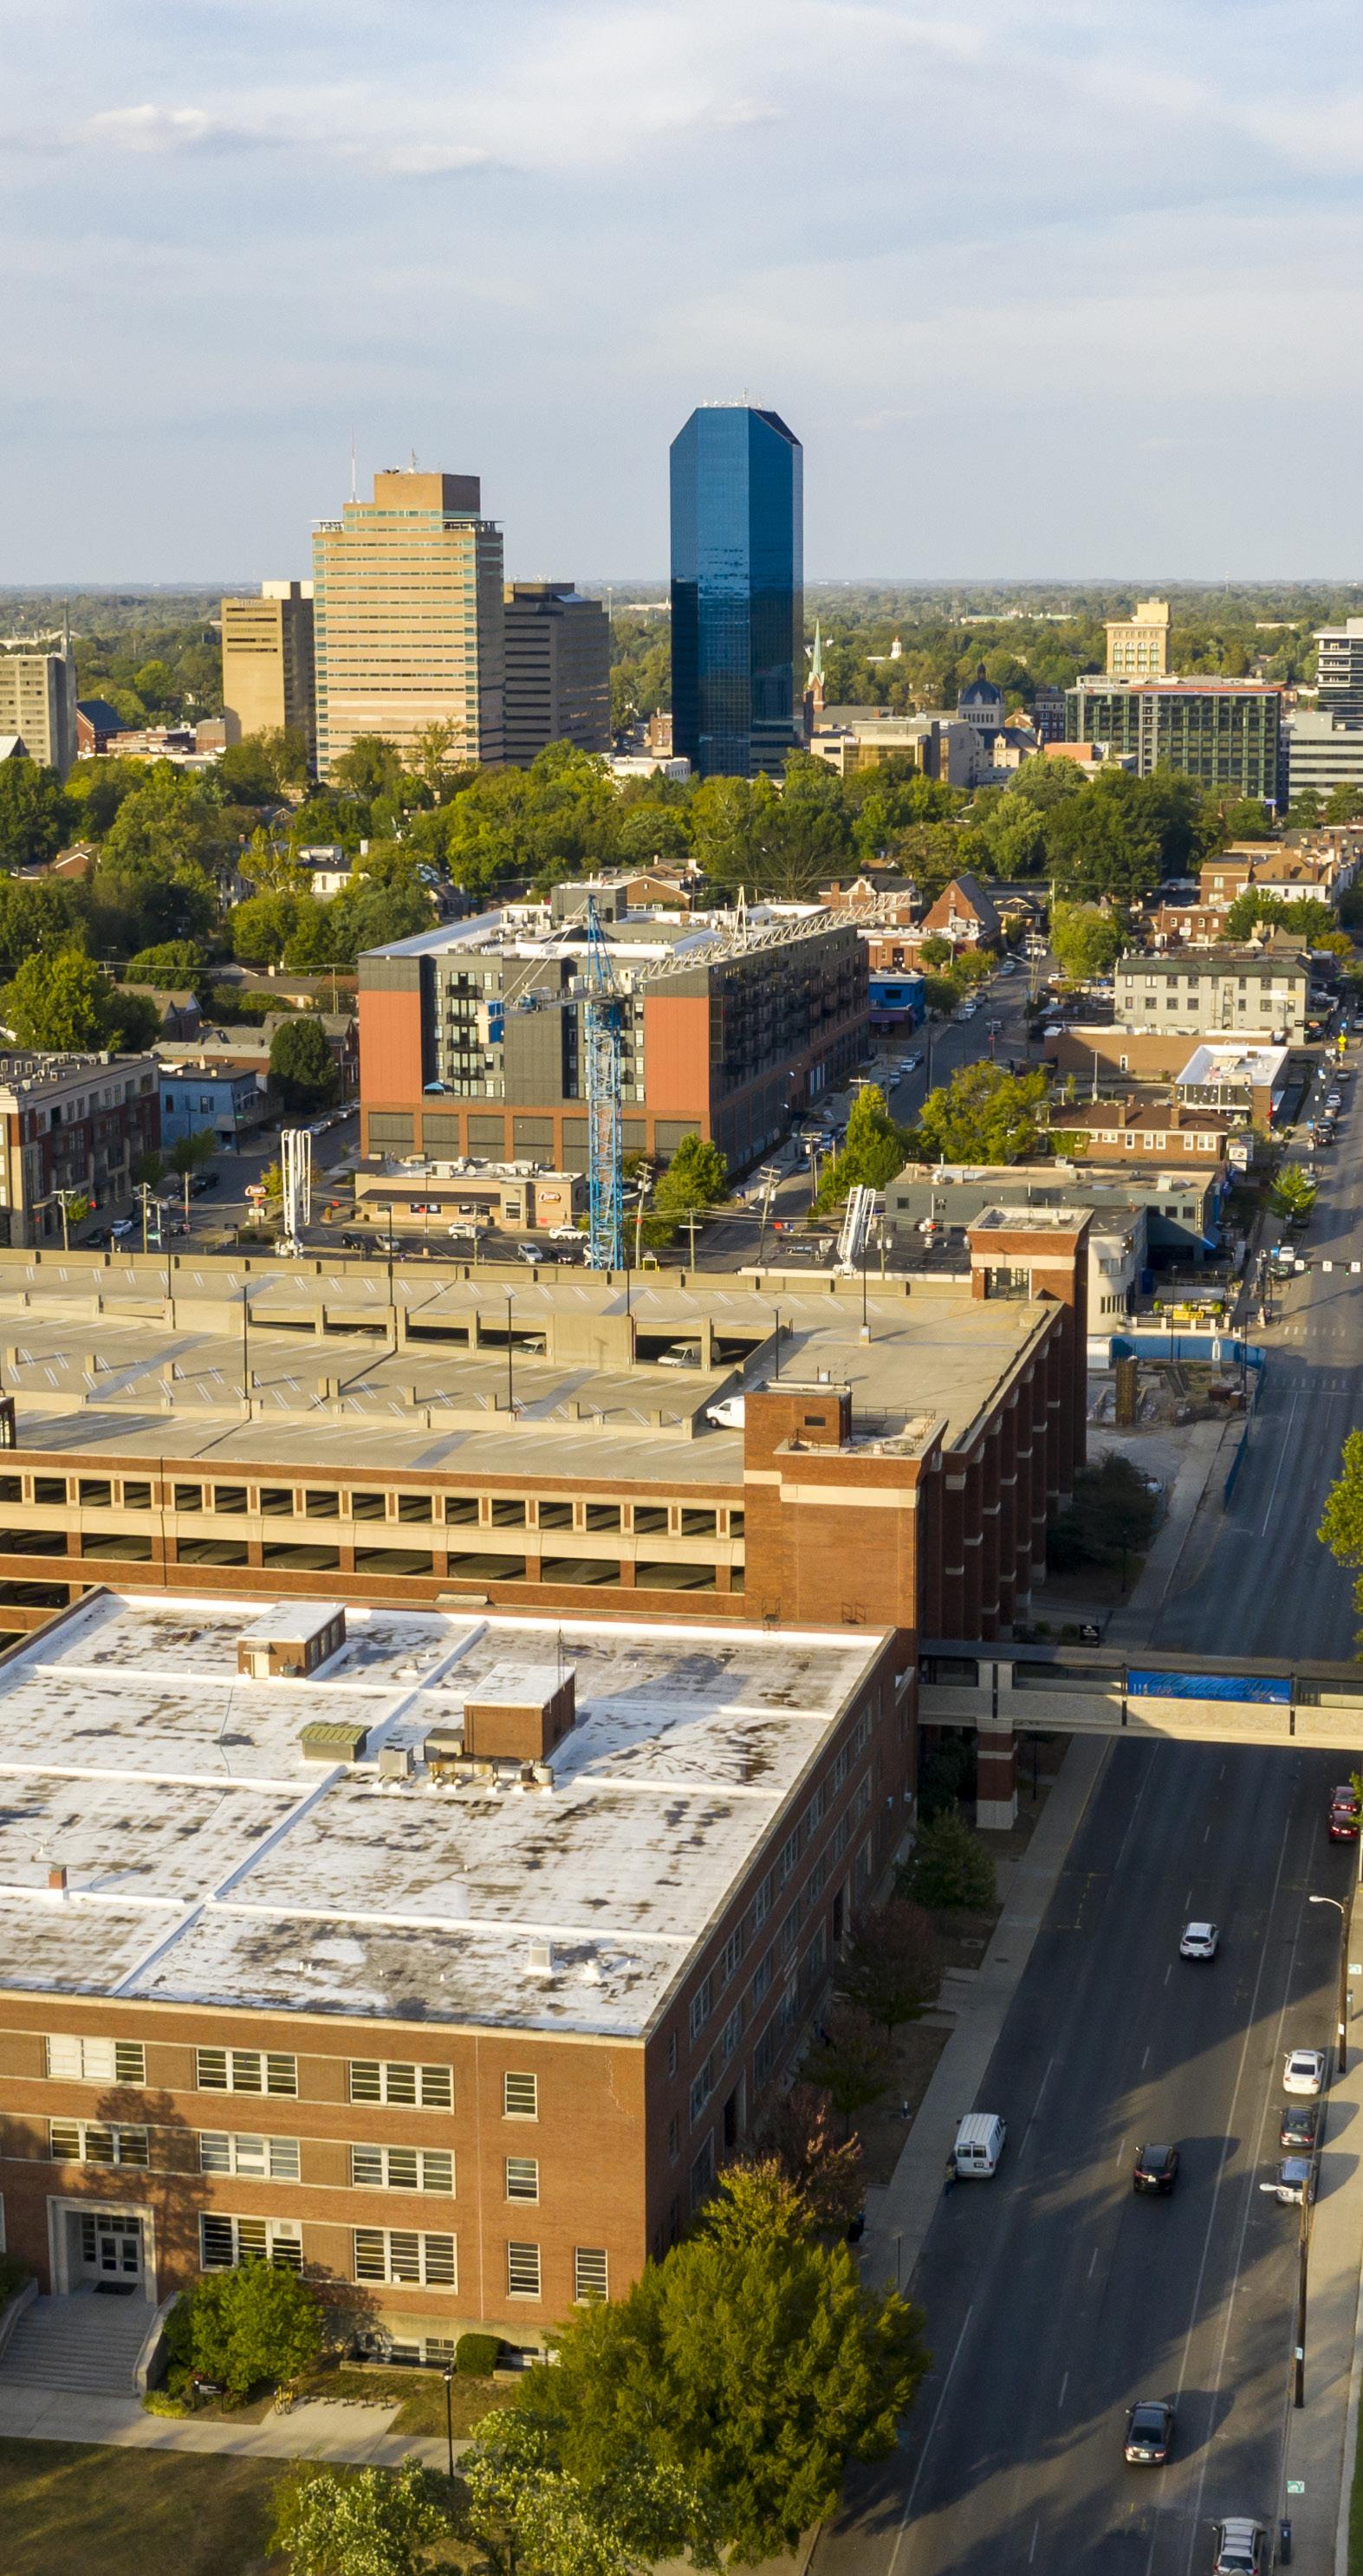
Marcus & Millichap is pleased to present 315 Ballpark Dr., a 18-unit apartment complex located in the Northeast Submarket of Lexington, KY. The apartment complex consists of 14 studios, 3 1-bedroom, 1-bathroom units, and 1 2-bedroom, 1-bathroom unit. The asset has received a significant amount of capital improvements ranging from new bathrooms and kitchens to new windows and new PTAC units and continues to see investment as units turn. The asset offers an investor to take advantage of the renovated apartments and push rents. The portfolio is finishing lease-up for the remaining units and poised for strong cash flow.
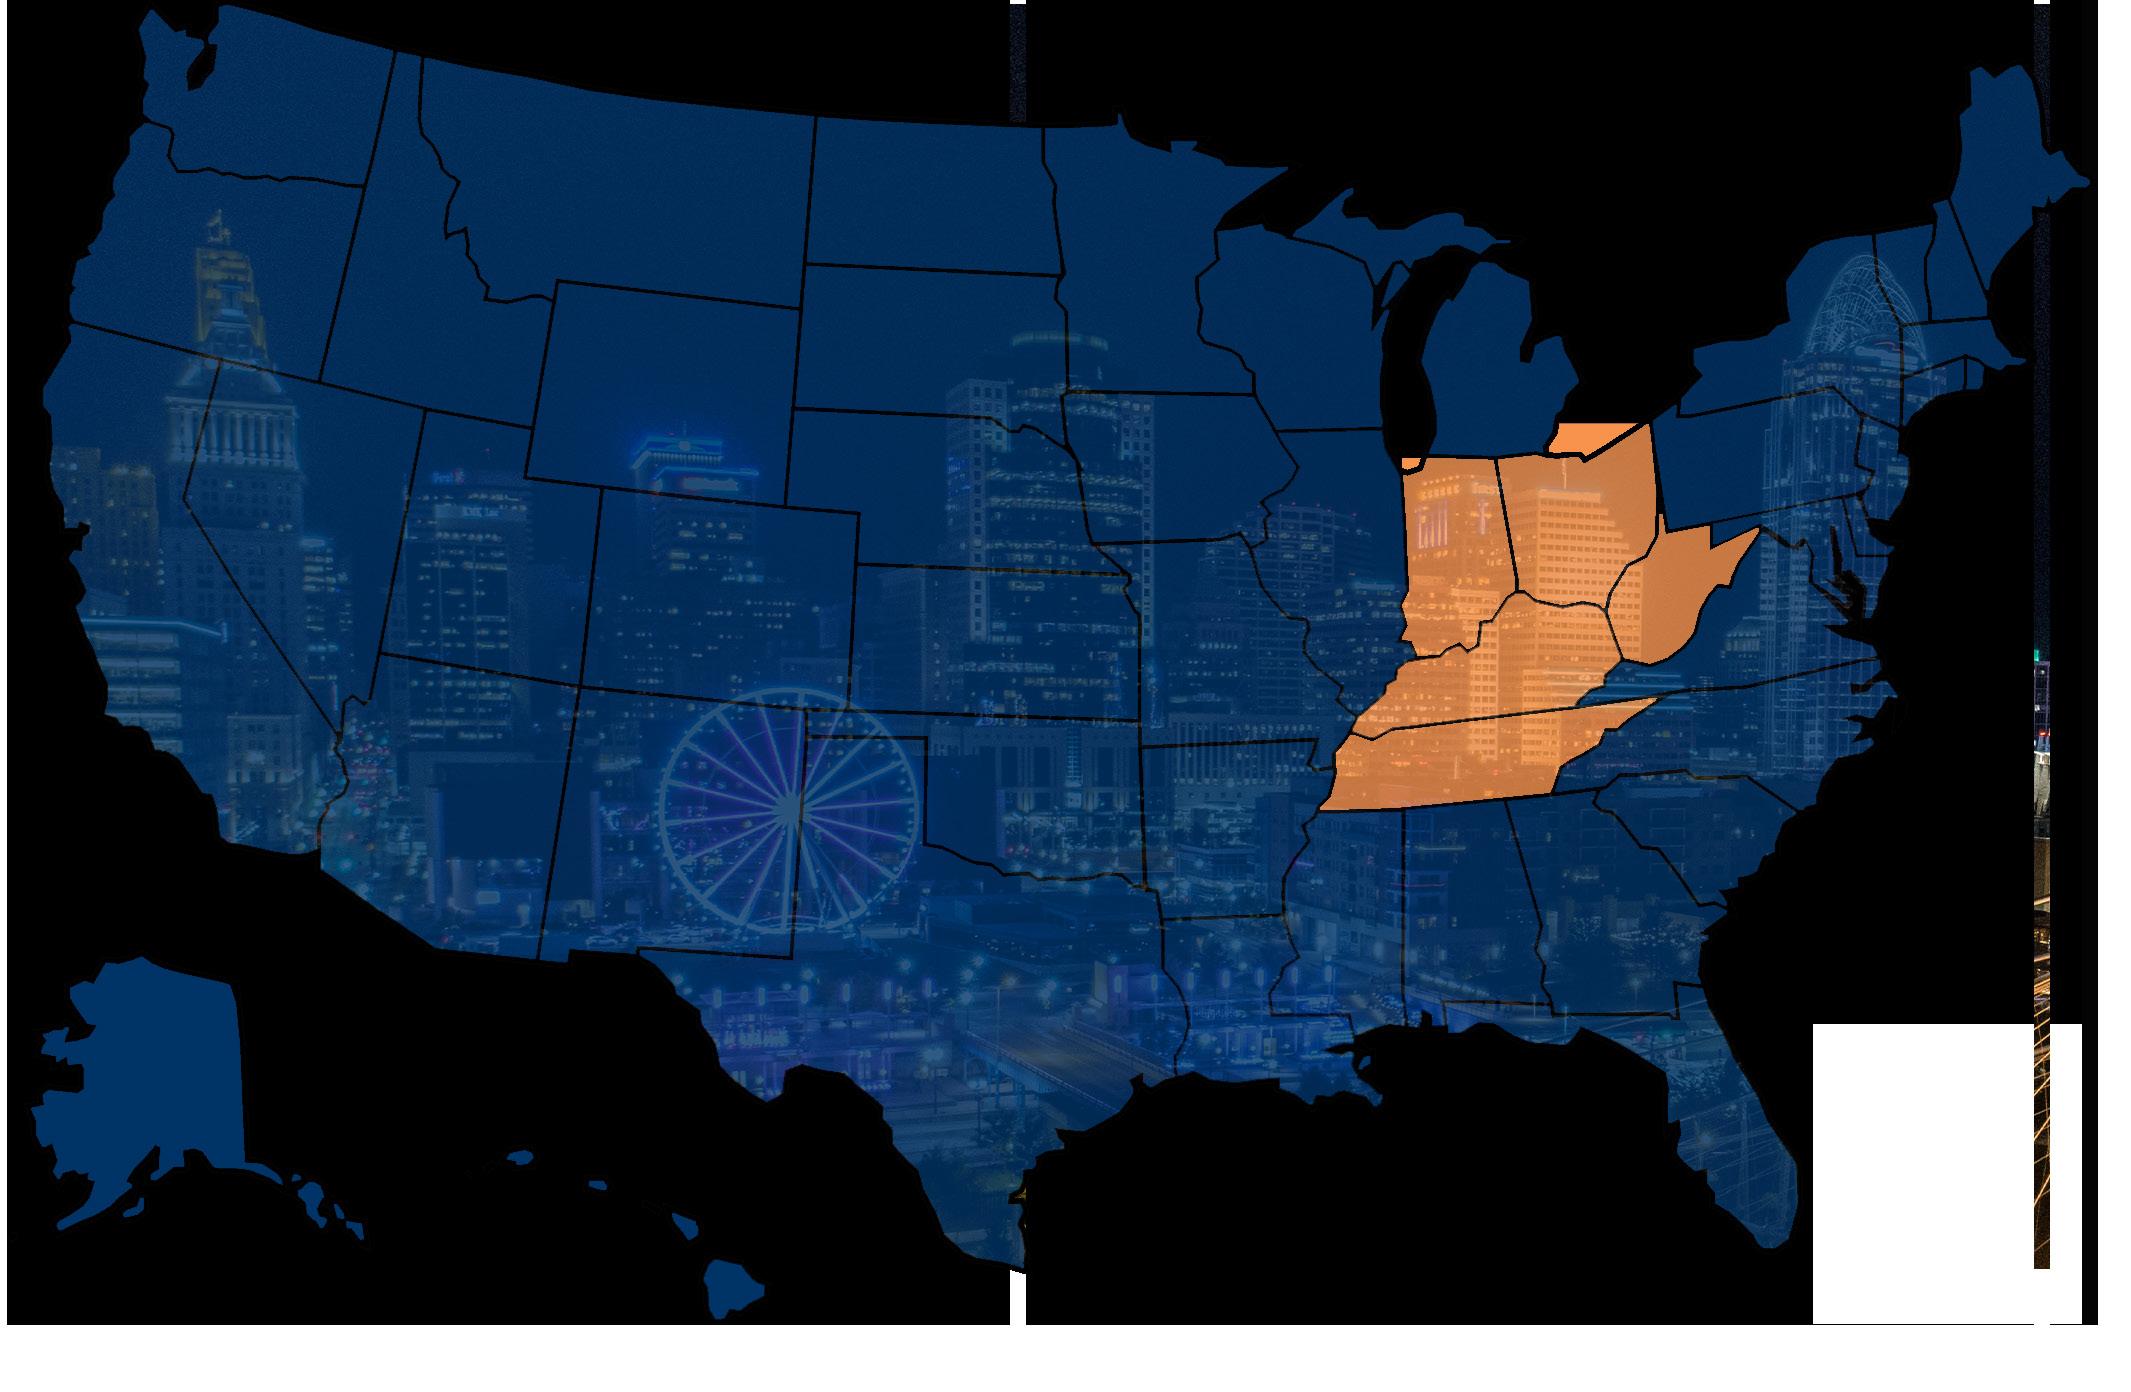
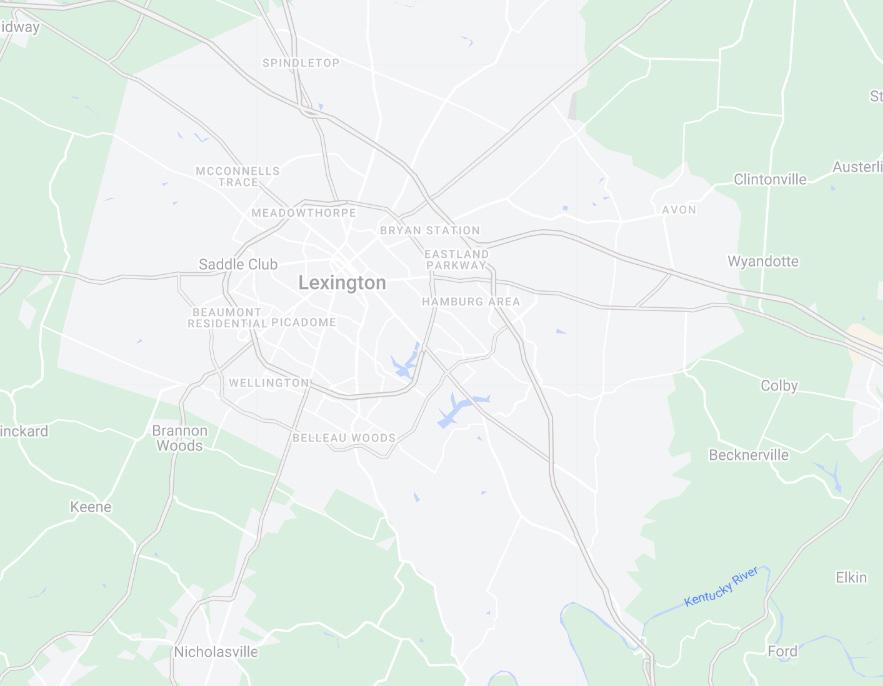
• The Lexington Northeast Submarket is highlighted by its excellent connectivity with direct access to New Circle, N Broadway Rd., and I-75
• Chick-Fil-A was recently developed in this submarket and located off New Circle Rd. It is less than a mile away from 315 Ballpark Dr.
• Nearby employers include: LexMark, UPS Distribution, Jiff Peanut Butter Factory, & Bluegrass Community Technical College
• Rental rates in the Northeast Submarket has seen on average 11.5% rental growth over the last 12 months
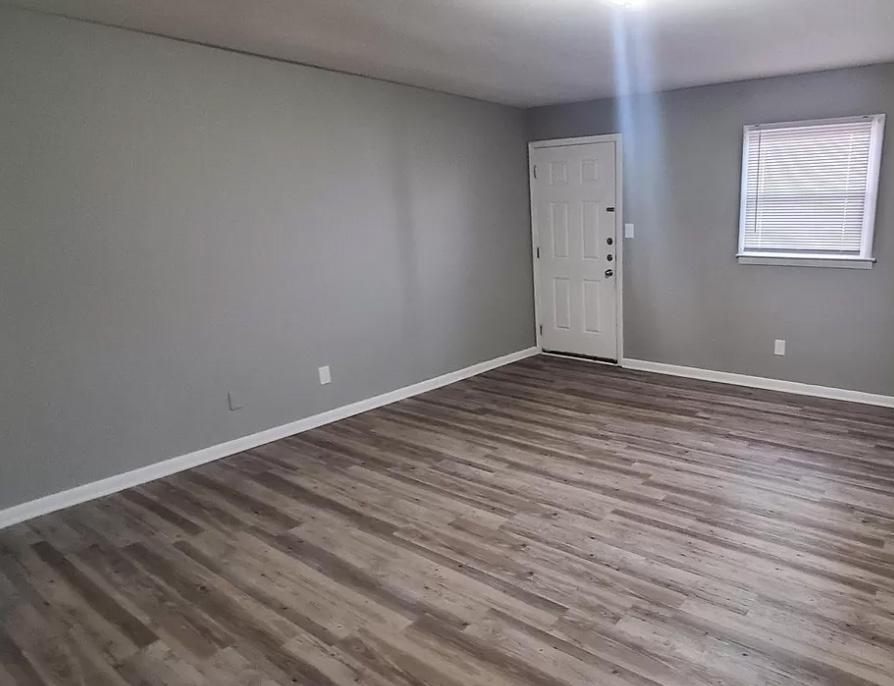
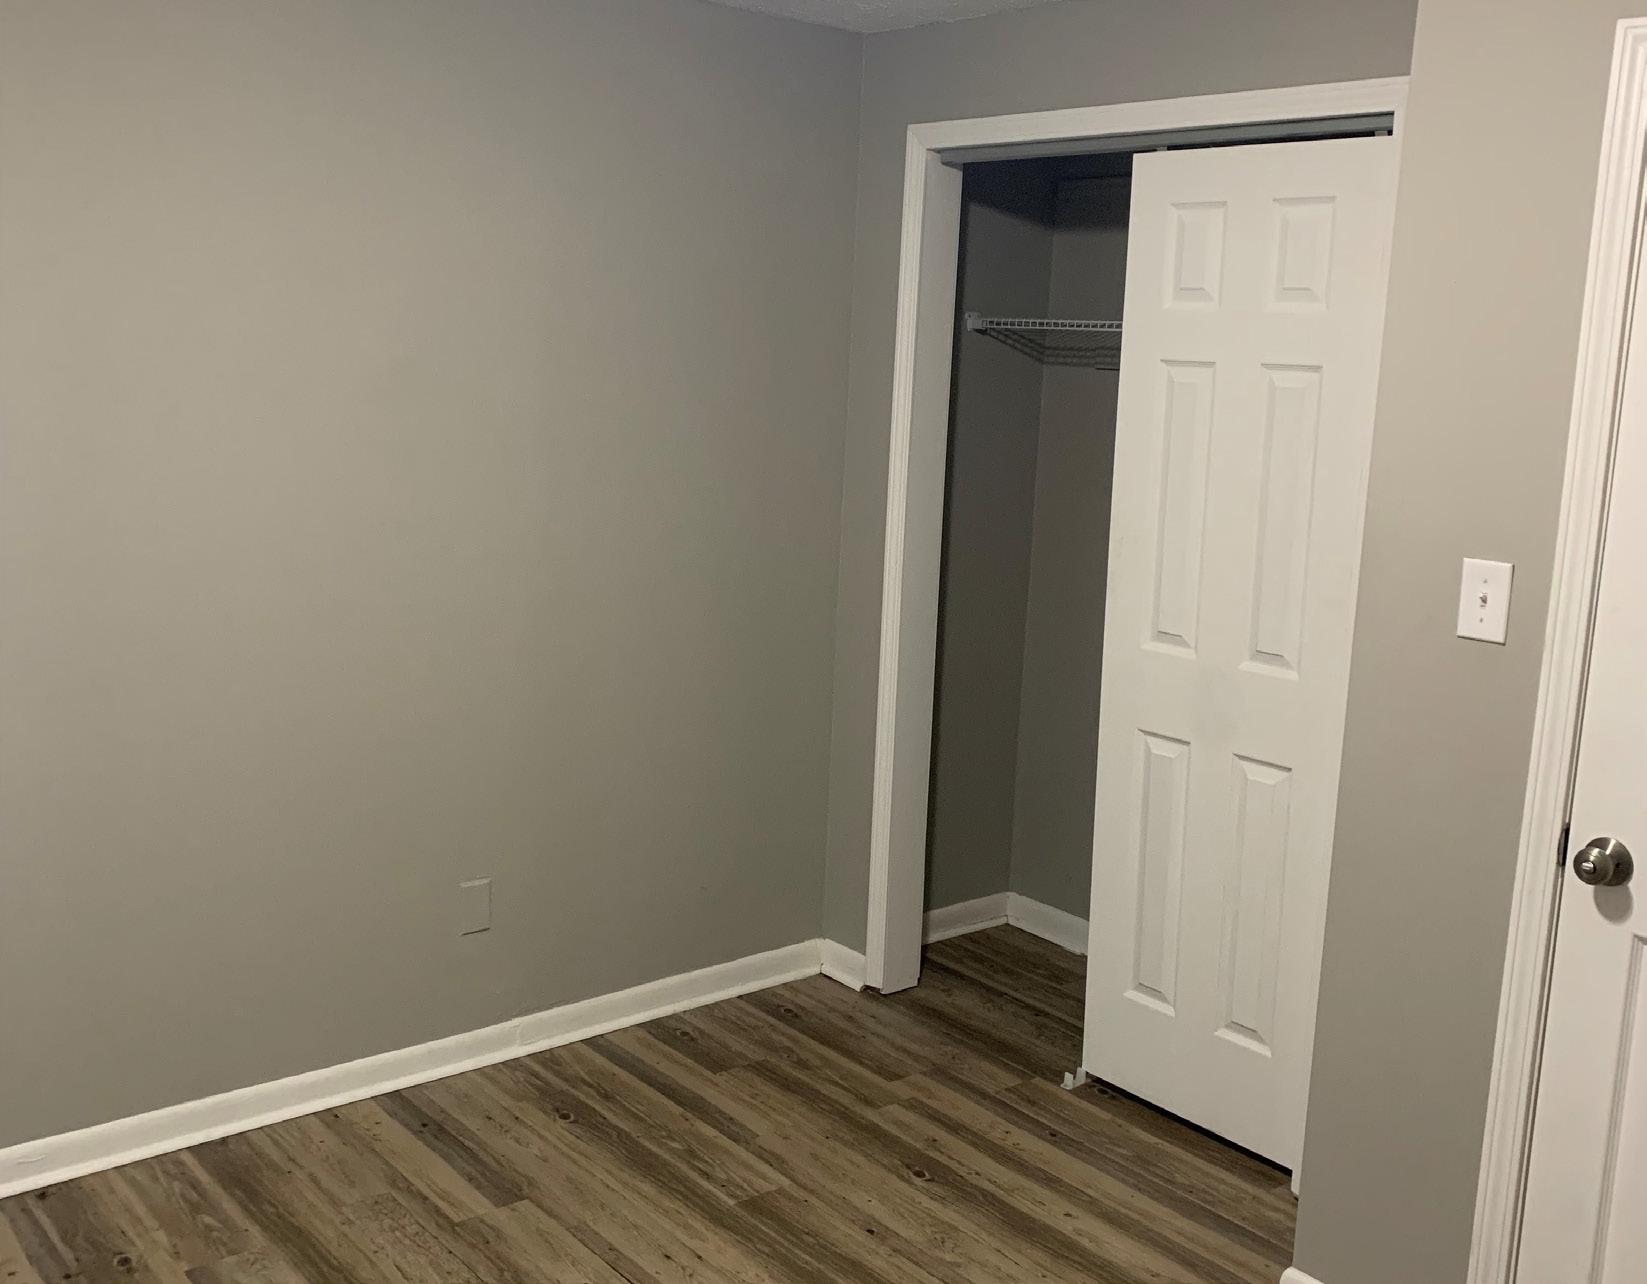
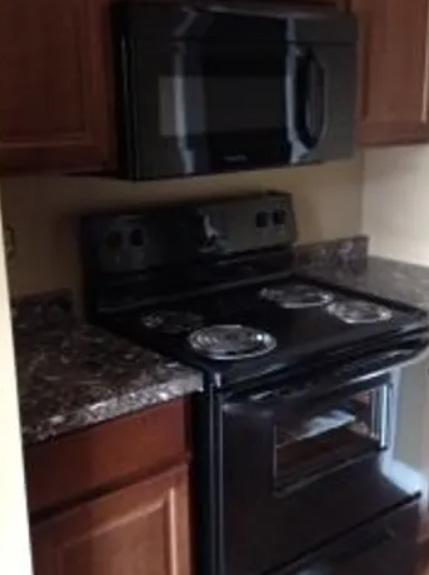
Between the current ownership group and the prior, there has been significant capital investment to upgrade the units with higher end finishes as well as maintain and preserve the buildings structures and mechanicals. The units have received the following upgrades (unit upgrades vary);
• New Kitchen Appliances (White or Black)
• LVP Flooring in select units/Refinished Hardwood Floors
• New Kitchen Cabinets
• New Locks
• New Formica/Laminate Countertops
• Updated Tub Surround
• New Paint/Drywall
• New Bathroom Vanities
• New PTAC Units
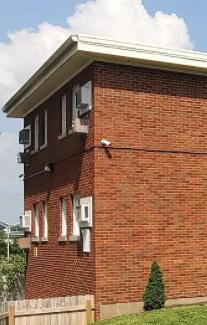
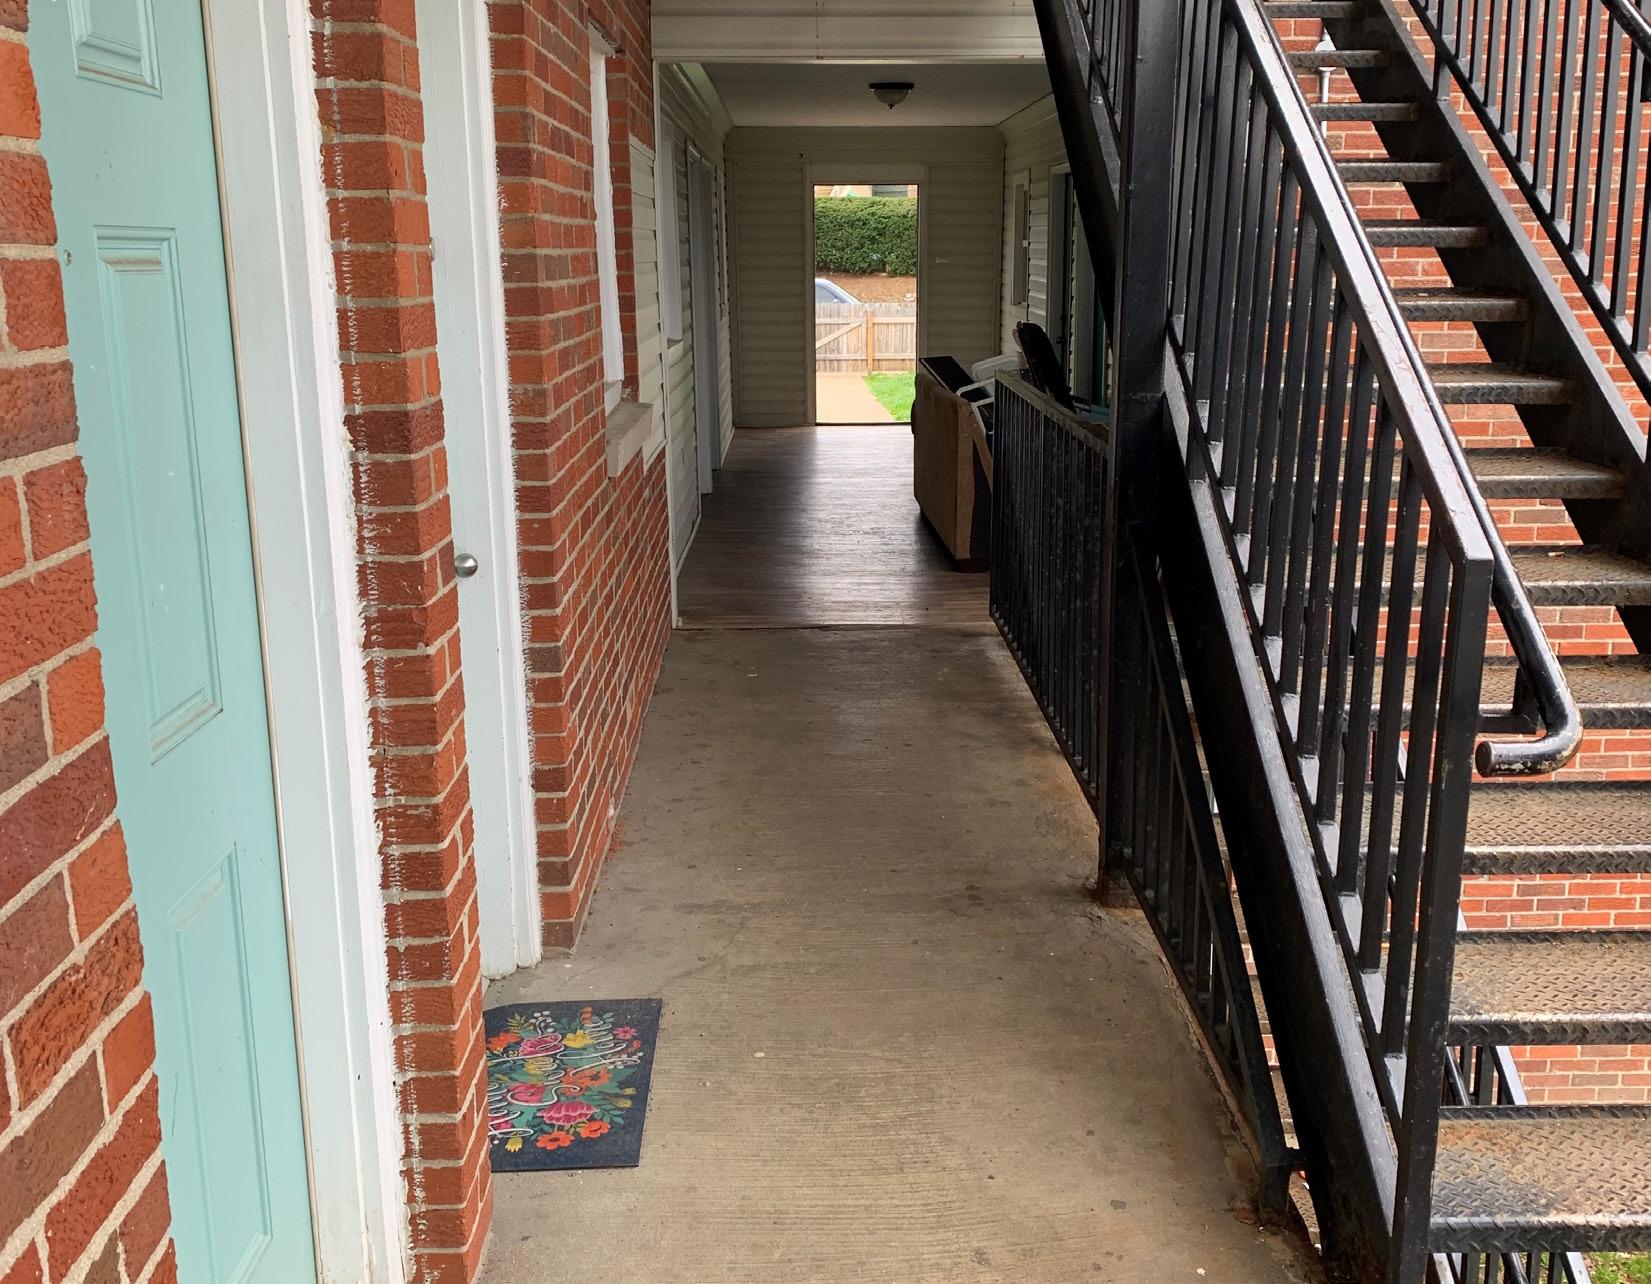
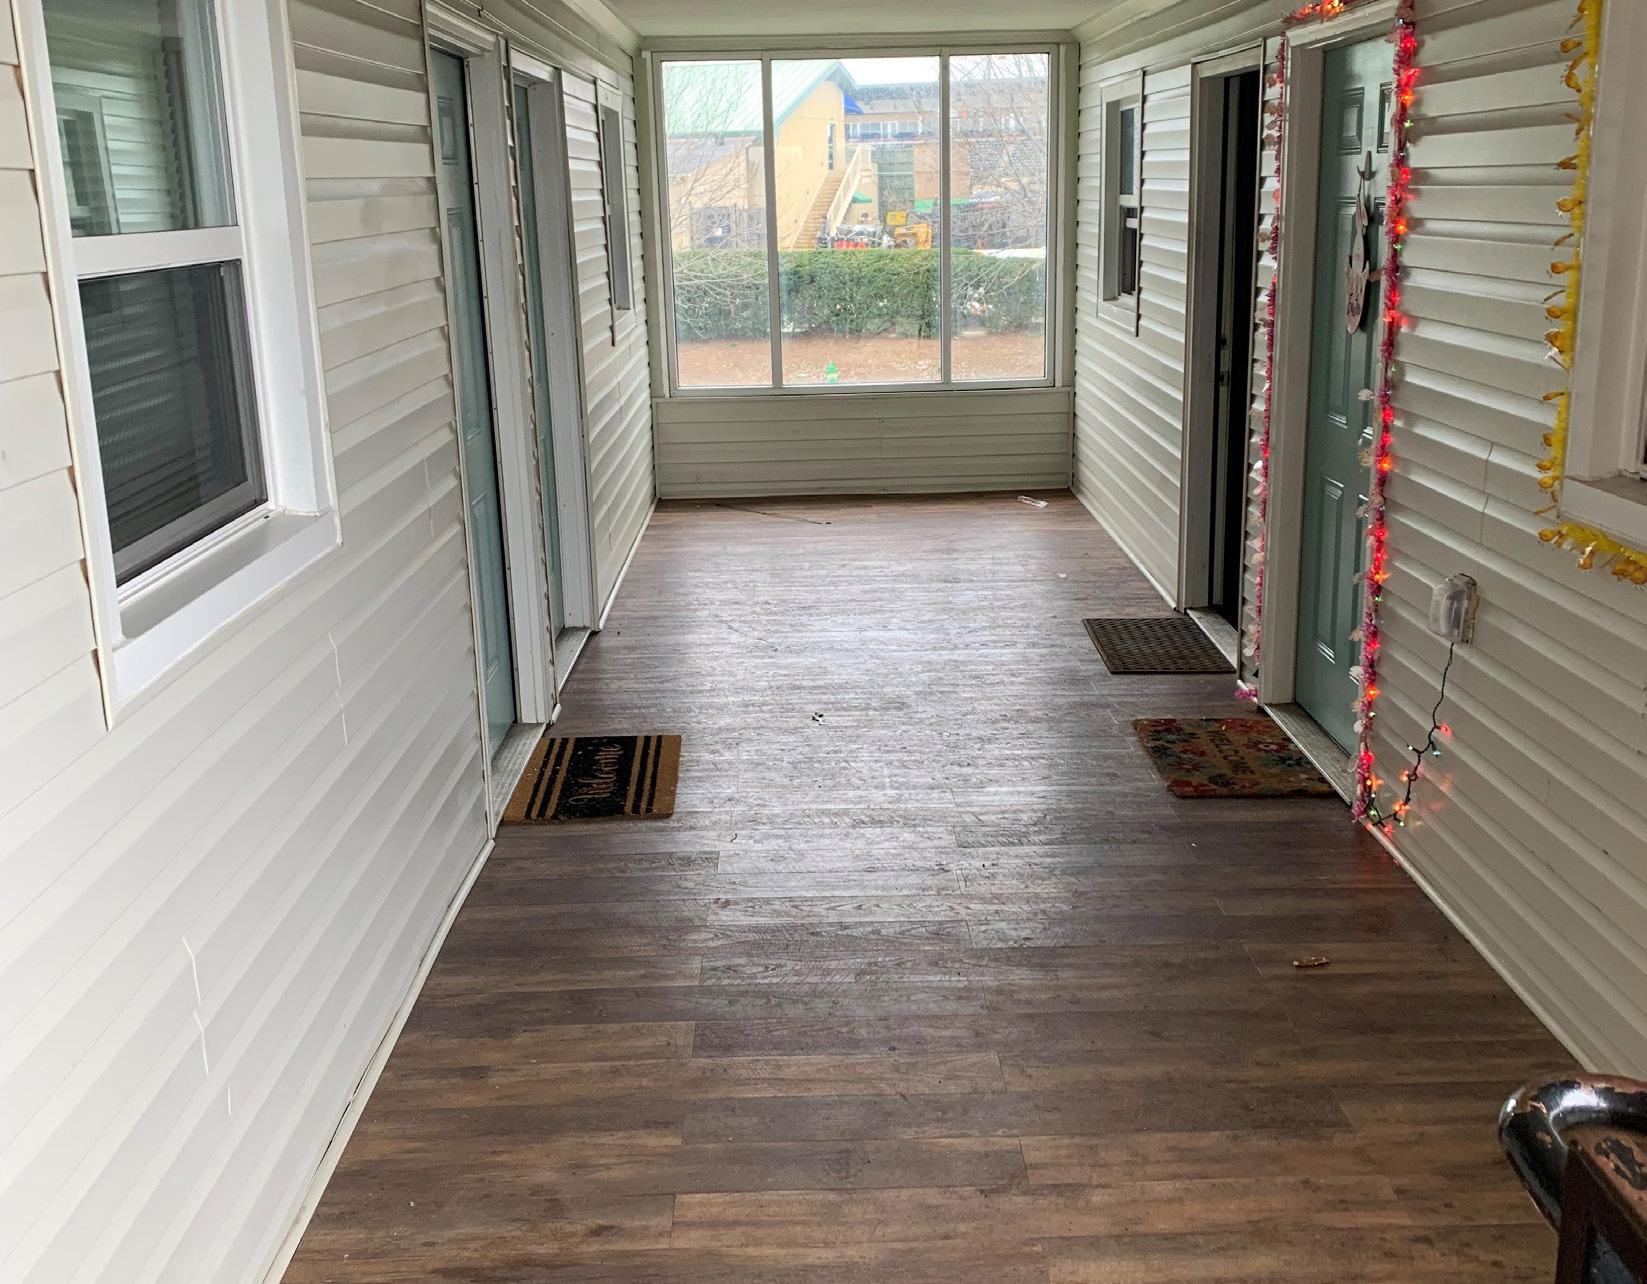
The buildings and common areas have received the following CAPEX since July 2021 to improve the quality of the asset. The asset has received the following updates:
• All Windows Replace
• All Plumbing Stacks Re-done
• Implement Security System
• Added Fencing around the Property


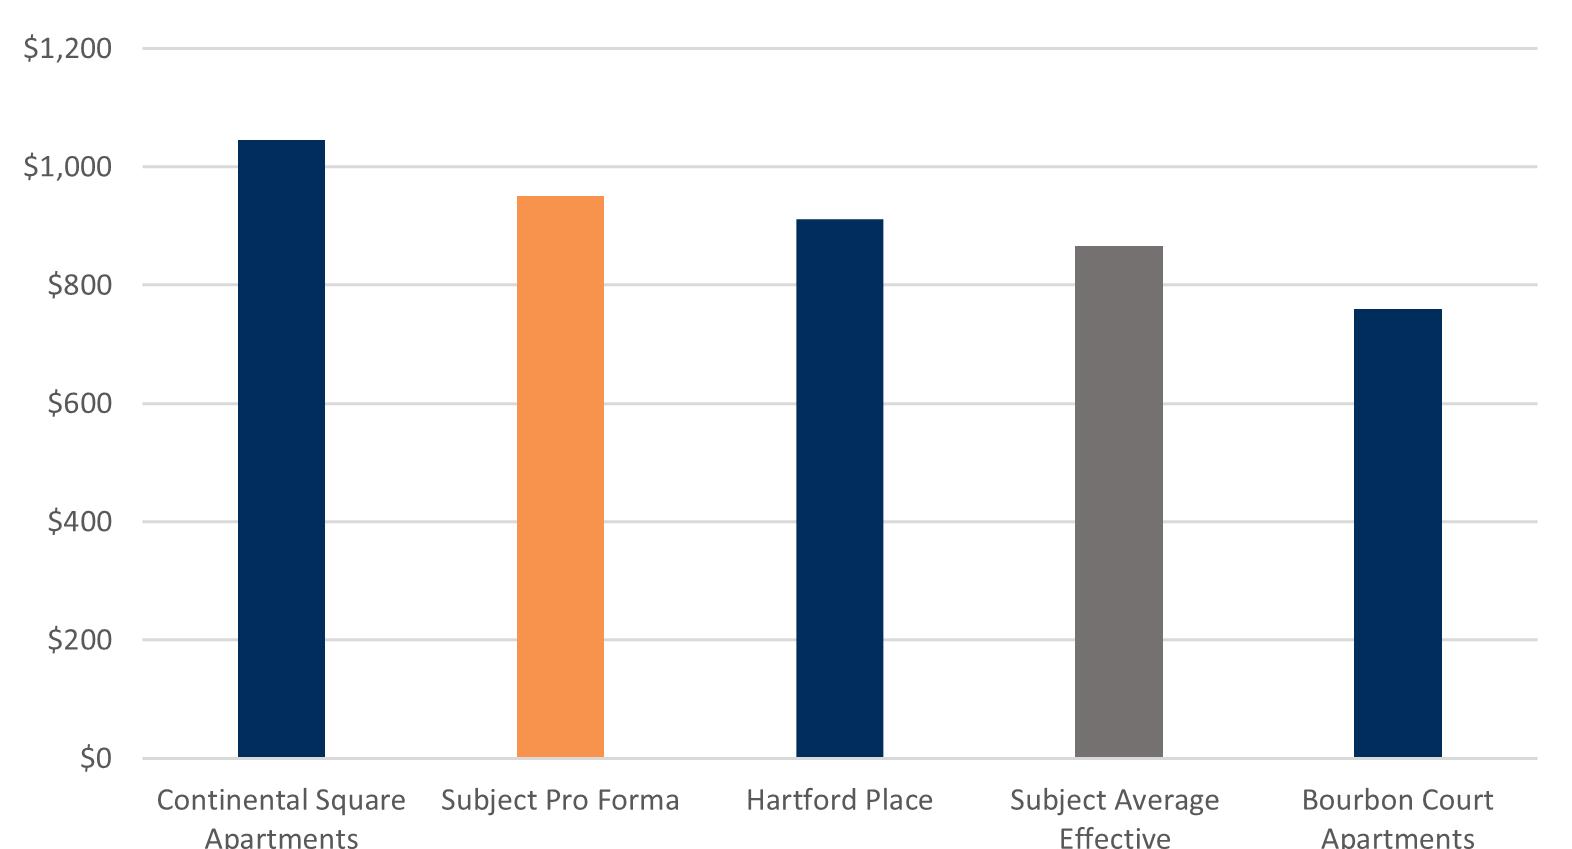
1 Replacement & Reserves: added based on market norm of $255 per unit per year
*Calculated as a percentage of Gross Potential Rent | **Calculated as a percentage of Effective Gross Income


Lexington, city, coextensive with Fayette county, north-central Kentucky, U.S., the focus of the Bluegrass region and a major centre for horse breeding. Named in 1775 for the Battle of Lexington, Massachusetts, it was chartered by the Virginia legislature in 1782 and was the meeting place (1792) for the first session of the Kentucky legislature following statehood. Lexington in the early 1880s called itself the Athens of the West, boasting Transylvania College (1780; now Transylvania University), street lights, a public subscription library, a theatre, and a musical society. In 1817 it had presented the first Beethoven symphony heard in the United States.
Metronet has invested over $100 million in fiberoptic infrastructure making Lexington the largest Gigabit city in the nation. The city’s highspeed infrastructure along with its low cost of living provides 1.54 times the purchasing power compared to Silicon Valley attracting talented tech professionals and startups alike.
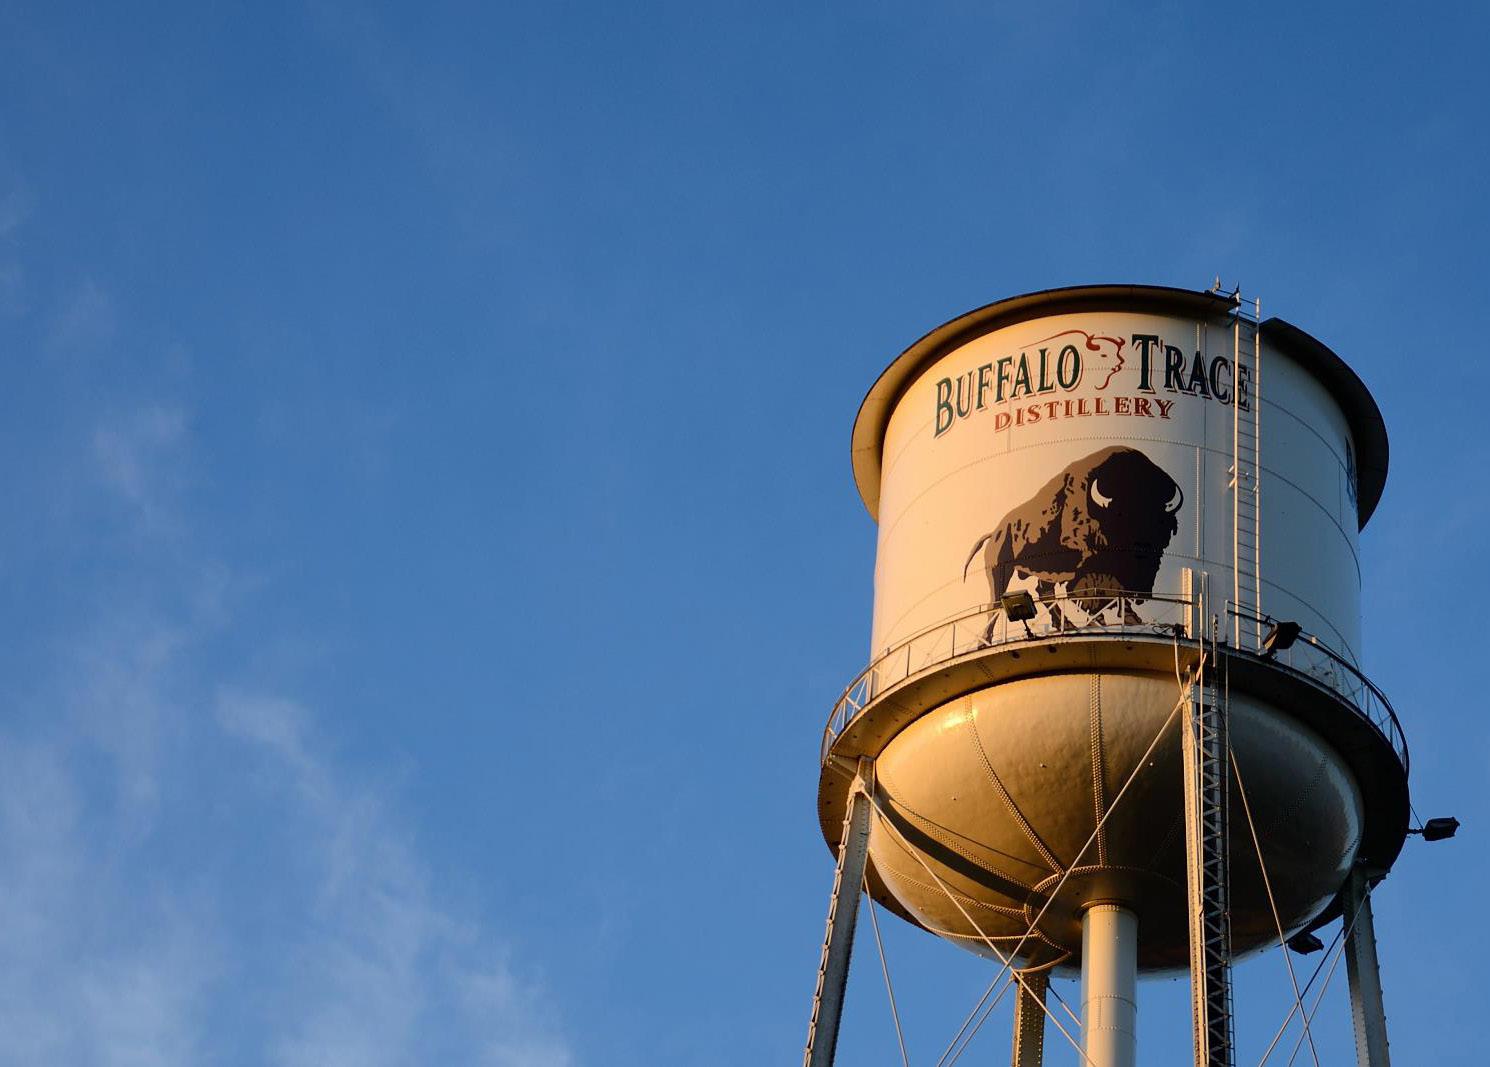
Buffalo Trace distillery, based out of Kentucky, has made progress in its $1.2 billion expansion, which includes the construction of an additional still, more barrel warehouses, added fermenters and an expansion of the dry house operation.
Over the past year, a second still house has been built next to the existing 1930s structure. At 40 ft tall, it has doubled production capacity and holds 60,000 gallons.
• The University of Kentucky approved a purchase agreement for $6.9 Million to acquire land for construciton of a new outpatient cancer treatment center and advanced ambulatory complex. (Dec 2021)
• New $37.5 million Lexington Distillery District hotel will open in spring 2023 (Dec 2021)
• The University of Kentucky gives the city of Lexington 250 acres in and near the Coldstream Research Campus where office, laboratory, residential and hospitality developments are planned. A new, $15 million hightech building currently under construction will provide office and laboratory space for early-stage, high-tech companies to develop and commercialize their products and services. (Oct 2021).
• TMMK to invest $461 million in upgrades at Georgetown Toyota plant. (Oct 2021)
• Buffalo Trace Distillery makes headway on $1.2 billion expansion (Aug 2021)
• Lexington-based Quality Logistics LLC, doing business as Longship, opened its new office in Fayette County, a $4.3 million investment creating 155 well-paying jobs for Kentucky residents (Aug 2021)
• Prior to the pandemic, Lexington-Fayette’s real gross metropolitan product grew at an average annual rate of 1.4% from 2015 to 2019. During that same five-year period, job growth averaged 1.2% annually, with roughly 3,100 jobs added on average each year. In 2020, COVID-19 mitigation measures and limited business activity caused the local economy to contract as much as 9.7% year-over-year in 2nd quarter.
• In the year-ending 3rd quarter 2022, the metro’s inflation-adjusted economic output contracted 0.4%. At the same time, the metro recorded a
net gain of 7,500 jobs, expanding the employment base 2.7%.
• Lexington-Fayette’s unemployment rate in August 2022 declined 0.8 points year-over-year to 3.0%, below the national average of 3.8%.
• During the past year, job gains in Lexington-Fayette were most pronounced in the Leisure/Hospitality Services sector followed by Trade/ Transportation/Utilities, despite job losses stemming from the pandemic, Lexington-Fayette’s current employment base now sits roughly 2,700 jobs or about 1% above the pre-pandemic level in February 2020.
Population: 514,273
Average occupancy: 96.2%
Median age: 36.2
Rent growth: 12.4%
• In 3rd quarter 2022, effective asking rents for new leases were up 12.4% year-over-year.
• Annual rent performance was above the market’s five-year average of 5.2%.
• Product classes in Lexington-Fayette, Class A led for rent performance over the past five years. In 3rd quarter 2022, annual effective rent change registered at 12. 9% in Class A units, 12.0% in Class B units and 11. 9% in Class C units.
MSA median home value: $193,700
MSA median hhi: $60,729
1 - Year growth: 6.02%
1 - Year growth: 3.55%
• Among submarkets, the strongest annual rent change performance over the past year was in Downtown Lexington/University (13.5%). The weakest performance was in North Lexington (11.4%).
• The coming year, effective asking rent change in Lexington-Fayette is expected to slow from the current level.
• The level of new apartment completions in Lexington-Fayette were modest recently, as 252 units delivered in the year-ending 3rd quarter 2021. That annual completion volume compares to a low of 24 units and a high of 900 units over the past five years. Annual new supply averaged 357 units, and annual inventory growth averaged 0.6% over the past five years.
• Completions over the past year expanded the local inventory base 0.6% and were concentrated only in the Downtown Lexing ton/University submarket.
• Over the next year, inventory growth is set to accelerate with the scheduled addition of 680 units. At the end of 3rd quarter 2021, there were 866 units under construction.
• New supply over the past five years has been concentrated in South Lexington, which received 58% of the market’s total com pletions over that time. Scheduled new deliveries in the coming year are expected to deliver in South Lexington and North Lexing ton.
Market drivers are the underlying forces that compel consumers to purchase products and pay for services. These are trends that make markets develop and grow. The most common market drivers are consumer demand, government policy and demand. Before a business takes its product or service to the market, it must first understand who exactly is likely to purchase it. This is known as the target market.
• Over the past year, occupancy lost 1.3 points, with the 3rd quarter 2022 rate landing at 96.2%.
• Product classes in Lexington-Fayette, 3rd quarter 2022 occupancy registered at 95.7% in Class A units, 96.1% in Class B units and 97.1% in Class C units.
• Among submarkets, 3rd quarter 2022 occupancy was strongest in North Lexington.
• The weakest reading was seen in Downtown Lexington/University.
• During the coming year, occupancy in Lexington-Fayette is expected to register around 96%.

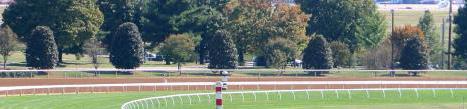
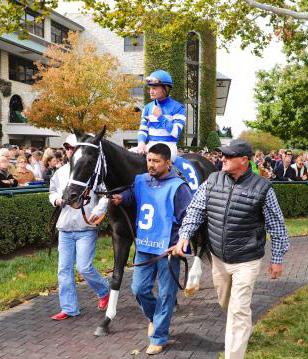

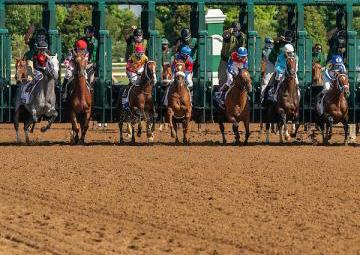
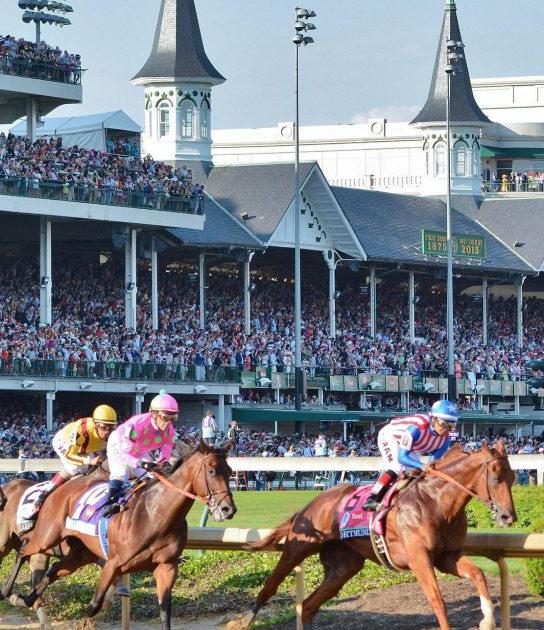
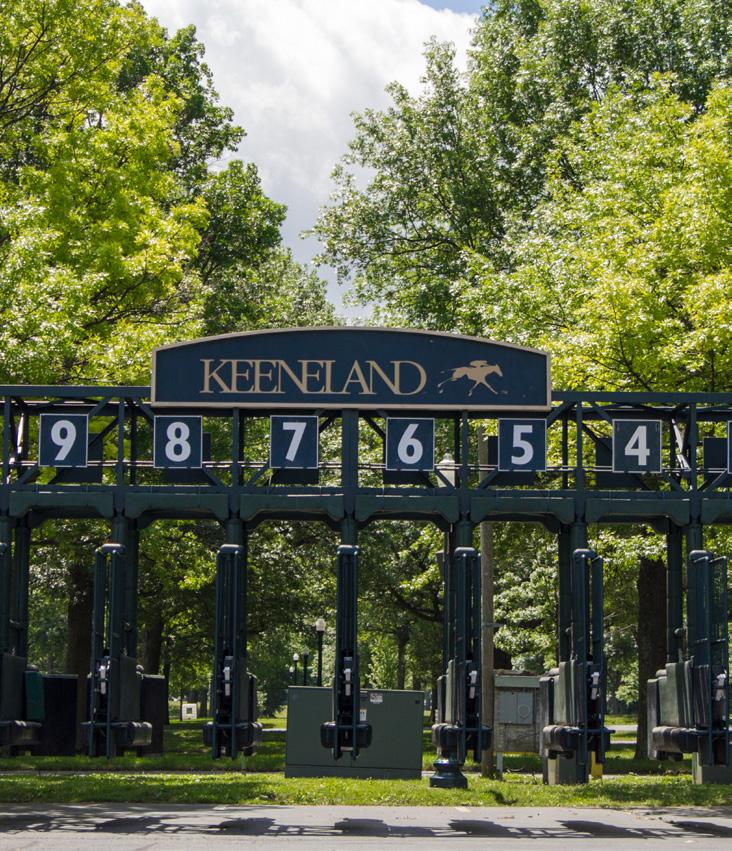
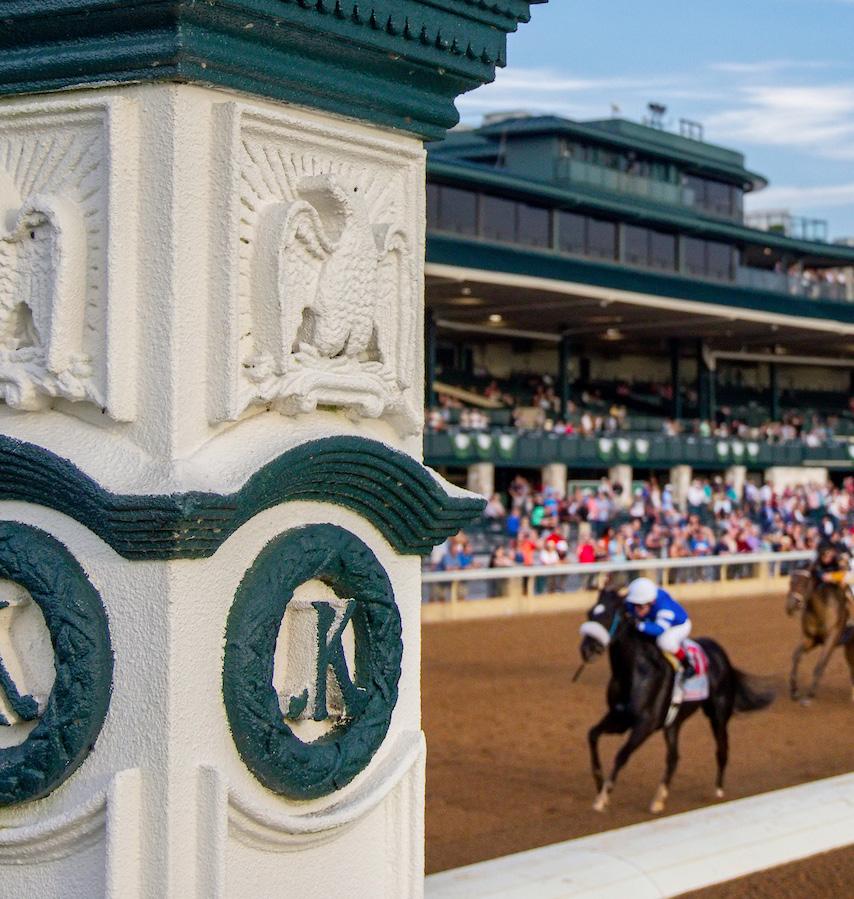
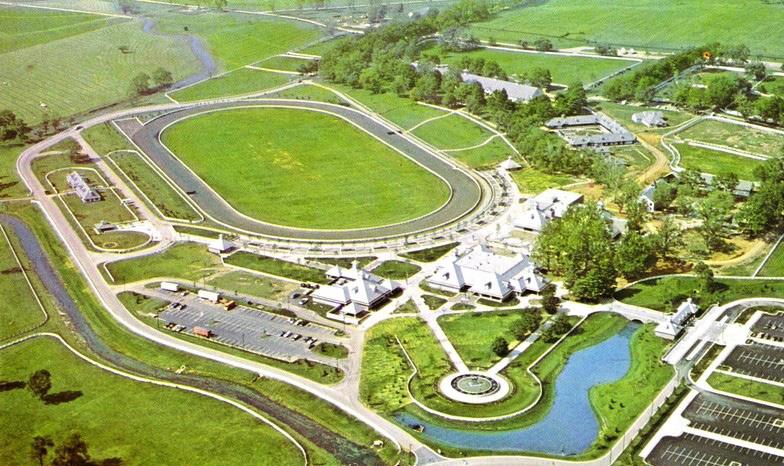
Lexington, the heart of Kentucky “bluegrass,” has been renowned for two centuries for horse raising and horse racing. Shortly after the track’s completion in 1936, Keeneland Racetrack became the most conspicuous manifestation of this culture. Jack Keene, for whom Keeneland is named, was an extraordinary figure in American racing, and helped revive this industry during the 1930s when it was beginning to suffer. Keene was a descendant of a distinguished Lexington family and was known worldwide as a trainer of thoroughbreds. After training abroad in Russia and Japan he returned to Kentucky where he began laying out the Keeneland racecourse in 1916. The main track is one and 1/16th miles in circumference and has retained this length since its original inception by Keene. The grounds also include Keene’s mansion and training center. Constructed of limestone that was quarried on Keene’s farm, this building was designed with living quarters, a large clubroom and stalls. The two-story center section of the building is flanked on either side by stone arcades leading to three-story wings of the building.
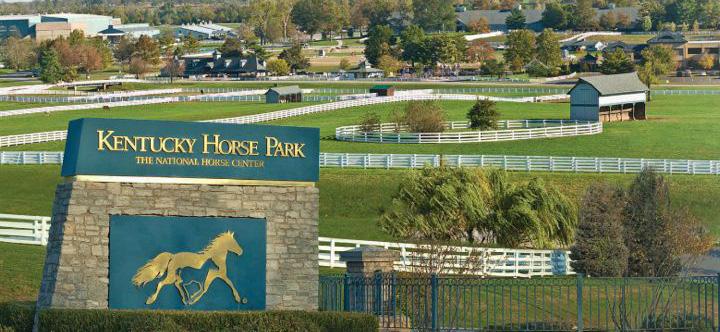
The Kentucky Horse Park is a working horse farm, educational theme park and equine competition facility dedicated to man’s relationship with the horse. Set on more than 1,200 acres in the heart of the Kentucky’s famous Bluegrass region, the park is THE place to get close to horses! Featuring dozens of breeds of horse at work and at play, the park showcases the horse in daily equine presentations, horse drawn tours, horseback and pony rides, and an array of horse shows and special events throughout the year.
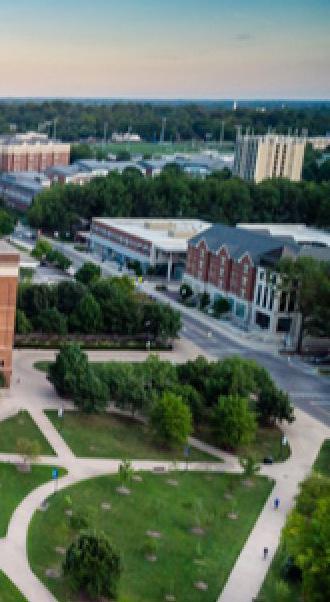
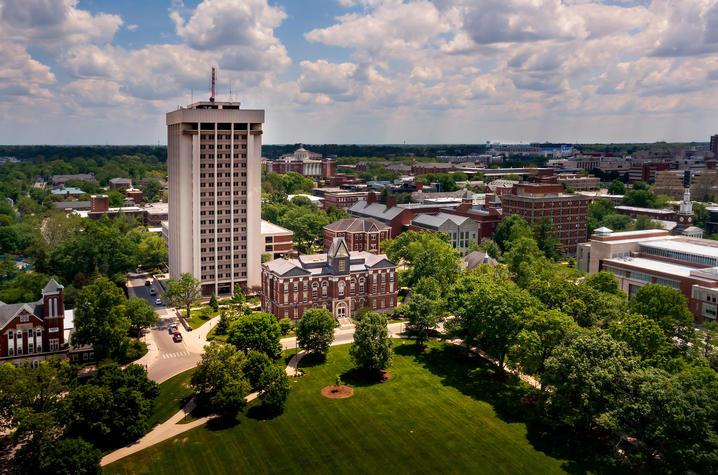
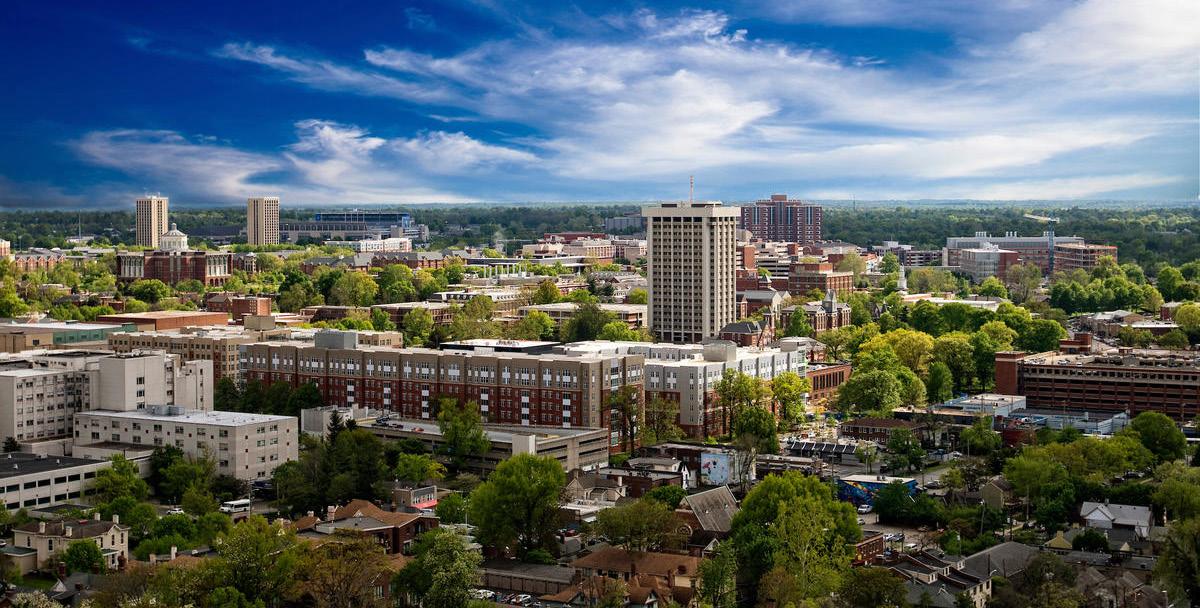
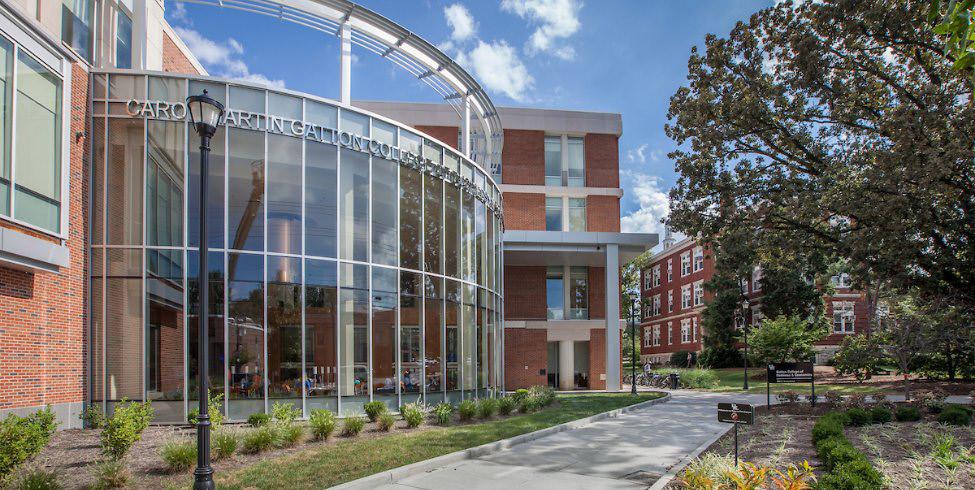
The innovation, creativity, quality teaching, and uplifting service underway at the University of Kentucky touch the lives of people throughout the state, the nation, and the world. This is the covenant we honor through ground-breaking research, community outreach, intellectually rigorous education, and techno- logical advances that contribute to the betterment of the Commonwealth while also fostering a cultural quality of
Founded in 1865, the University of Kentucky is a single campus at the heart of the Blue-grass. More than 100 countries are represented in the student body at UK. UK has over 200 academic programs and last spring, there were 29,182 students enrolled. With more than 12,000 staff and 2,000 faculty, UK is one of the largest employers in the state.

20,500 RUPP AREA FACILITY CAPACITY
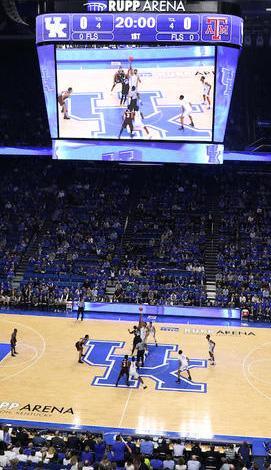
In an extensive study conducted by the Associated Press and then revealed in 2017, the University of Kentucky men’s basketball program was rated as the greatest of its kind ever. Certainly, more current NBA players have emerged from the Wildcats’ ranks than from any other college team, with DeMarcus Cousins, John Wall, and Anthony Davis just some of the University of Kentucky’s former stars. The Wildcats also clinched the NCAA Division I Men’s Basketball Tournament in 2012 and have progressed to the men’s Final Four on four occasions since 2011.

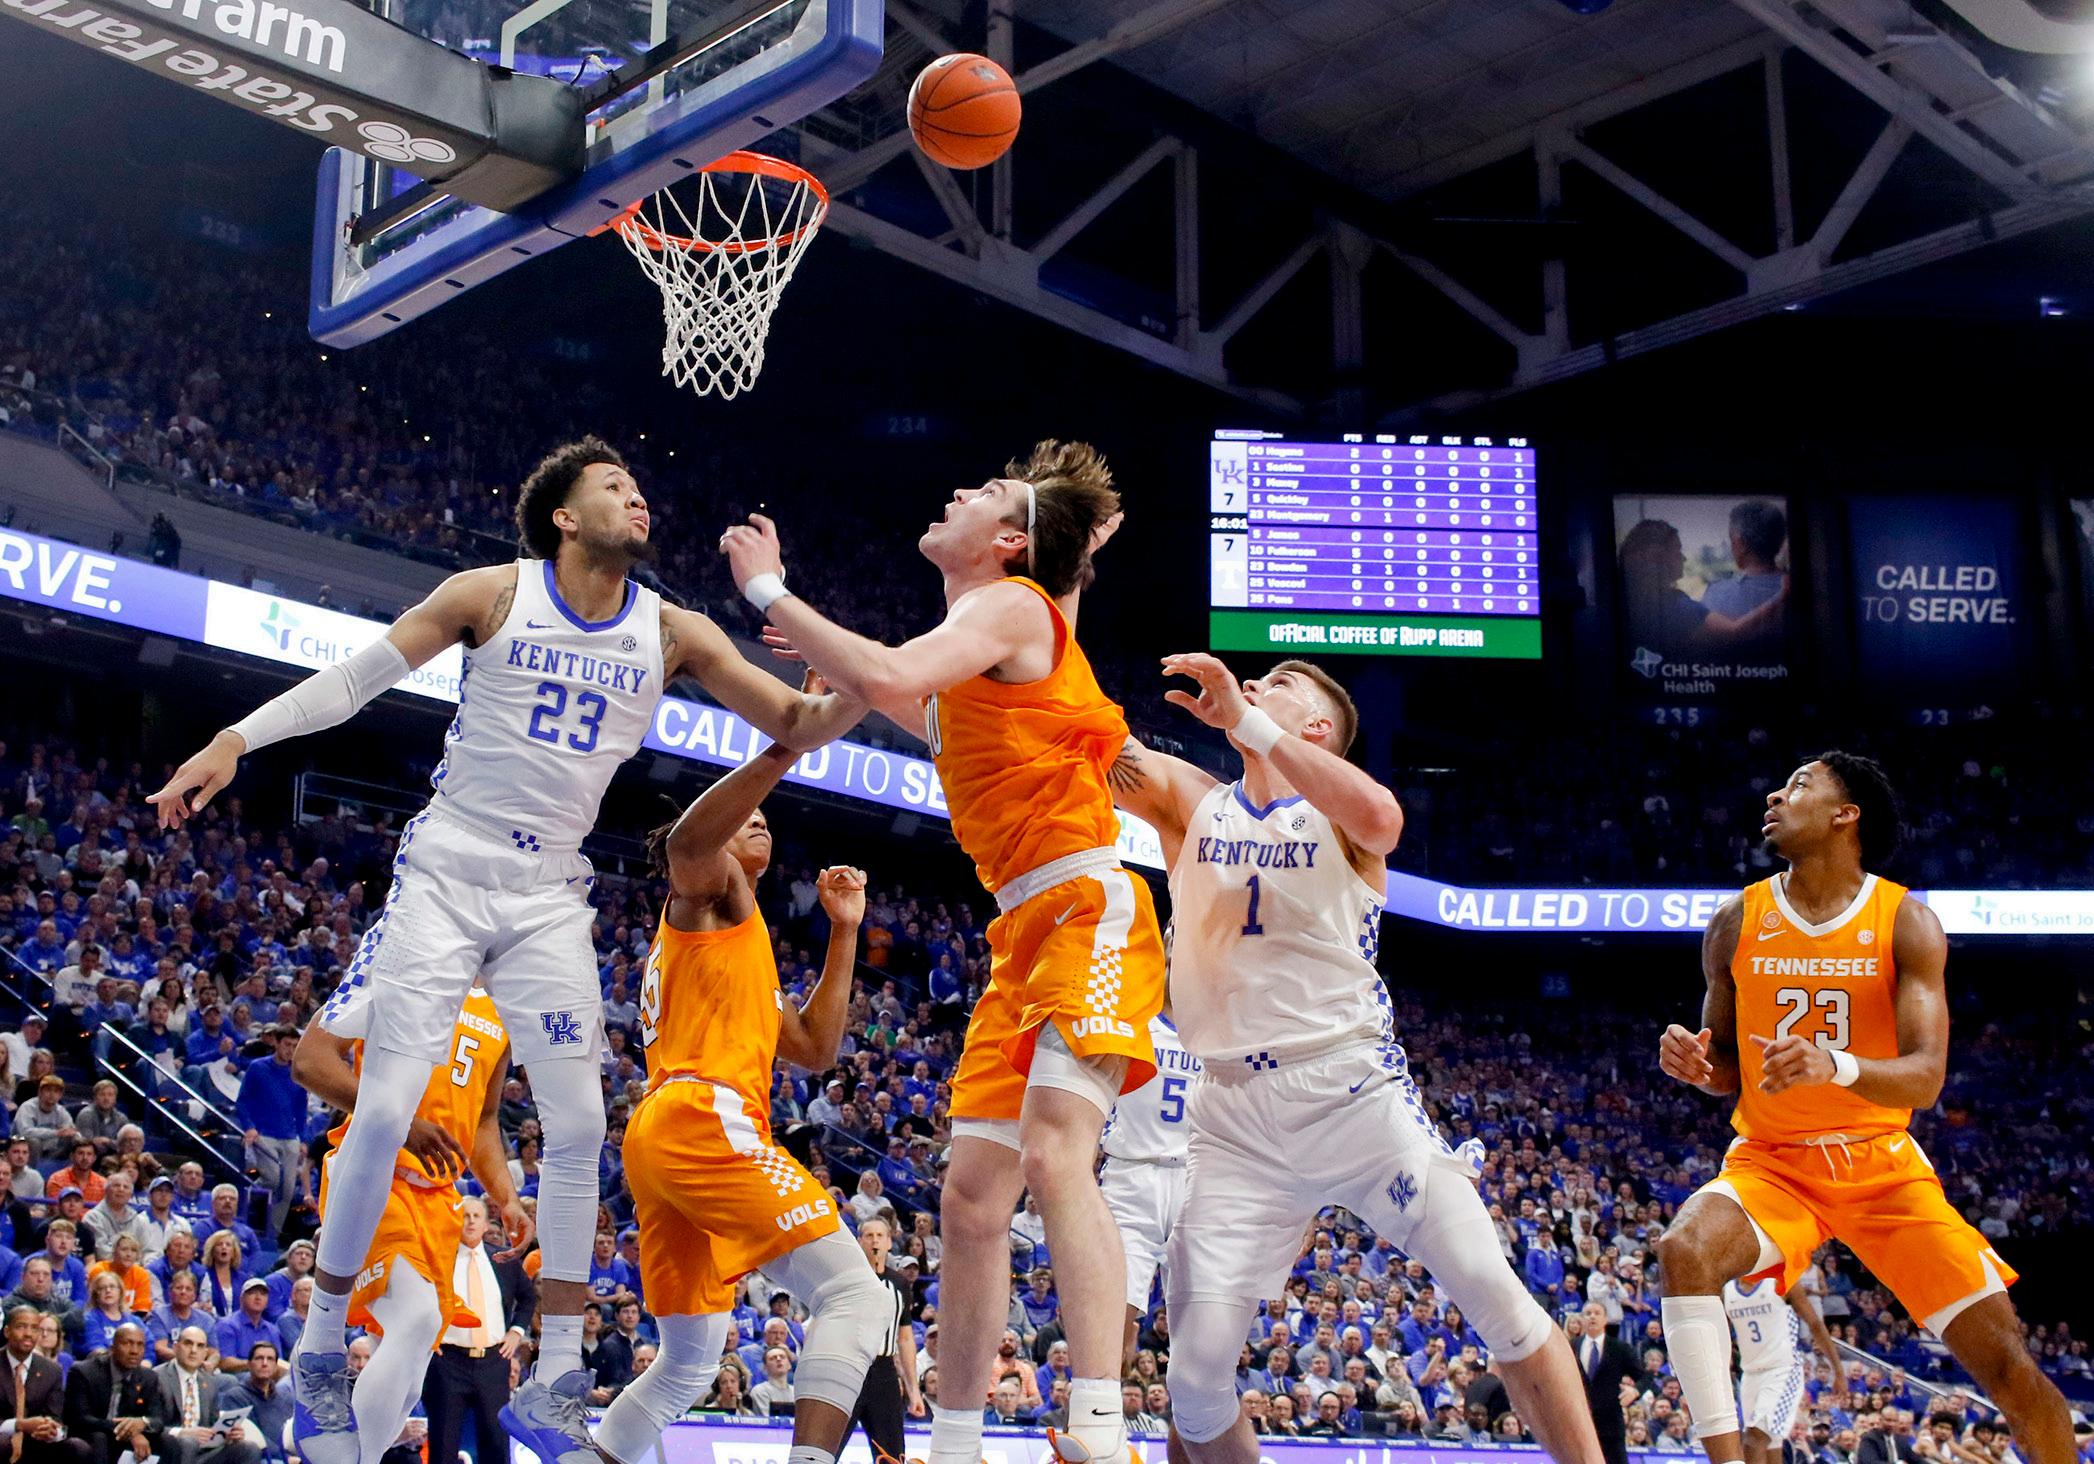
20
NCAA CHAMPIONSHIP WINS
$19.5M IN TICKETS
4 FINAL FOUR APPEARANCES