W ORK SAMPLE

ADA
2015-2024
DUXIXI SHEN
Project : Identification of Temperature Impacts on Residents in Madison, Wisconsin
Softwares: ArcGIS Pro, GeoDa, Google Earth Pro, Python
Technical Skills : Spatial Interpolation, Spatial Autocorrelation & Spatial Regression
Other Projects :
- Verification of ReBAM Spatial Structure in Guangzhou Using Mega Data
- Spatial Structure of Urban Agglomeration of GBA in China With Multi-Source Data
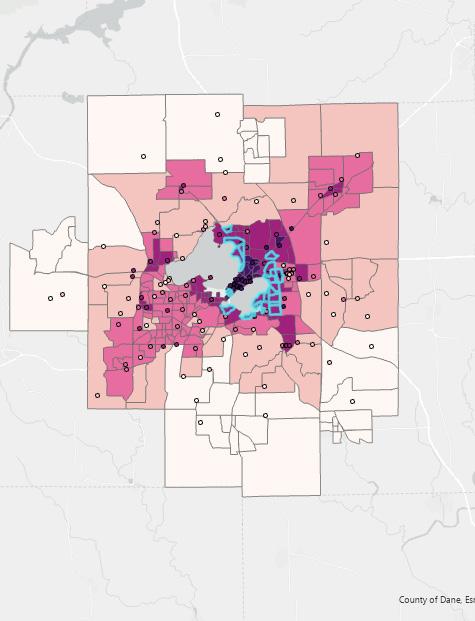
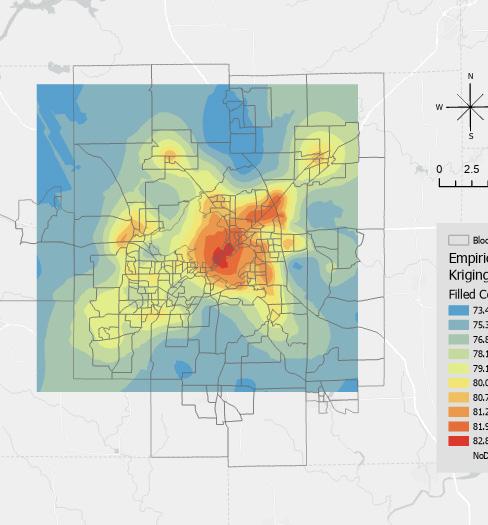
LEFT:
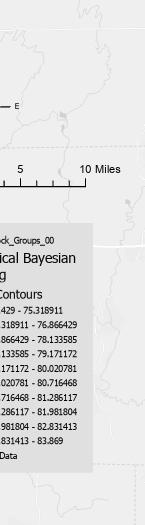
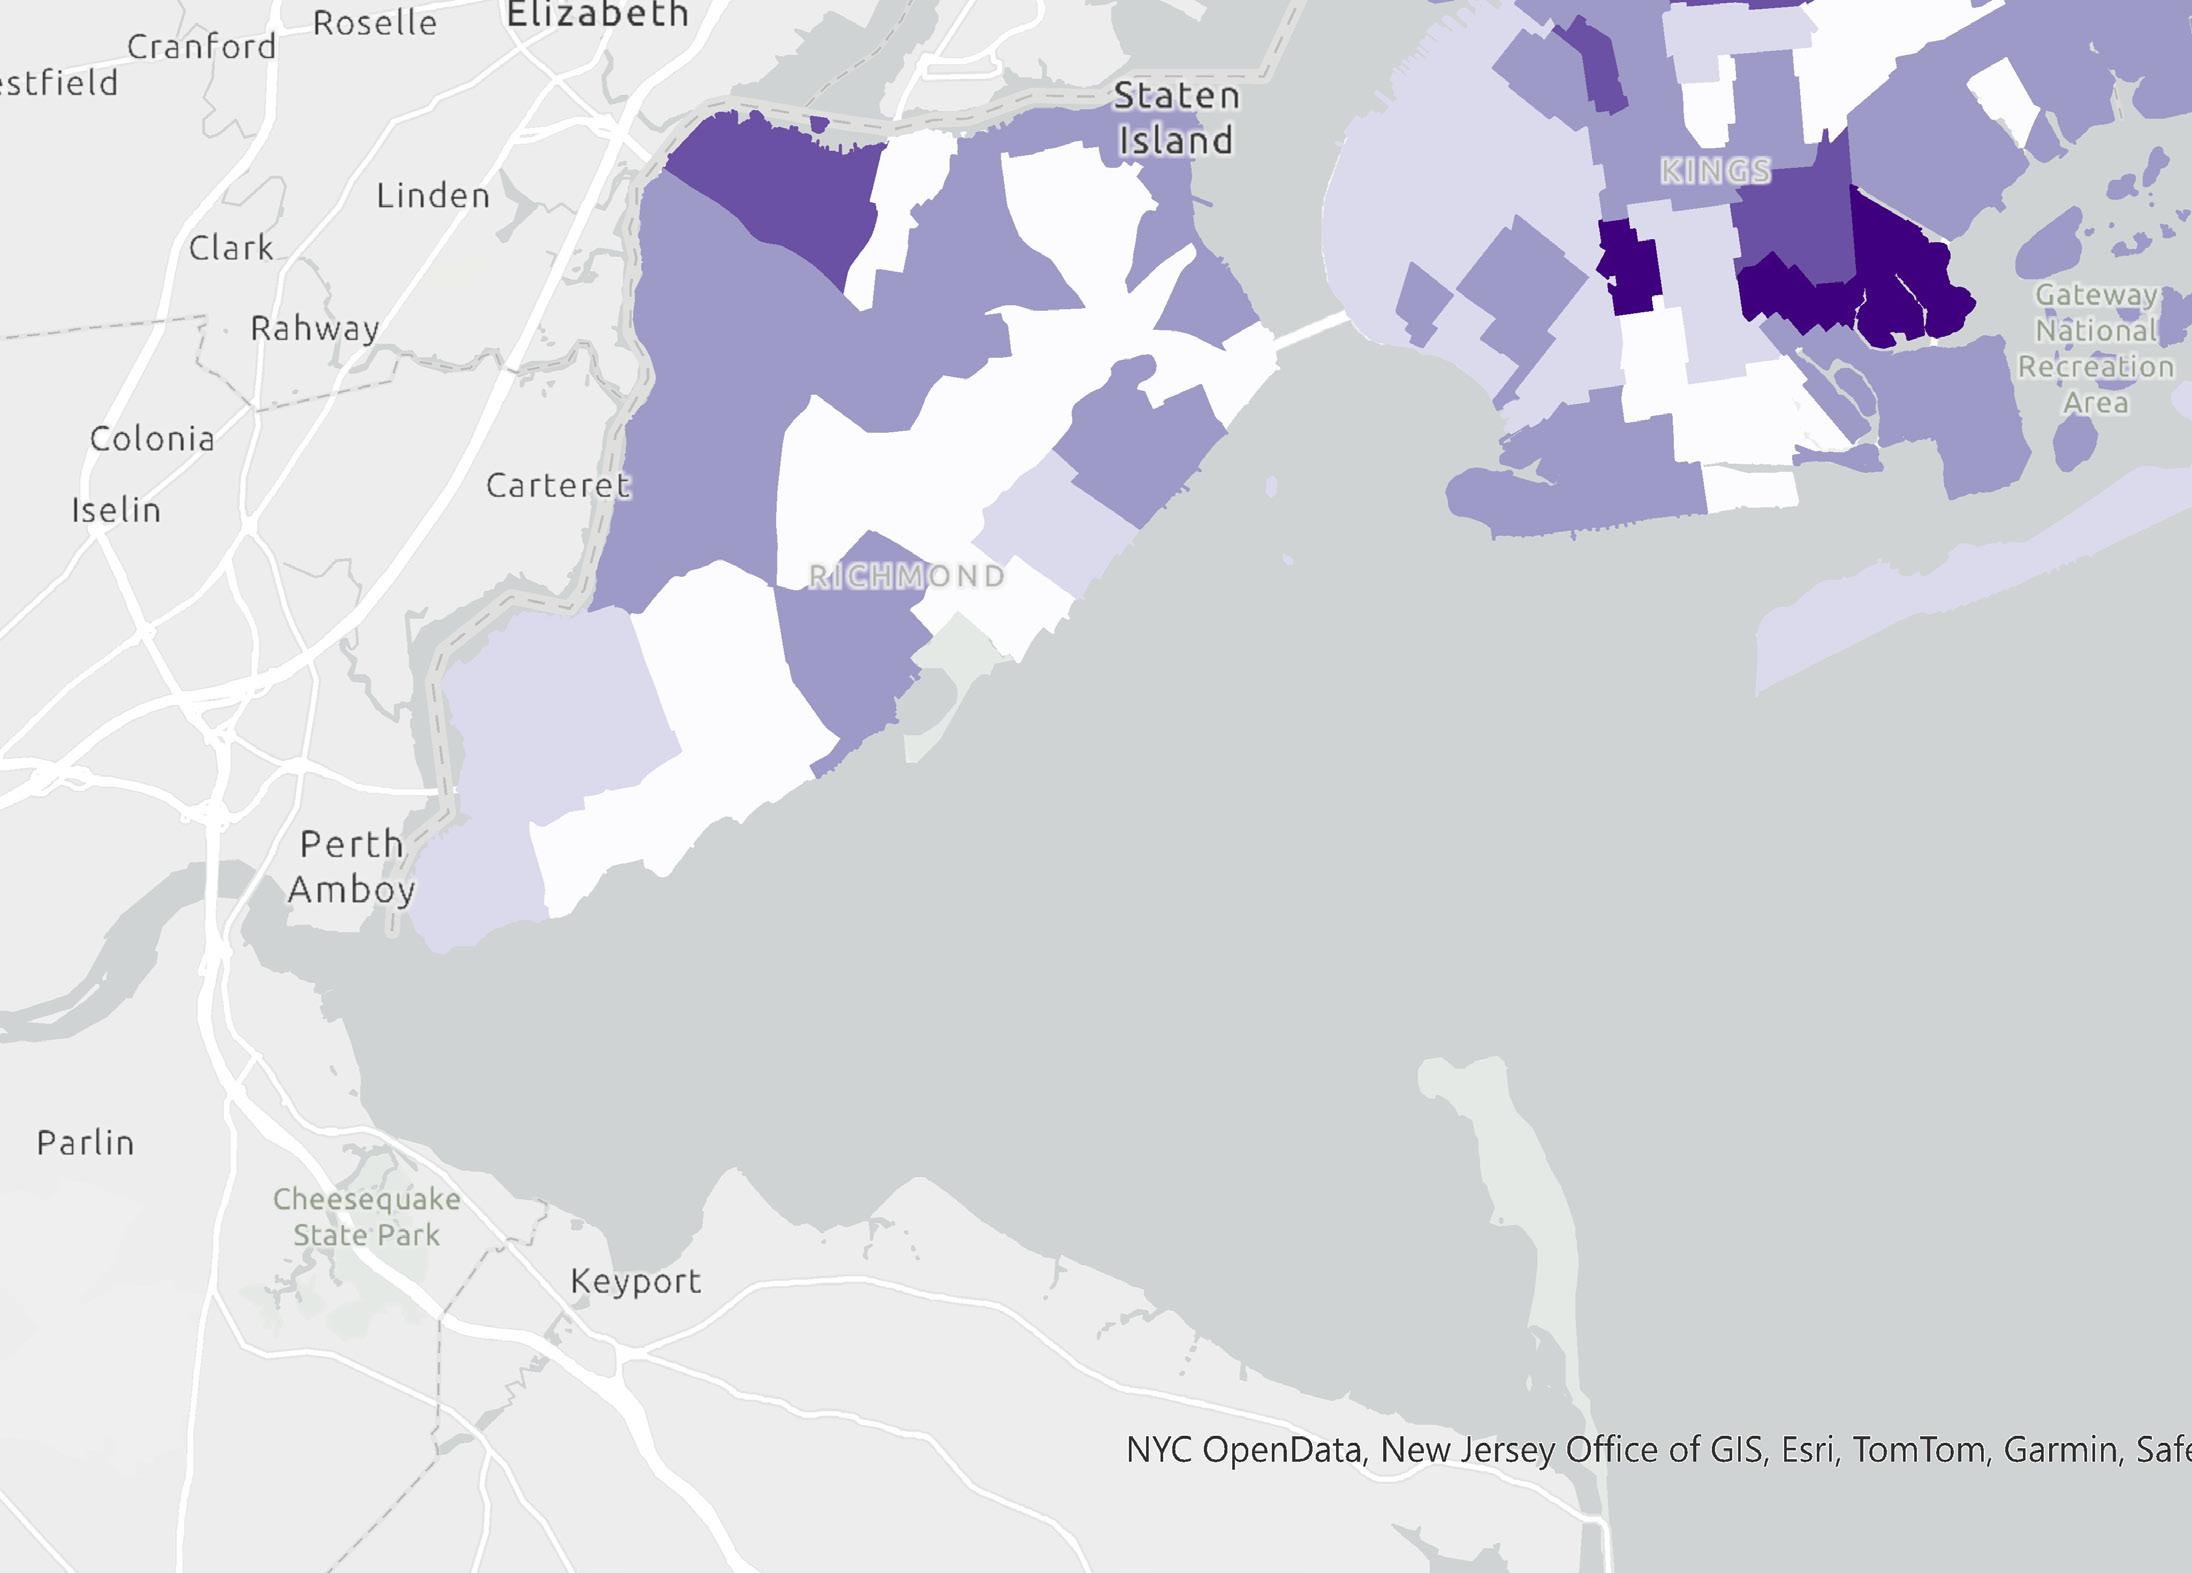
The map on the left shows the blocks groups with high average temperatures and a high density of residents over the age of 65. This identifies the areas with vulnerable groups in needs of heatrelated environmental justice.
During data processing, Empirical Bayesian kriging is adopted in spatial interpolation to account for the error introduced by estimating the underlying semivariogram.
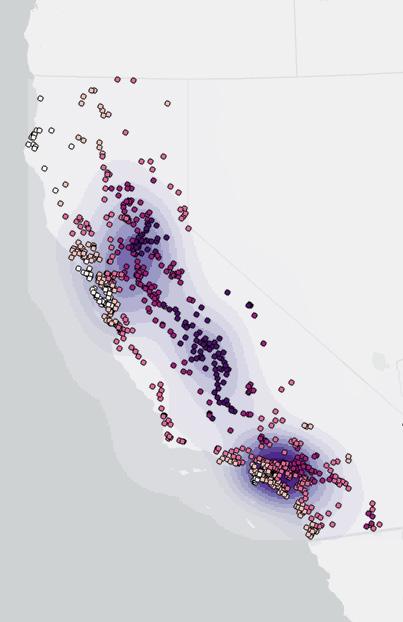
RIGHT:
The spatial pattern of ozone values in different cities in California
The Zoning Resolution of 1961 has continued to serve as the foundation for current zoning regulations of New York City. After more than sixty years of amendments, parts of the regulations in the Zoning Resolution have become excessively intricate and lengthy. It also still retains some outdated provisions from the past, including uses like typewriter stores that are no longer common nowadays.
The complexity of these regulations can pose challenges for businesses when seeking suitable spaces to accommodate their requirements. On June 1, 2022, a comprehensive rezoning proposal Zoning for Economic Opportunitywas highlighted in Mayor Eric Adams’ vision of “City of Yes” to support small businesses and job growth. This project will focus on Zoning for Economic Opportunity. This project is an extended study under this background. It aims to conduct an evaluation of the current Zoning Resolution of New York City to see how well the regulations are applied with the current business activities in the city.

By aligning business classifications with zoning codes and mapping commercial activities across NYC, the project systematically examines the prevailing conditions of economic activities and identifies the incongruities between businesses and zoning resolution. Unlike traditional methods, this study leverages diverse data sources to bridge the gap in employing big data analytics for zoning evaluation.
The results indicate that introducing new classification systems into use groups, merging akin districts to accommodate identical uses, endorsing new and small businesses proximate to residential intersections, and allowing community services and educational facilities in light manufacturing will effectively extend economic opportunities in NYC. Overall, this project aims to furnish a novel methodology for zoning analysis and provide strategic policy and planning recommendations to policymakers and planners in the zoning field.

Sankey Diagram of Zoning District and Use Group Counts of the Nonconforming Businesses
Distribution of Uses among Zoning Districts shows that the gap between businesses in similar zoning districts (i.e. C1 & C2) has
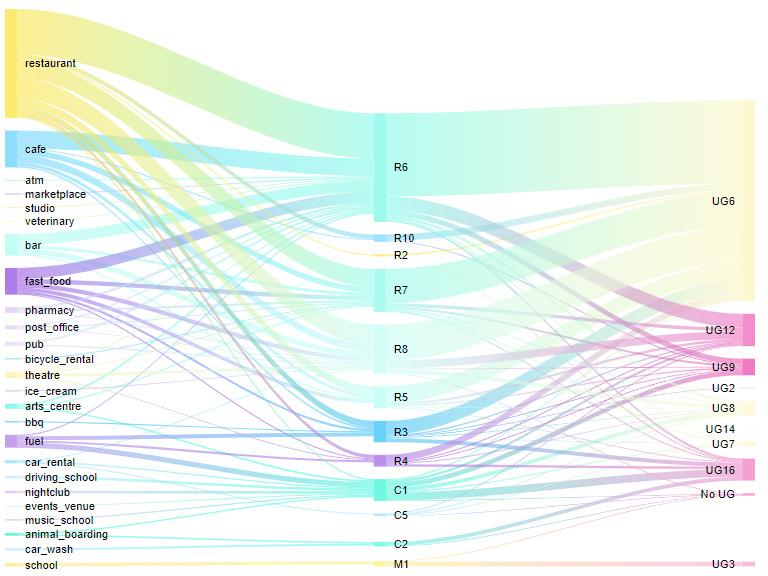


has narrowed nowadays.


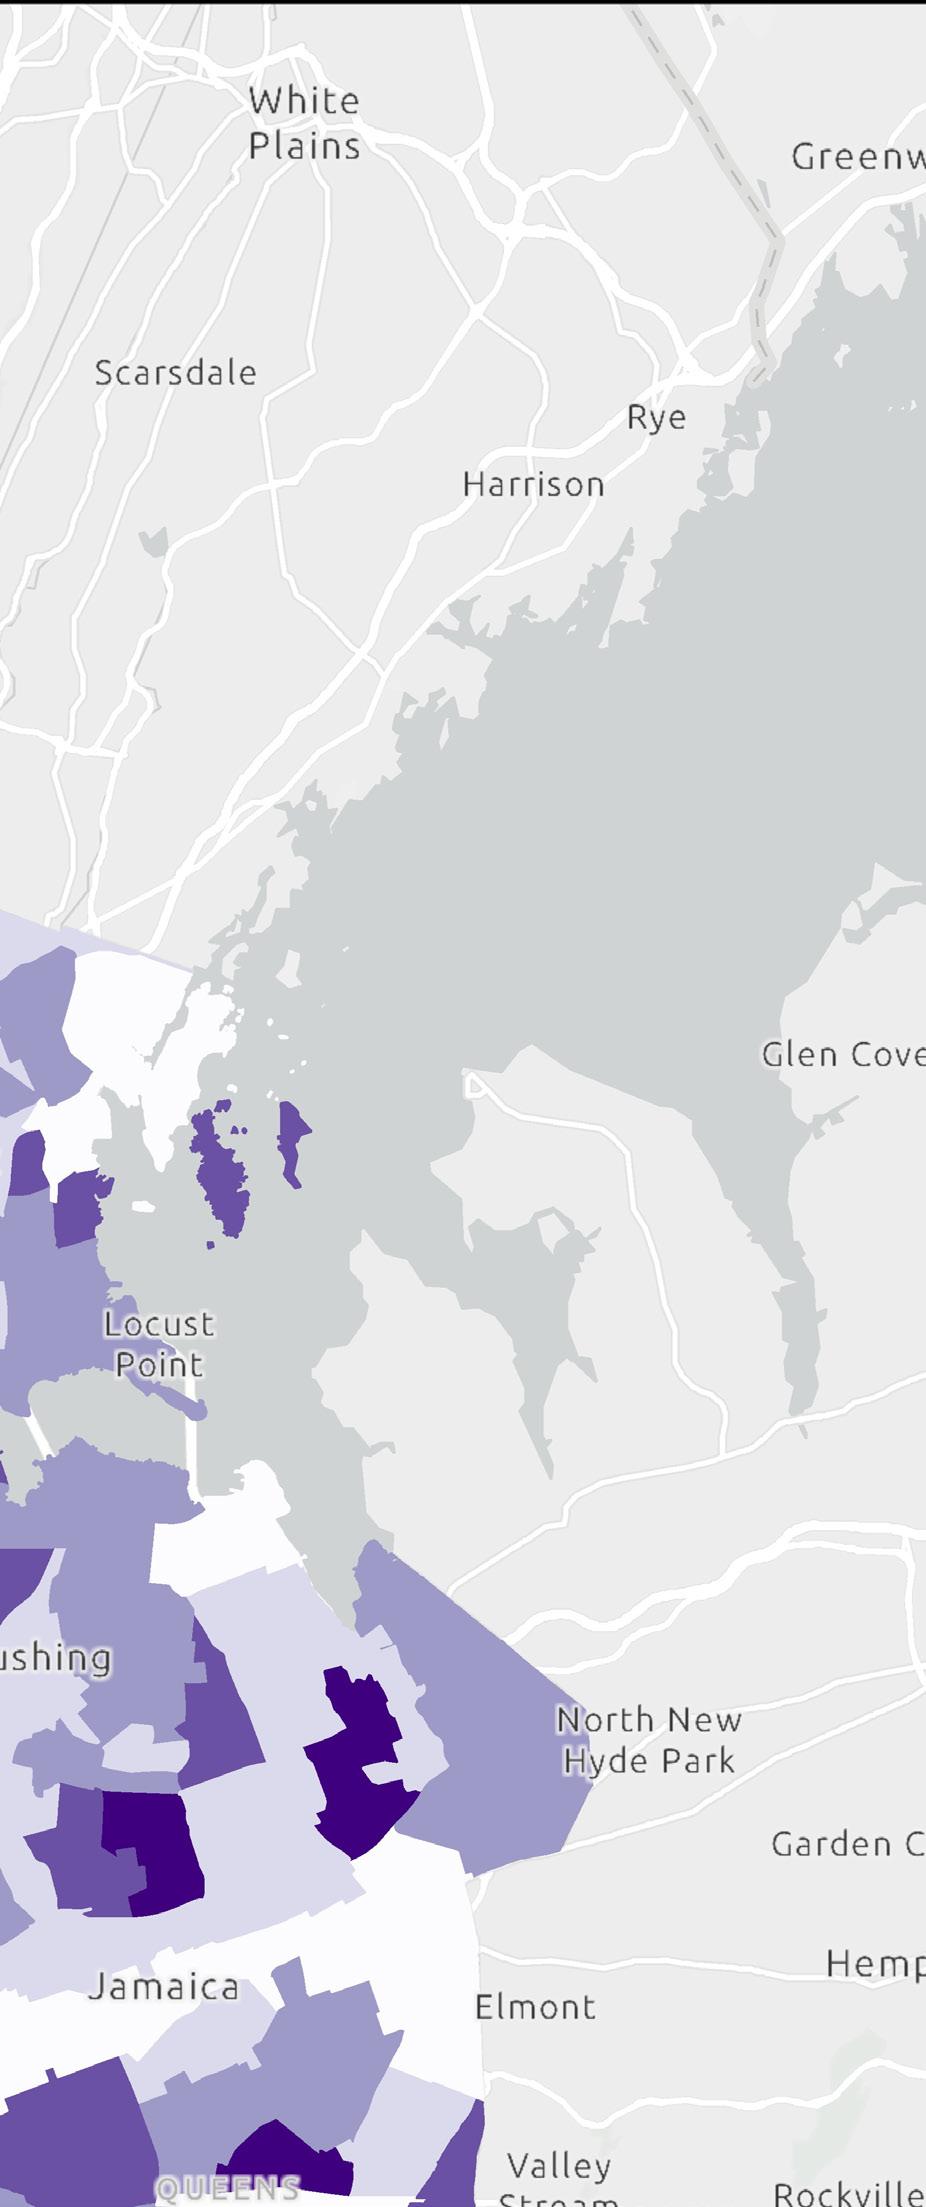
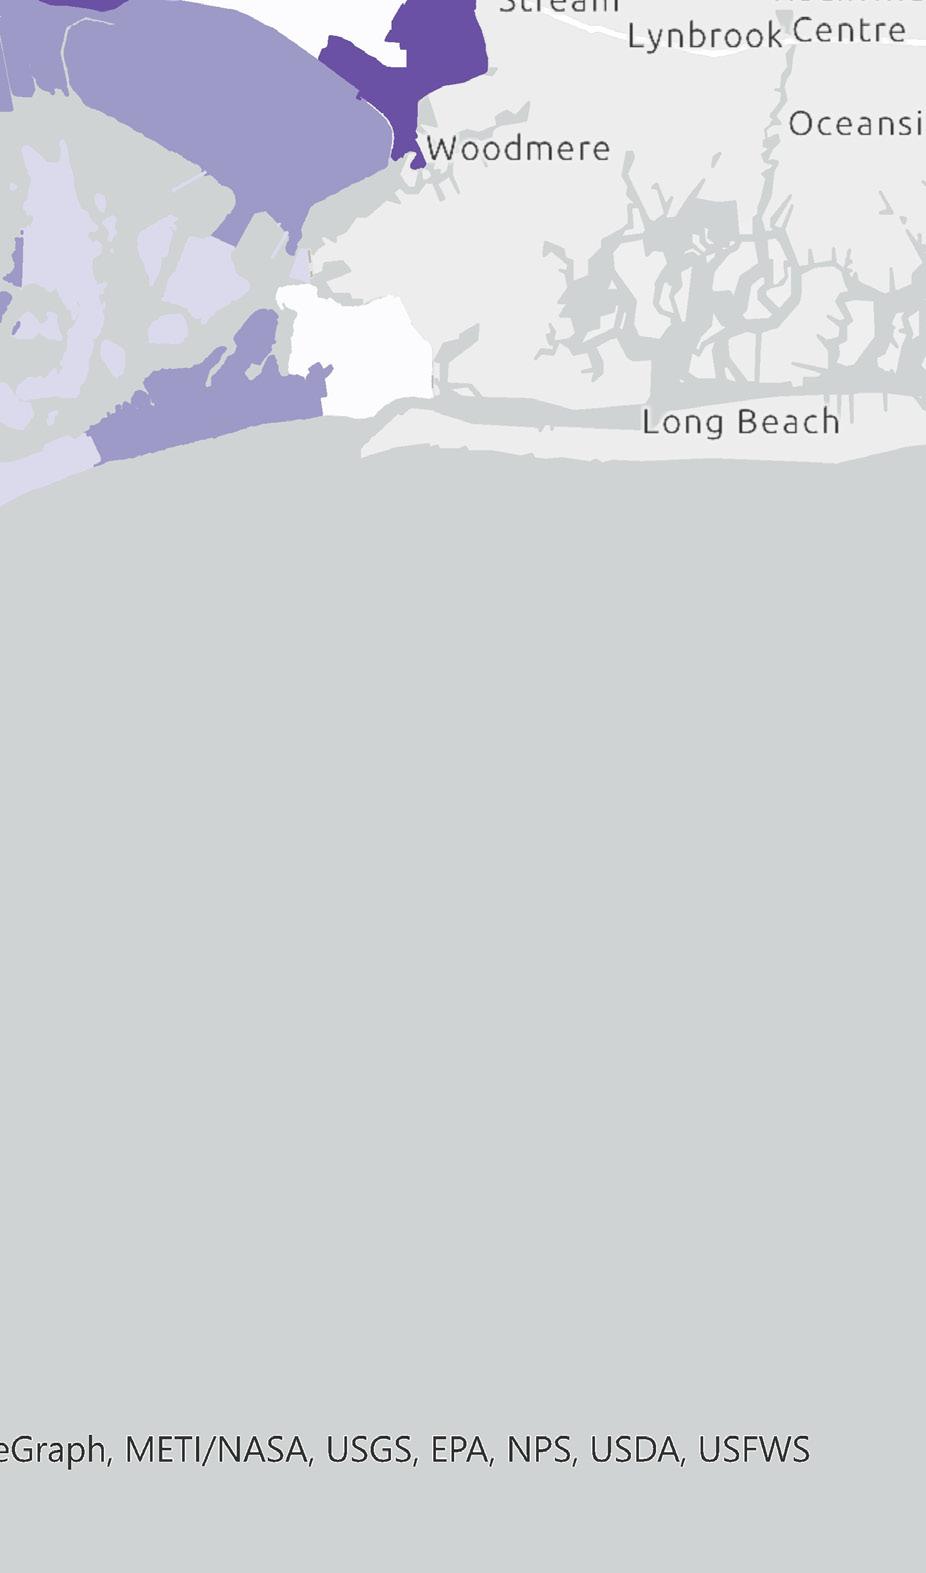
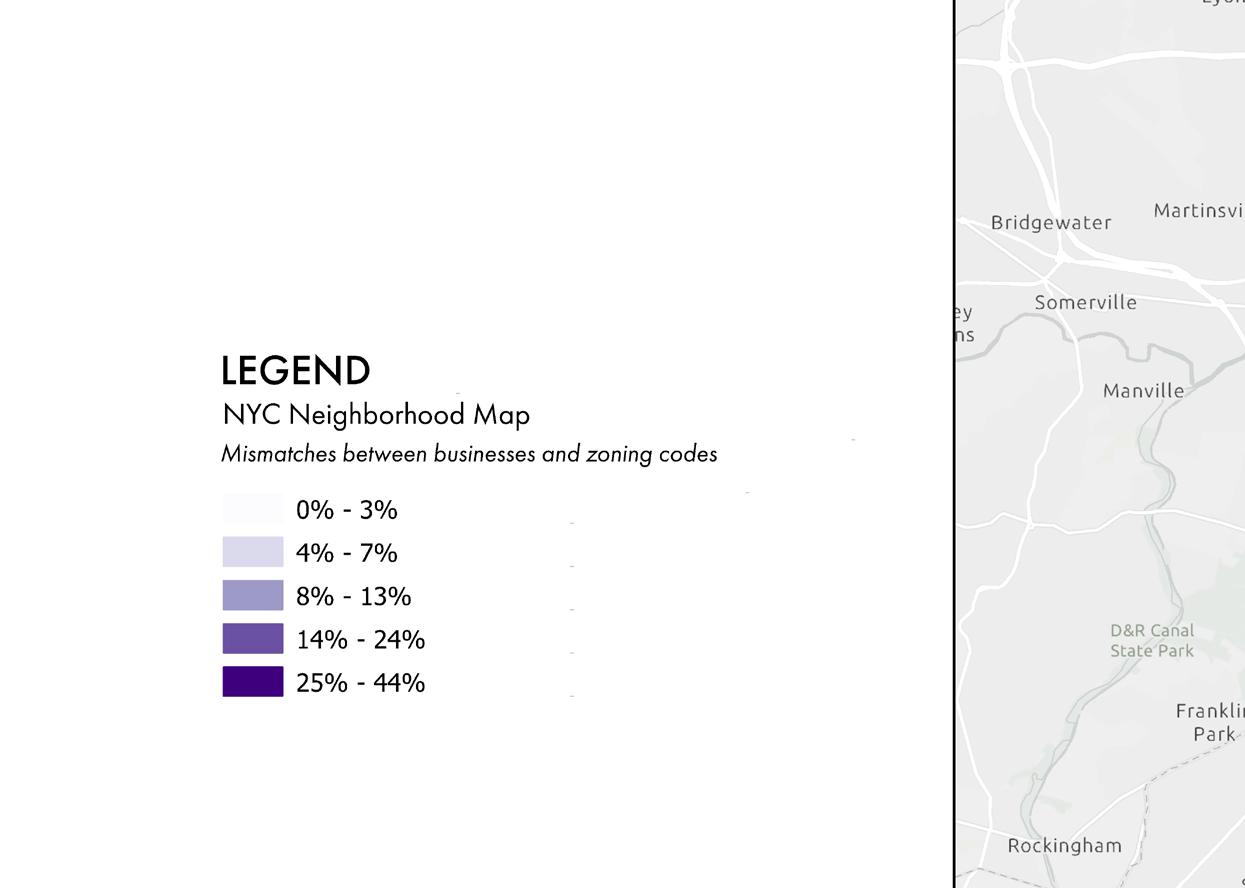
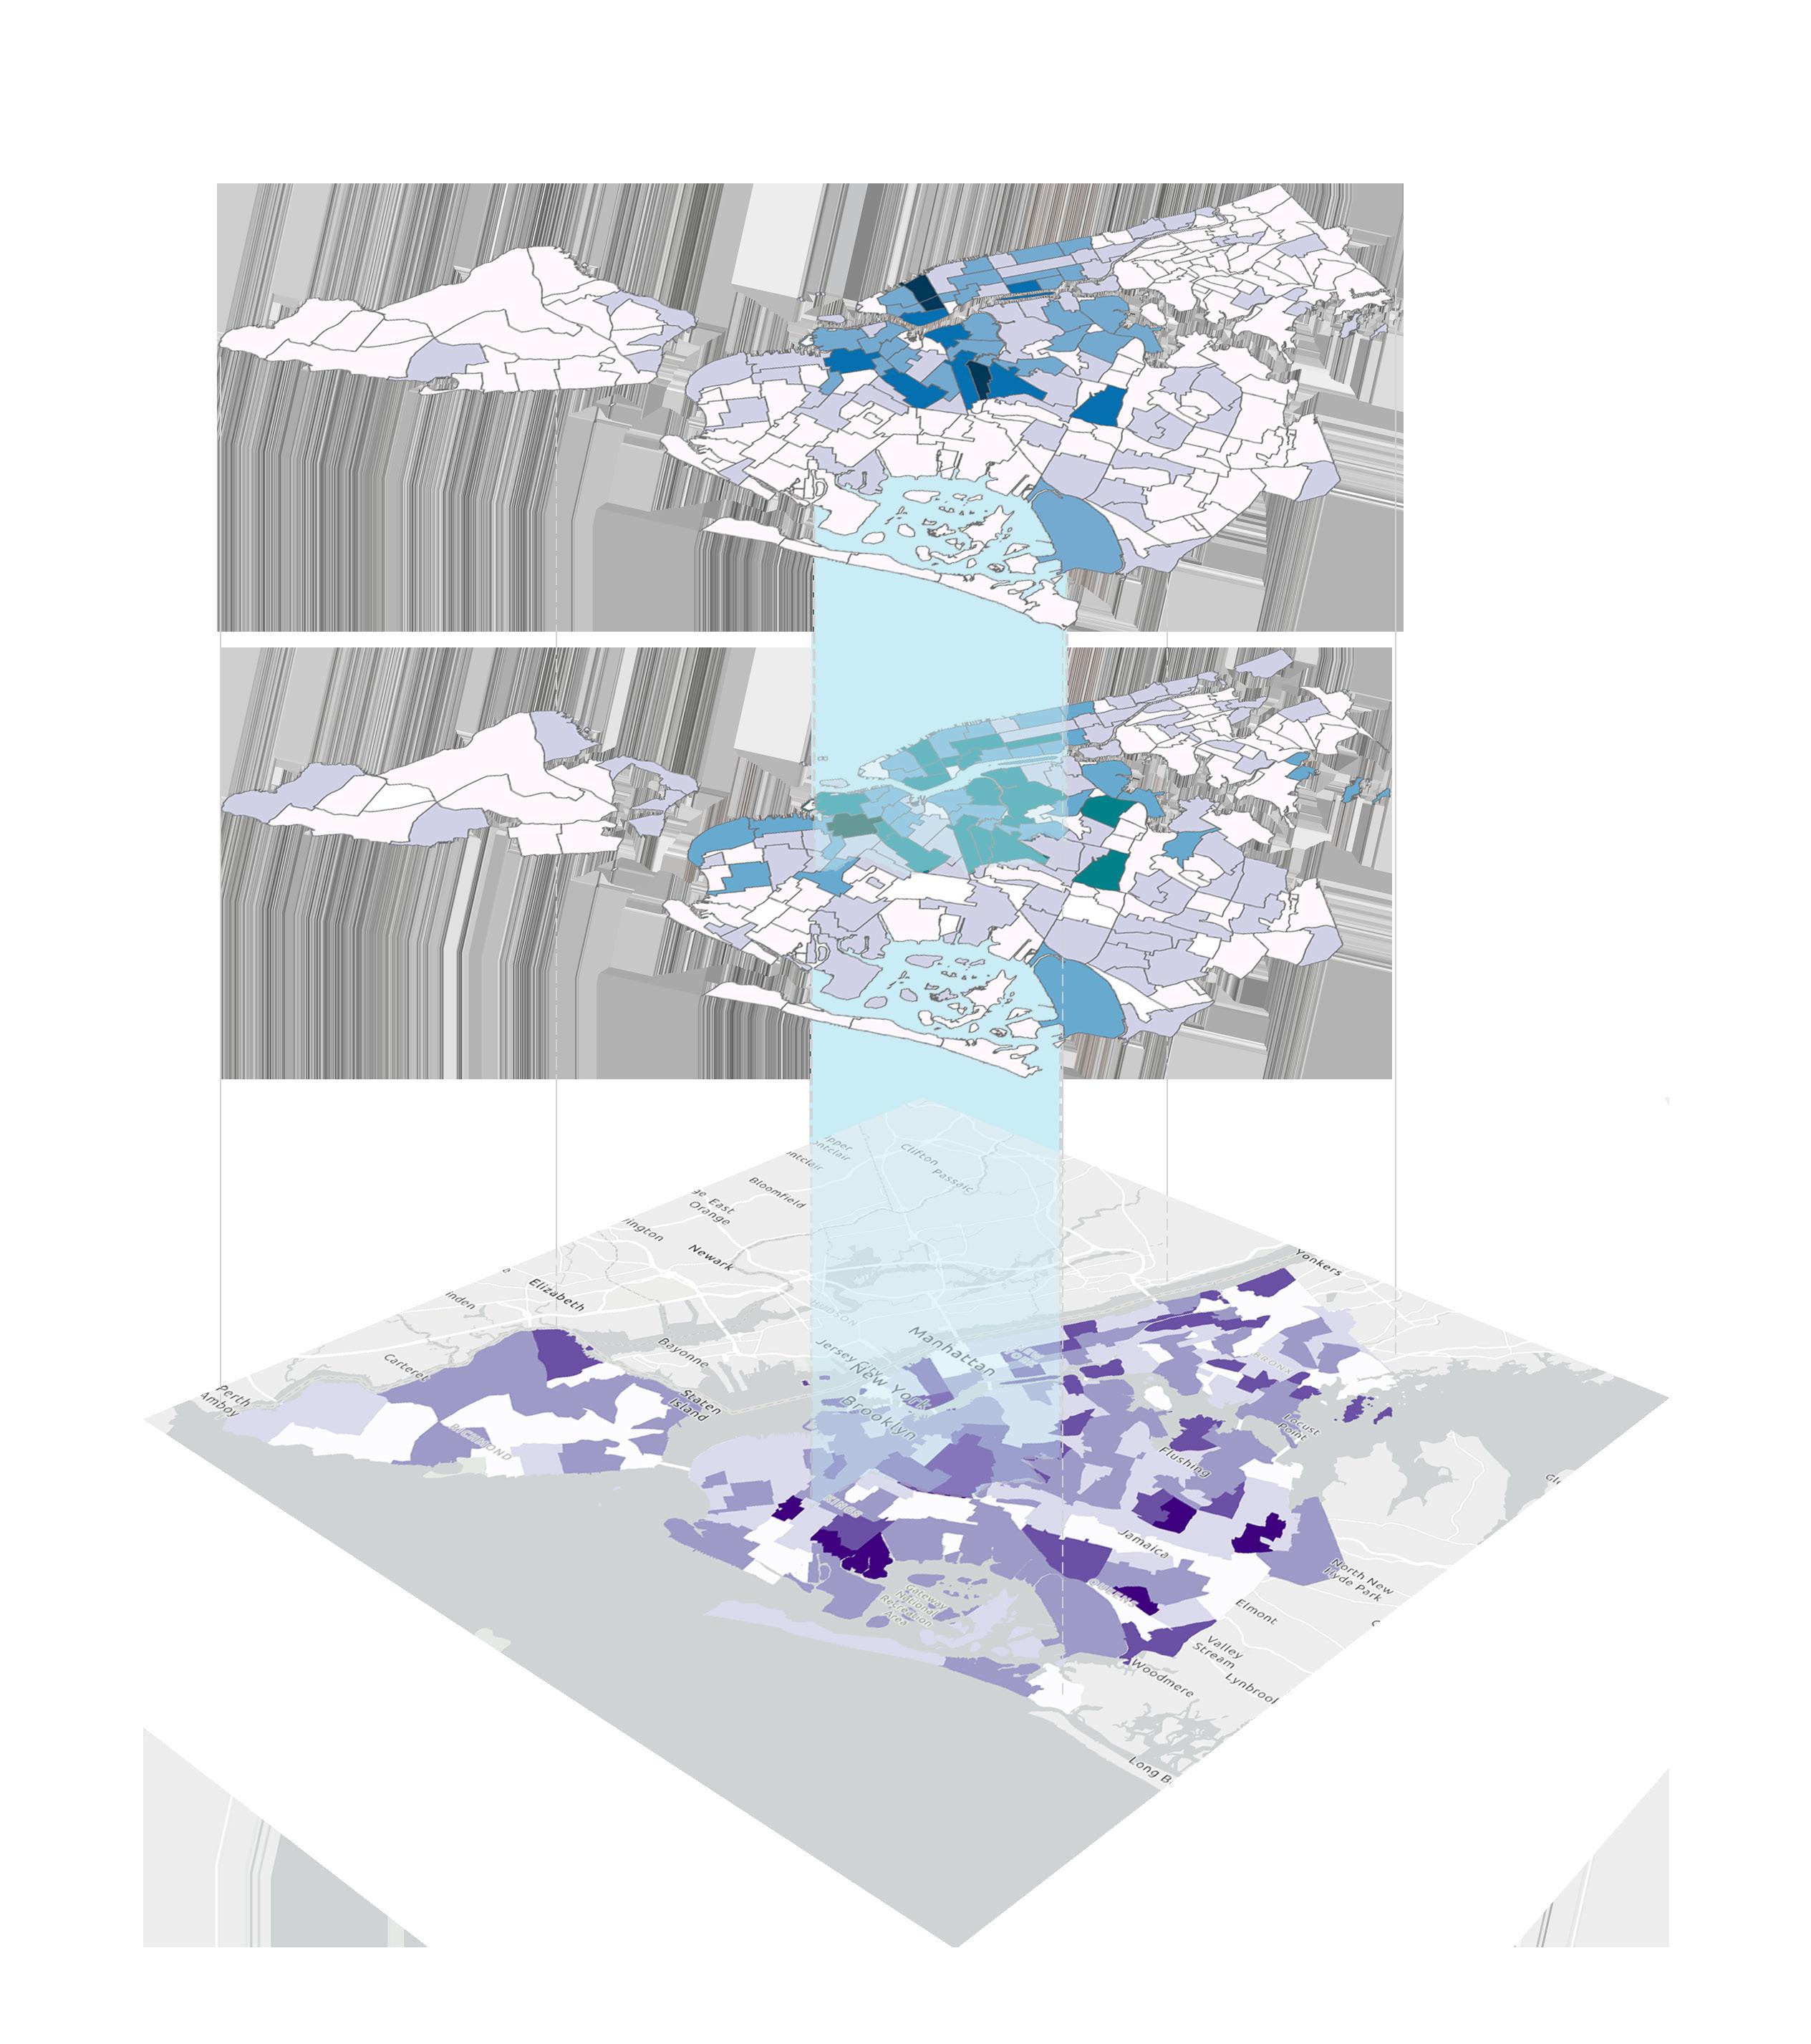
Where are the mismatches between businesses and zoning codes happening?
The complexity of zoning regulations can make it more difficult and costly for businesses to find space that meets their needs in the city. To understand where the complexity happens citywide, I made a map to calculate the count and the proportion of nonconforming businesses in each neighborhood:
- Count of Nonconforming Business
- Types of Nonconforming Business
- Percentage of Nonconforming Business
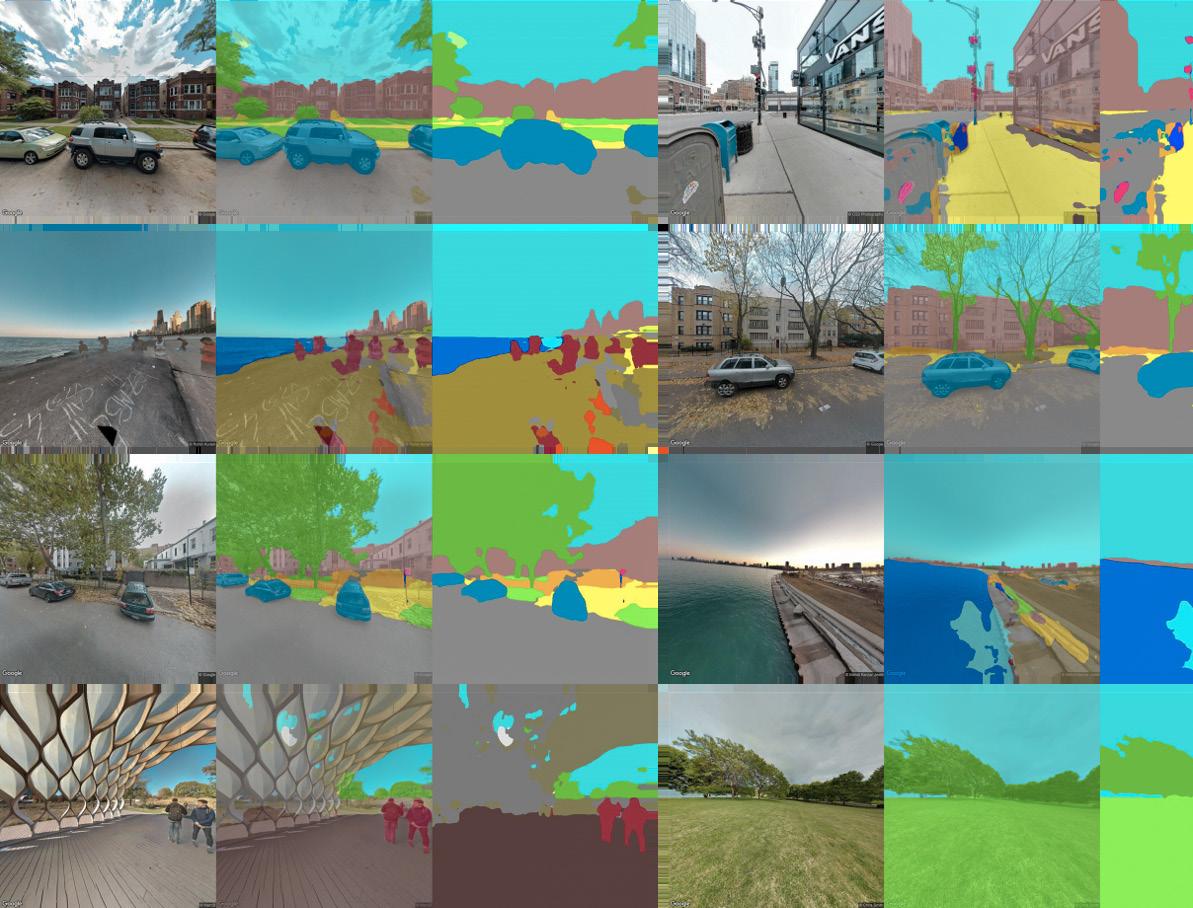
Project : Leveraging Street View Images To Analyze Travel Mode In the Greater Chicago Area Skills : Machine Learning, Image Segmentation Models, Python, Pytorch, Colab
The project explored the use of unstructured data for mobility modeling, leveraging the recently booming generative models of language and imagery to develop multi-modal understanding of the Greater Chicago area.
It adopted ResNet50dilated + PPM machine learning models with 15,000+ Google Street View images to derive census-tract features and study the region's demographic makeup, socioeconomic status, and mobility patterns. The handcrafted method produced a cogent regression result to reveal the relation between the built environment, the demographic features and the travel decisions.
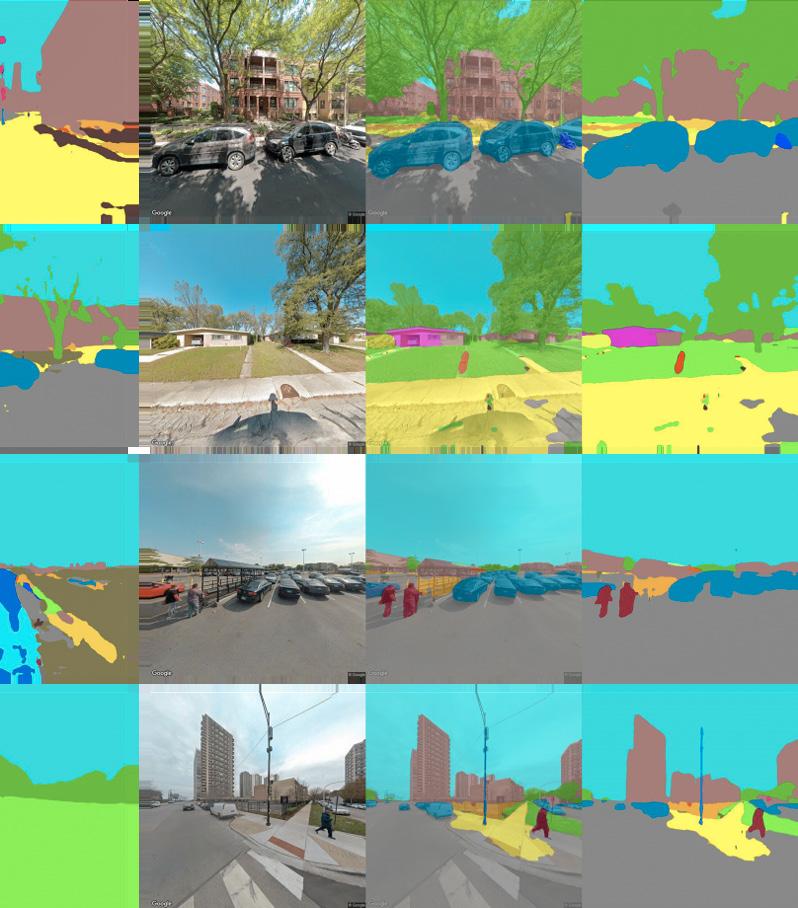
UNSTRUCTURED DATA
MODELS OF LANGUAGE
Google Street View Imagery explore leverage
ResNet50dilated + PPM
CENSUS TRACTLEVEL FEATURES
MOBILITY
METRICS
Travel Modes run +
Demographic Makeup & Socioeconomic Status derive


1) Summarized the overall situations of BRT system worldwide;
2) Studied the elements, the spatial layout, and the operating model of Guangzhou BRT;
3) Carried out a research and refined the model to analyze the best transit model between BRT and subway using the case study of the station with the highest trasit ridership-Shipai station.


1) Looked into the innovative management methods of transportation at the local level;
2) Elucidated the operating mode of Shared Traffic Joint Command and Dispatch Center of Shenzhen, which addressed the increasing problems of bike-sharing and food-delivery electric motors on road;
3) Evaluated the effectiveness of the program by quantitative and qualitative analysis and gave suggestions on how other cities could learn from the joint management mode in the sharing econmy era.
Analysed natural conditions, drainage requirements, multiple renewed planning documents, travel demand, eonomic development goals to redesign the main street of Hualong Town using AutoCAD.

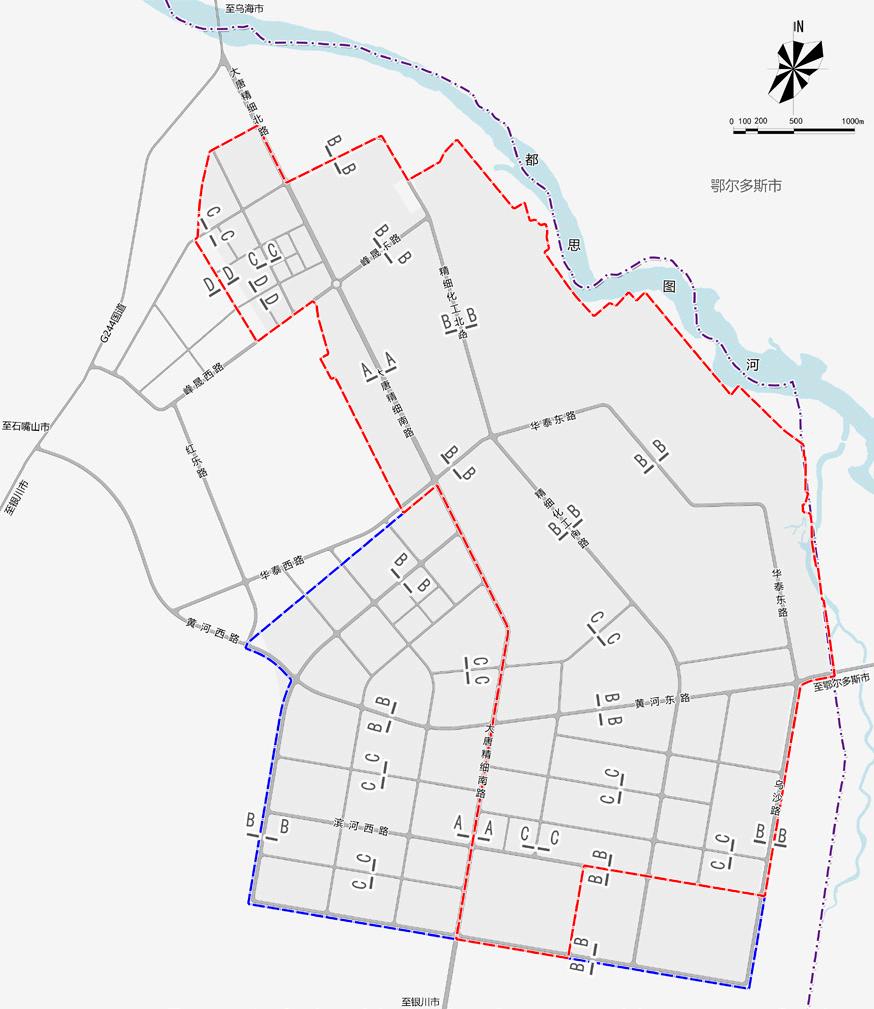
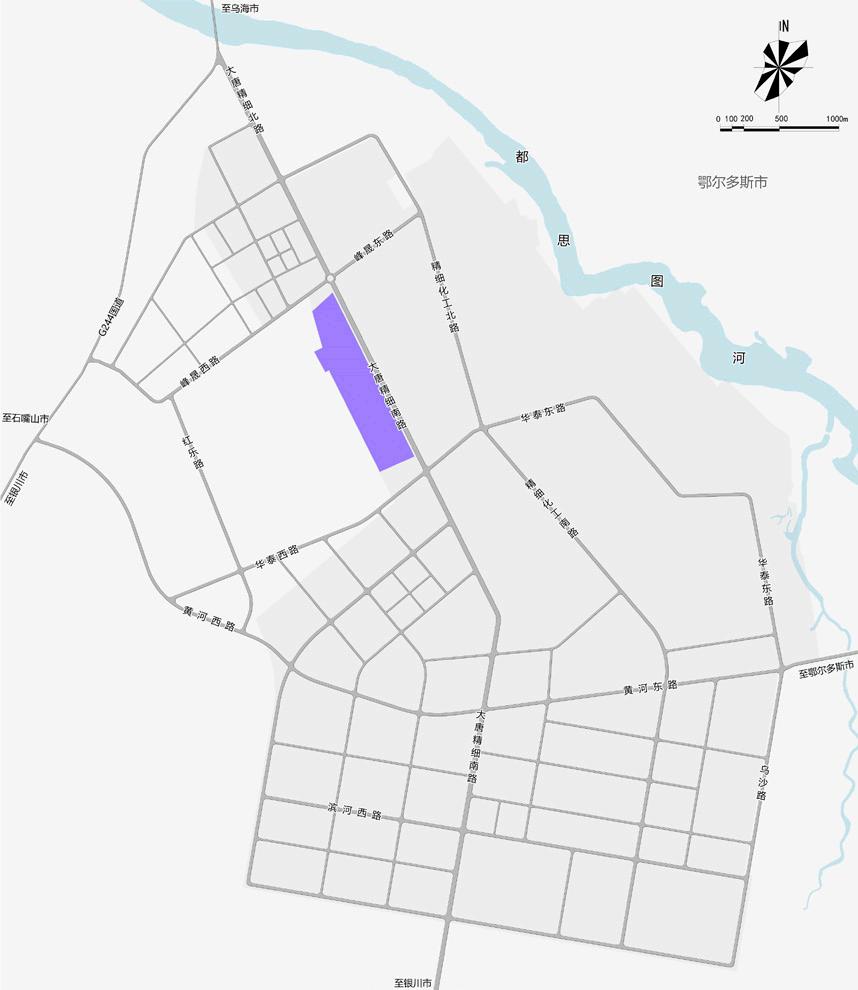
Client: City Government of Shizuishan, Ningxia Province, China
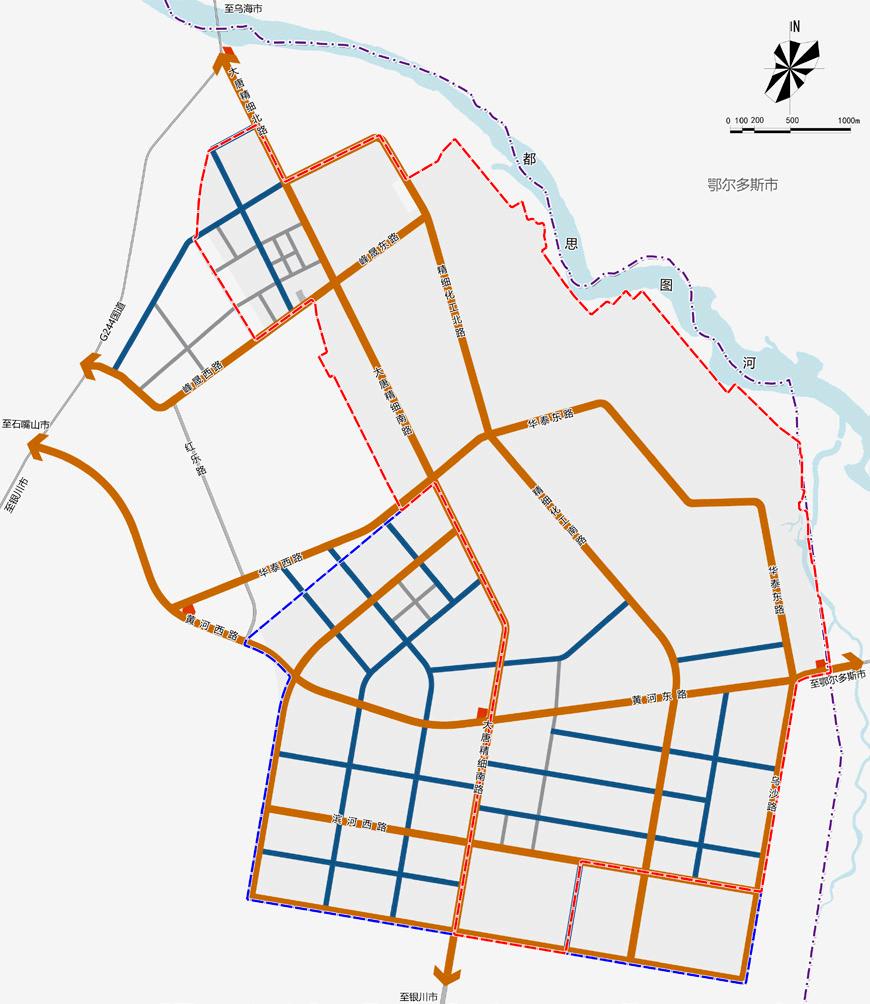
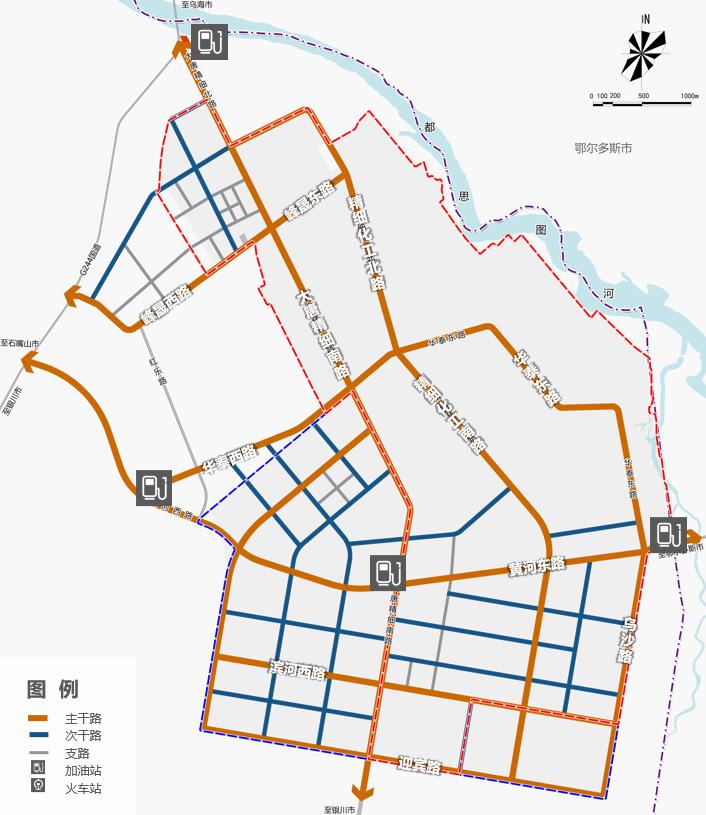
Project: Master Plan of Pingluo Industrial Park
Graphs:
Road System Planning Map
Road Section Map
Public and Freight Transit System Map Transportation Planning


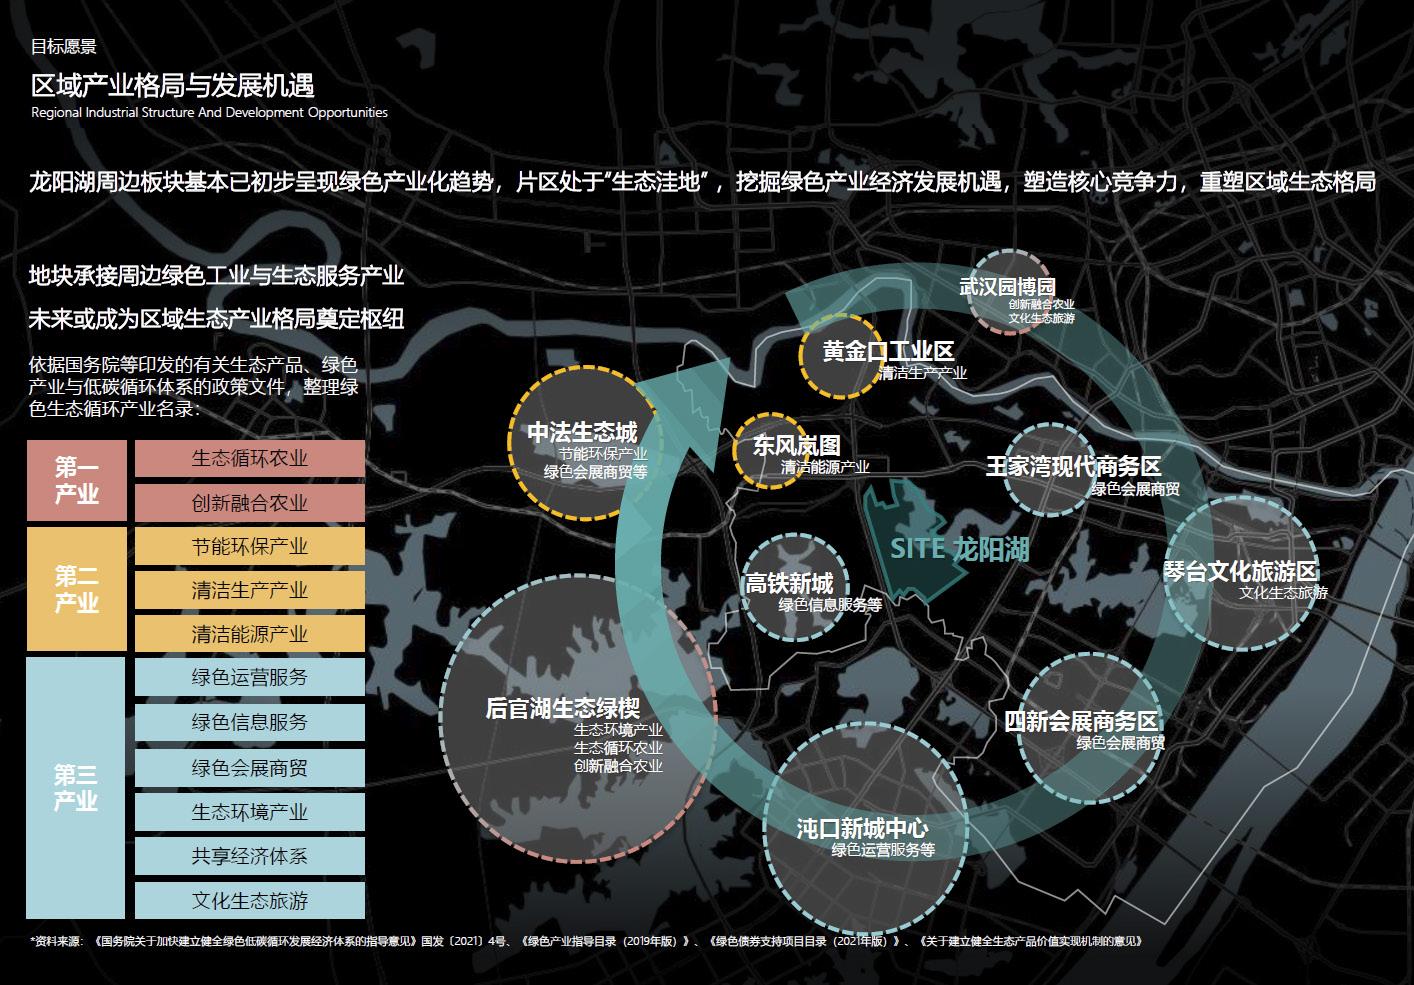


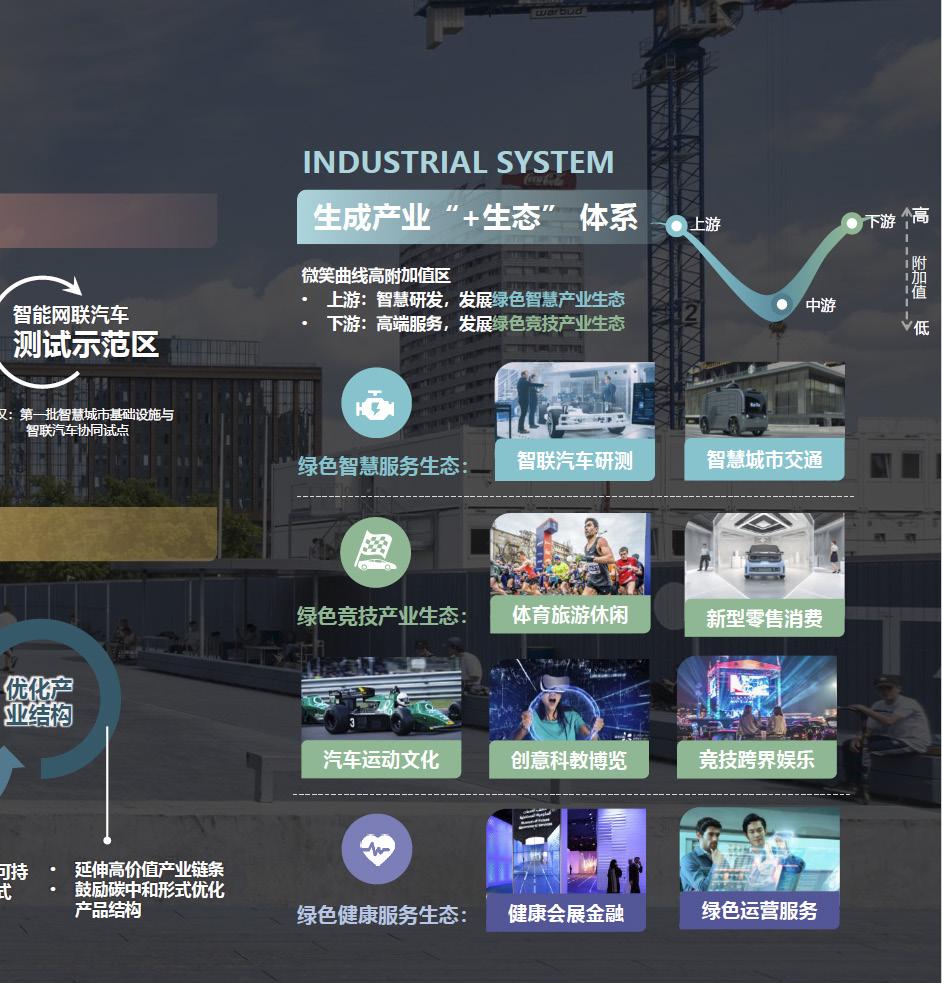
Project: Planning of Wuhan Motor-Sport Town (AECOM)
Client: Wuhan Zhongqin Jingyang Industrial Developement Co.,LTD
Year: 2021
Skills: Location and Market Analysis, Industrial Research, Operating Strategy
1) Regional Industrial Structure And Development Opportunities
- Explore the economic development opportunities of green industry
- Create the core competitivenes
- Reshape the regional ecological pattern
2) Industry Development Strategy
3) Planning Scheme: Core Product 1
4) Case Study of Project Operation 2


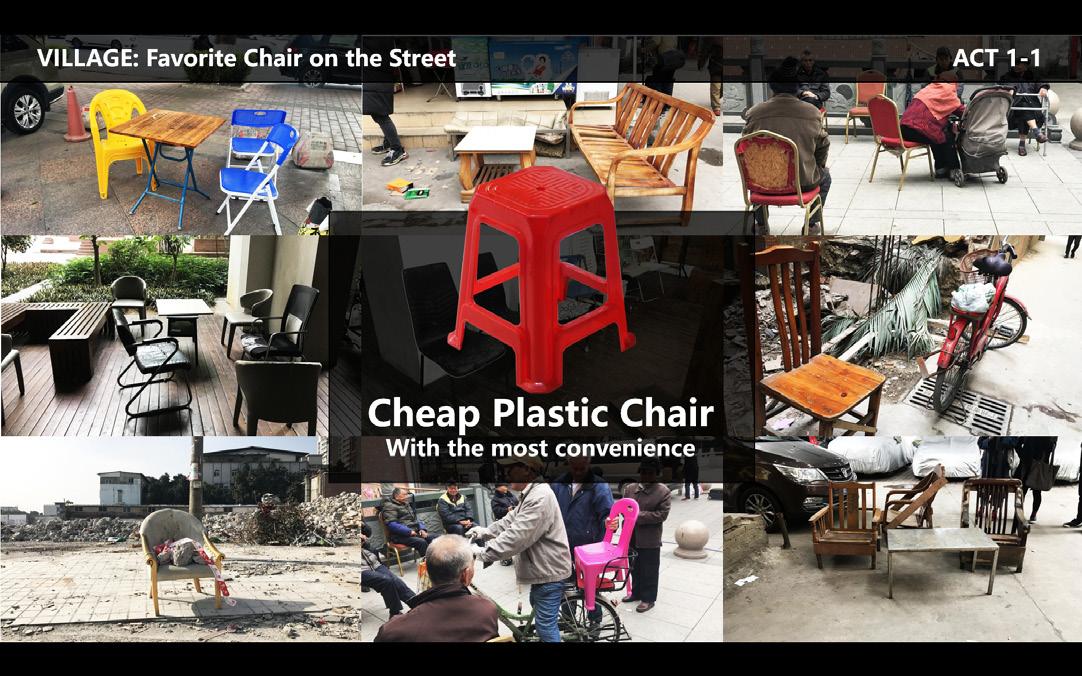

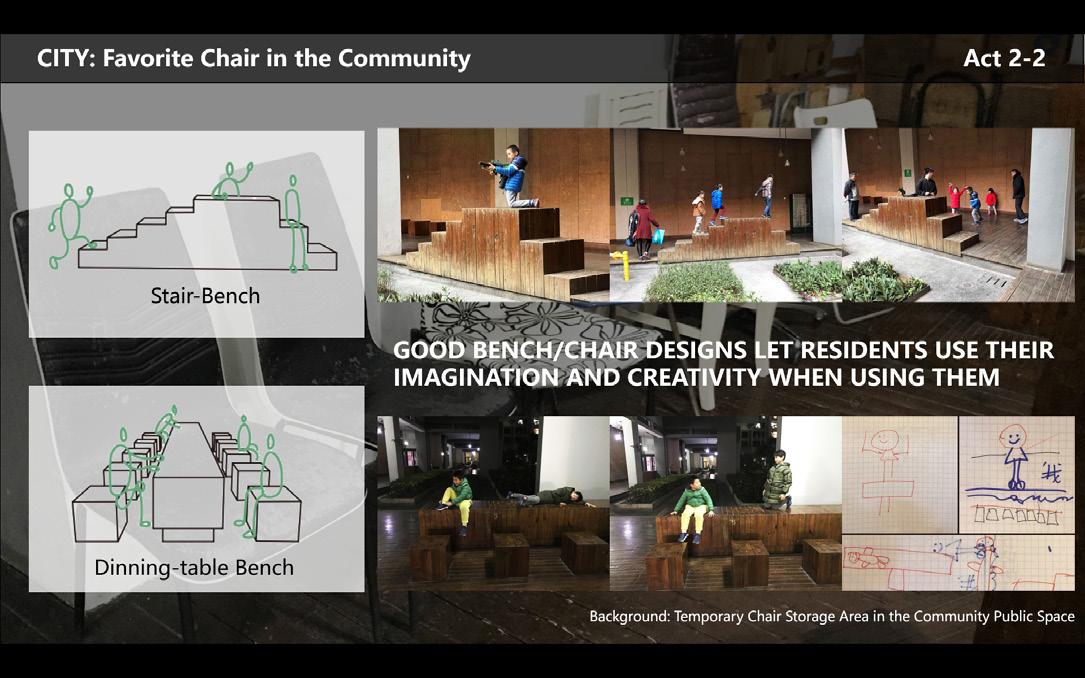


Project : “Chair Scape – Game of Chairs”: Community Workshop
Method : Fieldwork, Video Recording, Collection of Stories and Spatial Cognition Maps
Role : Team Leader
Skills : Community Engagement, Social Research, Leadership, Presentation
- Conducted community engagement and studied relationships with the residents' recreational behaviors and the public physical environment
- Revealed the differences of chair-scape between the urban area and the rural area next street
- Delivered a presentation on the theme of “What makes a good design? What is good POPS management?” as the team leader
Client : The Pew Charitable Trusts
Company : Cornell Local Government Restructuring Lab
Reliable and affordable high-speed internet connectivity has become fundamental for economic and educational activity, especially during and after the COVID-19 pandemic . In Oklahoma broadband access is critical for online learning in K-12 schools and in colleges, while professionals need broadband connections to make teleworking arrangements and file documents via the Internet. Unfortunately, 20.9% of the residents in Tribal areas across the U.S. lack coverage from fixed terrestrial 25/3 Mbps internet connection, compared to 17.3% in rural areas and 1.2% in urban areas according to a recent report published by Federal Communications Commission (FCC).
The Choctaw Nation of Oklahoma, the third largest federally recognized tribe in the United States, is located in the southeastern corner of Oklahoma State. The Choctaw Nation was one of the first “Promise Zones” across the country, which has helped fund improvements in the job market, infrastructure developments, and educational opportunities since 2014.
In 2015, the U.S. Department of Housing and Urban Development (HUD) published a Federal Register Notice for local public housing authorities to assess their interest in joining forces in closing the digital gap in their communities. The Choctaw Nation of Oklahoma was one of twenty-eight communities that responded and was selected to participate. On July 15, then-President Obama visited the Choctaw Nation to announce the ConnectHome program, which aimed to narrow the digital divide for students in grades K-12 living in public and Indian housing.
This report explores the digital equity efforts of the Housing Authority of the Choctaw Nation of Oklahoma (HACNO) over the last few years. HACNO launched a variety of housing programs for tribal members, including the Lease to Purchase program (LEAP), and 202 Supportive Elder Housing. Different from most of the housing authorities in the U.S., many HACNO developments are in remote areas without any ISP coverage. Therefore, a great number of the public households could not access internet services from their homes before the ConnectHome program was established by the tribe.

2. Challenges in terms of the State of Connectivity in Public Housing
2.1
When HUD first started the ConnectHome project in 2015, the coverage of Internet access was rather poor. The National Baseline Internet Access Survey conducted by HUD surveyed the reality of residents’ connectivity back in 2015. The results showed that only 34% of the households had high-speed Internet access with computers, laptops, or tablets; 35% were under-connected and 31% had no Internet access. As one of the “Promise Zones” across the country in 2015, the Choctaw Nation’s 10.5 counties covering approximately 25,000 square miles fell into the last category or no internet access.
“The connectivity was very minimal,” said Josh Raper, the current Manager for the Choctaw Connect Home Department, “I mean, we struggled because we are a rural area.” Activities like visiting school calendars and educational websites, filing health information and job applications, and reaching out for schoolwork help were essential actions that required Internet access for Choctaw Nation residents. However, there weren’t any Internet Service Providers (ISPs) serving the entire geographic area before 2015.
2.2
One reason why many ISPs were not interested in building infrastructure is that the terrain of the Choctaw Nation is so large that it even exceeds some states, like New Hampshire or Rhode Island, and the housing is spread out. Those residents of the Housing Authority of the Choctaw Nation of Oklahoma (HACNO) who had internet access, primarily relied on satellite or cell towers. Although fiber would have higher speeds and fewer interruptions, laying fiber and establishing Internet service in these areas would be costly. In some places, even when wireless internet alternatives were accessible, the speed test may show poor connectivity results due to the considerable distance from infrastructure towers. The vast geography also posed another barrier for housing authority staff who aimed to contact each resident of HACNO housing for better digital adoption service.
In addition to the geographic and technical challenges in infrastructure, the distinctive governance system of tribal nations also affected how the funding and policy are structured. Tribal Council and its city governments are responsible for all the tribal members, which means public sectors like HACNO may sometimes find it hard to serve the tribal members living outside the Choctaw 10.5 counties and non-tribal residents living in the territory. For ConnectHome projects, only the Choctaw 202 Supportive Elder Housing is not limited to tribal members, as these are open-market properties. “We have people that live outside of the 10.5 counties of the tribal reservation,” said the current Program Manager Raper, “I wish there was a way we could provide them with Internet services.”
Master of Regional Planning 2023 | Cornell University
Minor in Real Estate Program
Infrastructure Policy Management and Finance (IPMF) Certificate
Email: ds2333@cornell.edu
LinkdIn: www.linkedin.com/in/duxixi-ada-shen/