Empowering all students to thrive in a diverse and ever changing world


ACPS ensures success by inspiring students and addressing barriers to learning

ALEXANDRIA, VIRGINIA
https://www.acps.k12.va.us/


ACPS SCHOOL BOARD
Meagan L. Alderton, Chair
Jacinta Greene, Vice Chair
Willie F. Bailey Sr.
Ashley Simpson Baird
Kelly Carmichael Booz
Abdel Rahman Elnoubi
W. Christopher Harris


Tammy Ignacio
Michelle Rief
Susan Neilson
Clerk of the Board
SUPERINTENDENT’S LEADERSHIP TEAM
Melanie Kay Wyatt, ED.D. ACPS Interim Superintendent
Dr. Wendy Gonzalez
Chief of Teaching, Learning, and Leadership
Dr. Marcia Jackson
Chief of Student Services and Equity
Dominic B. Turner
Chief Financial Officer
Julia A. Burgos
Chief of School and Community Relations
Dr. Elizabeth Hoover
Chief Technology Officer


Dr. Alicia Hart
Chief of Facilities & Operations
Dr. Clinton Page
Chief of Accountability and Research
Vacant


Chief of Human Resources

2024 Proposed Budget Preface I
FY
ALEXANDRIA, VIRGINIA
https://www.acps.k12.va.us/


Acknowledgement

The Financial Services staff extends thanks and appreciation to the School Board, Principals, Executive Staff ,Program Managers and Support Staff who contributed to the production of the Superintendent’s FY 2024 Proposed Budget. This process takes a tremendous amount of time, effort, coordination and teamwork. Your hard work and cooperation allow us to prepare and present an effective, comprehensive budget.
Financial Services Department
Dominic B. Turner Chief Financial Officer
Robert Easley Director, Budget and Financial Systems
Ramona Crawford Administrative Assistant II Budget Office Staff
Vacant Assistant Director, Budget and Fiscal Compliance
Denise Moye Business Data Analyst
Shelly S. Tsuda
Budget Management Analyst
Lauren Walker Capital Program Analyst
Financial Systems and Reporting Staff


Daniel Fugar Business Systems Analyst
Hunter Kimble Consultant
The Alexandria City School Board is committed to nondiscrimination with regard to age, race, national origin, ancestry, disability, religion, gender, gender identity, gender expression, sex, sexual orientation, genetic information, pregnancy, marital status, status as a parent, or political affiliation. This attitude will prevail in all of its policies concerning staff, students, educational programs and services, and individuals with whom the Board does business.
Please direct all inquiries regarding ACPS non-discrimination policies to the Chief of Human Resources, 703 619-8010, 1340 Braddock Place, Alexandria, VA 22314.
Preface II
FY 2024 Proposed Budget
Alexandria City Public Schools is awarded The Association of School Business Officials International Meritorious Budget Award (MBA) for excellence in the preparation and issuance of the budget for the fiscal year 2022 2023. ACPS has participated in the MBA program for 13 years. This award is a reflection of ACPS’s steadfast commitment to fiscal integrity.


Preface III FY 2024 Proposed Budget
ACPS BUDGET AWARD : ASSOCIATION OF SCHOOL BUSINESS OFFICIALS INTERNATIONAL
ACPS BUDGET AWARD : GOVERNMENT FINANCE OFFICERS ASSOCIATION


Alexandria City Public Schools is awarded The Government Finance Officers Association (GFOA) award for BEST PRACTICES IN SCHOOL BUDGETING for the fiscal year ending June 30, 2022. This award is a reflection of ACPS’s ability to meet or exceed GFOA criteria that focus on alignment of resources toward student achievement focusing on collaboration, communication, and rigorous development, evaluation and prioritization of strategies to achieve our goals and objectives.
Preface IV FY 2024 Proposed Budget
January 05, 2023

To Students, Staff, Families, Members of the School Board and the Alexandria Community:
Alexandria City Public Schools’ (ACPS) leadership and staff continue to focus on one primary priority – ensuring that every student in ACPS succeeds. We are continuing with our strategic plan, ACPS 2025: Equity for All, as our navigational tool to make that priority a reality and to guide our budget decisions. Our mission is to ensure success by inspiring our students and addressing barriers to their learning. As we continue to reimagine and recover from the global COVID-19 pandemic, it is even more important to ensure the strategic use of our resources to empower all students to thrive in a diverse and ever-changing world. Our division remains one of great diversity, providing a rich cultural experience for our students, families, and staff as well as some challenges. Each success is to be celebrated as we recognize that the investments we have made to provide resources to our staff are making a difference.
I am pleased to present the Superintendent’s Proposed Budget for FY 2024. The past several years have shown us that we live in a fast paced and ever-changing world. Our students and staff have experienced numerous changes that have impacted their daily lives, and the education industry has been forever changed. We have been able to make many lasting changes to improve our school division for the better, while also recognizing there is still work to be done to ensure our students are receiving the social and emotional supports needed for positive development and academic rigor to grow their minds. The Superintendent’s FY 2024 Proposed Budget strives to help our ACPS community “Reset, Restart, and Refocus” on ensuring all students succeed. The Proposed Operating Budget of $329.4 million with a $13.3 million or a 4.2% increase over the current year, and will support ACPS’ mantra for FY24 to “Reset, Restart, and Refocus”.
Budget Priorities and Guiding Principles

In September 2022, the School Board set forth its budget priorities for FY 2024. These priorities provided guidance and broad areas of focus for the superintendent and staff while developing the detailed budget for next year. The strategic plan goals aligned with the FY2024 budget priorities are:
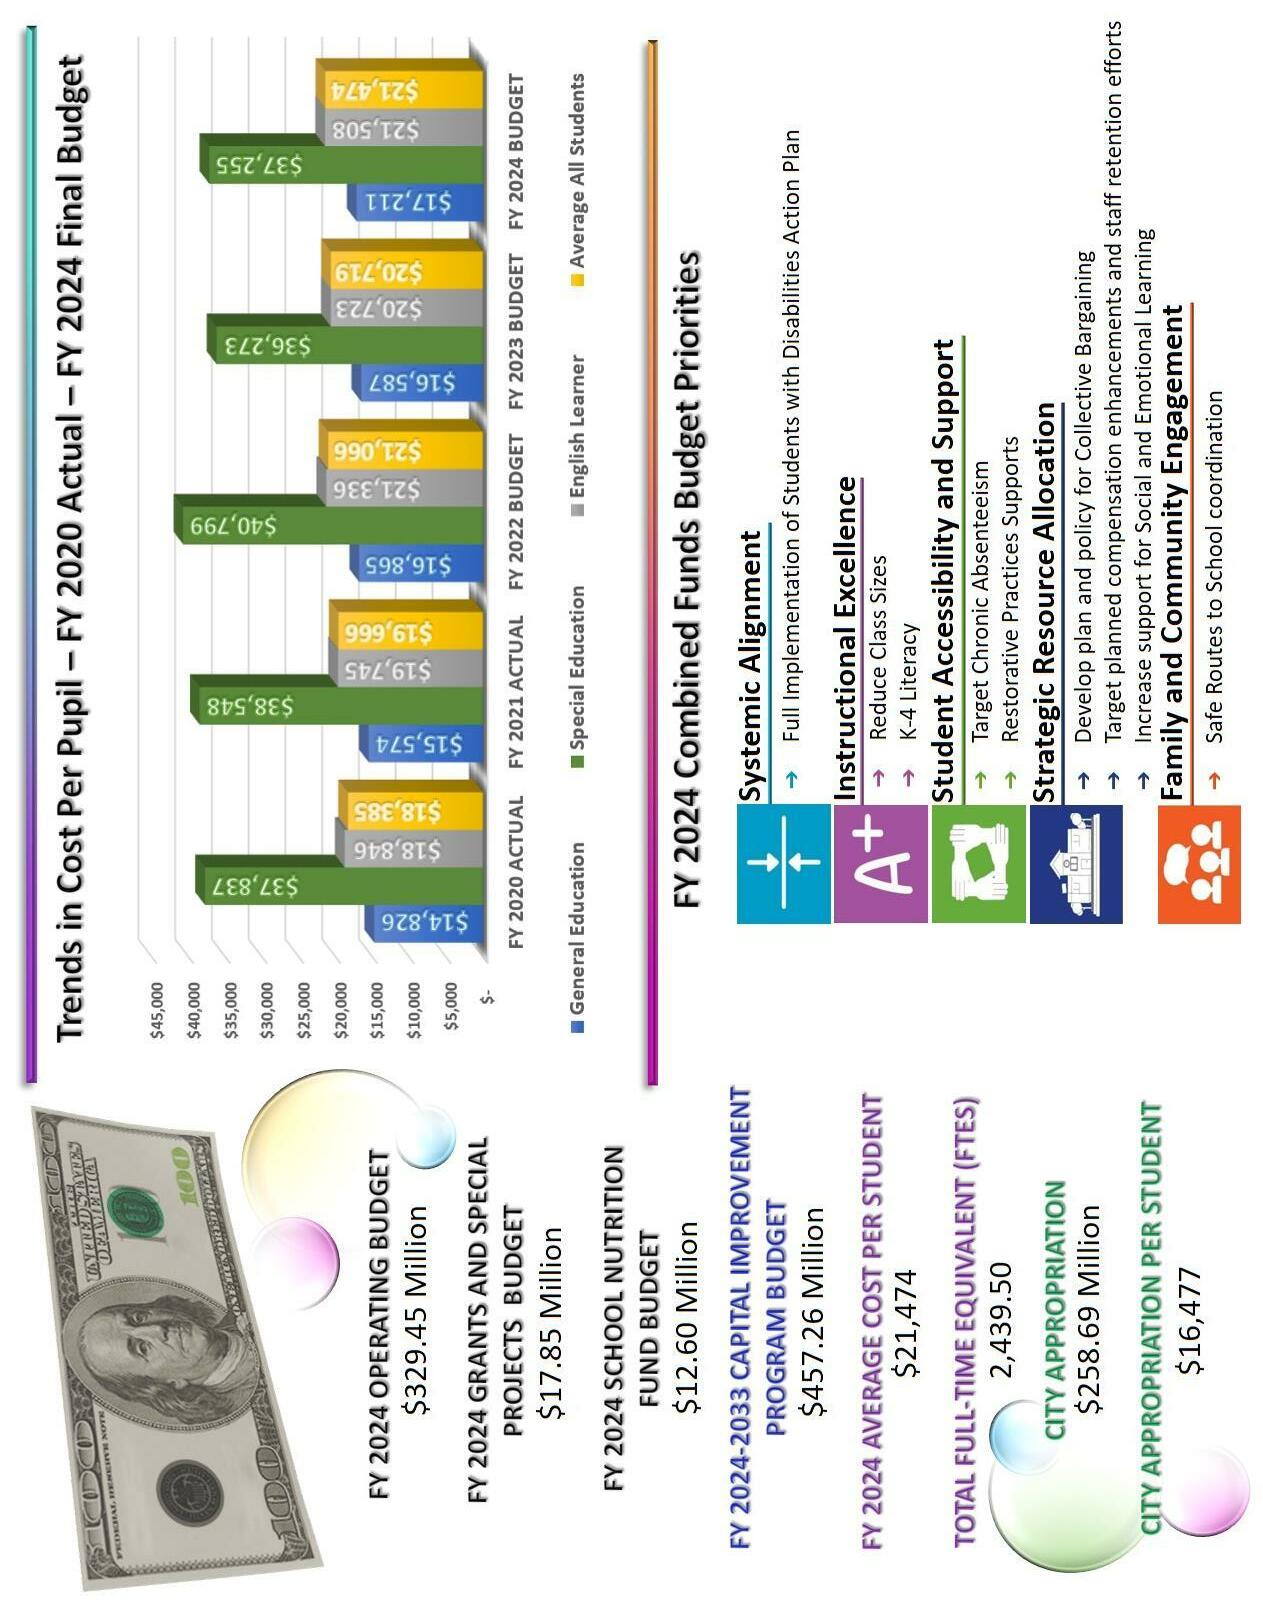
Systemic Alignment


● Full Implementation of Students with Disabilities Action Plan
Instructional Excellence
● Reduce Class Sizes
● K-4 Literacy
Student Accessibility and Support
● Target Chronic Absenteeism
● Restorative Practices Supports Strategic Resource Allocation
● Develop plan and policy for Collective Bargaining
● Target planned compensation enhancements and staff retention efforts
● Increase support for Social and Emotional Learning
Family and Community Engagement
● Safe Routes to School coordination
Preface V
Melanie Kay-Wyatt, ED.D. ACPS Interim Superintendent
The budget we have developed addresses those priorities, accomplishing several key goals. The Superintendent’s FY 2024 Proposed Budget is one that:
● Helps our students and staff continue to recover from the global COVID-19 pandemic
● Retain and develop our quality staff to provide consistency for our students
● Positions ACPS to recruit and retain highly qualified staff, and to offer competitive salaries and benefits
● Prepares ACPS for future collective bargaining
● Provides additional program resources to strengthen our K-4 literacy programming
● Supports to implement recommendations from school division audits and studies, specifically the full implementation of the Students with Disabilities Action Plan
● Supports our students struggling with substance abuse
● Supports the Social, Emotional, and Academic Learning for all of our students
● Provides for increased safety and security measures to ensure our students have a safe learning environment
● Invests in our facilities and infrastructure to maintain and improve our learning environments
Budgets always present us with difficult decisions. The decisions reached collaboratively with our shared interest groups reflect our efforts to drive resources to where they will most impact our students’ ability to succeed.
In addition to the operating budget, ACPS serves each student through funding from grants and special projects, and the school nutrition program. When combined, the FY 2024 budget totals $359.9 million.
Highlights of the Superintendent’s FY 2024 Proposed Operating Budget
There are key areas within the FY 2024 Proposed Operating Budget that require additional funds or the realignment of resources within the budget. These include a significant increase in compensation for our employees to retain and recruit highly qualified faculty and staff, funding to maintain and improve our growing facilities footprint, and other targeted growth areas to support social, emotional and academic learning. Here is a high-level look at the primary drivers for next year’s budget:
Compensation and Benefits: $285.8
million

To be able to move toward our goals of the ACPS 2025 strategic plan and achieve the School Board’s FY 2024 Budget Priorities, we must attract and retain the best and talented staff to our school division. Our staff is what makes our school division operate, prosper and continue to succeed. They represent roughly 88% of our Operating Budget, easily our largest commitment to supporting our students’ success. To ensure we can continue to recruit and retain high quality staff, we must offer compensation that is highly competitive with our surrounding school divisions. ACPS plans to award eligible staff a full-step increase at the beginning of the contract year. In addition, eligible staff will receive a 2.5% market rate adjustment to help keep up with the competitive market in the Northern Virginia area. After reviewing our preliminary compensation report, we are also adjusting all pay scales to raise the entry level and increase the maximum pay.
In addition to competitive salaries, ACPS must offer fringe benefits that will
Preface VI
Melanie Kay-Wyatt, ED.D. ACPS Interim Superintendent
encourage staff to remain with us as well as help us recruit our next generation of educators. The cost to continue to provide our employees exceptional health and dental benefits is projected to increase by $0.8 million or 1.0 % more than FY 2023 Final.
Other Areas of Focus: $43.6 million
The Superintendent’s FY 2024 Proposed Budget includes additional resources to further support maintaining and improving our learning environments, and improving division operations such as:
✓ Increased funding for heating, ventilation, and air conditioning (HVAC) maintenance
✓ Increased funding for custodial services
✓ Increased funding for K-4 literacy programs

✓ Expansion of our Virginia Preschool Initiative (VPI) classrooms
✓ Additional Student Support Team positions (school counselors, psychologists, substance abuse counselor)
✓ Additional school security officers
✓ Security equipment
✓ Insurance premiums
✓ Other

We invite families, students, employees and community members to get involved in the budget process and offer suggestions and ideas. You may send your budget comments and questions directly to the superintendent and staff at ask@acps.k12.va.us
We are committed to making Alexandria City Public Schools the very best we can be. We are confident that the FY 2024 budget provides the resources in our school division that will ensure our students succeed.
Thank you for your continued support of our school division!
Sincerely,
Preface VII
Melanie Kay-Wyatt, ED.D. ACPS Interim Superintendent
The ACPS budget document is a source of useful information. It contains fund statements and supporting details that provide the reader with an understanding of the school division’s financial position and spending plan for the coming year. The document is also filled with information regarding division-wide priorities, planning activities, educational programs, and initiatives. The document provides a look at our recent history (where we have been), the present (what we are doing now), and the future (what we are planning and what the outlook is for several years down the road).
When reading the document, it is important to remember that the development of the budget is a year-long endeavor, with the final approved budget evolving through a series of iterations. Budget planning and development takes place from July through December. The budget approval process starts in January and features three major milestones:
Proposed Budget
The Superintendent’s Proposed Budget is presented to the School Board and released to the public in January of each year. This budget is the result of detailed work by the Superintendent and the ACPS leadership team, and it reflects what the Superintendent believes are the resources the division needs to meet the School Board’s budget priorities for the coming year. The budget contains projections for enrollment, revenue and expenditures by fund, and highlights the major changes planned.
Approved Budget
After receiving the proposed budget, the School Board reviews it, receives answers to any questions members may have, and holds a public hearing to provide community members an opportunity to express their thoughts. The School Board may then suggest changes to the proposed budget. The Superintendent takes those suggestions under advisement, creating a series of recommendations that are incorporated into a revised budget. The School Board may make additional changes to the proposed budget, ultimately agreeing on the Approved Budget, which reflects what they believe are the resources required by the division.
Final Budget
In early May when Alexandria City Council adopts its budget for the coming year, ACPS comes to a clear understanding of the total funding the City is planning to allocate to support the school division. In a process similar to the development of the approved budget, the Superintendent presents recommendations for revising the budget to be consistent with the City’s budgeted funding support. The School Board may again make changes to the budget, which when passed, becomes the Final Budget.
Budget Document

The budget document is organized into four major sections: Executive Summary, Organization, Financials, and Information. The Information section has four subsections: division information, schools, departments, and appendix, which includes the glossary. Each section is further described below:
Executive Summary
The Executive Summary of the ACPS budget document is a comprehensive summary and presents a complete picture of the budget story. It includes major highlights from
Preface VIII
each of the other sections of the budget document and can be used as a stand-alone document.
Organization
The Organization section includes information related to organizational structure, as well as long-term, division-wide, strategic goals that provide the context for decisions within the annual budget. It also includes an overview of the budget process and calendar, as well as a summary of the division’s financial policies and practices.
Financials
The Financials section includes summaries of all School Board funds, including the governmental, internal service, and fiduciary funds. This section presents information in a pyramid format: starting with fund statements, then detailing revenues and expenditures. An overview of major changes in expenditures and detailed financial reports comparing the current budget to the previous fiscal year is also included. The pyramid format allows the reader to view the information from the highest level of the combined funds statement to the more detailed information contained in individual fund statements.
For purposes of budget presentation, ACPS classifies its revenues and expenditures according to the following structure: fund, character, and major object. Funds represent the highest level of the classification structure. Character classifies
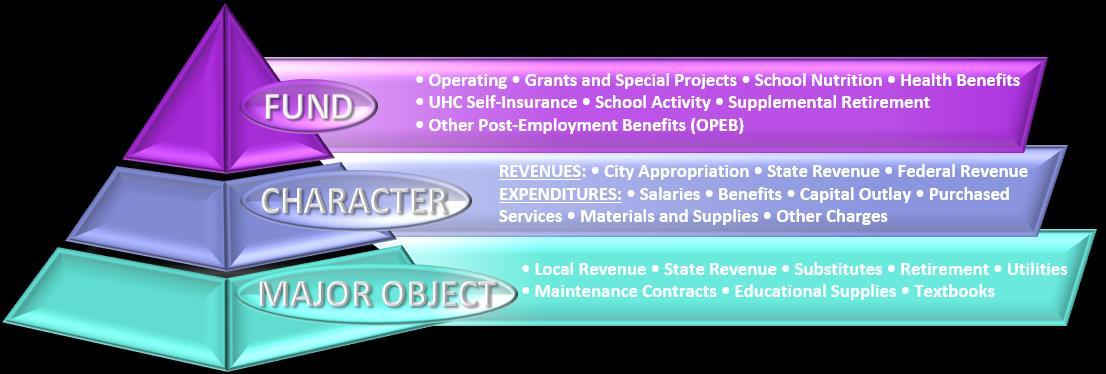
Major object provides a finer level of detail. The chart below shows how this structure forms a pyramid, moving from the most detailed (object) at the bottom, to the most summarized (fund) at the top, and provides examples of the major types of elements in each layer.
Information
The Information section of the document provides the details of ACPS’ enrollment, demographics, and staffing. This section compares the unique make-up of our student population and also describes the various staffing formulae that are used to allocate staffing for elementary homeroom and encore, division-wide specialized instruction, English learners (EL), elementary talented and gifted (TAG), and assistant principal staffing. In addition to these data, readers can find information regarding Alexandria community demographics, school allocations, and cost per pupil details. The information section of the budget document is organized into three major sections: Schools, Departments, and Appendix.
Schools
The Schools sub-section contains summary-level information for all ACPS’ schools,
Preface IX
Alternative Education Programs, and School-wide Resources. Included are schools’ education plans, demographics, performance tables, staffing, and budget reports.
Departments
Similar to the Schools sub-section described above, this sub-section contains information for each department within ACPS. These pages include the organizational structure, responsibilities, work plans, staffing, and budget reports.
Appendix
The Appendix includes a glossary of terms and positions used in the budget document and additional resources.
What the Alexandria Community Needs to Know about the ACPS Budget
Citizens are encouraged to learn about the ACPS budget. It is helpful to take a broad view first and understand concepts that are key factors in the development of the budget.
➢ ACPS is required by law to operate within a balanced budget. Due to this requirement, the Operating Fund budget is purposefully conservative in its projections of revenues and expenditures, which helps the school division end the year with an available balance, typical of other school divisions as well as local and state governments. Under current practice, ACPS retains this balance to pay for the carryover of encumbered obligations (orders of goods and services which have not been received as of the end of the fiscal year) and to support the following year’s budget (currently limited to no more than two percent of proposed operating expenditures). The remainder is held as a cushion against extraordinary circumstances that might cause significant, one-time increases in expenditures or decreases in revenue.
➢ The Final Budget is informed by ACPS 2025: Equity for All (developed in Spring 2020), the division’s strategic plan. The plan was developed with significant input from stakeholders, including students, parents, teachers and other staff , and members of the Alexandria community. The plan approved by the School Board reflects the educational landscape, the specific needs of the school division, and the aspirations of the Alexandria community. ACPS 2025 Strategic Plan is the roadmap guiding the division’s decision making for the next several years.
➢ The City of Alexandria is the primary source of the school division’s operating fund revenue. The Commonwealth of Virginia views Alexandria as a wealthy community in comparison to other jurisdictions in the state. When the State determines the amount of funding it will provide to ACPS, it takes into consideration this wealth factor (called the Local Composite Index) and adjusts allocations down, based on the calculation of financial resources available in the City. As a result, the State provides ACPS with less direct aid support on a per pupil basis than other Virginia school divisions.
➢ School operations are labor-intensive and because of this, salaries and benefits comprise the majority of the budgeted operating expenditures. Most of these expenditures are for resources provided directly in the schools; for teachers and paraprofessionals; for counselors, nurses, and other licensed professionals; for principals and their administrative teams; and for support staff including custodians, security officers, and cafeteria aides.
Preface X
➢ Major drivers of the labor expenditures include enrollment changes, market competition, healthcare costs, and State mandates (both funded and unfunded).
➢ Changes in enrollment, in total and in subgroups of students with additional needs, drives the number of staff and the number of classrooms required. Many school-based positions are driven by formula prescribed by Standards of Quality (SOQs) established by the Virginia General Assembly.
➢ Competition for staff is intensive in the Northern Virginia area, requiring the school offer competitive salary and benefit packages.
➢ Health care costs have risen dramatically over the last several years. In response, changes to plan design were implemented in FY 2020 to minimize projected increases and those changes are maintained.
➢ Certain benefit expenditures are mandated by the Commonwealth of Virginia, notably retirement rates for licensed professionals and administrative staff in the Virginia Retirement System (VRS).
ACPS recognizes that revenue constraints require careful consideration of current expenditures to identify areas where costs may be reduced and operational efficiencies gained. During the course of the annual budget process, all major programs are reviewed to assess what changes can be implemented to off set the expenditure increases noted above. Budgets are often about making hard choices, and sometimes an area which is no longer a strategic priority needs to be reduced or eliminated to make funds available for new priorities.
Where to Get More Information
ACPS is committed to making the budget process as understandable and accessible as possible, and strives to improve the transparency of the process every year. The key place to find more information is the ACPS website. To access the latest information visit:
https://www.acps.k12.va.us/departments/financial-services/budget
✓ The budget calendar, which details upcoming meetings and milestones leading to the approval of the annual budget.
✓ The final budget for the current year, and proposed budget for next year (when published), as well as an archive of historical budgets dating back to FY 2019.
✓ Questions about the budget, posed by the School Board, the City Council and community members, along with detailed answers from staff.
✓ A summary of revisions proposed by School Board members and the Superintendent’s recommended adjustments.
Preface XI
How to Provide Feedback

Feedback from the community is an important part of the budget process and there are several ways to provide comments and voice concerns. Specific opportunities include:
✓ Send comments using the ACPS website:
https://www.acps.k12.va.us/departments/financialservices/budget or email the Budget Office at BUDGET@ACPS.K12.VA.US
✓ Email us at ASK@ACPS.K12.VA.US
✓ Contact your school’s PTA president and send your questions and comments through the Parent Teacher Advisory Council (PTAC)
✓ Sign up to speak at one of the School Board’s public hearings on the budget
✓ Join the School Board’s Budget Advisory Committee:
https://www.acps.k12.va.us/school-board/school-board-committees/budgetadvisory-committee-bac
Preface XII

Title Page & Acknowledgements PREFACE I Certification and Award PREFACE III Superintendent’s Message PREFACE V Understanding the Budget PREFACE VIII Section I: Executive Summary Overview of Alexandria City Public Schools 1 Organizational Information 3 Org Chart, School Sites, School Board Information Enrollment Information and Site Map 7 Budget Process and Timeline 9 Strategic Plan 11 Budget at a Glance 14 Financial Information 16 Other Information 24 Section II: Organization Division Structure 26 Strategic Plan 33 Budget Priorities and Investment Areas 36 Budget and Financial Management 37 Section III: Financials ACPS Fund Statements 51 Revenue 66 Expenditures 76 CIP 84 Fiscal Forecast 89 Financial Reports 94 Personnel Reports 113 Section IV: Information Overview Alexandria Community and Property Tax Demographics 119 Enrollment & Staffing 128 School Allocations and Stipends 146 Cost per Pupil 154 Schools Schools Summary 158 Elementary Schools Summary 160 Charles Barrett 167 Cora Kelly 173 Douglas MacArthur 180 Preface XIII FY 2024 Proposed Budget
FY 2024 Proposed Budget

Early Childhood Center 188 Ferdinand T. Day 192 George Mason 199 James K. Polk 204 Jefferson-Houston 212 John Adams 219 Lyles-Crouch 227 Mount Vernon 233 Naomi L. Brooks 240 Patrick Henry 246 Samuel W. Tucker 253 William Ramsay 260 Middle Schools Summary 268 Francis C. Hammond 273 George Washington 281 High School Summary 289 Alexandria City H.S. 294 Alternative Education Summary 307 Northern Virginia Juvenile Detention Center School 310 Chance for Change Academy 312 School-wide Resources 315 Departments Department Summary 318 Instructional Support Departments School Board Services 320 Office of the Superintendent 322 School and Community Relations 325 School, Business and Community Partnerships Communications Accountability and Research 334 Teaching, Learning and Leadership 339 Adult Education AVID/College Readiness Career and Technical Education Curriculum Design & Instructional Services Early Childhood (Pre-Kindergarten Programs) Elementary School Instructions English Learner Services Humanities Literacy Office of Chief of Teaching, Learning, and Leadership School Improvement School Leadership Preface XIIII
Section IV: Appendix

Instructions School Improvement School Leadership Secondary School Instructions Specialized Instruction STEM Talented and Gifted Program Talent Development Title I Programs Student Support Departments Technology Services 360 Student Services and Equity 366 Equity Student Support Support Services Departments Human Resources 372 Facilities and Operations 377 Capital Programs, Planning, & Design Educational Facilities Maintenance and Custodial Services Pupil Transportation and Fleet Management Safety and Security Services School Nutrition Services Financial Services 387
Secondary School
Glossary 395 Additional Resources 403 Preface XV
FY 2024 Proposed Budget

Blank Page
Section I: Executive Summary
✓ Overview of Alexandria City Public Schools

✓ Organizational Information 5


✓ Enrollment Information
✓ Budget Process and Timeline
✓ Strategic Plan
✓ Budget at a Glance
✓ Financial Information
✓ Other Information


Section I:
Students and Schools
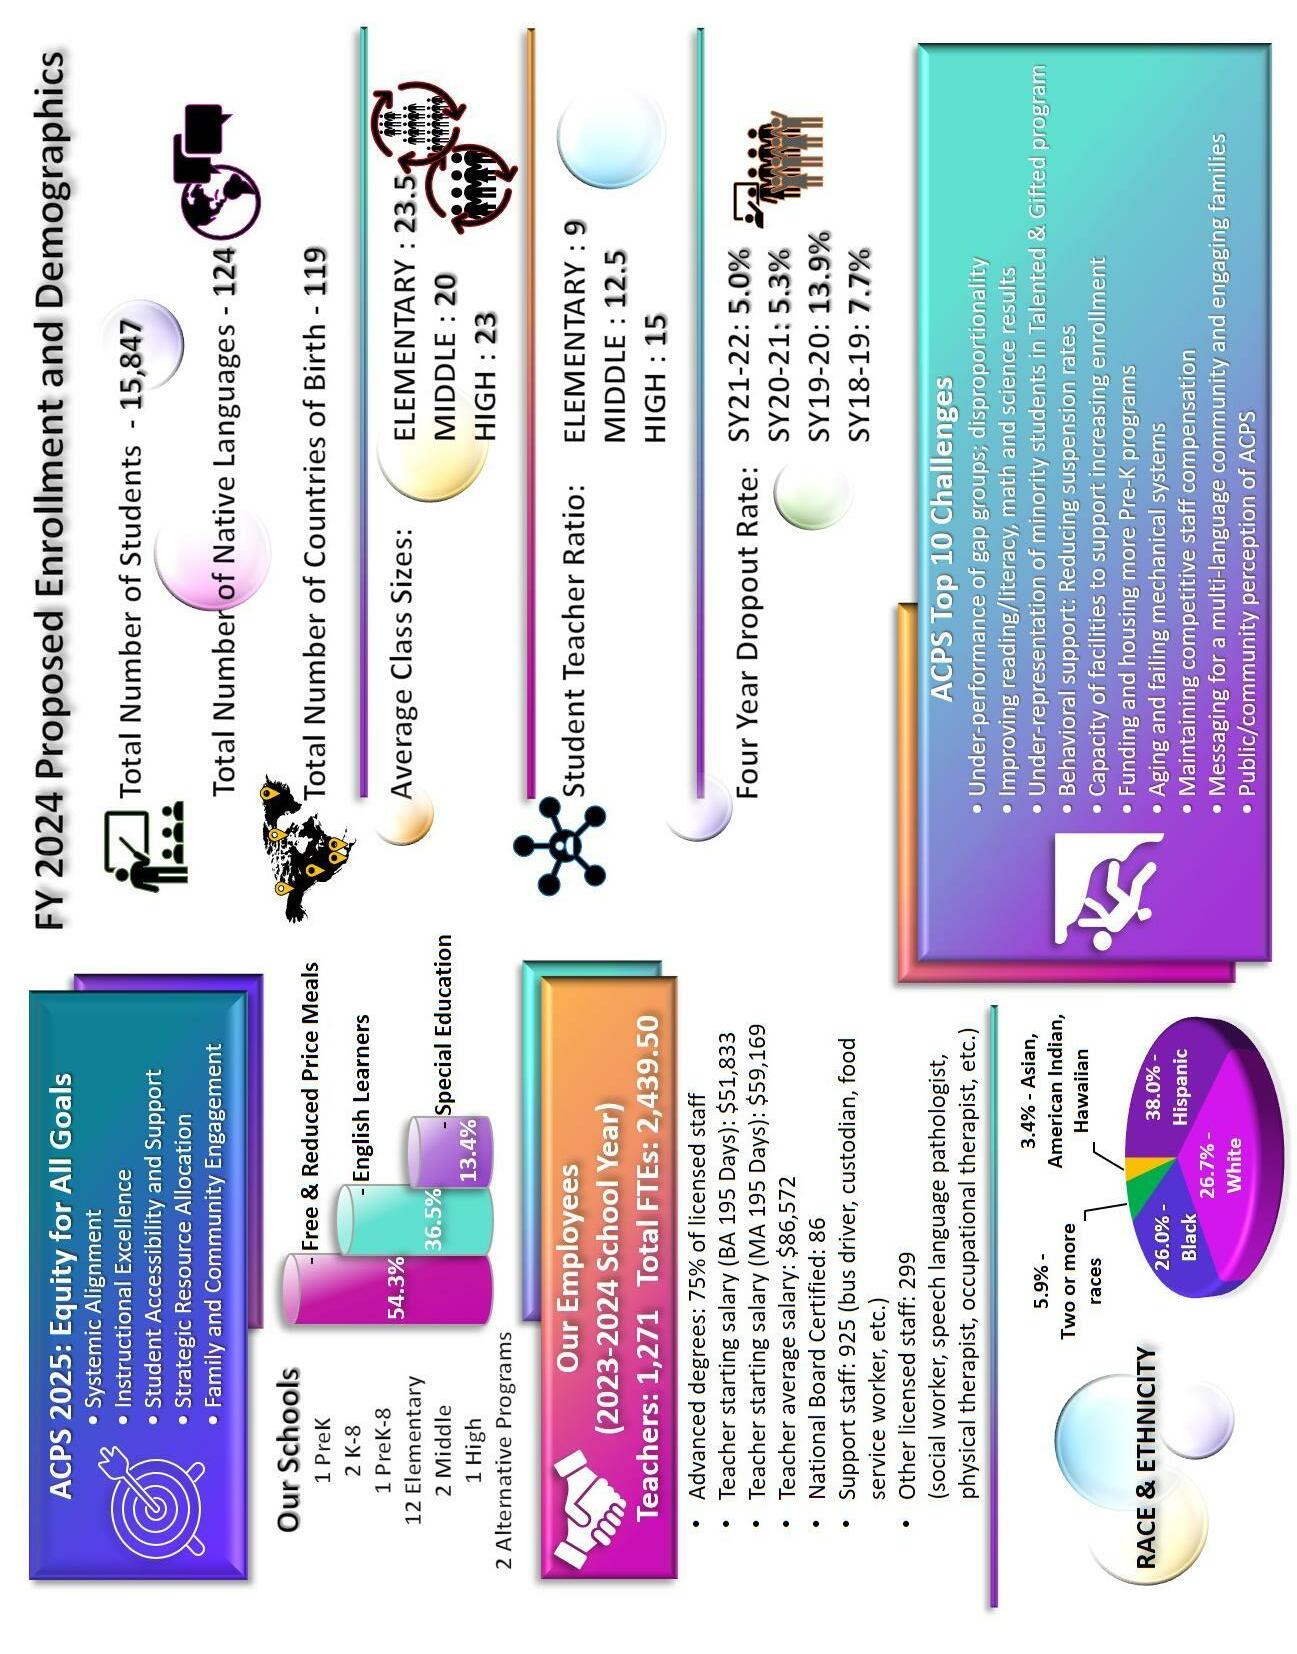
The City of Alexandria and Alexandria City Public Schools (ACPS) are dedicated to ensuring academic success for each and every student. ACPS celebrates its diversity with students who come from more than 120 different countries, speak 119 native languages and represent a multitude of ethnic, cultural, and economic groups. The School Board’s Academic Excellence and Educational Equity Policy (Policy IGBJ) pledges to educate students in an atmosphere of excellence and educational equity that prepares them for citizenship and ensures they are challenged to stretch their talents and aspirations.
In July 2020, the Identity Project was launched to work towards making Alexandria City Public Schools a more equitable future. In FY 2022, Matthew Maury Elementary School and T.C. Williams High School were reidentified as Naomi L. Brooks Elementary School and Alexandria City High School, respectively.


The school division is comprised of one Early Childhood Center, 12 elementary schools, one Pre-K through eight school, one K through eight school, two middle schools (grades six through eight), and one high school. Alexandria City High School consists of a ninth-grade campus and a separate main campus for grades 10-12. ACPS provides educational opportunities through a flexible online learning Satellite Program and the Chance for Change Academy (an interim education facility). ACPS also operates the Northern Virginia Juvenile Detention Center School and the Sheltercare facility.
ACPS will serve a projected 15,847 students in FY 2024. Based on VDOE’s fall 2020 membership data, ACPS ranked 16th of 132 school divisions in the Commonwealth of Virginia in terms of size. The three largest Virginia school divisions - Fairfax, Prince William, and Loudoun County Public Schools - are also located in Northern Virginia.
Governance
The Alexandria City School Board is a nine-member elected body whose primary responsibilities are to adjust and oversee capital and operating budgets annually, to formulate and adopt policy, to select a Superintendent to implement policy, and to evaluate the results (Policy BBA). The City of Alexandria is divided into three voting districts (districts A, B, and C) and three Board members are elected from each district. Each member is elected concurrently for a three-year term of office. The election took place in November 2021 and the newly elected Board took office in January 2022.
School Board meetings are typically held twice a month, Thursday evenings, in the School Board Meeting Room located at 1340 Braddock Place. Board meetings are televised live in Alexandria on Channel 71, streamed live and archived on the ACPS website. Meeting agendas are maintained online at https://alexandriapublic.icboard.com/ by the School Board Office. For more information, please contact the Clerk of the Board at 703619-8019.
Any citizen may address the Board at any regular meeting during the designated period called “Communications and Addresses to the Board.” Persons wishing to appear before the School Board are asked to contact the Clerk of the Board or sign up online at www.acps.k12.va.us/school-board for inclusion on the agenda. A reasonable period of time, as determined by the School Board, will be allocated at each regular meeting for citizens to present matters of concern.
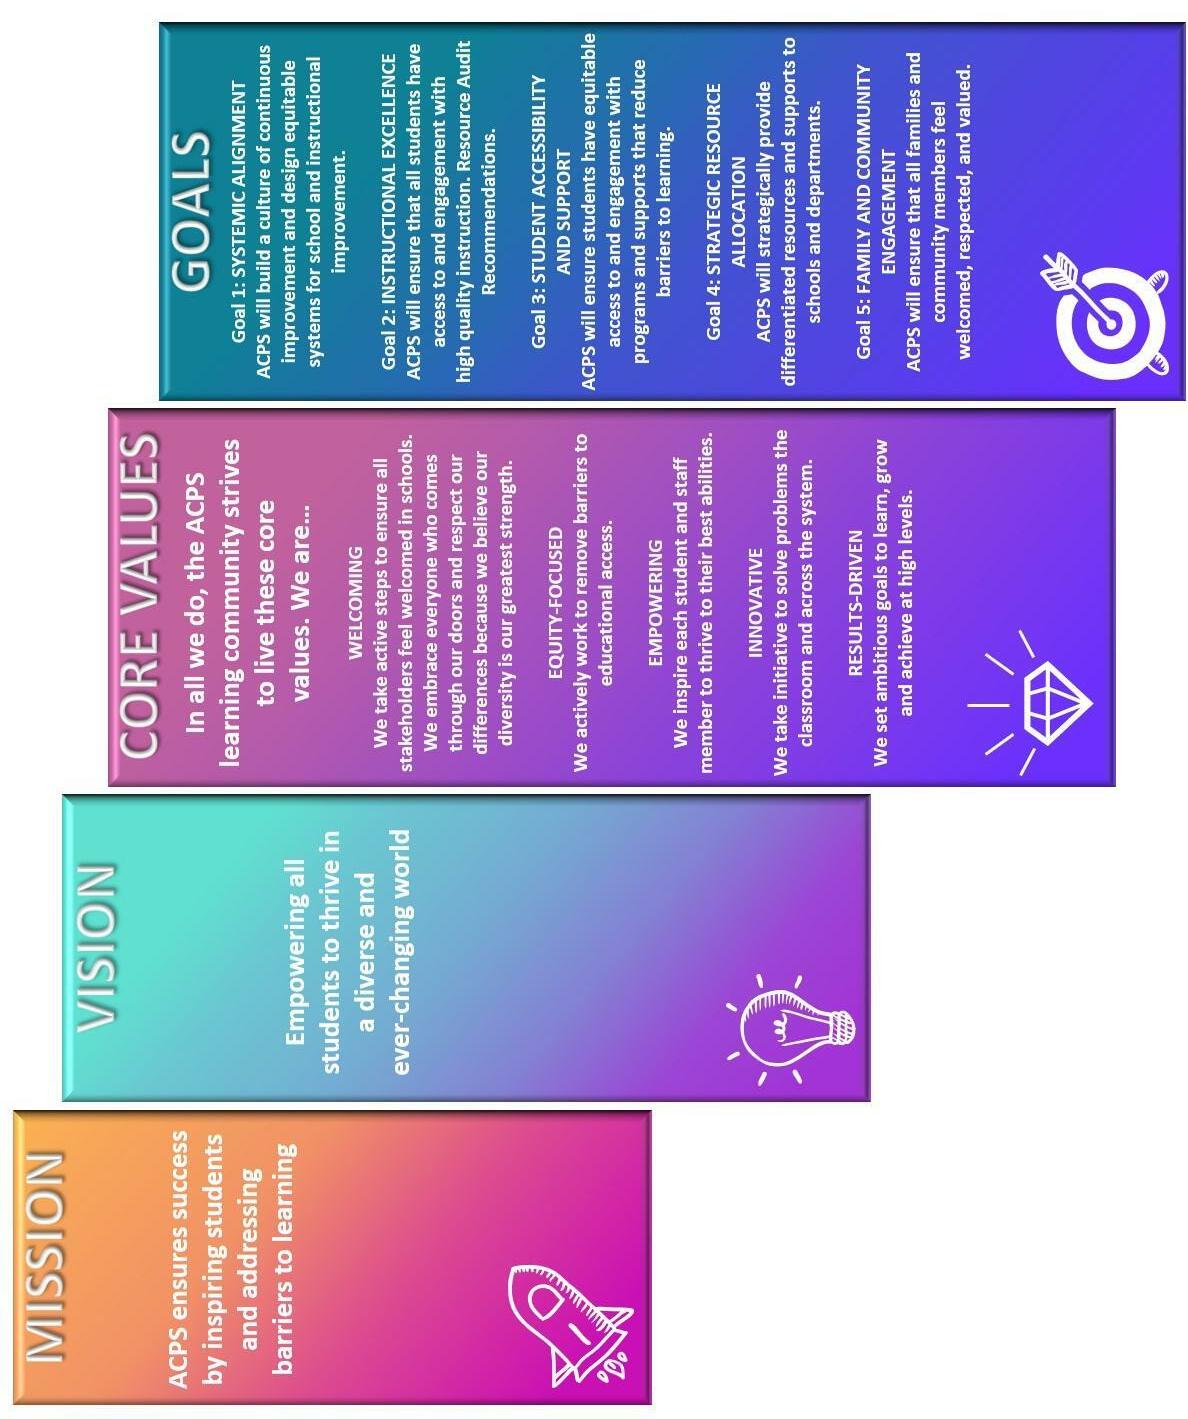
The interim Superintendent, Dr. Melanie Kay-Wyatt, is the chief executive officer for the school division. The Superintendent’s mission is to ensure that all activities within the school system support the five goals of the ACPS 2025 Strategic Plan: Equity for All:
✓ Systemic Alignment: ACPS will build a culture of continuous improvement and design equitable systems for school and instructional improvement;
✓ Instructional Excellence: ACPS will ensure that all students have access to and engagement with high-quality instruction;
✓ Student Accessibility and Support: ACPS will ensure students have equitable access to and engagement with programs and supports that reduce barriers to learning;
FY 2024 Proposed Budget
1
✓ Strategic Resource Allocation: ACPS will strategically provide differentiated resources and supports to schools and departments; ✓ Family and Community Engagement: ACPS will ensure that all families and community members feel welcomed, respected, and valued.
The Superintendent works closely with executive staff to manage all aspects of school division operations. All chief officers report directly to the Superintendent.
The work of central office concentrates on planning, continuous improvement, leadership development, and culture as shared responsibilities of all ACPS administrators. The organizational structure is intended to ensure that the key focus remains on quality instruction, curriculum, and comprehensive student support. Focus also remains on aging infrastructure and ensuring students and staff are housed in safe and secure buildings.
ACPS, like many other school divisions, is retooling significant operations to ensure increased efficiency and effectiveness as budget discussions become increasingly difficult. Each year, all programs are evaluated to look for efficiencies and new programs are placed on hold or phased in over multiple budget years.
The following pages show division organizational structure and school leadership contacts.
2 FY 2024 Proposed Budget
Organizational Information 3 FY 2024 Proposed Budget
Charles Barrett Elementary School
1115 Martha Custis Drive
Alexandria, VA 22302
Principal - Loren Brody
BUILT – 1949
SQFT – 70,844
GRADES – Pre-K-Gr 5
Current Enrollment - 527
Projected Enrollment - 526
Cora Kelly School for Math, Science & Technology

3600 Commonwealth Ave.
Alexandria, VA 22305
Principal - Jasibi Crews
BUILT – 1955
SQFT – 69,000
GRADES – Pre-K-Gr 5
Current Enrollment 265
Douglas MacArthur Elementary School
4633 Taney Ave.
Alexandria, VA 22304
Principal - Penny Hairston
BUILT – 1942
SQFT – 63,120
GRADES – K-Gr 5
Current Enrollment - 552
Projected Enrollment - 603
Early Childhood Center
5651 Rayburn Ave.
Alexandria, VA 22311
Principal - Heidi A. Haggerty Wagner
BUILT – 2018
SQFT – 28,500
GRADES – Pre-K
Current Enrollment - 174
Ferdinand T. Day Elementary School
1701 N. Beauregard St.
Alexandria, VA 22311
Principal - Rachael R. B. Dischner
BUILT – 1999
SQFT – 90,832
GRADES – K-Gr 5
Current Enrollment - 583
Projected Enrollment - 588
George Mason Elementary School
2601 Cameron Mills Rd
Alexandria, VA 22302
Principal - Dr. Seazante Williams Oliver
BUILT – 1939
SQFT – 63,535
GRADES – K-Gr 5
Current Enrollment - 306
Projected Enrollment - 304
James K. Polk Elementary School
5000 Polk Ave.
Alexandria, VA 22304
Principal – Carla Carter
BUILT – 1965
SQFT – 86,623
GRADES – Pre-K-Gr 5
Current Enrollment - 779
Projected Enrollment - 787
Jefferson-Houston School
1501 Cameron St.
Alexandria, VA 22314
Principal - Dr. John McCain
BUILT – 2014
SQFT – 124,000
GRADES – Pre-K-Gr 8
Current Enrollment - 623
Projected Enrollment - 631
John Adams Elementary School
5651 Rayburn Ave.
Alexandria, VA 22311
Principal - Dr. Alicia Kingcade
BUILT – 2018
SQFT – 114,790
GRADES – Pre-K-Gr 5
Current Enrollment - 717
Projected Enrollment - 716
Lyles-Crouch
Traditional Academy
530 S. St. Asaph St.
Alexandria, VA 22314
Principal - Dr. Patricia Zissios
BUILT – 1958
SQFT – 65,645
GRADES – K-Gr 5
Current Enrollment - 409
Projected Enrollment - 418
Mount Vernon Community School
2601 Commonwealth Ave.
Alexandria, VA 22305
Principal - Liza Burrell-Aldana
BUILT – 1923
SQFT – 112,730
GRADES – K-Gr 5
Current Enrollment - 855
Projected Enrollment - 861
Naomi L. Brooks Elementary School
600 Russell Rd
Alexandria, VA 22301
Principal - Suzanne Hess
BUILT – 1929
SQFT – 51,800


GRADES – K-Gr 5
Current Enrollment - 329
Projected Enrollment - 327
Patrick Henry School
4643 Taney Ave.
Alexandria, VA 22304
Principal – Dr. Ingrid F. Bynum
BUILT – 1953
SQFT – 136,720
GRADES – K-Gr 8
Current Enrollment - 952
Projected Enrollment - 964
Samuel W. Tucker Elementary School
435 Ferdinand Day Dr. Alexandria, VA 22304
Principal – Adaarema Kelly BUILT – 2000
SQFT – 80,180
GRADES – K-Gr 5
Current Enrollment - 731
Projected Enrollment - 705
William Ramsay Elementary School
5700 Sanger Ave.
Alexandria, VA 22311
Principal - Michael J. Routhouska
BUILT – 1958
SQFT – 87,650
GRADES – Pre-K-Gr 5
Current Enrollment - 591
Projected Enrollment - 615
4 FY 2024 Proposed Budget
Francis C. Hammond Middle School
4646 Seminary Rd
Alexandria, VA 22304
Act. Principal - Anika Buster-Singleton
BUILT – 1956

SQFT – 236,125
GRADES – Gr 6-8
Current Enrollment – 1,466
Projected Enrollment – 1,480
Alexandria City High School, King Street Campus
3330 King St.
Alexandria, VA 22302
Principal - Peter Balas, Executive Principal
BUILT – 2007
SQFT – 461,147
GRADES – Gr 10-12
Current Enrollment – 3,520
Projected Enrollment – 3,511
Northern Virginia Juvenile Detention Center School
200 S. Whiting St.
Alexandria, VA 22304
Principal – Dr. Jamila Mannie
GRADES – Gr 6-12
George Washington Middle School
1005 Mount Vernon Ave.
Alexandria, VA 22301
Principal - Dr. Jesse Mazur
BUILT – 1935
SQFT – 237,332


GRADES – Gr 6-8
Current Enrollment – 1,367
Projected Enrollment – 1,427
Alexandria City High School, Chance for Change Academy
216 S. Peyton St.
Alexandria, VA 22314
Principal - Peter Balas, Executive Principal GRADES – Gr 6-12
Alexandria City High School, Minnie Howard Campus
3801 West Braddock Rd
Alexandria, VA 22302
Principal - Peter Balas, Executive Principal BUILT – 1954
SQFT – 130,435
GRADES – Gr 9
Current Enrollment - 986
Projected Enrollment - 1,010
Alexandria City High School, Satellite Program 1340 Braddock Pl.


Alexandria, VA 22314
Principal - Peter Balas, Executive Principal GRADES – Gr 9-12
*Enrollment numbers do not include special placement students.
5 FY 2024 Proposed Budget
Staff:


District A District A District B District C District C District B District A District B
District C
Meagan L. Alderton, Chair
Jacinta Greene, Vice Chair
Willie F. Bailey Sr
Kelly Carmichael Booz
Abdel-Rahman Elnoubi
W. Christopher Harris
Tammy Ignacio
Michelle Rief
Ashley Simpson Baird
6 FY 2024 Proposed Budget
School Board
Susan Neilson, Clerk of the Board Alexandra Bourdouane, Deputy Clerk of the Board
ACPS Enrollment
ACPS’ enrollment data series counts all students, including students under the age of 5 and over the age of 20, as well as all special placements. The division incurs costs for all enrolled students even if they are not included in the state’s definition of average daily membership.
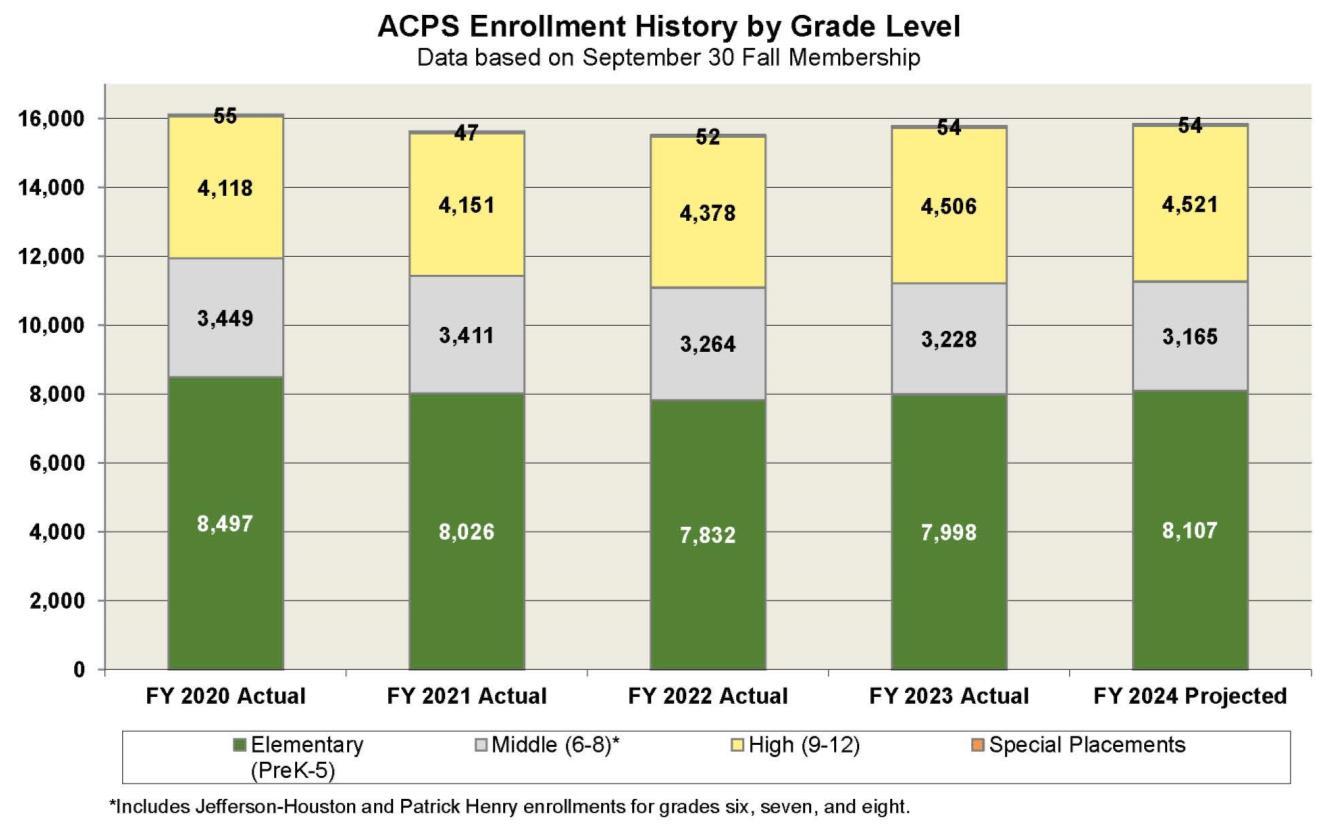
As shown on the chart below, from FY 2020 through FY 2024, the elementary school enrollment has decreased from 8,497 to 8,107 students. Middle school decreased from 3,449 to 3,165 students and high school increased from 4,118 to 4,521 students during this same period. Over the same time period, the number of students attending special placement facilities decreased by one.
Enrollment projections are prepared annually as a collaborative effort by ACPS’ Operations Department and the City’s Planning and Zoning Department. In general, the enrollment projections are based on trends experienced throughout the school division by school and by grade. An average “Cohort Survival Rate” from the previous 3 or 4 years at each school and grade is used to determine the numbers of students who would be retained and/or added in each school and at each grade level.
For FY 2024, elementary school enrollment is projected to be 8,107 with middle school at 3,165, which includes students in grades 6-8 at Jefferson-Houston and Patrick Henry. High school is expected to grow by 15 students to 4,521. Enrollment in all schools is projected to increase for FY 2024 by 61 students, including students being served in special placement facilities.
With the projected changes in enrollment for FY 2024, elementary school enrollment represents 51.3 percent with middle and high schools at 20.0 percent and 28.7 percent, respectively, of total enrollment, not including special placements.
7 FY 2024 Proposed Budget
Organizational Information 8 FY 2024 Proposed Budget
Budget Process
The budget is a resource allocation and policy document. It incorporates the best estimate of the school division’s revenues and expenditures for the next fiscal year based on a snapshot of current fiscal year revenue and expenditures. These estimates are revised to reflect changes in plans, priorities, and trends in enrollment as well as the economic environment.
The Code of Virginia requires that each school Superintendent prepare a budget that estimates the expected funding necessary to support public schools during the upcoming year. It is then the responsibility of the School Board to balance the needs of the school division with respect to the economic and political environment.
The budget provides a framework for measuring and monitoring expenditures. Throughout the year, actual spending is compared with the budget within each organizational and programmatic area. The comparison is used to provide a measure of effectiveness and also help ensure that funds are being used for their intended purpose.
Key Elements of the ACPS Budget Planning Process
• Strategic plan

• Board budget priorities
• School and departmental improvement plans
• Student and school achievement data
• Operating cost trend analyses
• Parent and community input
• Capital Improvement Program budget
• Current fiscal year budget
• Grant or program-specific plans
Budget Overview
The FY 2024 Combined Funds Budget represents an ongoing commitment to ACPS students as aligned with Equity for All 2025 strategic plan. A full review of programs and services was conducted to confirm focus on student achievement and support of initiatives that have been implemented to decrease gaps in achievement across various economic, educational and racial groups.
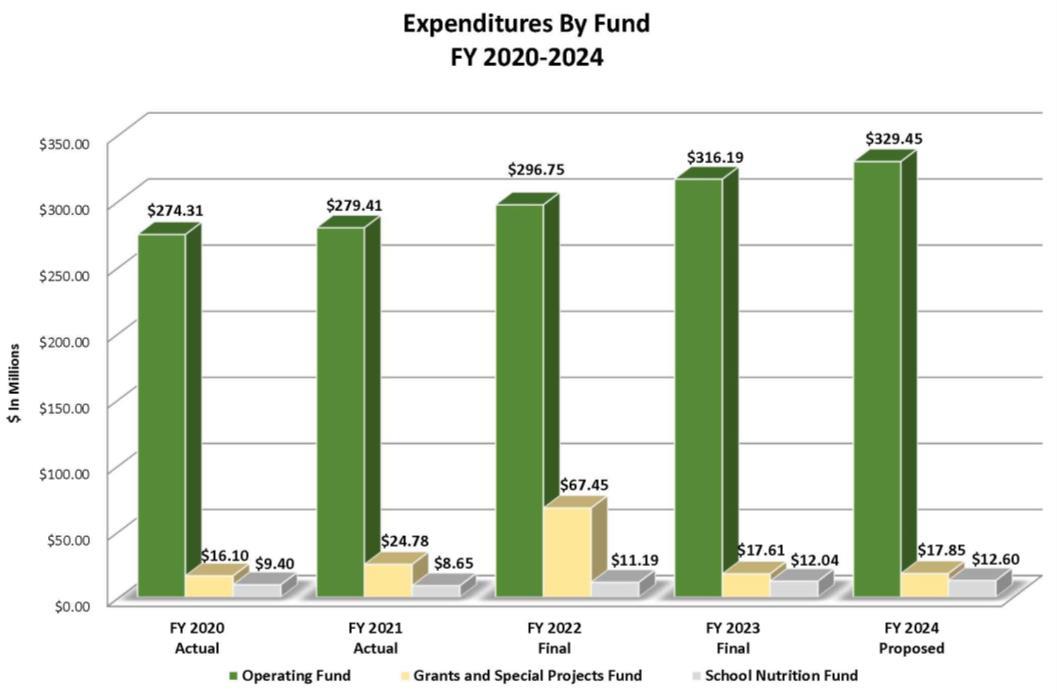
The FY 2024 operating expenditures budget totals $329.45 million, an increase of 4.2 percent compared to the FY 2023 Final Budget. The appropriation to ACPS from the City of Alexandria totals $258.69 million, an increase of 4.0 percent compared to the FY 2023 Final Budget. Total positions show a net increase of 1.00 FTE.
For FY 2024, overall student enrollment is projected to increase by 0.40 percent, or 61 students, for a total enrollment of 15,847 (including special placements).
Although exceptional progress can be seen through the division-wide transformation efforts over the past several years, the work is not complete. The School Board, Superintendent, and staff continue long-term efforts that require strategic planning, investment in our staff, professional learning, accountability and community engagement.
This budget aligns our resources effectively and efficiently in order to support student achievement, provide top quality teachers, improve facilities, engage families and ensure the safety and security of students and staff.
9 FY 2024 Proposed Budget
Budget Calendar
During the fall, the School Board and staff begin the budget development process for the next fiscal year. The budget calendar is discussed by the School Board to define the time frame under which the Final Budget will be prepared, discussed, and approved. The School Board approves the budget calendar as part of setting the work and meeting schedule for both the Combined Funds and CIP budgets.
Shown below is the FY 2024 Budget Calendar table. The School Board approved FY 2024 Budget Calendar can be found at https://www.acps.k12.va.us/departments/financial-services/budget
QUARTER KEYDATES ACTIVITY
Thursday,August25,2022 SchoolBoardRetreat/WorkSession
Thursday,September8,2022 SchoolBoardWorkSession:BudgetCalendar,BudgetProcessResolution,and RulesofEngagement
Thursday,September22,2022 RegularSchoolBoardMeeting: AdoptionoftheBudgetCalendar,BudgetProcessResolution,Rulesof Engagement
Thursday,September22,2022 SchoolBoardWorkSession:CFandCIPBudgetPriorities,FiscalForecast
Thursday,October6,2022 RegularSchoolBoardMeeting:AdoptionoftheCFandCIPBudgetPriorities
Monday,October17,2022 CommunityForumontheFY2024CFandFY2024-2033CIPBudgets
Tuesday,October18,2022 CityCouncil/SchoolBoardJointWorkSessiononFY2024-2033CIPBudget
Saturday,November5,2022 CityManagerProposedGuidanceandRevenueOutlook
Thursday,November10,2022 RegularSchoolBoardMeeting:PresentationoftheSuperintendent'sProposedFY 2024-2033CIPBudget(DuringRegularSchoolBoardMeeting)
Monday,November14,2022 SpecialCalledSchoolBoardMeeting:PublicHearingontheFY2024-2033CIP Budget
Monday,November14,2022 SchoolBoardCIPWorkSession#1andCFEmployeeCompensation
Monday,November28,2022 SchoolBoardCIPWorkSession#2
Tuesday,December6,2022 StaffDeadlinetoCompileCIPAdd/DeleteCo-Sponsorships,PubliclyPostCoSponsorships,andPubliclyPostUpdatedSuperintendent'sRecommendations
Wednesday,December7,2022 SchoolBoardCIPAdd/DeleteWorkSession#1
Tuesday,December13,2022 SchoolBoardCIPAdd/DeleteWorkSession#2
Thursday,December15,2022 RegularSchoolBoardMeeting:AdoptionoftheFY2024-2033CIP (DuringRegularSchoolBoardMeeting) PresentationofFY2022CAFR
Thursday,January5,2023 RegularSchoolBoardMeetingandOrganizationalMeeting: PresentationoftheSuperintendent'sProposedFY2024CFBudget(DuringRegular SchoolBoardMeeting)
Thursday,January12,2023 SchoolBoardCFWorkSession#1
Thursday,January19,2023 PublicHearingontheFY2024CFBudget SchoolBoardCFWorkSession#2
Monday,January23,2023 SchoolBoardDeadlinetoSubmitQuestionsontheFY2024CFBudget (DuebyNoon)
Monday,January30,2023 StafftoPubliclyPostResponsestoSchool-BoardQuestionsontheFY2024CF Budget
Wednesday,February8,2023 StaffDeadlinetoCompileCFAdd/DeleteCo-Sponsorships,PubliclyPostCoSponsorshipsandPubliclyPostUpdatedSuperintendent'sRecommendations
Thursday,February9,2023 SchoolBoardCFAdd/DeleteWorkSession#1
Thursday,February16,2023 RegularSchoolBoardMeeting:AdoptionoftheFY2024CFBudget
Tuesday,February28,2023 CityManagerPresentstheCityofAlexandria'sFY2024ProposedBudget
Tuesday,March14,2023 CityCouncilIntroducesTaxrateOrdinanceandSetsMaximumTaxRate
Wednesday,May3,2023 CityCouncilAdoptionofTaxRate,FY2023GeneralFund,andFY2024-2033 CIPBudgets
Thursday,May4,2023 RegularSchoolBoardMeeting: Superintendent'sAdjustedProposedBudgetontheFY2024CFandFY2024-2033 CIPBudgets
Thursday,May4,2023 SchoolBoardCFandCIPWorkSession
Friday,May5,2023 SchoolBoardDeadlinetoSubmitQuestionsontheFY2024CFandFY2024-2033 CIPBudgets(DuebyNoon)
Tuesday,May9,2023 StafftoPubliclyPostResponsestoSchool-BoardQuestionsontheFY2024CF andFY2024-2033CIPBudgets
Thursday,May11,2023 SchoolBoardDeadlinetoSubmitCFandCIPAdd/DeleteRequeststoStaff (DuebyNoon)

Wednesday,May17,2023
StaffDeadlinetoCompileCFandCIPAdd/DeleteCo-Sponsorships,PubliclyPost Co-SponsorshipsandPubliclyPostUpdatedSuperintendent'sRecommendations
Thursday,May18,2023 SchoolBoardCFandCIPAdd/DeleteWorkSession#1
Thursday,May18,2023 PublicHearingontheFY2024CFandFY2024-2033CIPBudgets
Thursday,May25,2023 SchoolBoardCFandCIPAdd/DeleteWorkSession#2,IfNeeded
Thursday,June1,2023 RegularSchoolBoardMeeting:AdoptionoftheFinalFY2024CFandFY20242033CIPBudgets(DuringRegularSchoolBoardMeeting)(ESSERIIIUpdate)
10 FY 2024 Proposed Budget
AlexandriaCityPublicSchools
Q1 Q2 Q3 Q4
FY2024BudgetCalendar
ACPS Strategic Planning and Budgeting

Alexandria City Public Schools has pledged to provide an equitable, high quality education which is accessible and engaging to all students in a five-year strategic plan approved by the Alexandria City School Board on June 26, 2020.
Equity For All 2025 is a bold and courageous roadmap that is timely and will position ACPS as a national leader in redefining PreK-12 education as a deliberately inclusive and supportive experience where all succeed. Going forward, racial equity will be at the center of every decision that the school division will make.
For the first time in the history of ACPS, the strategic planning process was aligned with the planning process for multiple citywide departments and organizations with the goal of ensuring that City and school plans have shared goals and outcomes. This Unified Planning Team included the Department of Community and Human Services’ Children and Youth Master Plan (CYMP), and the Alexandria Health Department and the Partnership for a Healthier Alexandria’s Community Health Improvement Plan (CHIP).
These organizations embraced a shared understanding of racial equity and kept that principle at the heart of all decision making. The key focus areas of the Unified Planning Team are racial equity, developmental assets and a trauma-informed approach. They aim to add value through collective community engagement, the sharing of data, and a focus on joint outcomes.


The development of the ACPS 2025 Strategic Plan, guided by ACPS’ consultant FourPoint Education Partners, has taken more than a year of collaboration and engagement involving a Strategic Planning Committee consisting of ACPS staff from every school, students, parents and representation from key community groups across Alexandria. ACPS will work with the Unified Planning Team to develop a process to implement their plans together.
11 FY 2024 Proposed Budget
School Board Budget Goals
Each of the five goals for the strategic plan has a number of measures that help track and report progress in achieving the goal. Key Performance Indicators (KPIs) define the key overall outcomes that an organization is trying to achieve. They answer the question of what success looks like and how will we know if we are progressing toward the intended outcome. As an educational organization, within ACPS all KPIs are student outcomes.
In addition to measures, each goal also has a number of strategies and highlighted actions, which outline the steps that ACPS will take to achieve the goal.
Shown in the following pages is a summary of the ACPS Strategic Plan 2025: Equity for All. For the full 2025 Strategic Plan: Equity for All, please visit
https://www.acps.k12.va.us/cms/lib/VA01918616/Centricity/Domain/1330/2025-strategic-plan.pdf
School Board Budget Priorities
The budget priorities for FY 2024 align to the strategic plan goals and the strategic resource allocation goals specifically serve to ensure that differentiated resources and supports are provided to schools and departments and are used efficiently and effectively to focus on meeting students where they are to support equitable outcomes.
Shown in the Budget-at-a-Glance section is the Combined Funds Budget Priorities table.
12 FY 2024 Proposed Budget
Strategic Plan


13 FY 2024 Proposed Budget
Budget at a Glance

14 FY 2024 Proposed Budget
Budget at a Glance
15 FY 2024 Proposed Budget
Combined Funds Statement
The table below shows the combined funds statement. Actual figures are shown for FY 2020 through FY 2021, Final Budget figures shown for FY 2022 and FY 2023. The presentation of revenue and expenditures has been adjusted to show “Other Financing Sources and Uses” on a separate line. This presentation more closely aligns with the statement of revenues, expenditures, and changes in fund balances as presented in the Audited Comprehensive Financial Report (FR).
The Combined Funds budget consists of three separate funds:
Operating Fund: This fund provides for the day-to-day operation of the school division and includes the division’s primary revenue sources from the Commonwealth of Virginia and the City of Alexandria. Projected Operating Fund revenues increase by 3.9 percent in FY 2024, compared to the FY 2023 Final budget.
Grants and Special Projects Fund: This fund accounts for all federal, state, and local grants. Federal and state grant funds are primarily entitlement funds allocated to the school division on a formula basis, but operating under grant rules as they relate to requirements, management, performance, and reporting. Grants and special projects revenue projections increase by 0.5 percent compared to the FY 2023 Final budget. Important to note is that funding provided from Coronavirus Response and Relief Supplemental Appropriations (CRRSA) Act (ESSER II) and American Rescue Plan (ARP) (ESSER III) was appropriated in FY 2022. Carryover (outstanding balance) funding will be reauthorized in FY 2024 pending year-end balances as of June 30, 2023.
School Nutrition Fund: This Enterprise fund covers all food service operations and administrative costs, primarily from food sales and federal revenue. It does not include cafeteria aides who are budgeted in the Operating Fund. School Nutrition Fund revenues increase by 4.7 percent from the FY 2023 Final budget.
16 FY 2024 Proposed Budget Fund FY2020 Actual FY2021 Actual FY2022 Final Budget FY2023 Final Budget FY2024 Proposed Budget $Change FY2022to FY2023 %Change FY2022to FY2023 OperatingFund BeginningBalance 10,823,059 $ 15,234,905 $ 21,616,565 $ 21,616,565 $ 21,616,565 $ - $ 0.0% Revenue 280,276,938 287,510,821 292,222,736 311,307,300 323,426,400 12,119,100 3.9% Expenditures 274,309,488 279,412,688 296,745,621 316,189,337 329,446,411 13,257,074 4.2% OtherFinancingSources/(Uses) (1,555,604) (1,716,473) (591,567) (4,437,400) (830,546) 3,606,854 -81.3% TotalFundBalance(Projected)* 15,234,905 $ 21,616,565 $ 21,616,565 $ 21,616,565 $ 21,616,565 $ - $ 0.0% TotalAdditionto/(Useof)FundBalance 4,411,846 6,381,660 (5,114,452) (9,319,437) (6,850,557) 2,468,880 -26.5% Grants&SpecialProjectsFund BeginningBalance 207,056 $ 181,950 $ 166,387 $ 166,387 $ 166,387 $ - 0.0% Revenue 14,522,777 23,050,509 65,659,413 15,747,364 15,820,233 72,869 0.5% Expenditures 16,103,487 24,782,545 67,450,980 17,610,664 17,850,779 240,115 1.4% OtherFinancingSources/(Uses) 1,555,604 1,716,473 1,791,567 1,863,300 2,030,546 167,246 9.0% TotalFundBalance(Projected)* 181,950 $ 166,387 $ 166,387 $ 166,387 $ 166,387 $ - $ 0.0% TotalAdditionto/(Useof)FundBalance (25,106) (15,563) - - -*** SchoolNutritionFund BeginningBalance 3,454,416 $ 2,910,103 $ 4,375,083 $ 4,375,083 $ 4,375,083 $ - 0.0% Revenue 8,853,019 10,114,454 11,194,167 12,037,486 12,600,871 563,385 4.7% Expenditures 9,397,332 8,649,474 11,194,167 12,037,486 12,600,871 563,385 4.7% OtherFinancingSources/(Uses) - - - - -*** TotalFundBalance(Projected)* 2,910,103 $ 4,375,083 $ 4,375,083 $ 4,375,083 $ 4,375,083 $ - $ 0.0% TotalAdditionto/(Useof)FundBalance (544,313) 1,464,980 - - -*** CombinedFunds BeginningBalance 14,484,531 $ 18,326,958 $ 26,158,034 $ 26,158,034 $ 26,158,034 $ - $ 0.0% Revenue 303,652,734 320,675,784 369,076,316 339,092,150 351,847,504 12,755,354 3.8% Expenditures 299,810,307 312,844,707 375,390,768 345,837,487 359,898,061 14,060,574 4.1% OtherFinancingSources/(Uses) - - 1,200,000 (2,574,100) 1,200,000 3,774,100 -146.6% TotalEndingFundBalances(Projected)* 18,326,958 $ 26,158,035 $ 26,158,035 $ 26,158,035 $ 26,158,035 $ - $ 0.0% TotalAdditionto/(Useof)FundBalance 3,842,427 7,831,077 (5,114,452) (9,319,437) (6,850,557) 2,468,880 -26.5% Note:Numbersmayvaryduetorounding. 18,326,958 31,272,486 *Fundbalanceincludesencumberedcarryover,prepaids,designatedusesoffundbalanceforbudgetpurposesandanyunassignedamounts. CombinedFundsStatement Operating,Grants&SpecialProjects,andSchoolNutritionFunds
Combined Funds: As shown on the pie chart below, the Operating Fund revenue (excluding other financing) represents 92.0 percent of the combined funds budgeted revenue and totals $323.43 million. Grants and Special Projects Fund revenue represents 4.5 percent and totals $15.82 million. School Nutrition Fund revenue represents 3.5 percent and totals $12.60 million of the combined funds budget revenue.

FY 2024 Proposed Combined Funds Budget Total Revenue
3.5% Grants & Special Projects
4.5%
School Nutrition
The chart below shows the distribution of salary, benefits, and non-personnel expenditures for all funds, combined. Total salary and benefits expenditures comprise of approximately 85.1 percent of the total combined funds budget in FY 2024, which is a slight decrease from 85.6 percent in the FY 2023 budget.


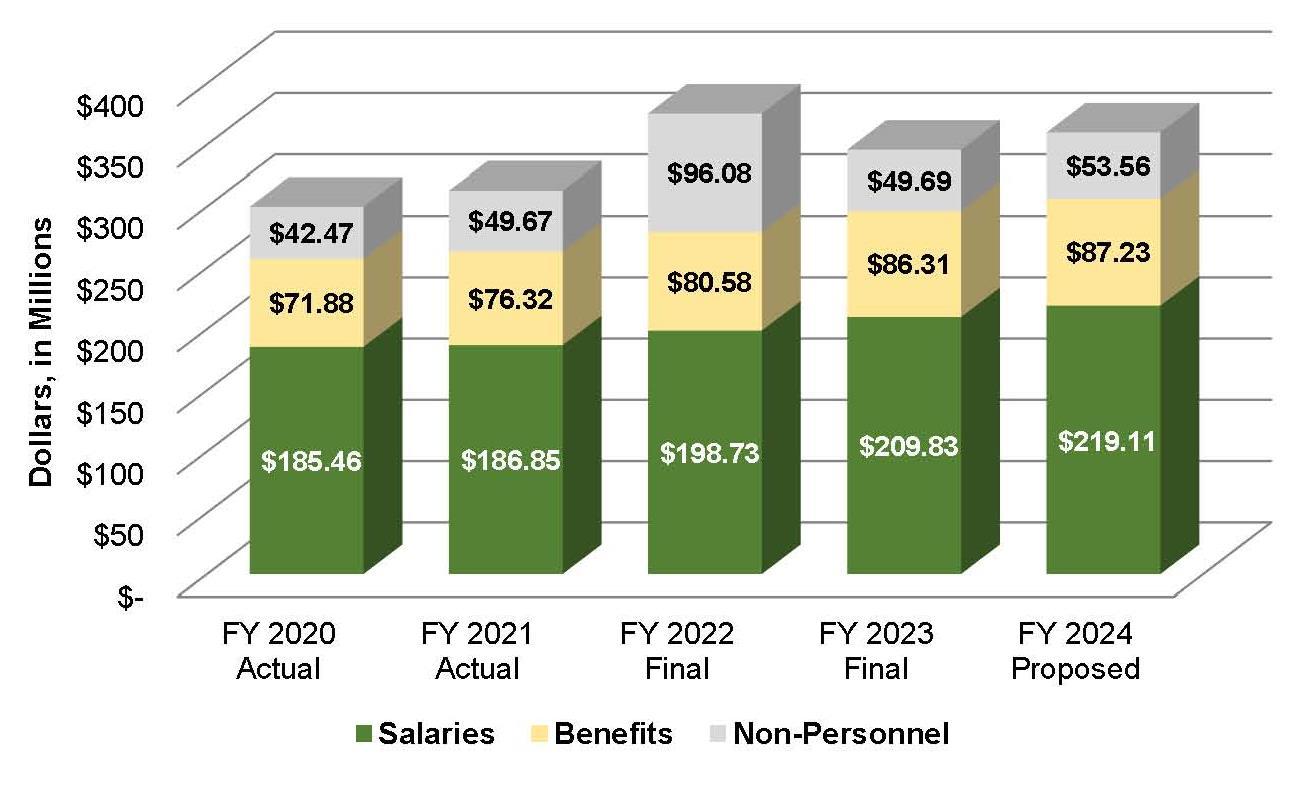
Salaries and benefits expenditures are projected to increase overall by 3.4 percent. This increase is driven primarily by compensation improvements for current ACPS staff as well as increases in health insurance premiums.
ACPS Combined Funds Expenditures
FY 2020 – FY 2024
17 FY 2024 Proposed Budget
Sources of Revenue by Fund

Operating Fund: The primary source of operating revenue for ACPS is the city appropriation which comprises 79.9 percent of projected operating revenue and other financing. State revenue is less at 19.7 percent and local and federal revenues total approximately 0.4 percent. The school division is fiscally dependent on the City of Alexandria and is not permitted to incur long-term debt.


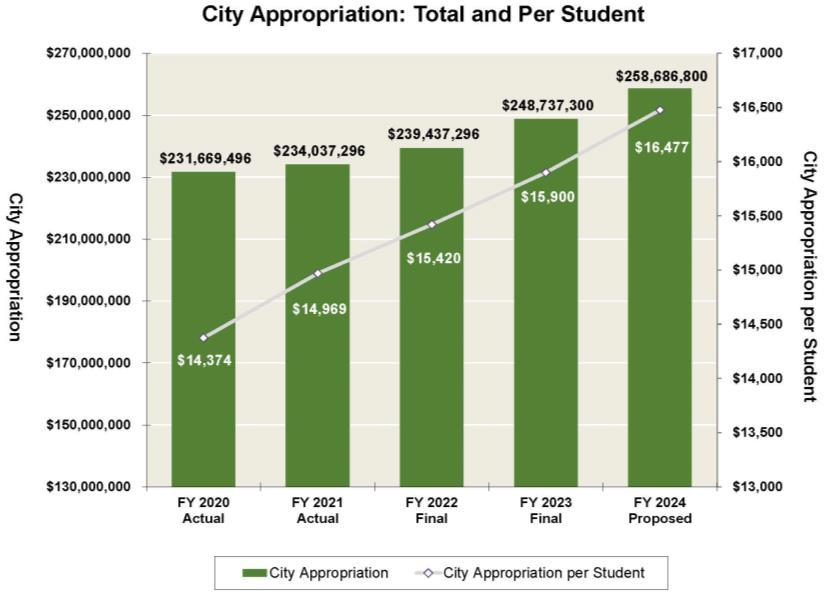
The City Appropriation of $258.67 million is an increase of $9.95 million, or 4.0 percent greater than the previous fiscal year. The city appropriation per student is projected at $16,477, as shown in the table below.
State revenues are projected to total $63.56 million, an increase of $2.14 million or 3.5 percent. State revenues are projected to increase mainly in the area of basic aid and sales tax; overall, other funding categories are projected to remain flat. Local revenue projections total $1.04 million in FY 2024, representing a slight increase from the amount budgeted for FY 2023.
Federal funds total $0.15 million, an increase from the amount budgeted for FY 2023. These funds will support the ROTC program at Alexandria City High School. Additional federal revenue received by ACPS include entitlement grants which are budgeted in the Grants and Special Projects Fund.
Other Financing includes other sources of funds from the Capital Improvement Project (CIP) fund. Included in FY 2024 is other uses of funds for the Virginia Preschool Initiative (VPI) which is tracked in a separate grants and special projects fund. The FY 2024 Operating Fund support for the preschool program will be $2.03 million.
The FY 2024 budget also includes the use of Operating Fund Balance. The total amount of $6.85 million budgeted for FY 2024 will support school operations and is approximately 1.75 percent of the total operating budget. Throughout the year, the ACPS Fiscal Services Division closely monitors both the actual and projected year-end balances of all School Board funds to ensure both prudent fiscal management and ongoing compliance with School Board policies.
Grants and Special Projects Fund: Total budgeted revenues in this fund are projected to increase by 0.5 percent to $15.82 million. Additional grant funding may be available during the upcoming fiscal year through the use of carryover from prior year grant funds or if new awards become available.
School Nutrition Fund: An increase in revenues of $0.56 million, or 4.7 percent, is mainly driven by increases in local and federal revenue. Additional information can be found in the Financials section of this document.
State Funds 19.7% Local Funds 0.3% Federal Funds 0.1% Operating Fund FY 2024 Proposed Revenue (Excludes Fund Balance and Other Financing) 18 FY 2024 Proposed Budget
Expenditure Overview by Fund
Operating Fund:
The FY 2024 Operating Fund expenditure budget totals $329.45 million, an increase of $13.26 million or 6.6 percent when compared to the previous fiscal year’s budget. This does not include the transfer to support the preschool program.
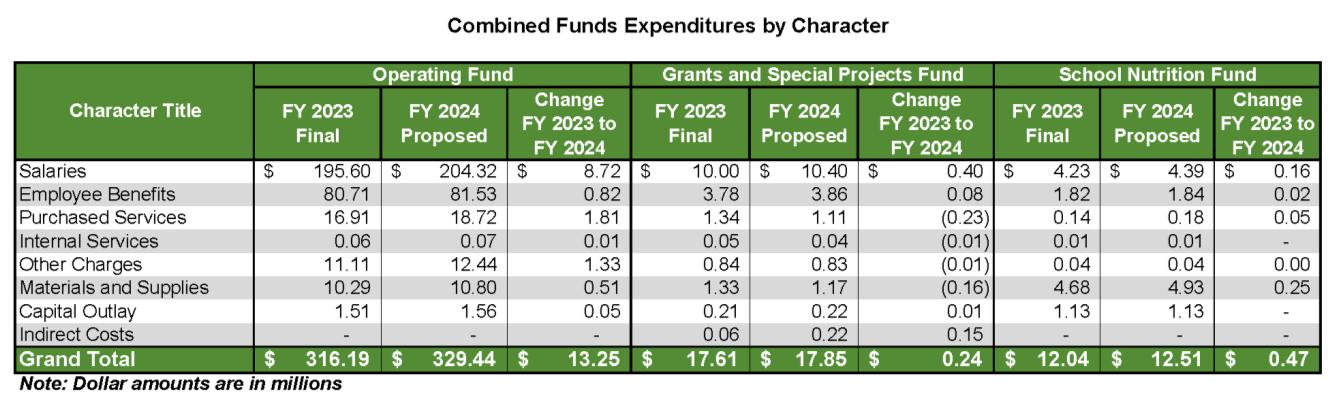
As shown on the following page, salary accounts increase by $8.72 million or 4.5 percent compared to the FY 2023 budget primarily as a result of a step increase and 2.5 percent market rate adjustment for all eligible employees which will be awarded be at the start of the contract year. The benefit expenditures increase by $0.82 million or 1.0 percent, primarily the result of changes to health benefit premiums. Non-personnel accounts increased by $3.72 million or 13.3 percent. An explanation of character titles can be found in the Reading of the Financial Reports narrative in the Financial section.
Grants and Special Projects Fund:
The total budgeted expenditures for the Grants and Special Projects Fund in FY 2024 is $17.85 million, an increase of $0.24 million or 1.4 percent from the FY 2023 Final Budget. Salaries and benefit expenditures total $14.26 million, or approximately 79.9 percent of the total grants and special projects budget. Non-personnel expenditures total $3.59 million and account for approximately 20.1 percent of the total grants and special projects budget. These changes are seen in more detail in the Financials section of this document.
The Grants and Special Projects Fund budget is a preliminary estimate based on current year awards which will be adjusted later in the year as additional information is received. Final grant award amounts are typically confirmed by the grantors in the fall. In addition, carry-over funding will be determined based on the FY 2023 year-end audited actual expenditures.
School Nutrition Fund:
The Food and Nutrition Services Fund is a major special revenue fund used to account for revenues internally restricted to expenditures for certain purposes, specifically for the procurement, preparation and serving of student meals. The FY 2024 budgeted expenditures total $12.60 million, an increase of $0.56 million compared to the FY 2023 budget.
Salaries will increase to $4.39 million from $4.23 million in the FY 2024 Proposed Budget, while benefit
19 FY 2024 Proposed Budget
expenditures will increase slightly. due to an increase in health insurance costs. Non-personnel accounts increased by $0.39 million or 6.5 percent. In FY 2024, Materials and Supplies related to food service as well as the capital outlay are both anticipated to increase. These changes are shown in more detail in the tables in the Financials section of this document.
Major Changes in Operating Expenditures
ACPS is committed to achieving the mission and vision articulated in the Equity for All 2025 strategic plan and meeting the priorities that School Board established for the school year. The FY 2024 Proposed Budget aims to bring these plans and priorities to fruition while at the same time ensuring we proactively mitigate adverse long-term impacts of the pandemic our students, our school system, and our community.
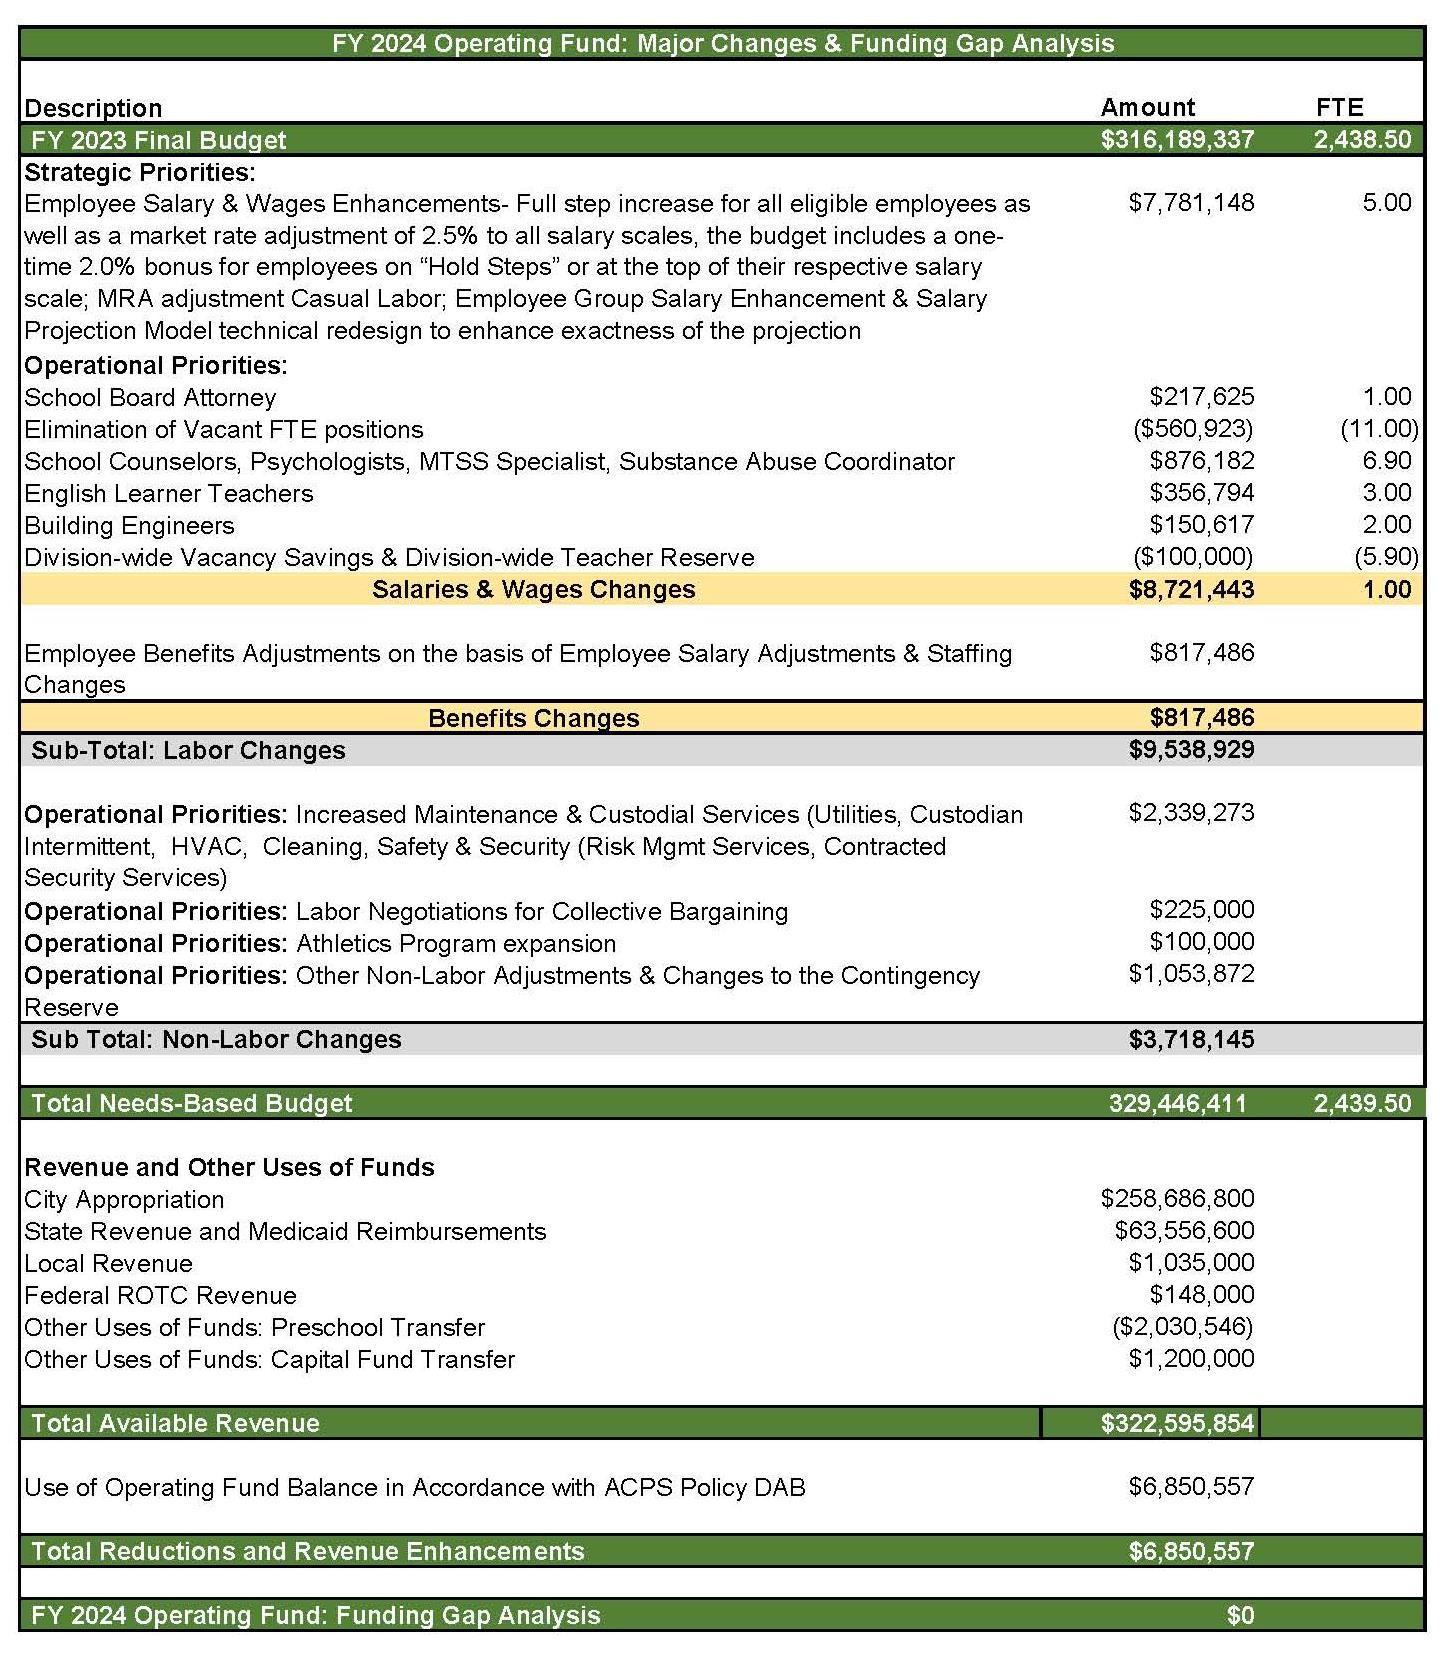
When compared to the FY 2023 Final Budget, the FY 2024 Operating Budget features a $13.25 million, or a 4.2% percent increase, coupled with an increase of 1 FTE position, as compared to last year. The current enrollment trends, increased complexity of student needs, and staff compensation and benefits are the primary drivers in projected changes.
Staffing changes are primarily the result of meeting shifting needs throughout ACPS during the pandemic. Details of the enrollment-driven staffing changes and other staffing changes can be found throughout this document.
The table below highlights some of the above mentioned changes. As noted, the most significant cost driver is employee compensation. Various expenditure adjustments, such as school-based and non-school based staffing enhancements as well as other expenditure adjustments were necessary additions to the budget. FY 2024 projected revenue and other uses of funds results in a funding gap. The district intends to balance the budget with prior year fund balance resources. Greater detail of these changes can be found in the Financials section of this document.
20 FY 2024 Proposed Budget
21 FY 2024 Proposed Budget
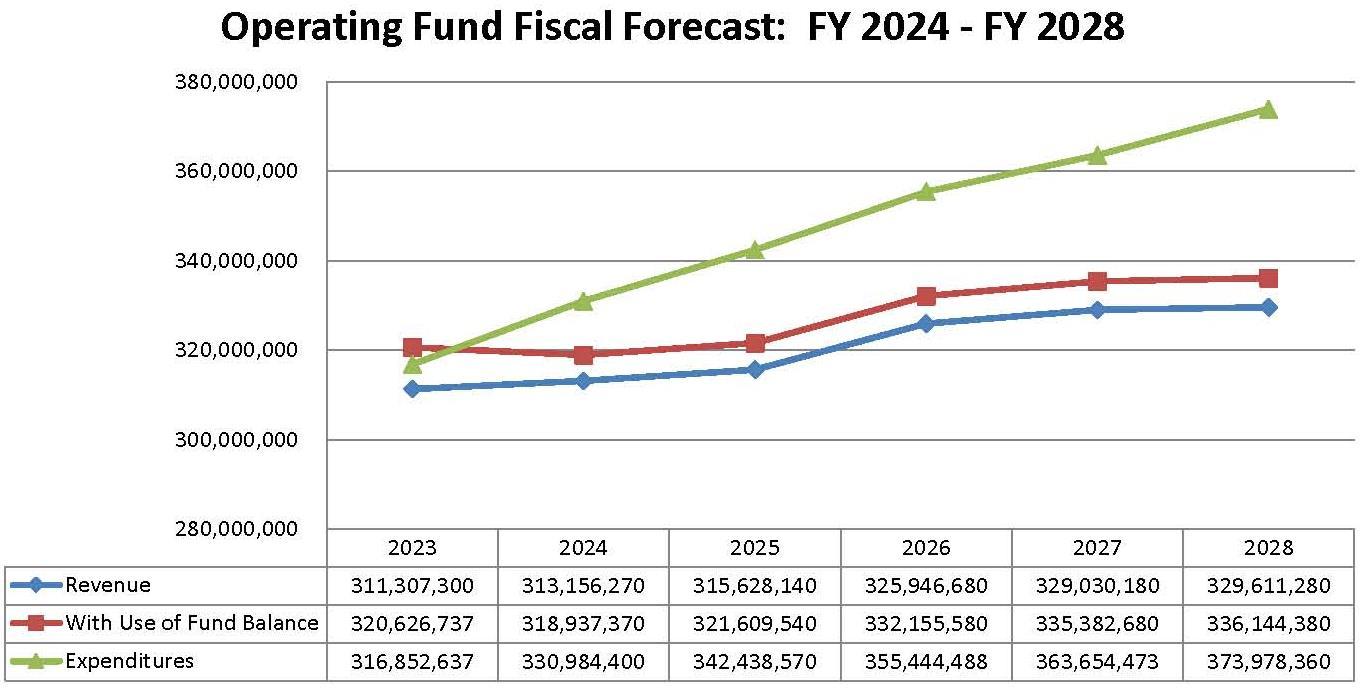
FY 2024-2028 Fiscal Forecast
The FY 2024-2028 fiscal forecast incorporates the revenue and expenditures of the final FY 2023 budget and projects financial performance for the Operating Fund through FY 2028.
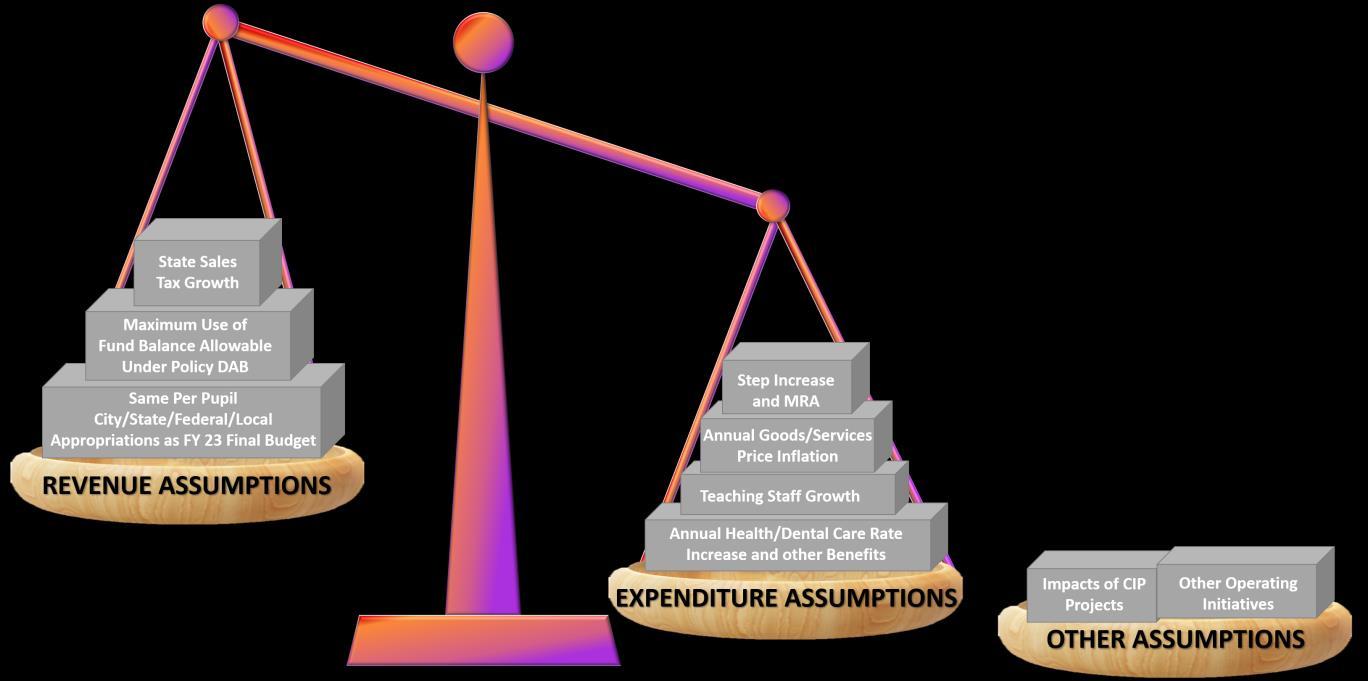
The forecast utilizes assumptions concerning enrollment and demographics, class size and staffing levels, as well as revenue and expenditure inflation trends, to provide a long-range picture of the financial challenges facing ACPS. The graphic below provides a summary of those assumptions. The model underlying the forecast provides an analytical framework that allows the Alexandria City School Board and ACPS leadership to examine how changes in operating assumptions affect this financial picture, and will be used to determine how best to close the forecasted operating gap.
The fiscal forecast for the Grants & Special Project Fund reflect revenue assumptions for primarily, Federal entitlement grants and are offset by the requisite expenditure modification. Likewise, the School Nutrition Fund reflect similar expenditure assumptions; however revenue projections offset the impact of the assumptions. Thus, these two funds are excluded from the forecast.


Multi-year Revenue and Expenditure Projections
The chart on the next page displays the revenue (inclusive of other financing sources and uses) and expenditures from FY 2023 Final Budget through FY 2028 Projected Budget, as presented in the FY 2024 Budget Work Session in September of 2022.
By FY 2028, Alexandria City Public School district is forecasted to face an operating shortfall of $44.37 million. ACPS will continue to closely monitor revenue and expenditures and intends to mitigate potential unfunded needs through the following strategies:
1) continue efforts to diversify and grow ACPS revenue sources by growing strategic partnerships,


2) adopt fiscal austerity measures including de-prioritization of spending that could be deferred to out years
3) use of fund balance, as deemed necessary by the Superintendent and approved by the School Board.
*Context*
22 FY 2024 Proposed Budget
The assumptions below are not visually ranked by total amount.
Cost per Pupil
ACPS’s cost per pupil calculations determine the average cost per pupil for all students, then disaggregates the cost into three components:
✓ All general education
✓ Special education
✓ English learner (EL) services
The table and bar chart below show the average per pupil cost projected to increase by 3.6 percent to $21,474, for FY 2024 compared to the prior fiscal year. The FY 2024 Budget for General Education per pupil cost increases by 3.7 percent to $17,211, Special Education per pupil cost increase by 2.4 percent to $37,255, and EL cost per pupil increase by 3.7 percent to $21,508 compared to the prior fiscal year.
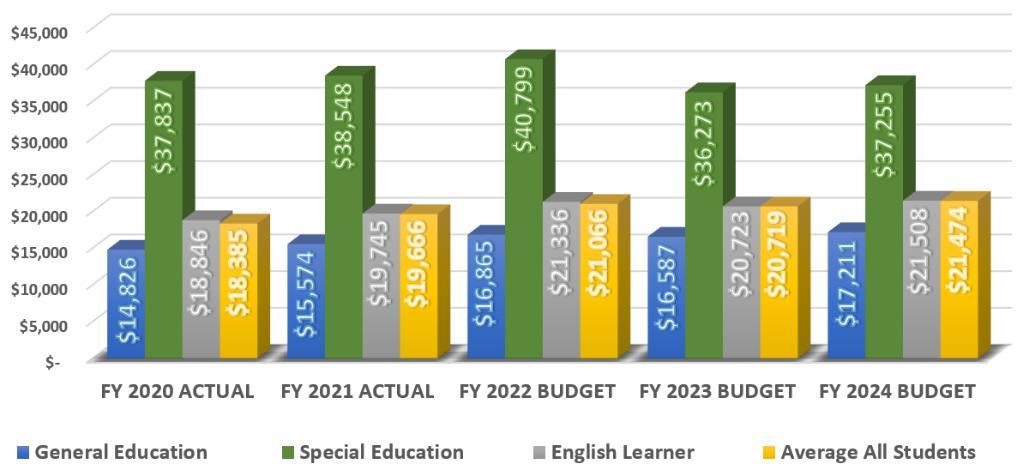
The ACPS cost per pupil formula includes the Virginia Preschool Initiative (VPI) grant expenditures and updates the special education transportation cost factor, which apportions a share of the transportation cost to special education based on the ratio of special education buses to standard school buses.
23 FY 2024 Proposed Budget NewEnrollment/ Objects FY2020 Actual FY2021 Actual FY2022 Final Budget FY2023 Final Budget FY2024 Proposed Budget Percent ChangeFY 2023toFY 2024 Percent ChangeFY 2020toFY 2024 GeneralEducation 14,826 $ 15,574 $ 16,865 $ 16,587 $ 17,211 $ 3.7% 16.1% SpecialEducation 37,837 38,548 40,799 36,273 37,255 2.4% -1.5% EnglishLearner 18,846 $ 19,745 $ 21,336 $ 20,723 $ 21,508 $ 3.7% 14.1% AverageAllStudents 18,385 19,666 21,066 20,719 21,474 3.6% 16.8%
Capital Improvement Program (CIP) Introduction
The Alexandria City Public Schools (ACPS) FY 2024-2033 Capital Improvement Program (CIP) is framed by several major considerations: Systemic Alignment, Instructional Excellence, Student Accessibility and Support, Strategic Resource Allocation, Family & Community Engagement.
ACPS incorporates current enrollment information, program requirements, city population data, and planning & zoning assessments, along with principal and department head needs. In addition, staff uses operations and maintenance data, School Board strategic plans and facility needs assessments to determine capital needs. The Capital Improvement Program adoption reflects the annual commitment to a series of projects with estimated costs based on current knowledge, market conditions and priorities.
The City of Alexandria defines a capital project as one that acquires or improves a physical asset with a useful life of three or more years for greater than $10,000 not including day-today maintenance tasks. Several capital projects have a direct impact on the operating budget and are typically related to capacity.
While the program serves as a long range plan, it is reviewed and revised annually based on current planning circumstances and the need to reprioritize.
Strategic Planning Framework
Equity is an essential part of the ACPS 2025 Strategic Plan. This is particularly relevant for the facilities we offer our students and staff. This plan pledges to work for the modernization of schools so that every student has not just a beautiful building and learning space, but optimal learning environments with access to program opportunities.
Overview Of the CIP and Budget
The FY 2024-2033 CIP reflects previous goals of a comprehensive approach and maintains the commitment to the recommended CIP schedule from the Ad-Hoc Joint City-Schools Facilities Investment Task Force (Task Force) from November 2017. Each major capacity project is intended to be comprehensive and the expected lifespan is 30-50 years. However, this budget also acknowledges that our dilapidated facilities will need interim modernization projects to sustain a deferred replacement or major renovation to the school.
The total proposed CIP budget is $457,257,200. This is $40.5M less than the total ten-year City Council approved FY 2023-2032 CIP; which can be largely attributed to the full funding of the High School Project in FY 2023 and reflects ACPS’s commitment to its partnership with the City in being fiscally responsible with taxpayers’ dollars.
The FY 2024-2033 Proposed CIP does include a deficit of $23.9M in the FY 2024 budget year which is largely due to cost escalations experienced or anticipated on FY 2023 and FY 2024 projects due to supply-chain challenges industry-wide. ACPS staff made every effort to defer projects which were not critical in FY 2024.
Enrollment projections indicate that secondary enrollment will exceed capacity in coming years. ACPS has begun The High School Project to better serve the high school students academic experience while accommodating enrollment. A dissection of more elements of the CIP budget is found in the Financial section of this document.
24 FY 2024 Proposed Budget
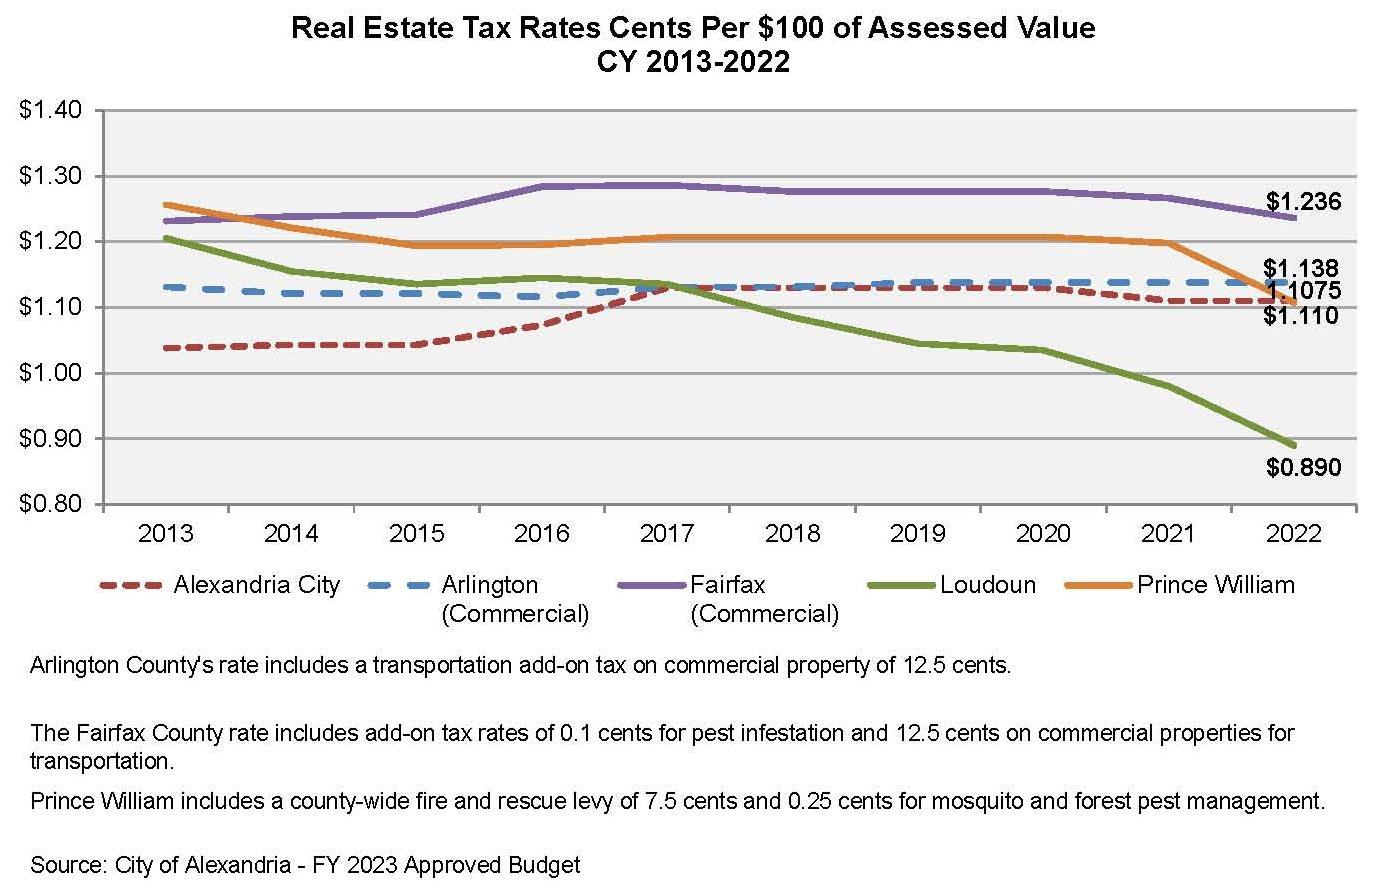
Alexandria City Real Estate Property Tax Information
Real estate property tax rates in the City of Alexandria are set by the Alexandria City Council.
All real estate parcels in the City of Alexandria are annually assessed at 100 percent of estimated fair market value as of Jan. 1. Real estate assessed values are based on trends in the region and in the city, but primarily from large numbers of sales that are analyzed to determine values for groups of properties. Real estate taxes are based on these assessed values and the real estate tax rate.
Alexandria has the second lowest tax rate in Northern Virginia for CY 2022 (FY 2023), as shown in the real estate tax rate line graph. The graph show a comparison of tax rates among the City of Alexandria and neighboring jurisdictions, including Arlington County, Fairfax County, Loudoun County and Prince William County over the past ten calendar years. Rates listed are per $100 of assessed value.
The FY 2023 budget reflects a real property tax rate of $1.110 per $100 of assessed value, unchanged compared to the FY 2022 rate. Changes to the real estate tax rate can impact budget through revenue collection and average residential tax bill.
25 FY 2024 Proposed Budget
Section

II:
Organization
✓ Division Structure


✓ Strategic Plan
✓ Budget and Financial Management


Section II:
Division Structure
Overview of Alexandria City Public Schools
Alexandria City Public Schools (ACPS) serves the City of Alexandria, just outside Washington, D.C. in Northern Virginia. For school year 2023-2024, ACPS will serve a projected 15,793 (excluding special placements)students from preschool to grade 12 at one Early Childhood Center, 12 elementary schools, one Pre-K through eight school, one K through eight school, two middle schools, one high school (consisting of a ninth-grade center and a separate main campus for grades ten-twelve), a flexible online learning Satellite Program, and the Chance for Change Academy (an interim education facility). ACPS also operates a school at the Northern Virginia Juvenile Detention Center and the Sheltercare facility.
ACPS is considered a component unit of the City of Alexandria. The City of Alexandria has a total area of 15.8 square miles and has an estimated population of 154,706 people, as of the 2021 Census Bureau Population Estimate The City funds 78.5 percent of the ACPS operating budget.
The ACPS School Board is a nine-member elected body whose primary responsibilities are to adjust and oversee capital and operating budgets annually, to formulate and adopt policy, to select a Superintendent to implement policy, and to evaluate the results (Policy BBA). The City of Alexandria is divided into three voting districts (districts A, B, and C) and three Board members are elected from each district. Each member is elected concurrently for a threeyear term of office. The election took place in November 2021 and the newly elected Board took office in January 2022.
The organizational structure of ACPS is designed to best meet the goals of the strategic plan and the needs of its diverse student population while effectively managing the various schools and programs within the division.
The interim Superintendent, Dr. Melanie KayWyatt, is the chief executive officer for the school division. Dr. Kay-Wyatt works closely with executive staff in managing all aspects of school division operations. All Chief Officers report directly to the Superintendent.
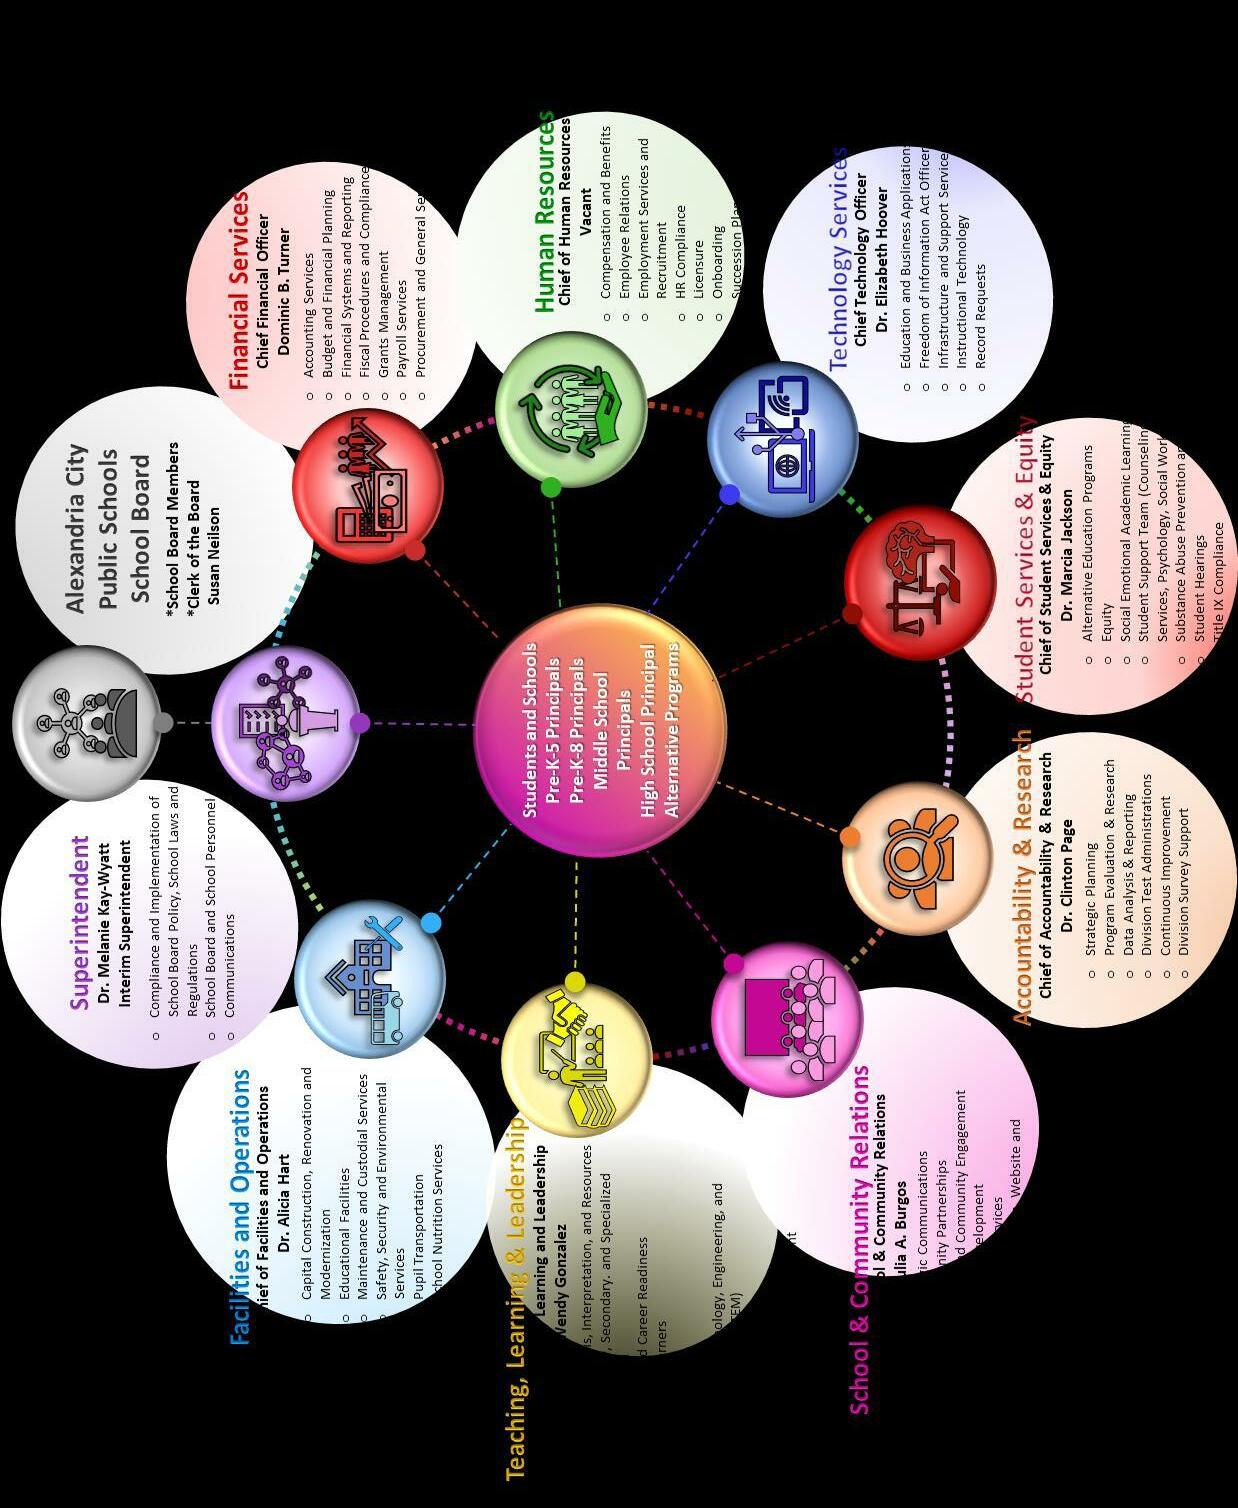
The Chief of School & Community Relations oversees the offices of communications and community partnerships & engagement. The Executive Director of School, Business, and Community Partnerships serves as the initial point of contact and liaison between the City, community and ACPS and coordinates major community funded facilities projects and outreach efforts. The office allows for consistent communication to interested partners and develops work flow processes associated with large complex projects that involve multiple departments. In addition, the office oversees the family and community engagement center and grants development. The Executive Director of Communications oversees all division-level communications and public relations, multimedia services, audiovisual services, and school-level public relation liaisons. The department is responsible for all emergency notifications, ACPS Express, ACPS Insider, school eNewsletters and the release of information from the school division to the media.
The Chief of Accountability & Research works closely with schools and central office staff to oversee instructional assessments, program evaluations and research, data analysis, reporting and school improvement. The department provides decision-makers with valid, reliable, and timely data to enhance the quality of education offered to students.
The Chief of Teaching, Learning & Leadership directly oversees all aspects of instructional programming including curriculum and effective teaching to ensure all ACPS students are prepared and equipped for success in college, work, and life in a global society. The
Page 26 ACPS FY 2024 Proposed Budget Division Structure
Division Structure
offices/teams include Adult Education; AVID/ College Readiness; Career and Technical Education; College and Career Readiness; Curriculum Design and Instructional Services; Early Childhood; English Learner Services; Humanities; Instructional Support; Library and Curricular Resources; Literacy; Specialized Instruction; STEM; School Leadership; Talent Development; Talented and Gifted Programs; and Title I Programs.
The Chief Technology Officer oversees the division’s technology program, including education and business applications, instructional technology, infrastructure and support services, and online learning. This position also coordinates the Freedom of Information Act (FOIA) requests.
The Chief of Student Services and Equity oversees home schooling, student hearings, cultural competence, school counseling services, school health services, school psychology services, school social work services, residency verification, truancy, and homelessness, as well as the alternative education programs, including the Northern Virginia Juvenile Detention Center School and Sheltercare. The department also provides counsel and support to the administration, school principals, and staff to help ensure that schools provide a safe and equitable learning environment for all students.
The Chief Financial Officer oversees accounting services, audit support, budget and financial planning, financial systems and reporting, fiscal procedures and compliance, grants management, payroll services, procurement, and general services.
The schools are supported in non-instructional operations by the Chief of Facilities and Operations, who oversees the support services provided by the Departments of Operations and Maintenance, Pupil Transportation, and School Nutrition Services.
The Chief of Human Resources oversees compensation and benefits, employee relations, employment services, licensure and onboarding of new employees, succession planning, and continuous improvement.
The organizational structure is intended to ensure the key focus remains on quality instruction, curriculum, and comprehensive student support, as outlined in ACPS 2025 Strategic Plan: Equity for All. Like many other school divisions, ACPS continues to monitor and evaluate its departmental operations to ensure increased efficiency and effectiveness as budget discussions become more difficult, understanding that additional capacity is needed for increased enrollment, and that focus on student achievement remains central.
The central office concentrates on planning, continuous improvement, leadership development, and a culture of shared responsibilities of all ACPS administrators.
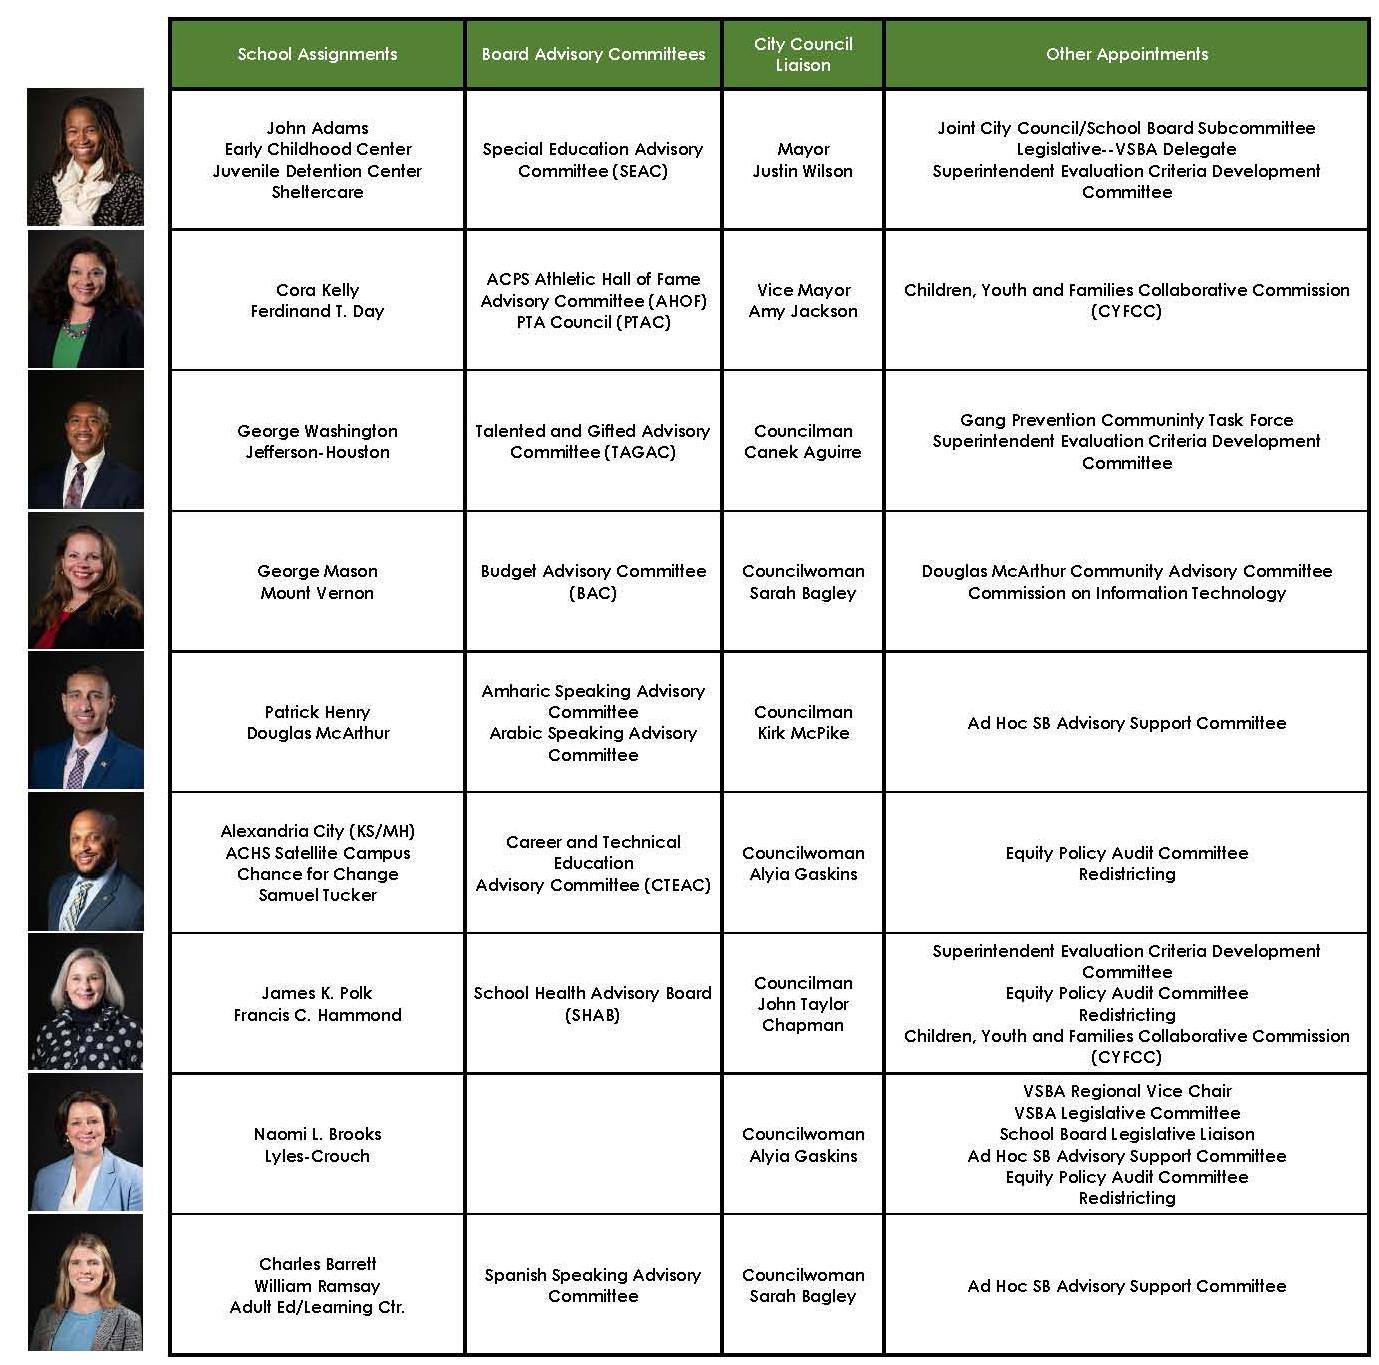
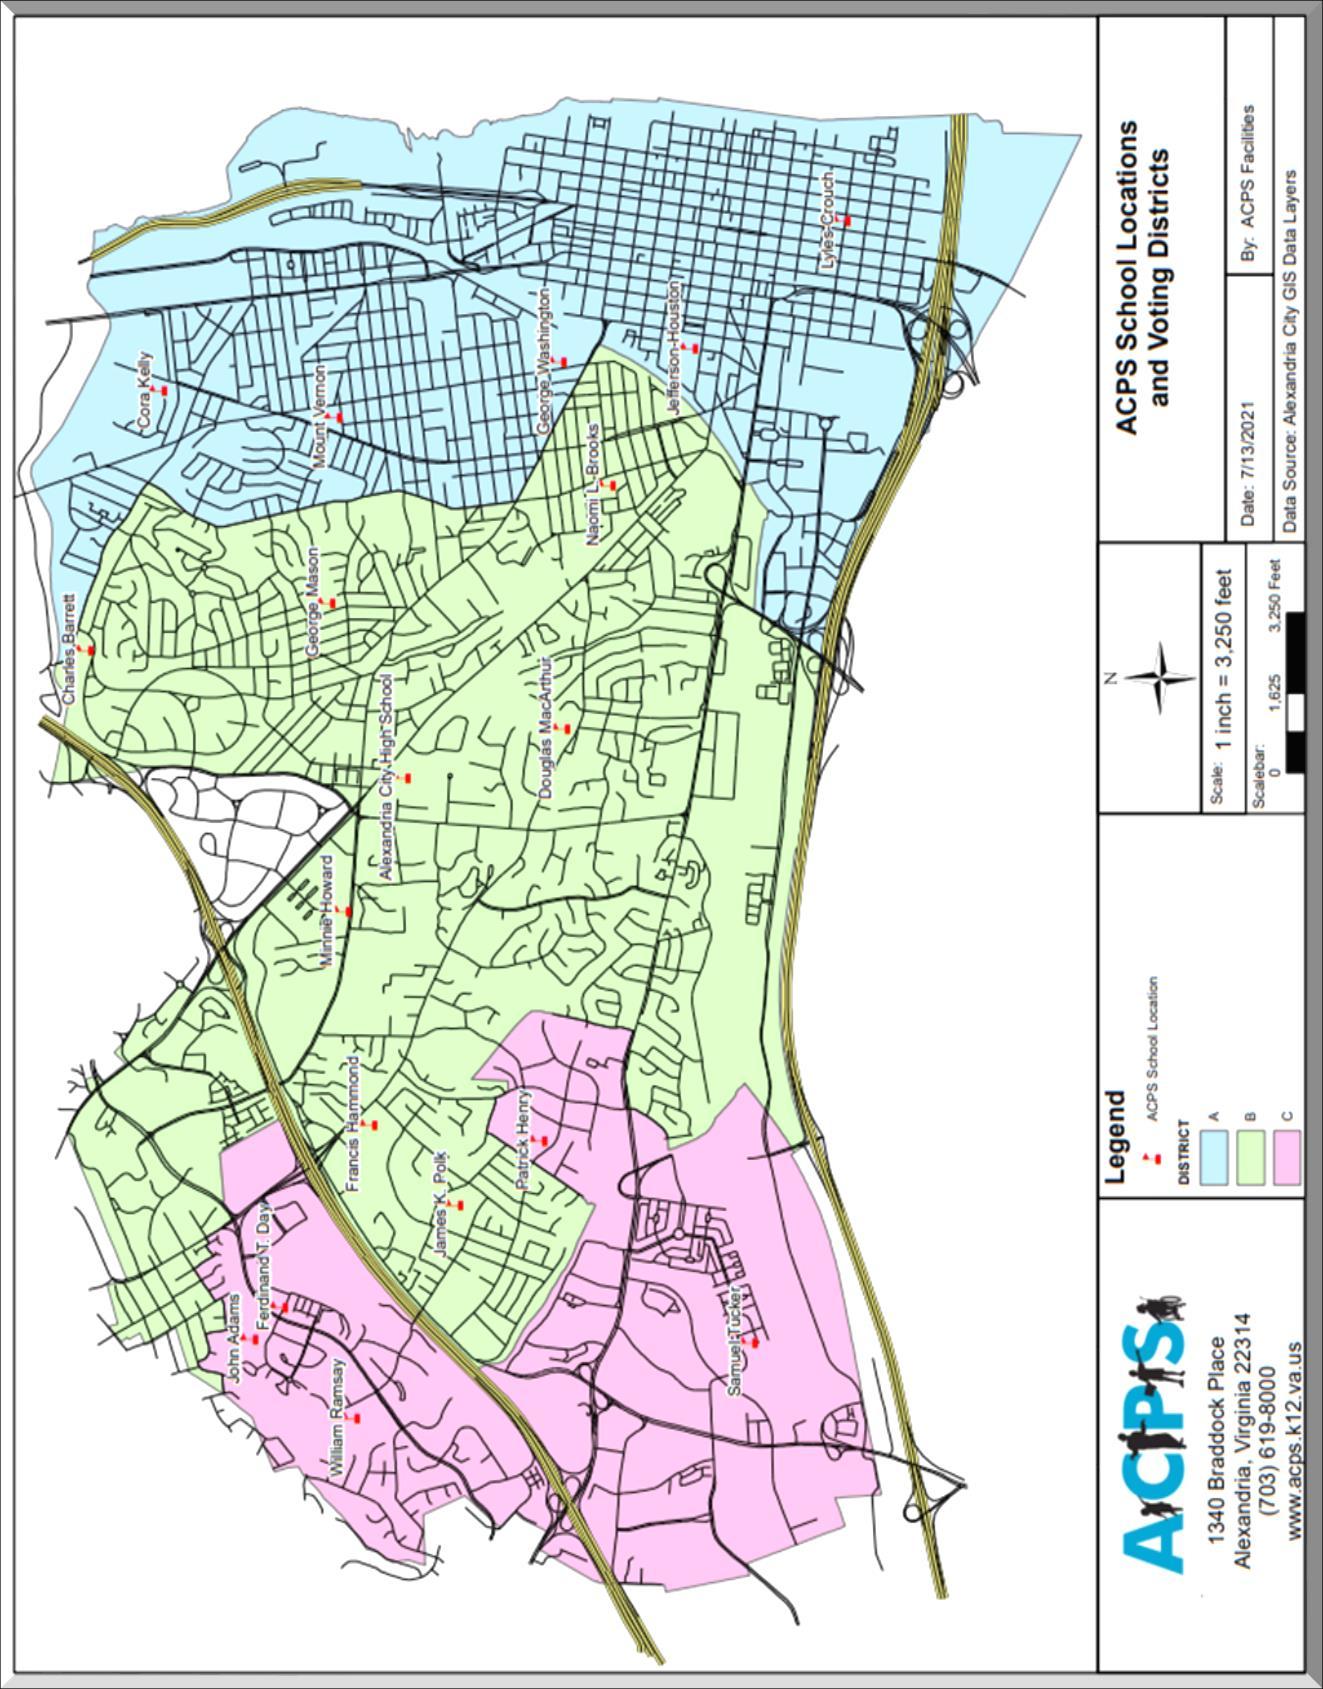
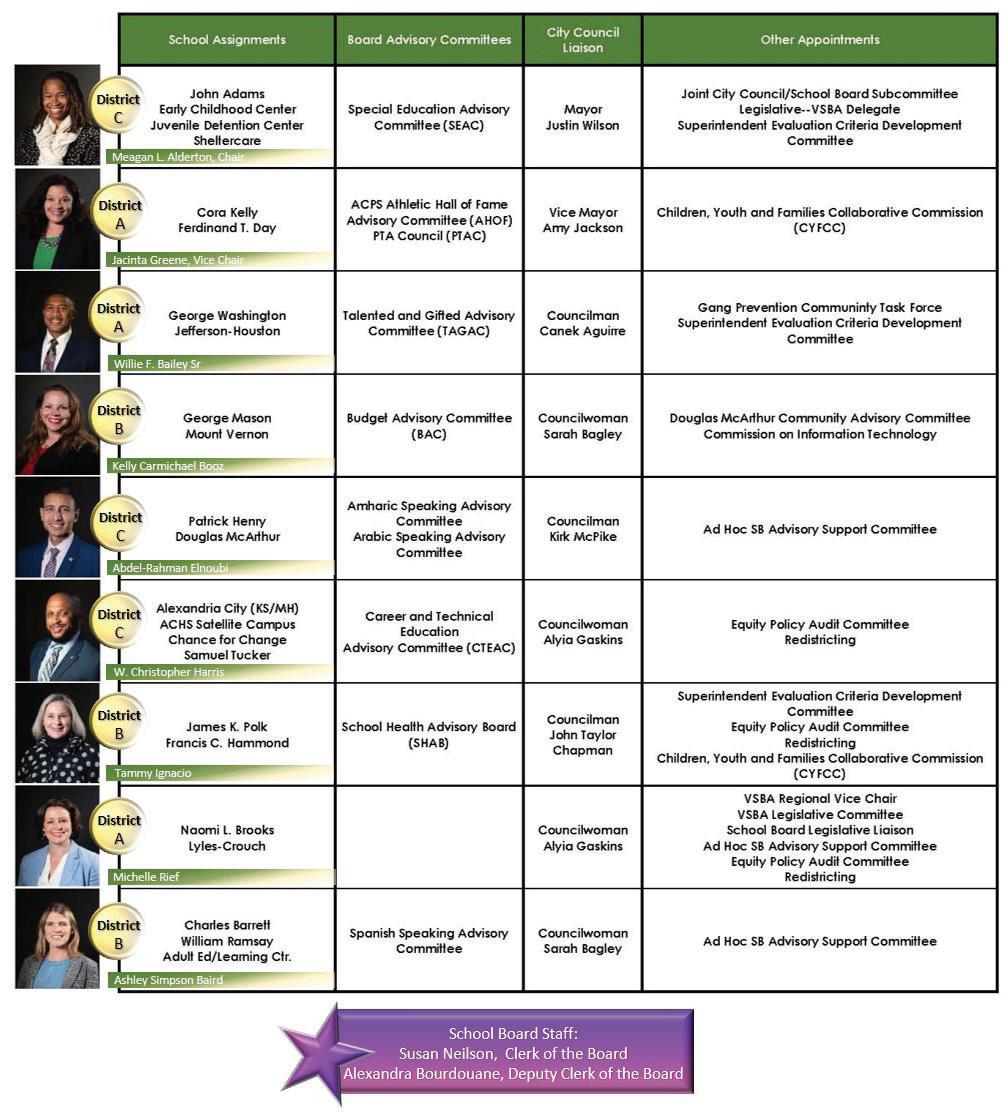
Shown below and on the following pages are the School Board member assignments, division map, organization chart for the division, and list of principals.
Page 27 ACPS FY 2024 Proposed Budget Division Structure
Division Structure
Page 28 ACPS FY 2024 Proposed Budget Division Structure

Page 29 ACPS FY 2024 Proposed Budget Division Structure
n n n n n n n n n n n n n n n n n n John Adams Cora Kelly Mount Vernon Lyles-Crouch George Mason Patrick Henry Minnie Howard James K. Polk Samuel Tucker William Ramsay Francis Hammond Naomi L. Brooks Charles Barrett Ferdinand T. Day Jefferson-Houston Douglas MacArthur George Washington Alexandria City High School Data Source: Alexandria City GIS Data Layers Legend n ACPS School Location DISTRICT A B C ACPS School Locations and Voting Districts Date: 7/13/2021By: ACPS Facilities 1340 Braddock Place Alexandria, Virginia 22314 (703) 619-8000 www.acps.k12.va.us Ü 01,6253,250Feet 1 inch = 3,250 feet Scale: Scalebar:
Division Structure
Division Structure
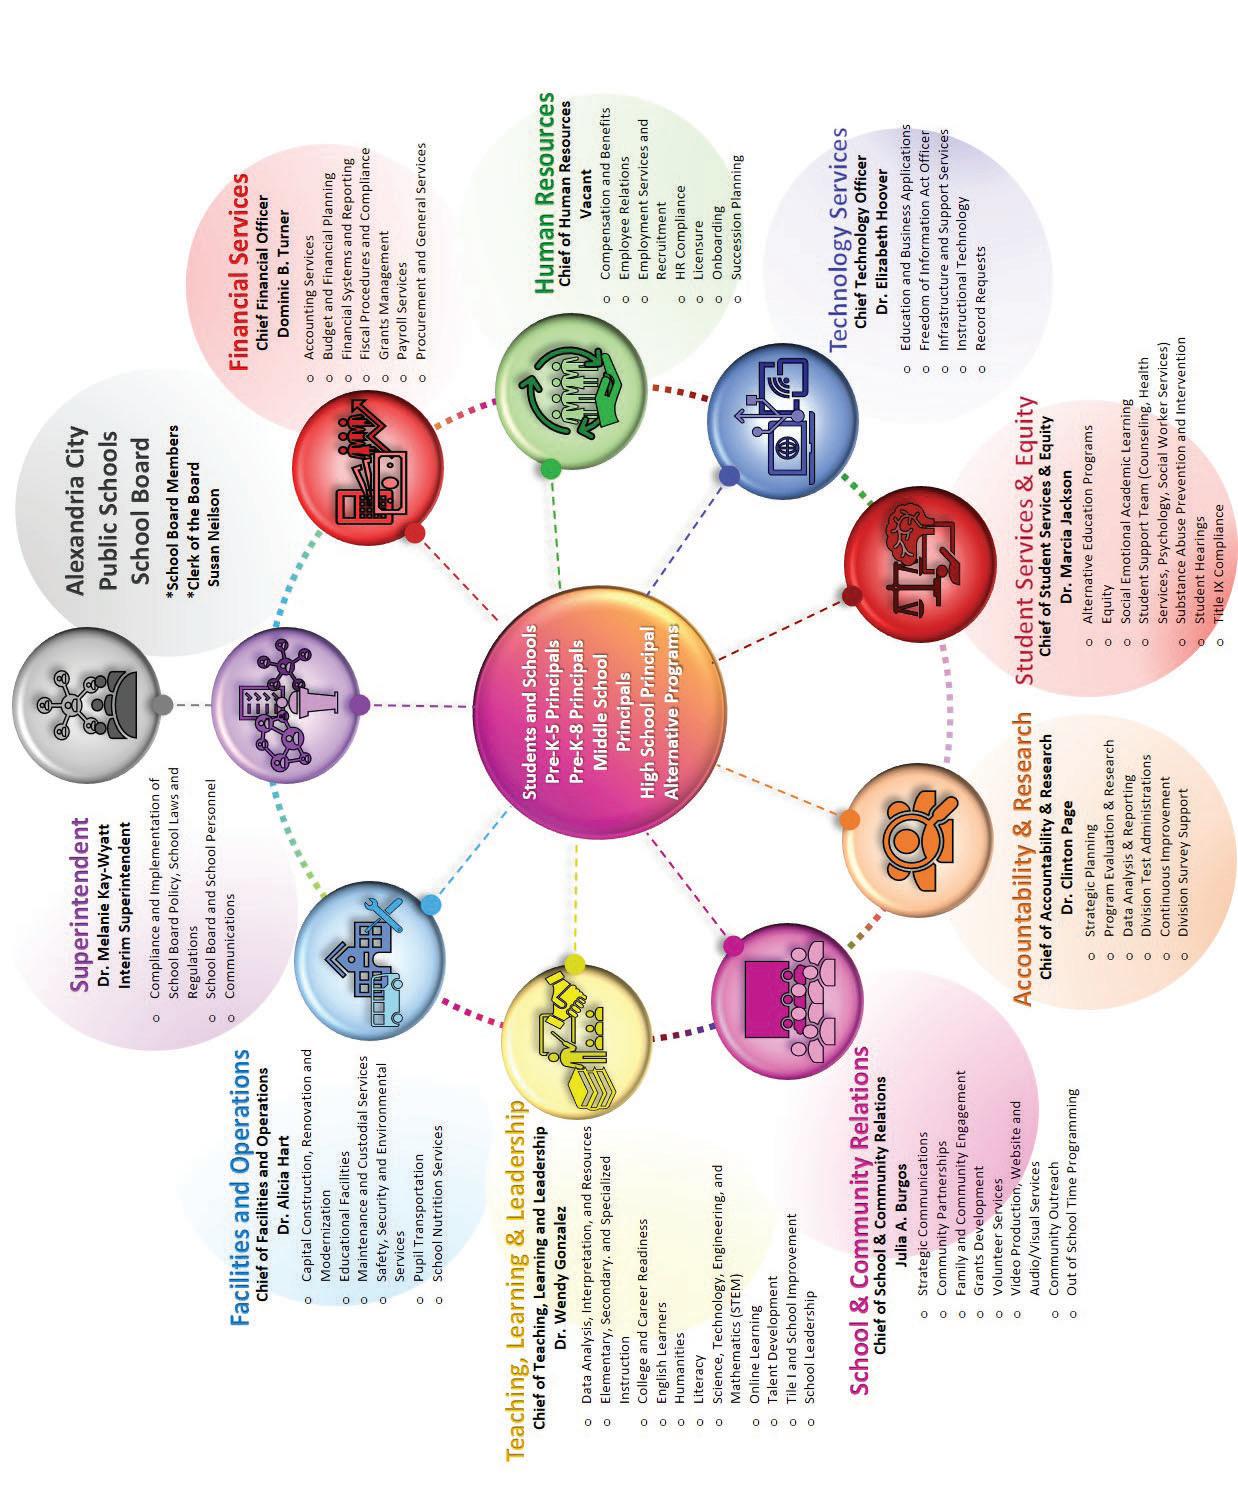
Page 30 ACPS FY 2024 Proposed Budget Division Structure
Division Structure
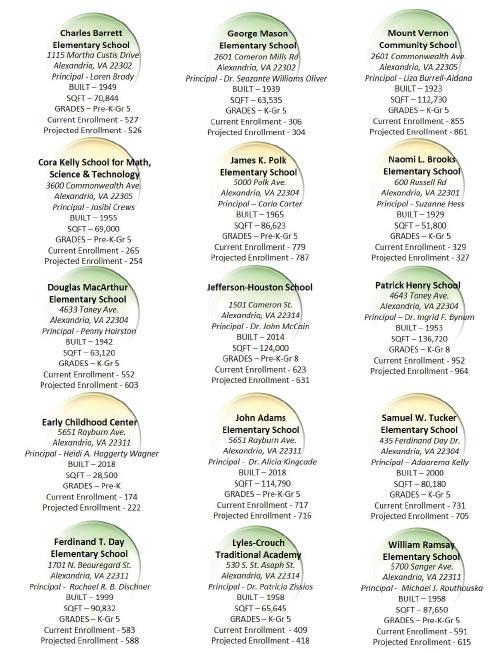
Page 31 ACPS FY 2024 Proposed Budget Division Structure
Division Structure
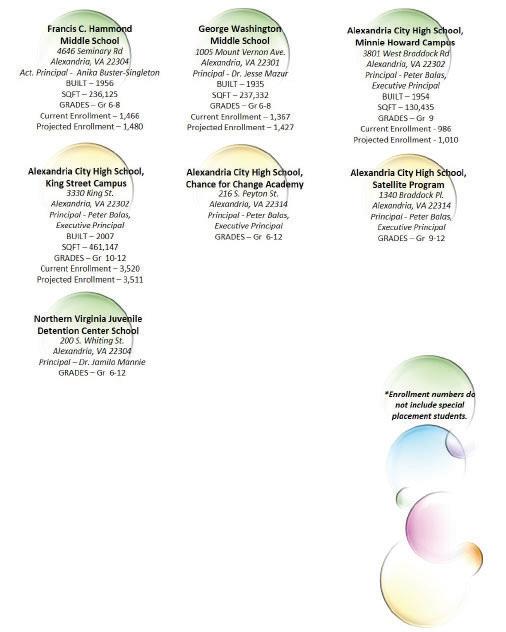
Page 32 ACPS FY 2024 Proposed Budget Division Structure
Strategic Plan
ACPS Strategic Planning and Budgeting
Alexandria City Public Schools has pledged to provide an equitable, high quality education which is accessible and engaging to all students in a five-year strategic plan approved by the Alexandria City School Board on June 26, 2020.
Equity For All 2025 is a bold and courageous roadmap that is timely and will position ACPS as a national leader in redefining PreK-12 education as a deliberately inclusive and supportive experience where all succeed. Going forward, racial equity will be at the center of every decision that the school division will make.
Budget planning requires the active involvement from school and department staff. ACPS is committed to fostering inclusive budget discussions centered on student achievement. For the first time in the history of ACPS, the strategic planning process was aligned with the planning process for multiple citywide departments and organizations with the goal of ensuring that City and school plans have shared goals and outcomes. This Unified Planning Team included the Department of Community and Human Services’ Children and Youth Master Plan (CYMP), and the Alexandria Health Department and the Partnership for a Healthier Alexandria’s Community Health Improvement Plan (CHIP).
These organizations embraced a shared understanding of racial equity and kept that principle at the heart of all decision making. The key focus areas of the Unified Planning Team are racial equity, developmental assets and a trauma-informed approach. They aim to add value through collective community engagement, the sharing of data, and a focus on joint outcomes.
The development of the ACPS 2025 Strategic Plan, guided by ACPS’ consultant FourPoint Education Partners, has taken more than a
year of collaboration and engagement involving a Strategic Planning Committee consisting of ACPS staff from every school, students, parents and representation from key community groups across Alexandria.
School Board Budget Goals
Each of the five goals for the strategic plan has a number of measures that will help us track and report progress in achieving the goal. Key Performance Indicators (KPIs) define the key overall outcomes that an organization is trying to achieve. They answer the question of what success looks like and how will we know if we are progressing toward the intended outcome. As an educational organization, within ACPS all KPIs are student outcomes.
In addition to measures, each goal also has a number of strategies and highlighted actions, which outline the steps that ACPS will take to achieve its goals.
Alexandria prides itself on being a concerned, caring and engaged community — one which works collaboratively for the benefit of those who live here and the larger public interests. Alexandrians view themselves individually but also, as part of this larger collective wishing to improve the lives of all who live in the city.
In 2019, the “perfect storm” of opportunity presented itself when the timing of revisions to three major city-related plans coincided — the Alexandria City Public Schools’ Strategic Plan, the Department of Community and Human Services’ Children and Youth Master Plan (CYMP), and the Alexandria Health Department and the Partnership for a Healthier Alexandria’s Community Health Improvement Plan (CHIP). These organizations established a Unified Planning Team in the spring of 2019 and found partnering to develop their plans collectively provided added value to each through the opportunity to maximize collective community engagement, use and focus on the most important data, and focus on shared outcomes.
Page 33 ACPS FY 2024 Proposed Budget Strategic Plan
Strategic Plan

The result of working together, instead of in isolation, should prove beneficial to all in Alexandria and serve as a model for future efforts in our community.
While developing these plans is important, implementing them successfully is even more important. As a result, the Unified Planning Team will evolve into a Unified Implementation Team to continue the partnership during implementation of these plans over the next
five years and continue to ensure alignment of actions, collective community engagement, use of data, and sharing of resources, when possible.
Shown above and in the following page is a summary of the ACPS Strategic Plan 2025: Equity for All. For the full 2025 Strategic Plan: Equity for All, please visit https://www.acps. k12.va.us/cms/lib/VA01918616/Centricity/ Domain/1330/2025-strategic-plan.pdf.
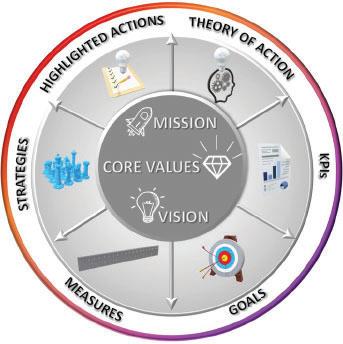


Page 34 ACPS FY 2024 Proposed Budget Strategic Plan
Strategic Plan
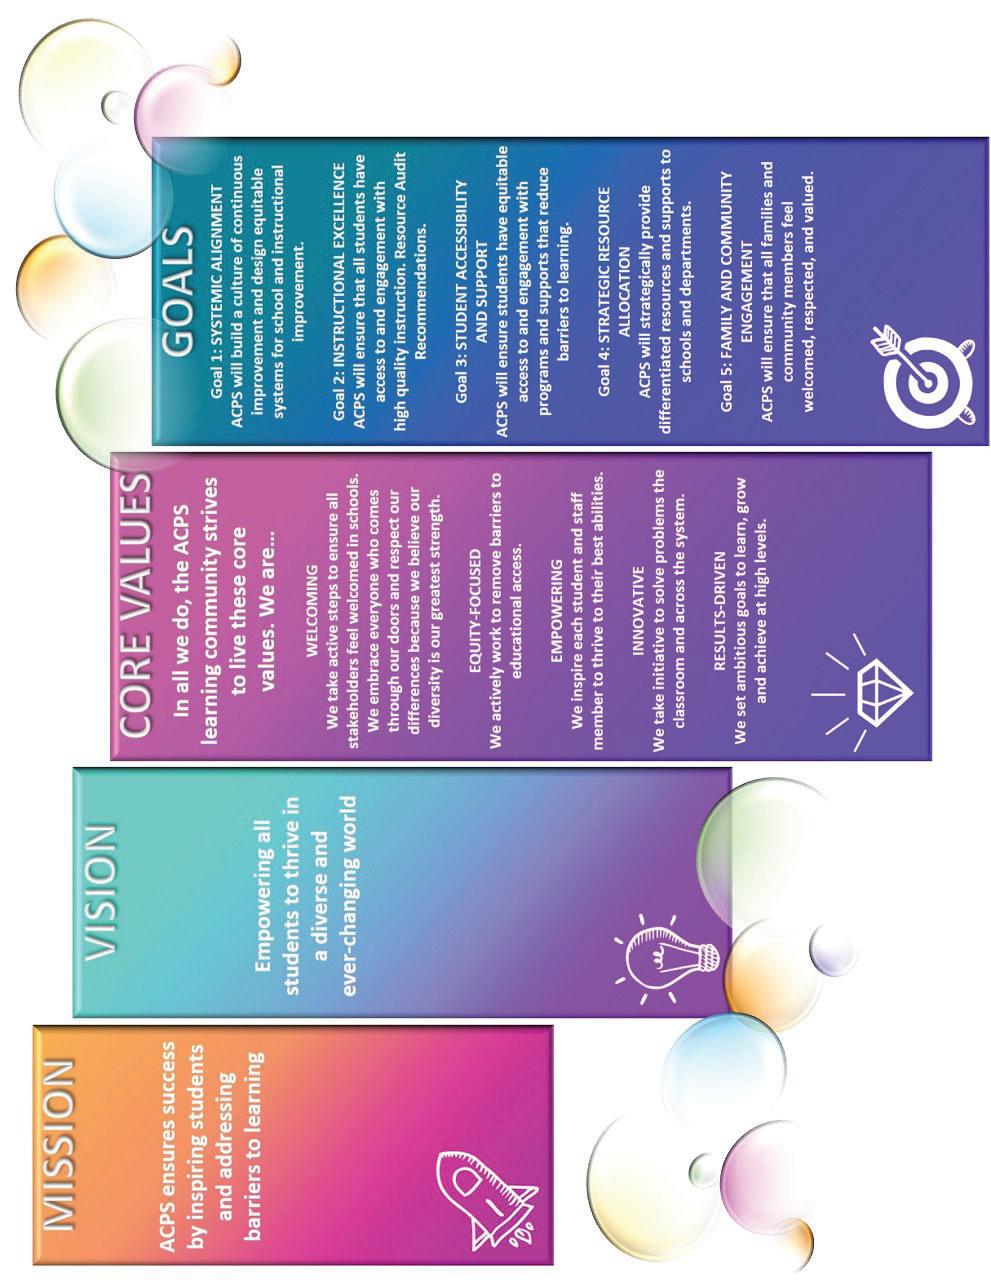
Page 35 ACPS FY 2024 Proposed Budget Strategic Plan
Budget Priorities and Investment Areas
Budget Priorities and Investment Areas
Budget PrioritiesInvestment Areas with Funding Examples
• Increased ESY services
• Increased technological services for adaptive equipment and devices.

Funding Example: $294K (Staff Development services/trainings for the Multiple Disabilities program and their staff members, ACPS technological special adaptive devices and other equipment for students with disabilities (SWD),ESY services for students with disabilities. This level of staffing is necessary to serve this severely involved student population)
• Textbooks, instructional supplies, and testing material
• TAG program assessment and staffing
* Full Implementation of Students with Disabilities Action Plan
ACPS 2025 Strategic Plan Goals
Funding Example: $112K (Staff development and increases in staff training specializing in decreasing access gaps, twice-exceptional, and servicing EL learners, Updating the service mode and purchasing more culturally responsive materials, Curriculum developers training staff (consultant fees), outside gifted researchers specializing in decreasing access gaps, twiceexceptional, and servicing EL learners)
• Continue emphasis on programs targeting absenteeism

• Special Education, EL, an d school counselor staffing


• Intervention funds
Funding Example: $302K (Student achievement subject matter expert consultants; Multi-tiered system of support, Replacement Classroom Texts, Travel for conferences aimed at staff development to refine instructional skills aimed at student socio-emotional learning and engagement)
*Reduce Class Sizes
Goal 1: Systemic Alignment:

ACPS will build a culture of continuous improvement and design equitable systems for school and instructional improvement.
Goal 2: Instructional Excellence:
*K-4 Literacy
*Target Chronic Absenteeism
ACPS will ensure that all students have access to and engagement with high-quality instruction.
* Restorative Practices Supports
Goal 3: Student Acces sibility and Support:
ACPS will ensure students have equitable access to and engagement with programs and supports that reduce barriers to learning.
• Additional resources for Social Emotional Academic Learning (SEAL) support including
*Develop plan and policy for Collective Bargaining
materials and supplies
• Staff salary increases (STEP)
* Target planned compensation enhancements and staff retention efforts
Goal 4: Strategic Resource Allocation:
Funding Example: $8.72M (Step increases to urge retention, City wide autism classroom materials and supplies for the emotional disabilities program, Materials and supplies purchases for the emotional disabilities program and their students)
* Increase support for Social and Emotional Learning
ACPS will strategically provide differentiated resources and supports to schools and departments.
• Family and Community Engagement Meetings
• Meetings and workshops in support of safe route analysis

Funding Example: $40K (Early Identification Program Internal Transportation Cost. ACPS busing for Saturday Power Aid sessions from ACHS to GMU campus, along with Strengthening the Family workshops twice a year, and three weeks of summer transportation for programming included in the contract with EIP and OSHA training related to school safety routes)
*Safe Routes to School coordination
Goal 5: Family and Community Engagement:
ACPS will ensure that all families and community members feel welcomed, respected, and valued.

Page 36 ACPS FY 2024 Proposed Budget Strategic Plan
Budget and Financial Management
FY 2024 Budget Calendar
The ACPS fiscal year runs from July 1 through June 30, and corresponds to those of the City of Alexandria and the Commonwealth of Virginia. ACPS is a fiscally-dependent entity and, therefore, has a budget cycle that is driven by statutory deadlines from the city and state.
July to Sept. 2022: ACPS financial staff close out FY 2022 and begin FY 2023 financial operations.
Staff members analyze FY 2022 actual expenditures vs FY 2023 budget variances to prepare for FY 2024 budget development.
Planning for the FY 2024-2033 Capital Improvement Program (CIP) begins.
Sept. to Nov. 2022: Department staff prepare FY 2024 budget submissions. Budget Office staff members compile and review FY 2024 budget requests and prepare compensation and benefit data for FY 2024 based on FY 2023 compensation as of September 30, 2022. Compensation estimates are not available until after the first payroll in mid-September because the majority of ACPS teacher contracts do not begin until September. The most recent health insurance enrollment data and retiree health benefit data are collected and analyzed.
Enrollment projections are prepared based on the state September 30 Student Membership Report. Formula-driven staffing calculations for elementary schools are prepared based on these enrollment projections. The FY 20242033 Proposed CIP Budget is prepared.
Nov. to Dec. 2022: The Superintendent and Executive Leadership Team review all funding requests.
Nov. 10, 2022: Presentation of the Proposed FY 2024-2033 CIP Budget.
Dec. 2022: ACPS financial staff prepare the FY 2024 Combined Funds Budget by developing proposed budget numbers and generating reports. The School Board considers the CIP Budget and discusses details during budget work sessions.
Dec. 15, 2022: The School Board adopts the FY 2024-2033 Approved CIP Budget.
Jan. 5, 2023: The Superintendent presents the FY 2024 Combined Funds Budget to the School Board. Copies of the proposed budgets are distributed and are posted on the ACPS website.
Jan. to Feb. 2023: School Board members, staff, and the community review and discuss the proposed budget. Budget work sessions, public hearings, and add-delete work sessions are held throughout this period.
Budget staff prepares and disseminates responses to budget questions from Board members and the community.
Feb. 16, 2023: The School Board adopts the FY 2023 Approved Combined Funds Budget.
Feb. 28, 2023: The City Manager presents the City of Alexandria’s FY 2024 Budget.
Mar. to Apr. 2023: The City Council and community review and discuss the City Manager’s budget, including the city appropriation to schools and the ACPS Capital Improvement Program Budget. City Council holds public hearings and work sessions and advertises the maximum tax rate for the new fiscal year. In addition, City Council and the School Board hold a joint budget work session.
April 2023: The City Council adopts the tax rate, FY 2024 General Fund, and FY 2024-2033 CIP Budgets, including the final appropriation to schools.
June 1, 2023: The School Board adopts the FY
Page 37 ACPS FY 2024 Proposed Budget Budget and Financial Management
Budget and Financial Management
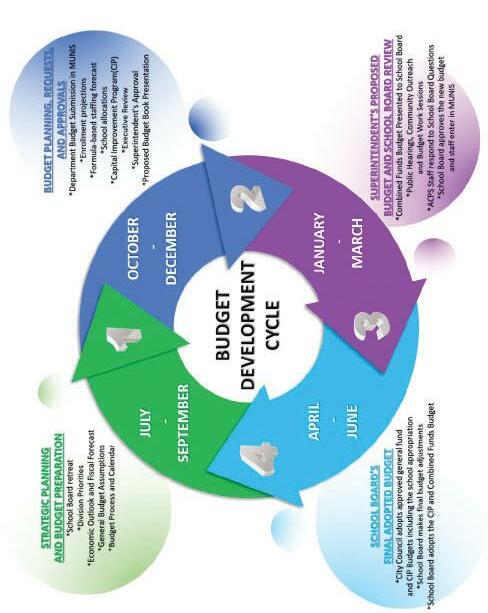
Page 38 ACPS FY 2024 Proposed Budget Budget and Financial Management
Budget Development Cycle
Budget and Financial Management

2024 Final Combined Funds Budget and the FY 2024-2033 Final CIP Budget.
June to Sept. 2023: Financial staff prepares reports and budget documents and makes these available to principals and department heads.
The School Board holds its first public hearing on the FY 2025 Proposed Combined Funds Budget and FY 2025-2034 CIP Budget.
Staff closes FY 2023, which ends June 30, 2023, and prepares for the annual financial audit. Staff analyzes FY 2023 grant balances, estimates carry-over for use in FY 2024, and loads data into the financial system/database.
The budget calendar table can be found in the Executive Summary section.
Budget Process
The budget is a resource-allocation and policy document. It incorporates the best estimate of the school division’s revenues and expenditures for the next fiscal year based on a snapshot of current fiscal year revenues and expenditures. These estimates are modified to reflect changes in plans, priorities, and trends in enrollment, as well as the economic environment.
The Code of Virginia requires each school Superintendent to prepare a budget that estimates the amount of money needed during the coming year to support public schools. It is then the responsibility of the School Board to balance the needs of the school division with the considerations of the economic and political environment.
The budget provides a framework for measuring and monitoring expenditures. Throughout the year, actual spending is compared with the budget in each organizational and programmatic area. This comparison provides a measure of effectiveness and helps to ensure that funds are used for their intended purpose.
Planning Activities in ACPS
The ACPS 2025: Equity for All Strategic Plan is the foundation document for all the actions of the school division. It directs the actions the division takes in meeting the goals and aspirations of the Alexandria community and guides the activities of employees and leaders as well as the expenditure of all funds entrusted to the School Board. The Strategic Plan informs the development of the Board Budget Priorities, the School Improvement Plans and the Department’s Improvement Plans, all of which provide a framework for the school division’s operations. The annual budget process quantifies the resources needed to carry out these plans.
Key Elements of the ACPS Planning Process
• Strategic plan
• Board budget priorities
• School and departmental improvement plans
• Student and school achievement data
• Operating cost trend analyses
• Parent and community input
• Capital Improvement Program budget
• Current fiscal year budget
• Grant or program-specific plans
Major planning activities in ACPS are as follows:
• In June 2020, the School Board adopted ACPS 2025: Equity for All Strategic Plan, a comprehensive strategic plan for fiscal years 2021-2025. The full 2021-2025 strategic plan can be found earlier in this section.
• All school principals have prepared improvement plans congruent with the goals and objectives of the current strategic plan.
• All department leaders have created department’s improvement plans congruent
Page 39 ACPS FY 2024 Proposed Budget Budget and Financial Management
Budget and Financial Management
with the goals and objectives of the strategic plan.
• The School Board adopts a Combined Funds budget annually that reflects ongoing programs as well as initiatives for the following year.
• School professional learning community staff, in collaboration with central office staff from the Departments of Teaching, Learning and Leadership and Accountability, analyze student and school achievement data on a regular basis.
• The standards of accreditation requirements and other student test and achievement data provide the framework for the school planning process.
• Analyses of trends that affect ACPS costs and operations are conducted regularly in a variety of areas.
• School Board advisory committees work regularly with staff to provide input and feedback on ACPS operations and report annually to the School Board. These committees include: the Athletic Hall of Fame Committee; the Budget Advisory Committee; the Career and Technical Education Advisory Committee; the School Health Advisory Board; the Special Education Advisory Committee; and, the Talented and Gifted Advisory Committee.
• The Superintendent receives planning input from a variety of advisory groups, such as the Education Association of Alexandria (EAA), the Superintendent’s Student Leadership Council, and the Teachers Advisory Council.
• The School Board adopts a Capital Improvement Program (CIP) budget annually, that provides a 10-year prioritized plan for major facility changes.
• In addition to division-wide plans such as the annual budget, there are many subsidiary areas that require detailed plans. The Commonwealth of Virginia requires plans for talented and gifted, career and technical, technology, and adult education programs. Division plans, including special education, are impacted by the federal entitlement grant process which requires comprehensive planning.
• Public hearings related to the Combined Funds and Capital Improvement Program Budgets are held every year and provide the opportunity for community input. Additional information on public hearings can be found on the ACPS webpage https://www.acps.
k12.va.us/Page/3266
Page 40 ACPS FY 2024 Proposed Budget Budget and Financial Management
Budget and Financial Management
Financial Policies and Practices
Budget Structure
All budgets are developed using a variety of assumptions based on future expectations. Funding decisions also reflect policies of the School Board.
Public sector budgets are governed by accounting and reporting requirements established by the Governmental Accounting Standards Board (GASB) and by generally accepted accounting principles (GAAP). The ACPS budget structure is consistent with these requirements.
The budget is divided into three major funds, each of which is grouped by related accounts used to maintain control over resources earmarked for specific activities or objectives. The funds in the ACPS budget include:
• Operating Fund: This fund is comprised of the school division’s primary revenue sources, including appropriations from the City of Alexandria, revenue from the Commonwealth of Virginia, selected federal sources and miscellaneous local fees, as well as the expenditures charged against these revenues. The Operating Fund accounts for 91.9 percent of ACPS revenue in the FY 2024 Budget.
• School Nutrition Fund: Local, state, and federal revenue as well as expenditures for the operation of all school food service activities are accounted for in this fund. The School Nutrition Fund accounts for 3.6 percent of ACPS revenue in the FY 2024 Budget.
• Grants and Special Projects Fund: Entitlement and competitive grant monies are accounted for in this fund. Budgeted here are federal funds from the Individuals with Disabilities Education Act (IDEA),
various entitlement programs of the Elementary and Secondary Education Act (ESEA), as well as other smaller entitlement monies and competitive grants. The Grants and Special Projects Fund accounts for 4.5 percent of ACPS revenue in the FY 2024 Budget.
The School Board is responsible for establishing policy for the governance and operation of ACPS. These policies and practices are aligned with the Code of Virginia and best practices as recommended by the Government Finance Officers Association (GFOA) and the Association of School Business Officials (ASBO). They provide a consistent framework for the budget process, long-term school division planning and decision-making regarding the use and allocation of resources. These policies and practices are developed by staff, presented to the School Board and reviewed each year during the budget process.
The following pages summarize the major accounting, budget, and financial policies and practices used to develop long-term, multi-year financial plans and the annual budget. These practices also guide the management of school division funds throughout the year.
Financial Management Financial Planning
The Superintendent or designee shall be responsible for administering the division budget in accordance with School Board policies and applicable state and federal laws and regulations; therefore, the Superintendent or designee will use appropriate fiscal planning and management methods, modeled after the best-accepted business practices and directed toward the educational goals of the division. The following addresses both the fundamental principle of a balanced budget and long-range financial planning.
Page 41 ACPS FY 2024 Proposed Budget Budget and Financial Management
Budget and Financial Management
Balanced Budget: Each fiscal year, the Superintendent, with input from staff and the community, shall prepare, with approval of the School Board and submit to the appropriating body, an estimate of the amount of money needed during the next fiscal year for the support of the public schools of the division (policy DB). The School Board follows its adopted budget process to offer and review adjustments to the Superintendent’s proposed budget in order to arrive at the final, Boardapproved budget.
Under the Code of Virginia, School Boards are mandated to adopt a balanced budget which means projected revenues plus beginning fund balance must fully cover total estimated expenditures. A budgeted surplus at the fund level is also considered a balanced budget.
Long-Range Financial Planning: Prior to approving the annual budget, the School Board reviews the five-year budget forecast and the long-term financial implications of current and proposed operating and capital budgets. Each year, as a part of the budget process, ACPS staff develop and present a five-year fiscal forecast with varying revenue and expenditure assumptions to facilitate informed decision making. With approximately 82 percent of Operating Fund revenue derived from the City appropriation, assumptions regarding the City’s revenue growth and the resulting increase or decrease in the City appropriation drive forecast results. Similarly for expenditures, salaries and benefits comprise of approximately 88 percent of total Operating Fund expenditures and assumptions related to salary increases, as well as the growth of healthcare and retirement costs, also drive forecast results.
Revenues
The majority of revenue received by ACPS derives from our city appropriation with a small percentage collected from local revenue. Local revenue includes, but is not limited to, rental and custodial fees, summer school/intersession
tuition, and indirect costs. Additional information can be found in the Financials section.
To enhance revenue streams, promote fiscal stability, and ensure prudent financial planning, ACPS follows these guidelines:
Use of One-time Revenues: The use of onetime revenues for recurring expenditures is discouraged.
Revenue Diversification: To improve the ability to handle fluctuations in revenue sources and still provide quality instructional programs, diversification of revenue sources through grant opportunities, fund-raising, public/private partnerships, and other sources is encouraged.
Expenditures
ACPS strives to ensure prudent expenditure planning, fiscal accountability, and transparency.
Debt Policy: The school division is fiscally dependent on the City of Alexandria and not permitted to incur long-term debt.
Reserve Policy: The school division maintains three reserves to protect the division during times of revenue shortfalls and/or unpredicted, one-time expenditures:
• The Staffing Reserve is allocated by the Superintendent to relieve critical staffing needs arising from unanticipated enrollment growth or other changes in the student population.
• The Enrollment Adjustment Reserve is used to adjust the base allocation for schools when the actual September enrollment significantly exceeds the projected enrollment in the final budget. This reserve may be used to cover necessary, unforeseen expenditures.
• The Health Benefits Reserve is maintained to protect ACPS from unanticipated spikes
Page 42 ACPS FY 2024 Proposed Budget Budget and Financial Management
Budget and Financial Management
in health care costs for medical and dental benefits, particularly the self-insured plan. This reserve is funded by contributions from ACPS and its employees.
The School Board establishes the size of all reserves as part of the budget process. The reserves of the City of Alexandria also are available to the division.
Salary Adjustments
All adjustments to ACPS salary scales are subject to School Board approval and are generally part of the normal budget development process for the subsequent fiscal year.
ACPS has four salary scales:
• The Support Scale is for instructional assistants, clerical, technical, bus driver, custodial, and financial support staff
• The Licensed Administrative Scale is primarily for licensed administrators in schools and departments. These include principals, assistant principals, and instructional department leadership positions.
• The Support Administrator scale is for leadership and specialized, technical positions in the support departments.
• The Professional Scale is for all teachers and other licensed staff such as school counselors, library media specialists, nurses, social workers, and psychologists.
Position Control
A position is defined as the authorization to hire an employee with full benefits. No position should be filled until it has been properly authorized and approved. Schools and departments are permitted to change budgeted positions, subject to Superintendent approval, as long as the change is aligned with
the education plan and the changing needs of students. All position changes are reported as part of the budget cycle, through the preparation or approval of the subsequent fiscal year’s budget.
Requests for new positions that result in an increase to FTEs must be approved by the School Board. Grant-funded positions may be added during the year when additional grant monies are awarded outside of the budget cycle. Changes in grant-funded position allocations are subject to the approval of the Superintendent, if not specifically directed by the grantor.
Modified Zero-Based Budgeting
For FY 2024, all departments prepared their budgets using the modified zero-based budgeting (MZBB) methodology which requires staff to scrutinize each line item and build their budget from the ground up. MZBB is difficult to administer for schools because many of their resources are determined by formula (e.g. core teaching staff, funds for supplies and stipends). For this reason, the standard budgeting process for school principals focuses on activities linked to the strategic plan.
Expenditure Controls
The official ACPS budget document is a means to formulate the planning and resource allocation for the school division. It also serves as the primary vehicle to inform Alexandria residents and the community at-large about the mission, strategic plan, and priorities of the school division. After the School Board adopts the final budget in June, it becomes the primary financial management tool for administering, controlling, and monitoring the expenditures.
The budget is controlled at both legal and administrative levels. The legal level is placed at the individual fund level, while administrative controls are placed at the office and school level within each fund.
Page 43 ACPS FY 2024 Proposed Budget Budget and Financial Management
Budget and Financial Management
Certain portions of the budget are administered and controlled centrally. Budgeting and monitoring of all full-time salary accounts and employee benefits are handled through a collaboration of the Financial Services and Human Resources Departments. Purchased services, internal services, other charges, materials and supplies, and capital outlay are managed at the local office and school level within guidelines developed in accordance with the Virginia Public Procurement Act (VPPA) and School Board policies.
School principals, department heads, and program managers are responsible for monitoring the efficient and appropriate use of funds. These leaders are authorized to approve the expenditure of funds within their respective school, office or program in accordance with ACPS procurement procedures and other legal requirements. Most non-compensation expenditures are done via purchase order. ACPS purchasing guidelines require that, prior to approval and processing, all purchase orders be verified for availability of funds and appropriate contracting authority.
The Procurement Office ensures all orders and purchases comply with legal purchasing regulations. This is the only office authorized by the School Board to approve all bid awards and contracts. It is the responsibility of each school principal, department head, and program manager to regularly and carefully monitor and control expenditures, thus ensuring proper use of public funds and avoiding expenditures beyond the authorized budget.
Unspent balances in the regular (contracted position) salary and benefit accounts are reviewed by the Financial Services Department’s Budget Office. Any savings from these accounts accrue to the division as a whole and not to any specific department.
Budget Amendment
The School Board reviews the budget each month and formally amends the budget
once a year during the spring. The Financial Services Department prepares the budget analysis, evaluates all revenue and expenditure accounts, and recommends amendments.
Transfers Between Budget Accounts
Because needs and plans may change between approval of the final budget and the ending of the school year, principals, department heads, and program managers have the flexibility to request reallocation of budget funds up to $25,000 throughout the fiscal year. Any transfer request exceeding $25,000 must be approved by the Superintendent. System controls on the transfer of funds ensure expenditures do not exceed total available financial resources and that expenditure guidelines are enforced. Any budget amendment that leads to an increase or decrease of the total Operating Fund requires School Board approval. Additionally, staff must submit a monthly report to the Board detailing all budget transfers in the Operating, School Nutrition, and Grants and Special Projects Funds when such transfers are equal to or greater than $25,000. The capital program requires School Board approval for transfers greater than $50,000 that cross major project categories and/or sites/locations as defined in the adopted CIP Budget (policy DA).
Appropriation Control and Encumbrance Accounting
Another important component of the ACPS financial control and reporting system is the use of encumbrance accounting. All non-payroll expenditures – purchase orders, contracts, or other monetary commitments – must have funds set aside or encumbered to ensure funds will be available when payment is due. The encumbrance accounting process is used as an extension of formal budgetary control. It is an important financial planning tool and a control measure to prevent inadvertent overexpenditure of budget appropriations due to lack of information about future commitments.
Page 44 ACPS FY 2024 Proposed Budget Budget and Financial Management
Budget and Financial Management
Encumbrances outstanding at year end in the Operating Fund are reported as assignments of fund balance and do not constitute expenditures or liabilities of the current year because the commitments will be honored during the subsequent year. The year-end encumbrances represent the estimated amount of contractual obligations for goods or services in the current year that will be received and paid in the following year. Funding for all encumbered appropriations is re-appropriated at the beginning of the new fiscal year.
Financial Information and Reporting
Financial reports are made available monthly to the School Board, schools, departments, and programs for monitoring purposes. The School Board reviews and approves a monthly financial report for all funds, which includes the revenues and expenditures at the major object level. The monthly financial report to the School Board also shows the changes in revenue and expenditure appropriations that have occurred since the budget was approved.
Monthly detail and summary reports of all expenditures in miscellaneous salary accounts and all non-personnel accounts are reviewed by the Financial Services staff.
Grant financial reports are prepared subject to the detailed grant management requirements from the granting agency.
The Commonwealth of Virginia also has a number of reporting requirements, including the Annual School Financial Report for all division expenditures and program specific reports such as homebound teacher costs. ACPS complies with all reporting requirements as mandated by the state, grantors, and other legal entities.
Basis of Presentation – Fund Accounting
Governmental resources are allocated and accounted for in individual funds based on the purpose and the means by which spending activities are controlled. ACPS uses funds
to maintain its financial records during the fiscal year. Fund accounting is designed to demonstrate legal compliance and to aid management by segregating transactions related to certain ACPS functions and activities. ACPS accounts are organized on the basis of funds, each of which is considered a separate accounting and budgetary entity. The operations of each fund are accounted for in a separate set of self-balancing accounts that constitute its assets, liabilities, fund equity, revenues and expenditures or expenses.
Basis of Accounting
All governmental funds are reported using a flow of current financial resources measurement focus and the modified accrual basis of accounting. ACPS’ primary sources of revenue are funds appropriated by other governmental units. Accordingly, most revenues are considered to be available at the time they are appropriated. For certain types of revenue, availability is determined to be 360 days from the end of the current fiscal year. Governmental fund expenditures are recognized when the liability is incurred.
All proprietary and trust funds follow the accrual basis of accounting. These funds are accounted for on a flow of economic resources measurement focus. With this measurement focus, all assets and all liabilities associated with the operation of these funds are included on the balance sheet. Proprietary fund equity (i.e., total net position) is segregated based upon the accessibility of the underlying resources; net investment in capital assets, restricted and unrestricted. Proprietary fundtype operating statements present increases (e.g., revenue) and decreases (e.g., expenses) in total net position.
Budgetary Basis
Annual budgets are adopted for all governmental funds except capital projects. The Capital Improvement Program (CIP) is budgeted on a project-by-project basis that
Page 45 ACPS FY 2024 Proposed Budget Budget and Financial Management
Budget and Financial Management
spans multiple fiscal years for a total of ten years. All budgets are consistent with GASB and GAAP requirements.
Budgetary basis is the same as the basis of accounting -- modified accrual for all governmental funds and accrual for proprietary and trust funds. The budget period is the same as the accounting reporting period, July 1 to June 30. The budget document contains fund statements for all governmental and proprietary funds.
Legal Authority
The ACPS School Board is charged by the Commonwealth of Virginia and the regulations of the Virginia Board of Education with providing and operating the public schools in the City of Alexandria. It is the function of the School Board to set general school policy and, within the framework of Virginia Board of Education regulations, to establish guidelines and rules that will ensure the proper administration of the school program.
The School Board does not have taxation authority. Most operating revenue is derived from local tax dollars appropriated by the city. The remaining revenue is derived from federal, state, and local sources. CIP funds are allocated by the city from a combination of general and bond funds.
Other Budget Issues
Carryover from Prior Fiscal Years: Encumbered carryover is allowed. If the carryover encumbrance exceeds the final payment, the balance of the carryover encumbrance funds are suspended and are not available to be reallocated for spending in the current year.
Centrally Budgeted and Managed Accounts: ACPS budgets and manages a variety of accounts centrally. This is done to make budgeting and position management easier, to improve the efficiency of the purchasing process, or to generate cost savings from bulk
purchases. The accounts managed in this fashion include, but are not limited to:
• Utilities for all buildings
• Building/equipment repair and maintenance
• Custodial and security contract services
• Telephone services
• Technology and facilities equipment
• Leasing of network copier machines
• Textbooks
• Division-wide software and online products
• Selected itinerant and part-time staff (particularly custodians, physical therapists, occupational therapists and speech language pathologists)
• Tuition reimbursement
• School-based temporary help services
• Translation services
• Substitute Teacher paid/unpaid leave
Inventories
Inventories consist of various consumable supplies and commodities maintained by the School Nutrition Services Department. The School Nutrition Fund values and carries its inventory on a cost basis using the weightedaverage method. The purchase method of accounting is used in the governmental funds. Reported inventories in the governmental funds are designated as nonspendable fund balance. Food commodities received from the U.S. Department of Agriculture (USDA) are stated at fair market value and the amount consumed is recognized as revenue.
The amount of unused food commodities is reported as inventory and deferred revenue. ACPS participates in the single food inventory record-keeping system, which allows the combination of USDA commodity and commercial inventory records. This program was approved jointly by the USDA and Commonwealth of Virginia Child Nutrition and Food Distribution Divisions.
Page 46 ACPS FY 2024 Proposed Budget Budget and Financial Management
Budget and Financial Management
Capital Assets
Capital outlays are recorded as expenditures in the governmental funds and as assets in the government-wide financial statements to the extent the ACPS capitalization threshold is met. Capital assets are defined by ACPS as assets with an initial, individual cost of more than $5,000. Major additions, including those that significantly prolong a capital asset’s economic life or expand its usefulness, are capitalized. Normal repairs that merely maintain the asset in its present condition are recorded as expenses and are not capitalized. Depreciation expense for capital assets is identified with a specific function and is included as a direct expense on the statement of activities.
All capital assets are capitalized at historical cost (or estimated historical cost) and updated for additions and retirements during the year. Donated fixed assets are recorded at estimated value at the date of donation. Upon sale or retirement of equipment, the cost and related accumulated depreciation, if applicable, are eliminated from their respective accounts and any resulting gain or loss is included in the results of operations.
All reported capital assets other than land and land improvements are depreciated. Building improvements are depreciated over the shorter of ten years or the remaining useful lives of the related capital assets. Depreciation is computed using the straight-line method.
Compensated Absences
ACPS staff accrue compensated absences. All annual and sick leave benefits are accrued as a liability when earned by the employee and are reported in the government-wide financial statements. The current portion of the accrued compensated absences liability includes: 1) an amount which pertains to those employees who retired or resigned by June 30 each fiscal year and who have not received payment for their accrued compensatory leave as of June 30; and, 2) an estimate of the amount of
compensated leave that will be used by active employees during the subsequent fiscal year.
Annual Leave: Eligible ACPS employees accrue annual leave throughout the contract year in amounts based on length of service. Upon retirement, resignation, termination, or death, employees may be compensated for accrued leave at their current per diem rate of pay up to a maximum of 45 annual leave days as of June 30.
Sick Leave: Sick leave eligibility and accumulation is specified in the employee handbook. Upon retirement, resignation, or death, employees receive a lump-sum payment based on daily rates approved by the Board. ACPS does not compensate terminating employees for unused sick leave unless they have completed three consecutive years of employment. Sick leave is accrued for the amount earned and vested.
For eligible licensed staff and administrators a sick leave retirement incentive program is offered annually, subject to the approval of the School Board and/or Superintendent. It provides an increased payout of unused accumulated sick leave at retirement if advanced notification is received by the stated deadline as indicated on the program’s application.
Personal Leave: Full-time employees are generally granted four personal leave days per year and certain employee groups may accumulate up to eight days. Unused, excess personal leave may be carried forward at the end of the year as accumulated sick or annual leave depending on the employee group. Personal leave is credited to each employee at the beginning of each contract year and up to four days are payable to eligible licensed staff at retirement.
Net Position
Net position represents the difference between assets, liabilities and deferred inflows and
Page 47 ACPS FY 2024 Proposed Budget Budget and Financial Management
Budget and Financial Management
outflows on the government-wide statements. In the government-wide financial fund statements, ACPS’ net position falls into three categories:
1) invested in capital assets, net of related debt; 2) restricted; and, 3) unrestricted. The first category represents the portion of net position related to capital assets, net of accumulated depreciation, and the use of funds is restricted. The restricted category represents the portion of net position restricted for specific purposes. At the end of FY 2019, these restrictions were related to our grants and special programs and for our health benefit fund. The unrestricted category represents the remaining amount of net position that may be used to meet ACPS’ ongoing programs. In the fiduciary fund financial statements, ACPS’ net position is categorized as held in trust for pension benefits, which represent the amount of assets accumulated for the payment of benefits to the beneficiaries of the ACPS Supplemental Retirement Plan. When both restricted and unrestricted net position are available for an expense, ACPS applies restricted resources first unless there are legal documents or contracts that prohibit doing so (such as grant agreements).
Fund Balance
The Alexandria City School Board is responsible for ensuring the long-term fiscal health of ACPS. Fund Balance, also referred to as Reserves, is an important measure of fiscal stability. It is essential that ACPS maintain adequate levels of unrestricted fund balance to mitigate financial risk that can occur from unforeseen revenue fluctuations, unanticipated expenditures, and other extraordinary circumstances.
ACPS Policy DAB was adopted on May 19, 2016 and follows the definitions put forward in GASB No. 54, Fund Balance Reporting and Governmental Fund Type Definitions:
• Non-spendable: includes fund balance that cannot be spent because it is either (a) not in spendable form or (b) legally or contractually required to be maintained
intact (such as prepaid items).
• Restricted: includes fund balance that reflects constraints placed on the use of resources that are either (a) externally imposed by creditors, grantors, contributors, or laws or regulations of other government or (b) imposed by law through constitutional provisions or enabling legislation.
• Committed: includes fund balance amounts that can only be used for specific purposes pursuant to constraints imposed by formal actions of the highest level of decision making authority, the School Board.
• Assigned: includes spendable fund balance amounts that are intended to be used for specific purposes that are neither considered restricted or committed.
• Unassigned: includes residual fund balance within the Operating Fund that has not been assigned to other funds and/or the other above mentioned categories.
Policy DAB states that the School Board shall maintain a minimum unrestricted Operating Fund balance of 3 percent of the current fiscal year’s original Operating Fund expenditure budget, with a maximum of 5 percent, exclusive of the amount reserved for encumbrances. The School Board may utilize fund balance to support the Operating Budget each year; not to exceed 1.75 percent of the Operating Fund expenditure budget.
The appropriation of Operating Fund Balance for the School Board is scheduled for City Council consideration each June.
When expenditures are incurred for purposes in which both restricted and unrestricted funds are available, ACPS will use the restricted funds first, provided the expenditure meets the terms of the restriction; committed funds will be used first, followed by assigned funds then unassigned funds.
Page 48 ACPS FY 2024 Proposed Budget Budget and Financial Management
Budget and Financial Management
Should the unrestricted fund balance of the Operating Fund exceed 5 percent, ACPS will consider the fund balance as excess and available to support one-time, school-related capital projects or major equipment/vehicle replacements. Funds may also be used to address any other urgent unforeseen matters at the discretion of the School Board.
Use of Estimates
The preparation of the financial statements requires estimates and assumptions about various items included in the financial statements. Actual results will differ from these estimates.
Health Benefits Fund
Effective July 1, 2013, by School Board resolution, the Health Benefits Fund (an internal service, proprietary fund) was established to better manage health care expenses within ACPS. ACPS offers several health insurance programs to employees (and their families) and retirees. Medical insurance is offered through Kaiser Permanente and United Healthcare. Dental and vision care also are offered to employees and retirees. The primary sources of revenue for this fund are employer contributions paid by other funds and employee contributions deducted from employee pay on a semi-monthly basis.
To mitigate risks associated with offering medical benefits, ACPS has established a minimum level of reserve (where collections exceed expenses) in order to cover the following:
• Claims incurred but not reported (IBNR);
• Catastrophic losses;
• Premium stabilization amounts to avoid harsh spikes in monthly premium amounts;
• Unanticipated healthcare costs due to federal regulations in the Patient Protection and Affordable Healthcare Act; and,
• OPEB funding requirements as necessary.
Other Post-Employment Benefit Trust Fund (OPEB)
The School Board administers a single-employer defined benefits healthcare plan. It provides medical insurance benefits to eligible retired school employees and beneficiaries. A trust fund, used to account for assets held in a trustee capacity, was established in May 2009. The Other Post-Employment Benefit Trust Fund (OPEB) accounts for accumulating and investing for post-employment health benefit subsidies. Contributions to the Trust are made annually based upon the actuarially-determined annual required contribution (ARC) in accordance with GASB Statement No. 45.
Risk Management
ACPS is exposed to various losses related to torts: theft of, damage to, and destruction of assets; errors and omissions; injuries to employees; and, natural disasters. It is the policy of ACPS to retain risks of losses in those areas where the division deems it more economical to manage risks internally and account for any claims settlement in the operating fund.
ACPS carries commercial insurance on all other risks of loss, including property, theft, auto, liability, physical damage, and general liability through the Virginia Municipal League.
ACPS is self-insured for workers’ compensation. Claims are processed by a third-party administrator under contract with ACPS per statutory requirements of the Virginia Workers’ Compensation Act. The current portion is recorded as an accrued liability in the Operating Fund and the government-wide financial statements. Liabilities are determined using actual claims experience and estimated recoveries. An independent contractor processes claims and ACPS records a provision and liability in the government-wide statements and Operating Fund (current portion only) for estimated incurred but not reported claims.
Page 49 ACPS FY 2024 Proposed Budget Budget and Financial Management
Page 50 ACPS FY 2024 Proposed Budget Budget and Financial Management
This page intentionally left blank.
Section III: Financials


✓ ACPS Fund Statements
✓ Revenue
✓ Expenditures

✓ CIP


✓ Fiscal Forecast
✓ Financial Reports

✓ Personnel Reports

Section III:
ACPS Fund Statements
ACPS Financial Information
This section contains detailed information on ACPS revenues and expenditures in the FY 2024 Proposed Budget. The first section provides an overview through the presentation of fund statements. The second and third sections contain narratives and financial reports summarizing revenues and expenditures. The last two sections present the most detailed financial and position reports on expenditures and full-time equivalent (FTE) positions.
School Board Funds
Public sector budgets are governed by accounting and reporting requirements established by the Governmental Accounting Standards Board (GASB) and generally accepted accounting principles (GAAP). The ACPS budget structure is consistent with these requirements.
The budget is divided into funds. Each fund is a self-balancing set of accounts reflecting the activities operated through that fund. A diagram of the fund type structure can be found in the Appendix section of this document. The funds in the ACPS budget are:
• Operating Fund. This is the ACPS general fund which is comprised of the school division’s primary revenue sources from the Commonwealth of Virginia, the City of Alexandria, various federal sources, and miscellaneous local fees, as well as the expenditures charged against these revenues. Operating Fund expenditures account for the majority of ACPS’ total combined funds budget.
• Grants and Special Projects Fund. This is a special revenue fund to account for entitlement and competitive grant monies, as well as special revenues from local activities. Federal funds from the Individuals with Disability Education Act (IDEA), the Elementary and Secondary Education
Act (ESEA)/Every Student Succeeds Act (ESSA), as well as other smaller entitlement monies and competitive grants are budgeted in this fund.
• School Nutrition Fund. This is a special revenue fund used to account for revenues internally restricted to expenditures for the procurement, preparation, and serving of student meals. The School Nutrition Fund represents the smallest portion of ACPS’ combined funds budget.
• Health Benefits Fund. This internal service fund was established in FY 2014 to better manage the costs of health care programs provided to active ACPS employees, retirees, and families. The primary sources of revenue for this fund are employer contributions paid by other funds and employee contributions deducted from their pay on a semi-monthly basis. Fund expenses consist of costs incurred to provide the various types of indemnity health care coverage to employees and for the payment of claims and related expenses for the self-insured health care program.
• Fiduciary Funds: Fiduciary funds are used to account for resources held for the benefit of parties outside the governmental unit (school division). They are not reflected in the government-wide financial statements because the resources of those funds are not available to support the School Board’s programs. ACPS does not budget fiduciary funds at a detailed level beyond total revenue and expenditures.
The following page presents a combined funds statement showing all revenues and expenditures for all funds combined. This consolidated statement is followed by individual fund statements for all funds described above, as well as the ACPS Supplemental Retirement Plan, Other Post-Employment Benefits (OPEB) Trust, Health Benefits, and the School Activity Funds (SAF).
Page 51 ACPS FY 2024 Proposed Budget ACPS Fund Statements
ACPS Fund Statements
Page 52 ACPS FY 2024 Proposed Budget ACPS Fund Statements
Revenue Type FY 2020 Actual FY 2021 Actual FY 2022 Final Budget FY 2023 Final Budget FY 2024 Proposed Budget $ Change FY 2023 to FY 2024 % Change FY 2023 to FY 2024 State Revenue51,389,373 $ 57,331,565 $ 56,179,817 $ 66,128,282 $ 67,842,989 $ $ 1,714,707 2.6% Local Revenue2,957,942 1,075,286 3,431,092 3,520,572 3,628,958 108,386 3.1% Federal Revenue17,635,923 28,231,637 70,028,111 20,705,996 21,688,757 982,761 4.7% City Appropriations231,669,496 234,037,296 239,437,296 248,737,300 258,686,800 9,949,500 4.0% Total Revenue303,652,734 $ 320,675,784 $ 369,076,315 $ 339,092,150 $ 351,847,504 $ 12,755,354 $ 3.8% Expenditure Type FY 2020 Actual FY 2021 Actual FY 2022 Final Budget FY 2023 Final Budget FY 2024 Proposed Budget $ Change FY 2023 to FY 2024 % Change FY 2023 to FY 2024 Salaries185,462,292 $ 186,851,777 $ 198,727,373 $ 209,829,417 $ 219,112,137 $ $ 9,282,720 4.4% Employee Benefits71,876,965 76,319,570 80,580,142 86,313,694 87,227,727 914,033 1.1% Purchased Services15,105,831 17,781,287 66,362,200 18,382,694 20,012,540 1,629,846 8.9% Internal Services49,243 5,797 127,825 124,391 120,798 (3,593) -2.9% Other Charges11,677,104 10,947,737 12,071,805 11,983,875 13,306,334 1,322,459 11.0% Materials and Supplies11,889,786 14,278,929 14,288,366 16,297,508 16,903,681 606,173 3.7% Capital Outlay3,336,960 6,360,171 2,983,844 2,845,515 2,999,610 154,095 5.4% Indirect Costs412,126 299,440 249,212 60,393 215,234 154,841 256.4% Total Expenditures299,810,307 $ 312,844,708 $ 375,390,768 $ 345,837,487 $ 359,898,061 $ 14,060,574 $ 4.1% 299,810,307 Other Financing FY 2020 Actual FY 2021 Actual FY 2022 Final Budget FY 2023 Final Budget FY 2024 Proposed Budget $ Change FY 2023 to FY 2024 % Change FY 2023 to FY 2024 Other Sources of Funds: Virginia Preschool Initiative1,555,604 $ 1,716,473 $ 1,791,567 $ 1,863,300 $ 2,030,546 $ $ 167,246 9.0% Transfer from Capital Fund- - 1,200,000 1,200,000 1,200,000 - 0.0% Transfer to City Capital Fund- - - (3,774,100) - 3,774,100 -100.0% -*** Other Uses of Funds: - *** Virginia Preschool Initiative(1,555,604) (1,716,473) (1,791,567) (1,863,300) (2,030,546) (167,246)9.0% Total Other Financing$ - $ 1,200,000 $ (2,574,100) $ 1,200,000 $ 3,774,100 $ -146.6% Net Changes in Fund Balances (Use) / Growth $ 3,842,427 $ 7,831,076 $ (5,114,452) $ (9,319,437) $ (6,850,557) (4,204,985) $ -26.5% Note: Numbers may vary due to rounding. 4328855 Designation of Fund Balance FY 2020 Actual FY 2021 Actual FY 2022 Final Budget FY 2023 Final Budget FY 2024 Proposed Budget $ Change FY 2023 to FY 2024 % Change FY 2023 to FY 2024 Unexpended Funds: Nonspendable1,782,384 $ 2,316,030 $ 283,055 $ 283,055 $ 283,055 $ - $ 0.0% Restricted181,950 166,387 166,387 166,387 166,387 - 0.0% Committed for 20215,098,743 5,114,452 - - - - *** Committed for 2022- - 5,114,452 - - - *** Committed for 2023- - - 9,319,437 - (9,319,437) -100.0% Committed for 2024- - - - 6,850,557 6,850,557 *** Assigned - Encumbered Carryover 1,499,682 1,995,995 - - - - *** Unassigned9,764,199 16,565,170 20,594,141 16,389,156 18,858,036 2,468,880 15.1% Total Balance18,326,958 $ 26,158,035 $ 26,158,035 $ 26,158,035 $ 26,158,035 $ - $ 0.0% Note: Numbers may vary due to rou 18,326,958 $ Combined Funds Statement Operating, Grants & Special Projects, and School Nutrition Services Funds Combined Funds Statement Operating, Grants & Special Projects, and School Nutrition Services Funds Designation of Fund Balance
ACPS Fund Statements
Combined Funds
The FY 2024 Proposed Combined Funds Budget is comprised of three major funds; Operating, Grants and Special Projects, and School Nutrition Funds.
Revenues: For FY 2024, revenue is anticipated to increase by 3.8% or $12.76 million compared to the prior fiscal year. This is primarily driven by the reduction in federal revenue from grants.
Expenditures: The FY 2024 Proposed Combined Funds Budget totals $359.90 million, an increase of $14.06 million compared to the prior fiscal year.
Operating Fund
The FY 2024 Proposed Operating Fund Budget includes the majority of the division’s revenue and expenditures. Compared to the FY 2023 Final Budget, revenues are projected to increase by 3.9 percent to $323.43 million, while expenditures are projected to increase by 4.2 percent to $329.45 million. Approximately $2.03 million will be transferred out of operating funds to support the Virginia Preschool Initiative (VPI) program. In addition, ACPS will use approximately $6.85 million of Operating fund balance and $1.20 million from the Capital fund to fully cover the budgeted expenditures.
Revenues: The primary source of revenue for ACPS is the appropriation from the City of Alexandria. The appropriation increases by 4.0 percent in FY 2024 to a total of $258.69 million.
State revenue is budgeted to increase by 3.5 percent in FY 2024, to a total of $63.56 million. This change results from a 0.3 percent increase in sales tax receipts and a 9.0 percent increase in basic aid that flow to ACPS through the state’s school allocation formula. Overall, other state funding categories are are estimated to remain flat for FY 2024.
Local and federal revenues represent a modest portion of the operating fund budget. For FY 2024, local revenue will increase by 2.2 percent while budgeted federal revenue will increase by 5.7 percent.
Expenditures: Compensation, which includes both salaries and benefits, represents 86.8 percent of the expenditures in the Operating Fund. The remaining expenditures are for non-labor items, including purchased services, internal services, other charges, materials and supplies, capital outlay, and indirect costs.
Salaries are projected to increase by 4.5 percent in FY 2024, to a total of $204.32 million. This change is driven by a slight increase in staffing as well as implementing a more accurate salary projetion model. Salary improvements include: a full step increase for all eligible employees; a market rate adjustment of 2.5 percent to all salary scales; a one-time 2.0 percent bonus for employees on “Hold Steps”; additional market rate adjustments to the salary scales of specific employee groups to make them regionally competitive; and, an adjustment to all salary scales whereby a new top step is added while the current Step 1 is eliminated.
Benefits are projected to increase by 1.0 percent, to a total of $81.53 million. Changes in overall benefit expenditures are driven by salary improvements for current staff and a modest increase in health insurance premiums.
Purchased services increase by 10.7 percent to a total of $18.72 million. This increase is primarily the result of changes in other professional services, equipment maintenance and repair services, and cleaning services.
The division-wide budget for internal services, a very minor percentage of the total operating expenses, shows an increase compared to FY 2023. Internal services include internal food services, internal printing, and internal transportation, which are provided by the
Page 53 ACPS FY 2024 Proposed Budget ACPS Fund Statements
Note: Numbers may vary due to rounding.
ACPS Fund Statements
Fund Statement Operating Fund
Page 54 ACPS FY 2024 Proposed Budget ACPS Fund Statements
Revenue Type FY 2020 Actual FY 2021 Actual FY 2022 Final Budget FY 2023 Final Budget FY 2024 Proposed Budget $ Change FY 2023 to FY 2024 % Change FY 2023 to FY 2024 State Funds $ 47,555,042 $ 52,812,342 $ 51,843,100 $ 61,417,000 $ 63,556,600 2,139,600 $ 3.5% Local Funds 919,117 522,656 812,205 1,013,000 1,035,000 22,000 2.2% Federal Funds 133,283 138,527 130,135 140,000 148,000 8,000 5.7% City Appropriation 231,669,496 234,037,296 239,437,296 248,737,300 258,686,800 9,949,500 4.0% Total Revenue280,276,938 $ 287,510,821 $ 292,222,736 $ 311,307,300 $ 323,426,400 $ 12,119,100 $ 3.9% (287,707,897) $ Expenditure Type FY 2020 Actual FY 2021 Actual FY 2022 Final Budget FY 2023 Final Budget FY 2024 Proposed Budget $ Change FY 2023 to FY 2024 % Change FY 2023 to FY 2024 Salaries $ 173,523,381 $ 174,991,957 $ 184,738,851 $ 195,599,557 $ 204,321,000 8,721,443 $ 4.5% Employee Benefits 67,480,510 71,835,743 75,440,907 80,714,551 81,532,037 817,486 1.0% Purchased Services 13,857,201 13,636,023 14,935,258 16,905,115 18,720,371 1,815,256 10.7% Internal Services - - 61,874 63,241 68,573 5,332 8.4% Other Charges 10,899,171 9,015,582 11,165,114 11,105,072 12,441,263 1,336,191 12.0% Materials and Supplies 6,506,092 7,278,569 8,515,690 10,294,161 10,804,126 509,965 5.0% Capital Outlay 2,043,133 2,654,814 1,887,927 1,507,640 1,559,041 51,401 3.4% Indirect Costs - - - - -*** Total Expenditures274,309,488 $ 279,412,688 $ 296,745,621 $ 316,189,337 $ 329,446,411 $ 13,257,074 $ 4.2% 274,309,488 $ Other Financing FY 2020 Actual FY 2021 Actual FY 2022 Final Budget FY 2023 Final Budget FY 2024 Proposed Budget $ Change FY 2023 to FY 2024 % Change FY 2023 to FY 2024 Other Sources of Funds: Transfer from Capital Fund $ - $ - $ 1,200,000 $ 1,200,000 $ 1,200,000 $ - 0.0% Other Uses of Funds: Virginia Preschool Initiative (1,555,604) (1,716,473) (1,791,567) (1,863,300) (2,030,546) (167,246)9.0% Transfer to City Capital Fund - - - (3,774,100) - 3,774,100 -100.0% Total Other Financing(1,555,604) $ (1,716,473) $ (591,567) $ (4,437,400) $ (830,546) $ 3,606,854 $ -81.3% Net Changes in Fund Balances (Use) / Growth 4,411,846 $ 6,381,659 $ (5,114,452) $ (9,319,437) $ (6,850,557) $ 2,468,880 $ -26.5% 297,337,188 $ Designation of Fund Balance FY 2020 Actual FY 2021 Actual FY 2022 Final Budget FY 2023 Final Budget FY 2024 Proposed Budget $ Change FY 2023 to FY 2024 % Change FY 2023 to FY 2024 Unexpended Funds: Committed 5,098,743 $ 5,114,452 $ 5,114,452 $ 9,319,437 $ 6,850,557 $ $ (2,468,880)-26.5% Nonspendable (Prepaid Items) 1,538,385 2,032,975 - - - - *** Unassigned 7,098,095 12,473,142 16,502,113 12,297,128 14,766,008 2,468,880 20.1% Assigned (Encumbered Carryover) 1,499,682 1,995,995 - - -*** Total Balance15,234,905 $ 21,616,565 $ 21,616,565 $ 21,616,565 $ 21,616,565 $ - $ 0.0%
ACPS Fund Statements
School Nutrition, Financial Services, and Transportation departments, respectively. As in previous years, the Departments of Pupil Transportation and Financial Services have budgeted an expenditure credit to offset the school and department internal services budgets in FY 2024.
Other charges are projected to increase by 12.0 percent to a total of $12.44 million. This category includes the costs of building leases, electrical services, and telecommunications.
Materials and supplies expenditures are projected to increase by 5.0 percent, to a total of $10.80 million. The change in this category is attributable to projected increases in software, equipment, and gasoline.
Other Funding Sources: The Operating Fund includes certain transfers to and from the Grants and Special Projects Fund and the Capital Improvement Projects (CIP) Fund.
A total of $2.03 million will be transferred from the operating budget to the Preschool fund to support the division-wide preschool program for children eligible to receive services under the Virginia Preschool Initiative (VPI).
Use of Fund Balance: In accordance with School Board Policy DAB, the budgeted use of fund balance should total no more than 1.75 percent of the FY 2024 budgeted operating expenditures. This results in a budgeted use of fund balance totaling $6.85 million to support annual operations.
Details on Operating Fund revenues and expenditures can be found in later sections of this budget book.
Grants and Special Projects Fund
Valuable supplemental funding for ACPS’ instructional programs is provided by entitlement and competitive grant awards from various outside agencies and organizations,
including state, local, and federal sources, as well as private organizations.
As required by state and federal regulations and the Governmental Accounting Standards Board (GASB), this supplemental funding is organized, reported and tracked in a separate accounting and budget fund (Grants and Special Projects Fund), with a separate set of self-balancing accounts comprised of assets, liabilities, fund balances, revenues, and expenditures. In most cases, these funds must be used to supplement, not supplant, the Operating Fund budget.
The grant information presented here represents an estimate of the grant funding anticipated for FY 2024 and has been developed based on information available as of December 2022. Until a grant application is officially awarded by the grantor, there is a level of uncertainty regarding the exact level of funding. Final grant allocations for most entitlement awards are generally released in October after the start of each fiscal year.
Because ACPS is permitted to carry-forward certain unspent balances for use in subsequent years, the grants and special projects budget is adjusted later in the fiscal year after final, audited year-end figures are available to derive this confirmed carry-over funding.
Grant and special project revenues and expenditures are dependent upon allocations from local (including private sector), state, and federal entities. Expenditures in this fund are governed by the funding entity and must comply with specific requirements.
For FY 2024, Grants and Special Projects Fund revenues are forecasted to increase slightly by $0.01 million, or 0.5 percent and expenditures are expected to increase by $0.24 million, or 1.4 percent, compared to the FY 2023 Final Budget figures.
The table on the following page outlines
Page 55 ACPS FY 2024 Proposed Budget ACPS Fund Statements
Note: Numbers may vary due to rounding. *
ACPS Fund Statements
Fund Statement Grants and Special Projects Fund*
Page 56 ACPS FY 2024 Proposed Budget ACPS Fund Statements
Revenue Type FY 2020 Actual FY 2021 Actual FY 2022 Final Budget FY 2023 Final Budget FY 2024 Proposed Budget $ Change FY 2023 to FY 2024 % Change FY 2023 to FY 2024 State Funds $ 3,622,853 $ 4,396,209 $ 4,156,448 $ 4,499,634 $ 4,075,290 $ (424,344)-9.4% Local Funds * 403,251 460,775 204,983 204,984 970,283 765,299 373.3% Federal Funds 10,496,673 18,193,525 61,297,982 11,042,746 10,774,660 (268,086)-2.4% Total Revenue 14,522,777 $ 23,050,509 $ 65,659,413 $ 15,747,364 $ 15,820,233 $ 72,869 $ 0.5% (35,054,596) $ Expenditure Type FY 2020 Actual FY 2021 Actual FY 2022 Final Budget FY 2023 Final Budget FY 2024 Proposed Budget $ Change FY 2023 to FY 2024 % Change FY 2023 to FY 2024 Salaries $ 8,793,991 $ 8,755,385 $ 10,101,261 $ 9,998,510 $ 10,403,120 $ 404,610 4.0% Employee Benefits 2,963,631 3,047,752 3,396,979 3,775,843 3,857,116 81,273 2.2% Purchased Services 1,165,899 4,028,953 51,328,992 1,341,079 1,108,669 (232,410)-17.3% Internal Services 42,584 5,797 57,951 53,150 44,225 (8,925)-16.8% Other Charges 753,221 1,920,078 878,491 842,303 827,571 (14,732)-1.7% Materials and Supplies 1,563,844 3,682,141 1,352,176 1,326,511 1,170,275 (156,236)-11.8% Capital Outlay 408,191 3,042,999 85,917 212,875 224,569 11,694 5.5% Indirect Costs 412,126 299,440 249,212 60,393 215,234 154,841 256.4% Total Expenditures *16,103,487 $ 24,782,545 $ 67,450,980 $ 17,610,664 $ 17,850,779 $ 240,115 $ 1.4% 16,103,487 $ 36,499,734 $ 1,445,138 $ 1,791,567 $ Other Financing FY 2020 Actual FY 2021 Actual FY 2022 Final Budget FY 2023 Final Budget FY 2024 Proposed Budget $ Change FY 2023 to FY 2024 % Change FY 2023 to FY 2024 Other Sources of Funds: Virginia Preschool Initiative $ 1,555,604 $ 1,716,473 $ 1,791,567 $ 1,863,300 $ 2,030,546 $ 167,246 9.0% Other Uses of Funds: Medicaid - - - - - - *** Erate - - - - - - *** Total Other Financing1,555,604 $ 1,716,473 $ 1,791,567 $ 1,863,300 $ 2,030,546 $ 167,246 $ 9.0% Net Changes in Fund Balances (Use) / Growth (25,106) $ (15,563) $ - $ - $ - $ - $ *** (1,334,943) $ (1,334,943) $ Designation of Fund Balance FY 2020 Actual FY 2021 Actual FY 2022 Final Budget FY 2023 Final Budget FY 2024 Proposed Budget $ Change FY 2023 to FY 2024 % Change FY 2023 to FY 2024 Unexpended Funds: Restricted $ 181,950 $ 166,387 $ 166,387 $ 166,387 $ 166,387 $ - 0.0% Prepaid Items - - - - - - *** Encumbered Carryover - - - - - - *** Ending Balance181,950 $ 166,387 $ 166,387 $ 166,387 $ 166,387 $ - $ 0.0%
Activity
Fund Statement does not include Student
Fund Revenues or Spending; these are reported separately in this document.
ACPS Fund Statements
key changes in grants awarded to ACPS as included in the FY 2024 Proposed Budget.
Federal Grants
The federal funds portion of the Grants and Special Projects Fund is projected to decrease slightly for FY 2024. This is based on actual award information from recent years and guidance received from the awarding agencies.
Every Student Succeeds Act (ESSA)
The most recent reauthorization of the Elementary and Secondary Education Act (ESEA) is known as Every Student Succeeds Act (ESSA). ACPS’ Title I funding is designated for the division by this act.
Title I, Part A of the Elementary and Secondary Education Act (ESEA), as amended, provides financial assistance to local educational agencies (LEAs) and schools with high numbers or high percentages of children from low-income families to help ensure that all children meet challenging state academic standards.
Funding for Title I, Part A expenditures are projected to decrease slightly to approximately $3.99 million. For FY 2024, Cora Kelly, Jefferson-Houston, John Adams, Patrick Henry, William Ramsay and Francis C. Hammond schools, as well as the Office of Title I Programs will receive Title I funding. These funds will be used for personnel, staff development, translation services, technology equipment and software, instructional supplies, and parental involvement activities. All items must supplement what is provided to all schools and offices in the operating budget.
The purpose of Title II, Part A (Preparing, Training and Recruiting High Quality Teachers and Principals) is to increase academic achievement by improving teacher and principal quality. This program is carried out by increasing the number of highly-qualified
teachers in classrooms, increasing the number of highly-qualified principals and assistant principals in schools; and increasing the effectiveness of teachers and principals by holding local education agencies (LEAs) and schools accountable for improvements in student academic achievement.
Funding for Title II, Part A is projected to remain flat at approximately $0.59 million. These funds will be used for the salary and benefits for the Director of Talent Development, staff development services and other professional services for video editing and production, and travel. Private schools within the City of Alexandria are eligible for staff development funding through Title II. Those funds pass through ACPS to the private schools.
Title III, Part A (Language Instruction for Limited English Proficient and Immigrant Students) funds awarded under Title III support programs that improve the education of limited English proficient (LEP) children by helping them learn English and meet challenging state content and achievement standards. Title III programs also provide enhanced instructional opportunities for immigrant children.
The FY 2024 revenue projection for Title III, Part A totals approximately $0.63 million, the same amount received by ACPS in FY 2023. Grant monies will fund a parent resource coordinator, parent resource specialist, staff development activities, instructional materials, travel, and refreshments.
Individuals with Disabilities Education Act (IDEA)
Federal funds under Part B, of the Individuals with Disabilities Education Act (IDEA) are available for preschool and school-age special education programs. The Individuals with Disabilities Education Act (IDEA) is a law ensuring services to children with disabilities throughout the nation. IDEA governs how states and public agencies provide early
Page 57 ACPS FY 2024 Proposed Budget ACPS Fund Statements
ACPS Fund Statements
intervention, special education, and related services to children and youth with disabilities. Projected funding for IDEA Part B totals $3.68 million. The grant primarily supports specialist positions in the areas of behavior support, Autism, communications, compliance, as well as materials and supplies. Funds also cover a general special education teacher and a speech-language pathologist. An early childhood special education teacher is funded through the preschool portion of the IDEA grant.
State Grants
Juvenile Detention Center
ACPS receives funding from the Virginia Department of Education to hire and supervise instructional personnel who work in the education program of the Northern Virginia Juvenile Detention Center, a state-operated center. The Department of Education has established a program of education in accordance with the rules and regulations of the Board of Education for all students, ages 2 to 21, receiving education services in the Northern Virginia Juvenile Detention Center.
Funding for FY 2024 is expected to total $1.57 million. ACPS also provides in-kind contributions such as technical, instructional, and financial management support based on the school’s needs.
Preschool Fund
The Preschool Initiative fund, which includes revenues from the state’s Virginia Preschool Initiative (VPI) and the ACPS Operating Fund, was established in FY 2013. This fund includes all revenues, expenditures, and other sources and uses of funds related to ACPS Pre-K program with the exception of the Pre-K center and associated administrative positions.
ACPS is Alexandria’s fiscal agent for VPI. As such, a separate fund is established for VPI funds designated for private preschool
providers in the City of Alexandria. Revenues received from VPI are dependent on the number of children, age 4 and older, in the program. The VPI program provides $4,494.50 per student and a transfer from the operating fund completes the funding for these classrooms.
The VPI provides approximately $2.62 million in state funds to ACPS and community-based organizations to provide quality preschool programs for at-risk four-year-olds who are not served by Head Start. There will be a total of 14 VPI classrooms in ACPS for FY 2024: 12 currently located at the Early Childhood Center, Jefferson-Houston, and William Ramsay, and two new VPI classrooms to be located at Douglas MacArthur. A portion of this total is distributed to partner preschool providers.
Early Reading Intervention
The Early Reading Intervention (ERI) furnishes incentive funds for school divisions to provide identified students with additional reading instruction. Each elementary school receives these funds based on the number of students who are identified through the Phonological Awareness Literacy Screening (PALS) in grades K-3. These funds are used for tutoring or intervention materials. Funding for FY 2024 is projected to be $0.30 million.
SOL Algebra Readiness Initiative
Since 2002, the SOL Algebra Readiness Initiative (ARI) has provided mathematics intervention resources and services to students in grades 6, 7, 8, and 9 who are at risk of failing the Algebra I end-of-course assessment, as demonstrated by their individual performance on diagnostic tests that have been developed or approved by the Department of Education. For FY 2024, funding is projected to be approximately $0.09 million and will be used for software intervention programs and a summer Transition to Algebra program.
Page 58 ACPS FY 2024 Proposed Budget ACPS Fund Statements
ACPS Fund Statements
Other Financing Sources
A total of $2.03 million will be transferred from the operating fund to the VPI Preschool fund for FY 2024. This amount represents an increase of 9.0% from FY 2023.
School Nutrition Fund
Compared to the FY 2023 Final Budget, School Nutrition Fund revenues are projected to increase by 4.7 percent to $12.60 million, with expenses projected to increase by 4.7 percent to $12.60 million.
Revenues: Local revenues related to breakfast, a la carte sales, and services provided by the School Nutrition Department are projected to decrease by $0.68 million to a total of $1.62 million.
Federal funds, which come from the National School Lunch Program, are projected to increase by $1.24 million. This is the result of changing methodologies to project revenue more accurately. State revenues, which comprise a small portion of the budget are projected to remain flat in FY 2024.
Expenditures: Cost of labor, including salaries and benefits, is projected to increase by $0.16 million. This increase is associated with the following salary improvements: a full step increase for all eligible employees; a market rate adjustment of 2.5 percent to all salary scales; a one-time 2.0 percent bonus for employees on “Hold Steps”; additional market rate adjustments to the salary scales of specific employee groups to make them regionally competitive; and, an adjustment to all salary scales whereby a new top step is added while the current Step 1 is eliminated.
The cost of the purchased services will increase in FY 2024, while the internal services category will remain the same as the FY 2023 level. These expenses are associated with internal printing and equipment maintenance and repair services.
Spending on materials and supplies - comprised predominantly of food items - is projected to increase by $0.25 million to more accurately reflect the actual cost of these items next year.
Capital Outlay expenditures, non-Capital Improvement Program expenditures, are projected to increase slightly by $0.10 million. However, adequate funds have been included in the FY 2024 budget to continue renovation and rejuvenation efforts at school cafeterias.
Page 59 ACPS FY 2024 Proposed Budget ACPS Fund Statements
ACPS Fund Statements
Fund Statement School Nutrition Fund
*The School Nutrition Fund is required to keep sufficient reserves on hand to fund three months of operations. Undesignated reserve funds are used for this purpose.
Page 60 ACPS FY 2024 Proposed Budget ACPS Fund Statements
Revenue Type FY 2020 Actual FY 2021 Actual FY 2022 Final Budget FY 2023 Final Budget FY 2024 Proposed Budget $ Change FY 2023 to FY 2024 % Change FY 2023 to FY 2024 State Funds 211,478 $ 123,014 $ 180,269 $ 211,648 $ 211,099 $ $ (549)-0.3% Local Funds 1,635,574 91,855 2,413,904 2,302,588 1,623,675 (678,913)-29.5% Federal Funds 7,005,967 9,899,585 8,599,994 9,523,250 10,766,097 1,242,847 13.1% Total Revenue8,853,019 $ 10,114,454 $ 11,194,167 $ 12,037,486 $ 12,600,871 $ 563,385 $ 4.7% 11,194,167 Expenditure Type FY 2020 Actual FY 2021 Actual FY 2022 Final Budget FY 2023 Final Budget FY 2024 Proposed Budget $ Change FY 2023 to FY 2024 % Change FY 2023 to FY 2024 Salaries 3,144,920 $ 3,104,437 $ 3,887,261 $ 4,231,350 $ 4,388,017 $ $ 156,667 3.7% Employee Benefits 1,432,824 1,436,074 1,742,256 1,823,300 1,838,574 15,274 0.8% Purchased Services 82,731 116,311 97,950 136,500 183,500 47,000 34.4% Internal Services 6,659 - 8,000 8,000 8,000 - 0.0% Other Charges 24,712 12,076 28,200 36,500 37,500 1,000 2.7% Materials and Supplies 3,819,850 3,318,219 4,420,500 4,676,836 4,929,280 252,444 5.4% Capital Outlay885,636 662,357 1,010,000 1,125,000 1,216,000 91,000 8.1% Other Uses of Funds- - - - -*** Total Expenditures9,397,332 $ 8,649,474 $ 11,194,167 $ 12,037,486 $ 12,600,871 $ 563,385 $ 4.7% 10,584,027 Net Changes in Fund Balances (Use) / Growth (544,313) $ 1,464,980 $ - $ - $ - $ - $ *** Designation of Fund Balance FY 2020 Actual FY 2021 Actual FY 2022 Final Budget FY 2023 Final Budget FY 2024 Proposed Budget $ Change FY 2023 to FY 2024 % Change FY 2023 to FY 2024 Unexpended Funds: Undesignated reserve* 2,666,104 $ 4,092,028 $ 4,092,028 $ 4,092,028 $ 4,092,028 $ $ - 0.0% Inventory 243,999 281,184 283,055 283,055 283,055 - 0.0% Prepaid - 1,870 - - - - *** Encumbered Carryover - - - - - - *** Ending Balance2,910,103 $ 4,375,083 $ 4,375,083 $ 4,375,083 $ 4,375,083 $ - $ 0.0% Note:
Numbers may vary due to rounding.
ACPS Fund Statements
Fiduciary Fund Statement ACPS Supplemental Retirement Plan
Supplemental Retirement Plan
The ACPS Supplemental Retirement Plan is a single-employer defined benefit pension plan. Both plan administation and management of plan assets have been delegated to a thirdparty administrator (TPA), Principal Financial Group. The ACPS Supplemental Retirement Plan is fully funded by employee contributions at a rate of 1.5 percent that began in FY 2014; currently, the employer makes no contribution to this supplemental retirement program. The plan exists for the single purpose of funding retirement benefit payments. Other sources of revenues are the earnings from investment of the plan assets.
Beginning in FY 2009, ACPS began systematically shifting funds from fixed income assets into more diversified investments. This diversification strategy has helped the ACPS Supplemental Retirement Plan increase investment earnings to a higher level than would have otherwise been experienced in the economic climate at that time, while maintaining an appropriate financial risk. ACPS staff and
independent advisors continue to evaluate asset allocations in light of economic changes and recommend changes accordingly.
As of June 30, 2021, the ACPS Supplemental Retirement Plan’s estimated valued is $169.78 million. It is projected to total approximately $152.96 million in value as of June 30, 2022. The annual required contribution (ARC) projected to meet all future obligations is approximately $5.79 million, based on the most recent actuarial valuation for the plan year beginning September 1, 2020.
Expenses include fees paid to the fund manager for administration of the retirement program and investment services as well as direct payments to employees.
On December 19, 2013, the School Board adopted an Investment Policy Statement to outline the investment objectives of the plan’s portfolio as well as the responsibilities and decision-making authority for the fiscal administration of plan assets.
Page 61 ACPS FY 2024 Proposed Budget ACPS Fund Statements
Revenue Type FY 2020 Actual FY 2021 Actual FY 2022 Estimate FY 2023 Estimate FY 2024 Estimate Percent Change FY 2022 to FY 2023 Beginning Balance $ 149,383,315 $ 149,234,890 $ 169,784,943 $ 152,959,808 $ 156,683,309 2.4% Employer Contributions 1,685,214 2,739,107 1,738,611 1,773,383 1,808,851 2.0% Employee Contributions 2,673,062 2,739,364 2,885,035 3,043,712 3,211,116 5.5% Earnings 3,760,190 23,427,820 (12,844,448) 7,647,990 7,834,165 2.4% TOTAL:157,501,781 $ 178,141,181 $ 161,564,141 $ 165,424,893 $ 169,537,441 $ 2.5% Expenditure Type FY 2020 Actual FY 2021 Actual FY 2022 Estimate FY 2023 Estimate FY 2024 Estimate Percent Change FY 2022 to FY 2023 Benefit Payments $ 7,962,864 $ 8,054,248 $ 8,289,710 $ 8,432,056 $ 8,576,846 1.7% Administrative Fees 304,027 301,990 314,623 309,528 317,063 2.4% TOTAL:8,266,891 $ 8,356,238 $ 8,604,333 $ 8,741,584 $ 8,893,909 $ 1.7% Ending Balance149,234,890 $ 169,784,943 $ 152,959,808 $ 156,683,309 $ 160,643,533 $ 5.0%
Fiduciary Fund Statement ACPS OPEB Trust
Other Post Employee Benefits (OPEB)
In May 2009, in accordance with GASB 45, the School Board authorized the establishment of a trust for the purpose of accumulating and investing assets to fund other post employment benefits in order to provide medical benefits to eligible retired school employees and beneficiaries.
ACPS invests the OPEB Trust Fund’s assets with the Virginia Pooled OPEB Trust Fund (Pooled Trust) sponsored by the Virginia Association of Counties and the Virginia Municipal League (VACo/VML). The Pooled Trust is an investment pooling vehicle created to allow participating local governments, school divisions and authorities in the state to accumulate and invest assets to fund other post employment benefits.
The annual required contribution (ARC) is actuarially determined based on projected payas-you-go financing requirements with additional amounts to pre-fund benefits.
The pay-as-you-go amounts represent the School Board’s subsidy of $265 per month per retiree participant for healthcare benefits. Amounts contributed to the Trust by the School Board are irrevocable and must be used solely to discharge the School Board’s obligations for other post employment benefits and pay for reasonable expenses of the trust.
Effective July 1, 2013 (FY 2014), the pay-asyou-go financing and any additional amounts to pre-fund benefits, as determined by the School Board, will be collected in the OPEB Trust Fund towards satisfaction of the ARC. Based on the most recent audit evalation, the contribution for the fiscal year ending June 30, 2021 was $2.74 million. This compares to the prior year contribution at June 30, 2020 of $1.69 million. Both reflect a long-term yield on plan assets and a discount rate of 7.0 percent per annum.
For FY 2024, ACPS will fund its ARC by contributing current pay-as-you-go benefits plus an additional amount as necessary to fully fund the required ARC amount. The most recent actuarial analysis as of January 2021 estimates that the ARC for FY 2023 is $1.79 million. If the
Page 62 ACPS FY 2024 Proposed Budget ACPS Fund Statements
ACPS Fund Statements
Revenue Type FY 2020 Actual FY 2021 Actual FY 2022 Estimate FY 2023 Estimate FY 2024 Estimate Percent Change FY 2023 to FY 2024 Beginning Balance $ 21,078,039 $ 21,698,465 $ 29,242,735 $ 26,511,019 $ 27,815,468 4.9% Employer Contributions 1,685,214 2,739,107 1,738,611 1,790,769 1,853,446 3.5% Earnings 644,351 6,522,171 (2,703,072) 1,325,551 1,418,589 7.0% TOTAL:23,407,604 $ 30,959,743 $ 28,278,274 $ 29,627,340 $ 31,087,503 $ 4.9% Expenditure Type FY 2020 Actual FY 2021 Actual FY 2022 Estimate FY 2023 Estimate FY 2024 Estimate Percent Change FY 2023 to FY 2024 Withdrawals: Pay-As-You-Go $ 1,685,214 $ 1,692,570 $ 1,738,611 $ 1,785,904 $ 1,848,411 3.5% Fees 23,924 24,438 28,644 25,968 27,246 4.9% TOTAL:1,709,138 $ 1,717,008 $ 1,767,255 $ 1,811,872 $ 1,875,657 $ 3.5% Ending Balance21,698,465 $ 29,242,735 $ 26,511,019 $ 27,815,468 $ 29,211,846 $ 5.0%
ACPS Fund Statements
actuarial ARC exceeds estimates, adjustments will made accordingly to ensure the ARC is fully funded. The total ARC will be reflected as an expenditure in the operating budget, offset by a transfer of funds from the Health Benefits Fund in FY 2023.
Health Benefits Fund
In November 2013, the School Board authorized the establishment of a Health Benefits Fund to better manage the costs of health care programs provided to active ACPS employees and retirees and their families.
ACPS offers indemnity-type health care insurance programs by Kaiser Permanente for medical coverage, CareFirst for dental coverage and EyeMed for vision coverage. The employer and employee portions of the premiums charged by the insurance carriers are recorded in the fund as revenue, during ACPS’ semi-monthly payroll process. Payments to insurance carriers for monthly coverage are reflected as expenses in the fund.
The Health Benefits Fund also reflects the activity associated with ACPS’ self-funded health insurance plan administered by United Healthcare (UHC). Under the UHC plan, which was adopted in FY 2009, ACPS pays all health insurance claims for employees and their eligible dependents as well as administrative fees.
To mitigate risks associated with offering medical benefits, ACPS has established a minimum level of reserve (where collections exceed expenses) in order to cover the following:
• Claims incurred but not reported (IBNR),
• Catastrophic losses,
• Premium stabilization amounts to avoid harsh spikes in monthly premium amounts,
• Unanticipated healthcare costs due to federal regulations in the Patient Protection
and Affordable Healthcare Act, and
• OPEB funding requirements as necessary.
For FY 2024 the premiums for United Healthcare, the self-insurance plan, and Kaiser Permanente are projected to increase by an average of 3.5 percent, as compared to FY 2023 premiums. Effective July 1, 2019, at the recommendation of an ACPS Healthcare Benefits Committee, UHC introduced a new optional Qualified Health Plan with Health Savings Account (HSA) that will provide an additional option for eligible employees.
For projection purposes, claims expense for United Healthcare is projected using the estimated number of participants in FY 2023 plus the proportionate percentage of all new positions for FY 2024. All other premiums are set equal to payroll deductions and benefit contributions from regular employees and retirees.
Page 63 ACPS FY 2024 Proposed Budget ACPS Fund Statements
The detailed fund statement for Health Benefits is shown on the following page.
Payroll deductions and benefit contributions from regular employees
retirees and OPEB retiree subsidy
ACPS Fund Statements
Page 64 ACPS FY 2024 Proposed Budget ACPS Fund Statements
RevenueFY 2020 ActualFY 2021 Actual FY 2022 Projected FY 2023 Projected FY 2024 Projected Budget Change, FY 2023 to FY 2024
and
- United Healthcare (UHC) (Medical) $ 23,487,107 $ 25,059,252 $ 24,886,536 $ 26,130,863 $ 27,437,406 $ 1,306,543 - Kaiser (Medical) $ 7,010,664 7,452,472 7,520,289 $ 8,197,116 $ 8,525,001 327,885 - MetLife/CareFirst (Dental) $ 1,881,682 1,920,265 1,923,145 $ 1,961,609 $ 2,030,265 68,656 - EyeMed (Vision) $ 232,921 235,599 236,329 $ 241,056 $ 249,493 8,437 TOTAL REVENUE32,612,374 $ 34,667,588 $ 34,566,300 $ 36,530,644 $ 38,242,165 $ 1,711,521 $ 32,612,374 $ 34,667,588 $ 34,566,300 $ ExpendituresFY 2020 ActualFY 2021 Actual FY 2022 Projected FY 2023 Projected FY 2024 Projected Budget Change, FY 2023 to FY 2024 Claims and Benefits Paid - United Healthcare (Medical) 19,865,862 $ 20,093,950 $ 22,364,110 $ 23,482,316 $ 24,304,197 $ 821,881 $ Premiums $- Kaiser (Medical) 6,986,095 7,347,081 7,663,849 8,123,680 8,408,009 284,329 - MetLife/CareFirst (Dental) 1,821,373 1,915,487 1,998,073 2,018,054 2,088,686 70,632 - EyeMed (Vision) 219,470 230,810 240,762 243,170 251,681 8,511 Total Premiums 9,026,938 9,493,378 9,902,684 10,384,904 10,748,376 363,472 $ 9,026,938 Administrative Costs 1,081,648 1,114,423 1,156,573 1,191,618 1,233,325 41,707 TOTAL USES29,974,448 $ 30,701,751 $ 33,423,367 $ 35,058,838 $ 36,285,898 $ 1,227,060 $ 30,701,751 $ Other FinancingFY 2020 ActualFY 2021 Actual FY 2022 Projected FY 2023 Projected FY 2024 Projected Budget Change, FY 2023 to FY 2024 Transfer of Self-Insurance Liabilities Credit - - - - -FY 2018 Transfer to the Operating Fund - - - - -TOTAL OTHER FINANCING$ - $ - $ - $ - $ CHANGE IN NET POSITION: INCREASE/ (DECREASE) 2,637,926 $ 3,965,837 $ 1,142,933 $ 1,471,806 $ 1,956,267 $ 484,461 $ Net PositionFY 2020 ActualFY 2021 Actual FY 2022 Projected FY 2023 Projected FY 2024 Projected Budget Change, FY 2023 to FY 2024 Reserve for UHC Catastrophic Claims* 4,966,466 $ 3,348,992 $ 3,727,352 $ 3,913,719 $ 3,991,994 $ $ 78,274 Reserve for Premium Stablization, Affordable Care Act Requirements and Other Contingencies 2,034,619 1,143,376 1,251,165 1,316,917 1,343,255 26,338 Designated for FY 2018 Operating Fund - - - - -Unrestricted - - - - -Ending Balance7,001,084 $ 10,966,921 $ 12,109,854 $ 13,581,660 $ 15,537,927 $ 1,956,267 $ Internal
Statement Health Benefits Fund
Service Fund
ACPS Fund Statements
Statement of Annual Activity ACPS School Activity Funds
School Activity Funds (SAF)
ACPS schools receive local revenues from facility rentals, donations, club dues, selected extracurricular sports activities and other miscellaneous fees. These revenues are managed in local school activity fund accounts, as required by Virginia law. The statement of annual activity for these accounts shows revenue for all schools combined; the disbursements also are combined across all schools.
Local school activity fund accounts are operated at each school site under the direct supervision and responsibility of the school principal. The ACPS Accounting Office provides financial support to school principals and treasurers and regularly reviews these accounts. Each year, an independent accounting firm performs an annual financial audit of school activity fund. As in prior
years, ACPS will retain a local CPA firm that specializes in SAF financial and process audits for K-12 public schools to conduct a thorough financial audit of all schools.
Due to the recent pandemic, school receipts and disbursements have both dropped significantly in recent years, but are anticipated to begin to recover in FY 2024.
Page 65 ACPS FY 2024 Proposed Budget ACPS Fund Statements
Revenue Type FY2020 Actual FY 2021 Actual FY 2022 Estimate FY 2023 Estimate FY 2024 Estimate Percent Change FY 2023 to FY 2024 Beginning Balance $ 542,254 $ 742,214 $ 646,050 $ 535,855 $ 432,107 -19.4% Receipts 1,102,181 94,828 432,562 449,865 944,717 110.0% TOTAL:1,644,435 $ 837,042 $ 1,078,612 $ 985,720 $ 1,376,824 $ 39.7% Expenditure Type FY2020 Actual FY 2021 Actual FY 2022 Estimate FY 2023 Estimate FY 2024 Estimate Percent Change FY 2023 to FY 2024 Disbursements $ 902,221 $ 190,992 $ 542,757 $ 553,613 $ 869,173 57.0% TOTAL:902,221 $ 190,992 $ 542,757 $ 553,613 $ 869,173 $ 57.0% Ending Balance742,214 $ 646,050 $ 535,855 $ 432,107 $ 507,651 $ 17.5%
Revenue
Operating Fund Revenue Overview
The FY 2024 total Operating Fund revenue is anticipated to increase to $323.43 million, an increase of 3.9 percent or $12.05 million when compared with the FY 2023 Final Budget. The primary source of operating revenue, the city appropriation, is projected to increase by 4.0 percent. State funds represent 19.7 percent of the total FY 2024 revenue, and are projected to increase by 3.4 percent. Together, these two funding sources comprise of 99.6 percent of all revenue projected for the FY 2024 budget, as shown in the pie chart below.
Additional funds that support the operating budget are noted under the category ‘Other Sources of Funds’; specifically, a transfer from the Capital Improvement Program (CIP) Fund. The Operating Fund also provides support for the Virginia Preschool Initiative (VPI) preschool program with a transfer of $2.03 million to the Grants and Special Projects Fund. The planned use of unassigned fund balance is $6.85 million in FY 2024 compared to $9.32 million in FY 2023.
When compared with other school divisions in Virginia, a much larger portion of the ACPS budget is derived from local government funds than other revenue sources. ACPS will rely on the city appropriation for 79.9 percent of its FY 2024 Operating Fund budget.

Additional sources of revenue for the ACPS Operating Fund include certain federal and local funds, generated primarily from fees, tuition, and indirect cost recovery.
Types of Revenue
City Appropriation, $258.69 million
The largest portion of ACPS operating revenues comes from the city appropriation. Real and personal property tax dollars are the primary revenue sources for the City of Alexandria. The City Council approves a transfer from city funds to ACPS to finance the Operating Fund on an annual basis.
Page 66 ACPS FY 2024 Proposed Budget Revenue
State Funds 19.7% Local Funds 0.3% Federal Funds 0.1% City Appropriation 79.9% Operating Fund FY 2024 Proposed Revenue (Excludes Fund Balance and Other Financing)
ACPS Revenue by Object
Page 67 ACPS FY 2024 Proposed Budget Revenue Revenue Type of Revenue FY 2020 Actual FY 2021 Actual FY 2022 Final FY 2023 Final FY 2024 Proposed FY 2023 to FY 2024 $ Change FY 2023 to FY 2024 % Change STATE FUNDS TIER I - SOQ ACCOUNTS Basic Aid14,314,587 $ 14,816,586 $ 15,762,135 $ 16,001,100 $ 17,440,600 $ 1,439,500 $ 9.0% Sales Tax Receipts19,394,070 21,851,109 20,557,175 22,951,700 23,026,000 74,300 0.3% Textbooks312,132 324,240 331,545 398,500 405,100 6,600 1.7% Vocational Education192,196 193,090 200,525 177,600 183,600 6,000 3.4% Gifted Education167,396 174,988 178,930 183,600 186,650 3,050 1.7% Special Education1,608,865 1,653,332 1,690,580 1,688,600 1,716,650 28,050 1.7% Prevention/Intervention/Remediation895,880 868,905 888,480 915,000 930,250 15,250 1.7% VRS Retirement (includes RHCC )2,076,954 2,256,738 2,326,090 2,384,000 2,448,000 64,000 2.7% Board Certification187,500 172,500 162,500 166,150 180,000 13,850 8.3% Social Security942,379 968,467 999,540 1,023,400 1,049,600 26,200 2.6% Group Life65,099 69,392 70,955 72,250 73,450 1,200 1.7% English as a Second Language1,264,803 1,405,103 1,548,805 1,926,050 1,786,800 (139,250) -7.2% Remedial Summer School249,934 415,508 183,120 250,250 251,250 1,000 0.4% TOTAL TIER I FUNDS41,671,795 $ 45,169,958 $ 44,900,380 $ 48,138,200 $ 49,677,950 $ 1,539,750 $ 3.2% TIER II - INCENTIVE ACCOUNTS Compensation Supplements976,690 $ - $ 1,124,540 $ 1,198,350 $ 2,568,850 $ 1,370,500 $ 114.4% At-Risk 937,525 620,054 1,258,325 2,482,500 1,490,400 (992,100) -40.0% Math/Reading Instructional Specialists - 15,321 16,030 - - - *** Early Reading Specialists Initiative - 15,321 16,030 16,950 17,700 750 4.4% Technology492,000 492,000 492,000 492,000 492,000 - 0.0% TOTAL TIER II FUNDS2,406,215 $ 1,142,696 $ 2,906,925 $ 4,189,800 $ 4,568,950 $ 379,150 $ 9.0% TIER III - CATEGORICAL ACCOUNTS Special Education - Homebound18,065 $ 10,137 $ 10,240 $ 10,200 $ 10,350 $ 150 $ 1.5% Other State Funds113,137 1,946,168 237,660 4,583,700 4,636,650 52,950 1.2% TOTAL TIER III FUNDS131,202 $ 1,956,305 $ 247,900 $ 4,593,900 $ 4,647,000 $ 53,100 $ 1.2% TIER IV - LOTTERY FUNDED ACCOUNTS At-Risk$ 618,128 $ 434,605 $ 788,200 $ 933,950 $ 145,750 $ 18.5% Career and Technical Education30,774 35,184 25,700 25,000 25,000 - 0.0% K-3 Primary Class Size Reduction479,395 557,441 360,000 550,000 550,000 - 0.0% Special Education - Regional Tuition - - - - - - *** Supplemental Lottery Allocation1,134,606 1,258,157 1,267,590 1,231,900 1,253,750 21,850 1.8% Textbooks- - - 71,486 - (71,486) -100.0% TOTAL TIER IV FUNDS1,644,775 $ 2,468,910 $ 2,087,895 $ 2,666,586 $ 2,762,700 $ 96,114 $ 3.6% SUBTOTAL STATE FUNDS45,853,987 $ 50,737,869 $ 50,143,100 $ 59,588,486 $ 61,656,600 $ 2,068,114 $ 3.5% TOTAL OTHER STATE FUNDS (MEDICAID)1,701,055 $ 2,074,473 $ 1,700,000 $ 1,900,000 $ 1,900,000 $ - $ 0.0% GRAND TOTAL STATE FUNDS47,555,042 $ 52,812,342 $ 51,843,100 $ 61,488,486 $ 63,556,600 $ 2,068,114 $ 3.4% LOCAL FUNDS Rent and Custodial Fees197,667 $ 43,553 $ 100,000 $ 200,000 $ 180,000 $ (20,000) $ -10.0% Adult and Continuing Ed Tuition36,627 10,055 47,179 35,000 35,000 - 0.0% Summer School & Intersession168,795 585 50,000 155,000 150,000 (5,000) -3.2% Textbook/Laptops Fees7,849 1,180 7,849 8,000 30,000 22,000 275.0% Refunds and Rebates25,511 62,830 25,511 65,000 65,000 - 0.0% Insurance Claims- 31,069 - - 30,000 30,000 *** Indirect Costs470,291 299,440 406,500 400,000 470,000 70,000 17.5% Other Local Funds12,377 73,944 175,166 150,000 75,000 (75,000) -50.0% TOTAL LOCAL FUNDS919,117 $ 522,656 $ 812,205 $ 1,013,000 $ 1,035,000 $ 22,000 $ 2.2% FEDERAL FUNDS ROTC Program 133,283 $ 138,527 $ 130,135 $ 140,000 $ 148,000 $ 8,000 $ 5.7% TOTAL FEDERAL FUNDS133,283 $ 138,527 $ 130,135 $ 140,000 $ 148,000 $ 8,000 $ 5.7% CITY APPROPRIATION231,669,496 $ 234,037,296 $ 239,437,296 $ 248,737,300 $ 258,686,800 $ 9,949,500 $ 4.0% TOTAL REVENUE280,276,938 $ 287,510,821 $ 292,222,736 $ 311,378,786 $ 323,426,400 $ 12,047,614 $ 3.9% OTHER SOURCES OF FUNDS 287,707,897 287,707,897 Transfer from Capital Fund$ 1,210,440 $ 1,200,000 $ 1,200,000 $ 1,200,000 $ - $ 0.0% OTHER USES OF FUNDS Preschool Program(1,555,604) (1,716,473) (1,791,567) (1,863,300) (2,030,546) (167,246) 9.0% Transfer to City Capital Fund- - - (3,774,100) - 3,774,100 -100.0% TOTAL OTHER FINANCING(1,555,604) $ (506,033) $ (591,567) $ (4,437,400) $ (830,546) $ 3,606,854 $ -81.3% NET CHANGES IN FUND BALANCES USE/ (GROWTH) (4,411,846) $ (6,381,659) $ 5,114,452 $ 9,319,437 $ 6,850,557 $ (2,468,880) $ -26.5% GRAND TOTAL FOR ALL SOURCES274,309,488 $ 280,623,129 $ 296,745,621 $ 316,260,823 $ 329,446,411 $ 13,185,588 $ 4.2%
City Appropriation: Total and Per Student
The chart above shows the city appropriation per student from the FY 2020 Actual through the FY 2024 Proposed Budget. The city appropriation per student will increase to $16,477 in FY 2024.
State Funds, $63.56 million
The chart on the following page shows state revenue trends compared to student enrollment. State revenue per student will be $4,048 for FY 2024, an increase of $118 over the prior fiscal year.
State funding is divided into four tiers:
• Standards of Quality
• Incentive
• Categorical
• Lottery
State funded accounts represent the second major funding source for ACPS. Additionally, State funding includes Medicaid revenue, which funds reimbursable healthcare-related expenses. Medicaid revenue will remain flat
at $1.90 million for FY 2024 based on actual claims reported and multi-year trend analysis.
State funds are projected to increase by 3.4 percent, or $2.07 million. Key changes in state funding for the FY 2024 budget compared with FY 2023 include: a $1.44 million increase in Basic Aid; a $0.1 million increase in Sales Tax; and, a $1.37 million increase in the Compensation Supplement category. Other specific categories of state funding, such as Special Education, Gifted, English as a Second Language, and Vocational (CTE), will either remain flat or decrease slightly.
The following is a summary of each tier:
Standards of Quality (SOQ) Accounts
The Standards of Quality encompass the requirements that must be met by all Virginia public schools and divisions. Standards for kindergarten through grade 12 are set by the State Board of Education, subject to revision only by the General Assembly, to provide school divisions with an incentive
Page 68 ACPS FY 2024 Proposed Budget Revenue
$231,669,496 $234,037,296 $239,437,296 $248,737,300 $258,686,800 $14,374 $14,969 $15,420 $15,900 $16,477 $13,000 $13,500 $14,000 $14,500 $15,000 $15,500 $16,000 $16,500 $17,000 $130,000,000 $150,000,000 $170,000,000 $190,000,000 $210,000,000 $230,000,000 $250,000,000 $270,000,000 FY 2020 Actual FY 2021 Actual FY 2022 Final FY 2023 Final FY 2024 Proposed City Appropriation per Student City Appropriation
Revenue
City Appropriation City Appropriation per Student
State Revenue: Total and per Student
to offer specific programs, and for general and categorical support of other educational programs and needs.
The General Assembly also apportions the cost of funding the SOQ between state and local governments. Each locality’s index is adjusted to maintain an overall statewide local share of 45 percent and an overall state share of 55 percent, adjusted for each locality by an equalization formula. The formula combines three separate measures of local fiscal capacity into a single index, which weighs a locality’s ability to pay relative to other localities in the state. The state funding formula requires that each locality match state funds with local funds.
The Composite Index of Local Ability-To-Pay is calculated using three indicators: true value of real property (weighted at 50 percent); adjusted gross income (weighted at 40 percent); and, taxable retail sales (weighted at 10 percent). This composite value is then divided by average daily membership (ADM) and population. Counties and cities with lower
composite index receive more state funding, while those with a higher index receive less.
Alexandria’s current composite index of 0.80 is the highest possible under the formula, which indicates ACPS will receive less state aid per pupil than the average school division in Virginia.
Basic Aid, the primary component of the SOQ, establishes standards for personnel, instructional materials, program and systemwide planning and management, as well as performance objectives for the Virginia Board of Education and local school divisions. Based on projected FY 2024 average daily membership (ADM), total Basic Aid is estimated to be $17.44 million next year, an increase of 9.0 percent from FY 2023.
Sales tax revenue is another key component of state funding and is projected to be $23.03 million in FY 2024 and represents an increase of 0.3 percent from FY 2023. Unlike other categories of state funding, sales tax is not
Page 69 ACPS FY 2024 Proposed Budget Revenue Revenue $47,555,042 $52,812,342 $51,843,100 $61,488,486 $63,556,600 $2,951 $3,378 $3,339 $3,930 $4,048 $2,000 $2,500 $3,000 $3,500 $4,000 $4,500 $25,000,000 $30,000,000 $35,000,000 $40,000,000 $45,000,000 $50,000,000 $55,000,000 $60,000,000 $65,000,000 $70,000,000 FY 2020 Actual FY 2021 Actual FY 2022 Final FY 2023 Final FY 2024 Proposed State Revenue per Student State Revenue
State revenue State Revenue per Student
Revenue
subject to the Local Composite Index formula prior to being distributed among school divisions.
The Commonwealth of Virginia distributes sales tax revenue to school divisions based on estimates of school-age population as provided by the Weldon Cooper Center for Public Service at the University of Virginia.
In addition, smaller amounts of SOQ funding are received for special education, vocational education, gifted education, remedial education, textbooks, state retirement, social security, group life insurance, English learners (EL), and remedial summer school. Like basic aid, each SOQ account is funded by an individual per pupil rate and equalized by the local composite index (LCI). The total FY 2024 SOQ funding is estimated at $49.68 million, an increase of 3.2 percent over FY 2023.
Incentive Accounts
Incentive-based payments from the state are not required by law but are intended to target resources for specific student or school needs statewide. To receive funding from this category, each school division must certify to the state that it will meet the requirements unique to each category. For FY 2024, incentive categories include funding for Instructional Technology, AtRisk initiatives, and Salary Improvements. The total FY 2024 funding from incentive accounts is estimated to be $4.57 million, an increase of $0.38 million compared to FY 2023.
Categorical Accounts
The various categorical programs focus on particular needs of special student populations to fulfill particular state obligations. State or federal regulations typically require these programs. Included in this group is funding for the homebound program. The total FY 2024 funding from categorical accounts is estimated to be $4.65 million.
Lottery Funded Accounts
The General Assembly established a tier
of funds for lottery proceeds in its budget beginning in FY 2009. Lottery proceeds now serve as the funding source for programs previously funded through the state general fund, including at-risk (split funded with incentive accounts), career and technical education, K-3 primary class size reduction, and supplemental lottery per pupil allocation. Lottery funded allocations to ACPS in FY 2024 will total $2.76 million, an increase of 3.6 percent from FY 2023, driven primarily by an increase in supplemental lottery per pupil allocation amounts.
Local Funds, $1.04 million
Included in this category is revenue received for adult and community education tuition, community use of school facilities, community partnerships/grants, summer learning tuition, tuition from students who reside outside the City of Alexandria, and other revenues such as fees from indirect cost recovery received from grant funding, lost textbooks replacement fees, and parking permits.
Local funds make up 0.3 percent of total Operating Fund revenue and are projected to increase by 2.2 percent for FY 2024.
Federal Funds, $0.15 million
Federal funding is projected to total $0.15 million in FY 2024, an increase of 5.7 percent from the previous year. Federal funds in the operating budget are provided for the ROTC program at Alexandria City High School. Federal programs are budgeted by the federal government a year in advance of actual use by localities, however actual entitlements are not known until the beginning of the school year.
Other Financing Sources and Uses, -$0.83 million
The Operating Fund includes certain transfers to the Grants and Special Projects Fund and
Page 70 ACPS FY 2024 Proposed Budget Revenue
to/from the Capital Improvement Project (CIP) Fund.
For FY 2024, a total of $2.03 million will be transferred from the operating budget to the Preschool Fund to support the division-wide preschool program for children eligible to receive services under Virginia Preschool Initiative (VPI). A transfer into the operating budget from the CIP Fund will total $1.20 million next year to offset the expenses of current planning and construction efforts.
The net of inflows and outflows of these funding sources for the FY 2024 operating budget is -$0.83 million.
Operating Fund Balance, $6.85 million
Per School Board policy, ACPS may utilize fund balance to support the Operating Budget each year. The amount used for this purpose should not exceed 1.75 percent of the Operating Fund expenditure budget. This results in the planned use of $6.85 million of operating fund balance to support expenditures. The ending fund balance as of June 30, 2021 was $21.62 million, an increase of $6.38 million over the prior year.
Community Use Program
Under School Board policy (policy KG), the Board may permit the use of school property by members of the community when such use will not impair the efficiency or educational mission of the school. The Superintendent develops guidelines and applications for use of school facilities. Requests for the use of any school facilities are made to the Superintendent or the Superintendent’s designee.
The Superintendent cooperates with the City in developing the City Facilities Use and Maintenance Agreement that establishes the guidelines for the mutual use and maintenance of schools and community facilities by and between the City and ACPS. The Superintendent may collaborate with
other organizations to develop other similar agreements for the use of school facilities.
As a result of this Board policy, the school system does incur some non-revenue generating expenses. Many of the activities directly pertain to the use of schools by various community groups including civic associations, scout troops, colleges, and universities. The City of Alexandria Department of Recreation, Parks and Cultural Activities, the Campagna Center, and the Electoral Board also use ACPS facilities. No rental or event fees are charged to these organizations, which represent shared resources with the City of Alexandria.
Many users of school facilities are not exempt from building use and custodial fees. Groups using school facilities are categorized by three organizational types for the purpose of charging fees: Groups A, B and C. These groups are defined in the fee schedule shown on the following page.
Revenues collected from the use of school facilities are deposited in the general Operating Fund as shown on the above table. The School Board initiated a revenue-sharing program during the 1998-1999 school year, enabling individual schools to share the rental fees collected from their building rentals. Effective FY 2016, schools will receive 20 percent of revenues collected, compared to 50 percent in prior years.
ACPS Fee Structure Overview
This section shows the types and rates of fees ACPS may charge for various activities, materials, and services for the upcoming fiscal year. Depending on current economic conditions as well as student/ family demographics, the Superintendent may recommend reducing or waiving certain fees for
Page 71 ACPS FY 2024 Proposed Budget Revenue
Revenue
GROUP A
FY 2024 Facility Use Fee Schedule
All Fees are Per Hour
This group includes Boy Scouts, Girl Scouts, and other youth groups designated as Patriotic Organizations under federal law, other school program-related or instruction-related organizations, bona fide ACPS alumni organizations, the Department of Recreation, Parks and Cultural Activities and other Alexandria City government organizations designated partners of ACPS including PTAC and local PTAs , and organizations with an existing Memorandum of Agreement (MOA) specifying facility use as in-kind services.
Facility use fees are waived for this group if documentation is provided to demonstrate authenticity of the above group and authority to act by the specific group member submitting the Request Form and proper arrangements for such use can be made through the Office of Educational Facilities and the School Principal.
Civic associations, elected officials and organizations whose function is to represent candidates for local or state elected office are included in this classification. When the purpose of an event held by these groups is political fundraising, they will be charged Group B Facility Use Fees.
Organizations included in Group A will still be responsible for applicable custodial security and “additional service” fees.
GROUP B
This group includes all nonprofit organizations that are not designated partners of ACPS or included in Group A above.
This group also includes civic associations, elected officials, and organizations whose function is to represent candidates for local or state elected office when holding political fundraising events.
GROUP C
This group includes all organizations who do not qualify for inclusion in any category identified above.
Although facility use fees are waived for Group A organizations, applicable custodial, security and “additional service” fees will still be charged.
FY 2024 Facility Use Fee Schedule – Additional Service Fees
*Use of Parker-Gray Stadium at Alexandria City High School will be limited to ACPS-approved events, as stipulated in Policy KG.
All requests for such events must be made by submitting a Request Form to the Superintendent or Superintendent’s designee.
**The cost of Minnie Howard will be consistent with elementary use fees.
ThtlitdbftllAdditilfhbl
1. Custodians (based on need, weather, type of program, estimated attendance). All groups are required to pay these fees, as applicable to the specific event.
$60.00 per hour/per custodian – Outside Regular Hours and/or Weekend (Custodial fees begin 30 minutes prior to the beginning of the facility use and end 30 minutes after the event concludes.)
2. The following fees are charged if the requested use requires additional ACPS staff or equipment. All groups are required to pay these fees as applicable.
P.A. Operator: $50.00 per hour (4 hour minimum)
Activity Supervisor: $25.00 per hour (4 hour minimum) – Alexandria City High School Only
Kitchen Personnel: $30.00 per hour (Food Services Contract Required)
Sound System: $40.00 per hour
Stage Lights: $12.50 each
Piano: $25.00 per use
Special Trash Pick-Up: $200.00 flat fee
Kitchen Equipment: $12.00 flat fee
3. Events which required additional cleanup besides routine custodial work will be charged a cleanup fee. This includes but is not limited to events in which refreshments are served, craft activities are involved, or there is use of locker rooms. All groups are required to pay this fee when the event qualifies.
$125.00 (Gym, Cafeteria, Auditorium)
$ 17.50 (per classroom rented)
Page 72 ACPS FY 2024 Proposed Budget Revenue
Type of OrganizationAuditoriumsCafeteriasClassroomsGyms
Revenue
High School $200.00 High School $125.00 High School $200.00 Middle Schools $150.00 Elementary Schools $100.00 High School $400.00 High School $475.00 High School $575.00 Middle Schools $350.00 Elementary Schools $300.00
All Levels $30.00
All Levels $40.00 All Other Schools $250.00 All Other Schools $350.00 All Other Schools $100.00 All Other Schools $80.00
Community Services Program
Revenues Collected in FY 2022
MacArthur
K. Polk
Adams
Vernon
L. Brooks
Henry
W. Tucker
a specific school/fiscal year.
The following fees are deposited into the Operating Fund:
• Regular Day School Tuition
• Extended Learning/Summer Learning Tuition
• ACHS Adult Education Tuition
• Custodial and Facilities Building Use Fees
• Facilities Rental Fees (80 percent)
• Parking Permit Fees
• Textbooks and Laptops Replacement Fees
Breakfast and lunch revenues are deposited into the School Nutrition Fund to support that program. The remaining fees are deposited with the schools and go directly to cover costs associated with the items or services for which they are charged.
Page 73 ACPS FY 2024 Proposed Budget Revenue
Revenue
Schools and Central Office Rental Fees** Custodial Fees Total Charles Barrett - $ - $ - $ Cora
- -Douglas
- -George
- -James
- -Jefferson-Houston - -John
- -Lyles-Crouch - -Mount
- -Naomi
- -Patrick
- -Samuel
- -William
- -Francis
Hammond - -George Washington - 960 960 ACHS - Minnie Howard 1,000 1,590 2,590 Alexandria City High School - -Grand Total 1,000 2,550 3,550
Kelly
Mason
Ramsay
C.
** Rental Fees are shared with schools and managed through the school local activity fund accounts.
Page 74 ACPS FY 2024 Proposed Budget Revenue Revenue TuitionBooksFeesTotal Free and Reduced-Price Meal Eligible Tuition & Fees Elementary18,500.00 - - 18,500.00 NA Secondary 19,250.00 - - 19,250.00 NA Special Education Elementary and Secondary33,260.00 - - 33,260.00 NA Extended Learning Opportunities Grades K-5 Modified Calendar, two week session ¹125.00 - 125.00 10.00 Summer Learning Grades K-5 Rising Kindergarten Summer Language Academy, three week session (weeks 2 and 3)² 100.00 - - 100.00 25.00 Summer Language Academy, three week session (Grades 1-5)3 150.00 - - 150.00 50.00 One new course - on-site (for EL) 60.00 - - 60.00 60.00 One new course/acceleration - online 285.00 - - 285.00 60.00 One new course including Health and PE Grades 9 & 10, and Human Growth & Development 285.00 - - 285.00 60.00 Economics and Personal Finance course - faceto-face 285.00 - - 285.00 60.00 Economics and Personal Finance course - online 285.00 - - 285.00 60.00 One new semester course (Trigonometry, PreCalculus) or Enrichment course (SAT prep) 115.00 - 60.00 175.00 175.00 One repeat course (credit recovery) 60.00 - - 60.00 60.00 Two repeat courses120.00 - - 120.00 60.00 SAT/ACT Prep course (12 hours)150.00 - - 150.00 50.00 Resident100.00 30.00*- 130.00 NA Nonresident175.00*30.00*- 205.00 NA Resident100.00 50.00*30.00*180.00 NA Nonresident175.00*50.00*30.00*255.00 NA GED Battery Exam (4 subjects) -30.00* per subject 120.00* NA GED Ready Exam (4 subjects) -6.00* per subject 24.00* NA GAIN Replacement Test - Outside of Registration Period (2 subjects) -2.20* per subject 8.80* NA Resident110.00*- - 110.00*NA Nonresident 150.00*- - 150.00*NA Resident150.00*- - 150.00*NA Nonresident 212.00 - - 212.00 NA Elementary Schools and Secondary Schools Musical instrument rental (students)⁵ - - 100.00 100.00 NA Shoulder rest & rockstop- - 20-25.0020-25.00NA Rosin- - 5-7.005-7.00NA Uniform rental - - 10-25.0010-25.00NA District audition- - 9-20.009-20.00NA District participation - - 25-50.0025-50.00NA T-shirt- - 10-15.0010-15.00NA Solo and Ensemble- - 7-12.007-12.00NA Music method book- - 9-18.009-18.00NA Reeds- - 2-25.002-25.00NA Valve and slide oil- - 1.00 1.00 NA Grades 6-12 music ensemble operations- - 10.00 10.00 NA Senior Regional Instrumental Audition- - 10.00 10.00 NA Senior Regional Instrumental Participation- - 20-30.0020-30.00NA All-State Audition- - 10-25.0010-25.00NA All-State Participation- - 25-40.0025-40.00NA Marching Band Activity Fee- - 175.00 175.00 NA Marching Band Shoes- - 30.00 30.00 NA Choir Activity Fee- - 100.00 100.00 NA Secondary SchoolsGym suit - shirt/shorts (optional) - - 6.00 6.00 NA Gym sweat pants (optional) - - 10.00 10.00 NA PE Activity - - 5.00 5.00 NA Lock replacement for PE locker room - - 3-5.003-5.00NA Culinary Arts Uniform- - 25.00 25.00 NA Drama Personal make-up kit- - 22.00 22.00 NA After School Dance- - 30-60.0030-60.00NA Grades 6-8 Drama Class- - 30.00 30.00 NA Mainstage Participation- - 50-75.0050-75.00NA National Honor Society Membership card, certificate and graduation tassel - - 15.00 15.00 NA Tuition, Course, and Food Service Fees Effective July 1, 2023 through June 30, 2024 General Education Adult Education * Fees currently under review for FY 2023 Regular Day High School DiplomaOnline (One class) High School DiplomaOnline (Two classes) Adult Basic Education (ABE) / General Education Diploma (GED) Program Grades 9-12 Orchestra and Band GED Testing Services English Learners (EL) Day/Evening Levels 1-6 Secondary Schools Clubs, Classes, and Organizations (Alexandria City High School) Physical Education
Revenue
Tuition, Course, and Food Service Fees
Effective July 1, 2023 through June 30, 2024
¹The first 2 children in any family will be expected to pay the Modified Calendar-Extended Learning fee. Any additional children will be allowed to attend tuitionfree.
²Rising kindergarten students attend K-Prep, at no charge, during week 1 and Summer Language Academy for weeks 2 and 3, at the tuition noted above.
3The first 2 children in any family will be expected to pay the Summer Language Academy fee. Any additional child is $50.00 or $15.00 for students eligible for free and reduced-price meals.
⁴Students on Scholarship are required to pay the tuition noted above toward program goals.
⁵Students eligible for free meals are not charged musical instrument rental. Students eligible for reduced-price meals are charged $25.
Page 75 ACPS FY 2024 Proposed Budget Revenue
TuitionBooksFeesTotal Free and Reduced-Price Meal Eligible Tuition & Fees
Future Business Leaders of America (FBLA) New membership- - 15.00 15.00 NA New membership- - 20.00 20.00 NA Returning membership- - 15.00 15.00 NA Cosmetology Lab jacket- - 25.00 25.00 10.00 DECA National/State dues and graduation stoles- - 20.00 20.00 NA German Club/German Honor Society Membership- - 2.00 2.00 NA French Honor Society National membership- - 3.00 3.00 NA Dragon Slayers Books and dice bags (optional)- - 10.00 10.00 NA Uniform (Damaged or Replacement)- - 250.00 250.00 NA Activity fee- - 50.00 50.00 NA Automotive Technology Shirt (optional)- - 30.00 30.00 NA Science Science lab (George Washington)- - 5.00 5.00 NA Elementary Schools Laptop replacement. $200 for Chromebook and $30 for adaptor and cord - - 230.00 230.00 NA Agenda replacement - - 5.00 5.00 NA Textbook and Library books (damaged or replacement) - - NA Student's education records, per page and actual cost of postage - - 0.25 0.25 NA Hallway lock replacement - - 3.00 3.00 NA Laptop replacement. $300 for Chromebook and $30 for adaptor and cord - - 330.00 330.00 NA Parking permit for Senior class (Per semester) - - 80.00 80.00 NA ID card replacement- - 5.00 5.00 NA Adult- - NA Student- - 2.00 2.00Adult- - 4.00 4.00 NA Grades K-5- - 3.05 3.05Grades 6-12 - - 3.25 3.25Milk (additional)- - 0.60 0.60 NA
School Meal Breakfast
A la Carte Miscellaneous
Student Fees
Lunch Based on text Alexandria City High School National
Secondary Schools JROTC
English Honor Society
Operating Fund Expenditure Overview
The FY 2024 Budget expenditures total $329.45 million, a 4.2 percent increase from last fiscal year.
The total expenditures and positions from FY 2020 through the FY 2024 Budget are shown in the table below, organized by major expenditure category.
ACPS expenditures are composed primarily of salary and employee benefit costs. These two items alone total $285.85 million and constitute approximately 86.8 percent of the FY 2024
Operating Fund Budget.
The pie chart below shows how both contract and non-contract compensation pay are allocated among the primary employee groups in ACPS. Salary and wage payments for all teacher scale positions account for the largest portion of total personnel costs.

Compensation has increased yet FTEs have only increased by 1.5 per the chart below. This increase in salaries and benefits is driven primarily by compensation improvements for current ACPS staff, and increases in both retirement and health insurance premiums.
Operating Fund
FY 2024 Proposed Budget
Contract Salaries, Employee Benefits and Supplemental Pay by Employee Group
Total $285.85 Million
Principals and Assistant Principals: Includes all school principals and assistant principals
5.7%
Other Admin: Includes other licensed and support administrators
4.8%
Teacher Scale: Includes teachers, library media specialists, school counselors, nurses, social workers and other teacher scale positions.
67.3%
Support Scale: Includes paraprofessionals, bus drivers, custodians, security, technical and clerical staff
22.1%
Expenditures ACPS FY 2024 Proposed Budget Page 76
Expenditures
Operating Fund Expenditure by Character % Change DollarFTEDollarFTEDollarFTEDollarFTEDollarFTEDollarFTEDollar Salaries 173,523,381 $ 2,322.27 174,991,957 $ 2,422.70 184,738,851 $ 2,422.70 195,599,557 $ 2,438.00 204,321,000 $ 2,439.50 8,721,443 $ 1.50 4.5% Employee Benefits 67,480,510 - 71,835,743 - 75,440,907 - 80,714,551 - 81,532,037 - 817,486 - 1.0% Purchased Services 13,857,201 - 13,636,023 - 14,935,258 - 16,905,115 - 18,720,371 - 1,815,256 - 10.7% Internal Services - - - - 61,874 - 63,241 - 68,573 - 5,332 - 8.4% Other Charges 10,899,171 - 9,015,582 - 11,165,114 - 11,105,072 - 12,441,263 - 1,336,191 - 12.0% Materials and Supplies 6,506,092 - 7,278,569 - 8,515,690 - 10,294,161 - 10,804,126 - 509,965 - 5.0% Capital Outlay 2,043,133 - 2,654,814 - 1,887,927 - 1,507,640 - 1,559,041 - 51,401 - 3.4% Grand Total274,309,488 $ 2,322.27 279,412,688 $ 2,422.70 296,745,621 $ 2,422.70 316,189,337 $ 2,438.00 329,446,411 $ 2,439.50 13,257,074 $ 1.50 4.2% Change FY 2023 Final to FY 2024 Proposed Expense Category FY 2020 ActualFY 2021 ActualFY 2022 FinalFY 2023 FinalFY 2024 Proposed
Expenditures
The pie chart below shows the major sources of expenditures in the non-personnel category. Non-personnel expenditures total $43.59 million and constitute 13.2 percent of the total ACPS budget in FY 2024. This total is up $3.72 million from FY 2023. Within the total non-personnel budget, the largest categories are Maintenance Services and Contracts, Leases and Rentals, Professional Services, Other Purchased Services, Technology, and Classroom Supplies.
In the FY 2024 Budget, the largest non-personal expenditure is Maintenance Services and Contracts. The second largest non-personnel expenditure is Other Purchased Services (like online SOL testing, SPED tuition support, exemplary program support, various consulting fees, etc.).
ACPS Debt Policy
The City Council (Council) annually approves
the Board’s total annual General Fund budget appropriation, levies taxes, and issues debt for school projects. The legal liability for the general obligation debt issued for school capital assets remains with the City. Funds also are received from state and federal sources for general school aid and specific grant purposes, respectively.
The Council is prohibited from exercising any control over specific appropriations within the operating budget of the Board. ACPS is considered to be a discretely presented component unit of the City because ACPS is fiscally dependent on the City and its operations are funded primarily by payments from the City’s general fund. The Board has the discretionary authority to expend the amount appropriated to it by the Council.

Page 77 ACPS FY 2024 Proposed Budget Expenditures
% % % % % % % % Classroom Supplies 9.0% Other Supplies 3.1% Communications 2.0% Internal Services 0.6% Leases and Rentals 11.9% Maintenance Services and Contracts 26.9% Other Capital Outlay 0.6% Other Purchased Services 12.0% Professional Services 7.7% Technology 9.4% Textbooks 1.3% Transportation 2.6% Travel and Other Miscellaneous 2.9% Utilities 9.2% Operating Fund FY 2024 Proposed Budget Non-Personnel Expenditures Total $43.59 million
Budget Drivers and General Sources of Change
Many factors have a direct impact on the overall level of ACPS budgeted expenditures and may, therefore, change the budget from one year to the next. This fiscal year saw a notable increase in grants due to the provision of ESSER funding.
Enrollment is the largest driver of cost in any school division. Enrollment projections are recalculated every year using the September 30th enrollment data as reported to the Virginia Department of Education (VDOE) for preliminary enrollment projections. Increased student enrollment requires additional teachers and other school-based staff, classroom materials, and textbooks. Increases in these areas place constraints on school capacity and transportation.
The following descriptions outline major areas that are impacted by enrollment.
Personnel and Allocation of Positions
Enrollment drives staffing for elementary homeroom, physical education, art, vocal music and library/media staffing, as well as divisionwide English learner and specialized instruction staff
Middle and high school staffing is regularly reviewed, especially if there are significant changes in enrollment, course registrations, or if the addition of approved courses warrants a review.
Each year specialized instruction positions are reallocated across schools to correspond to the projected enrollment of special education students and their specific instructional requirements as dictated by their Individualized Education Programs (IEP).
Similarly, English learner (EL) teacher positions
are reallocated across schools each year to respond to projected enrollment and the proficiency level of students.
More information on specialized instruction and EL staffing can be found in the Information section.
Salaries
Increases in the salaries account are the result of additional staff positions coupled with adjustments to current salaries. This increase is driven primarily by enrollment-driven staffing and compensation improvements for current ACPS staff
Savings are typically realized each year as the result of lapse or turnover savings. Turnover savings result when the actual cost of a replacement hire is less than the budgeted cost based on the incumbent employee. Savings that result from a position that remains unfilled for a certain period of time are referred to as vacancy savings and also are a component of the budgeted lapse figure.
Benefits
Most ACPS benefit costs are driven by salaries, meaning they are calculated as a percentage of the salary paid to each individual. This year, there was a no change to the Virginia Retirement System (VRS) retirement rates. Per Senate Bill 497, employees will continue to contribute 5.0 percent of eligible salary to the plan.
The premium rates for the UHC Point of Service (POS) plan and the Kaiser plan are each expected to increase by 6.5% respectively. Both the employer and employee contribute to these premiums.
Non-Personnel
Formula-based allocations for schools, including base allocations, are determined
Expenditures ACPS FY 2024 Proposed Budget Page 78
Expenditures
Expenditures
based on the official enrollment reports as of September 30th as submitted to the VDOE. Details on these school allocations are contained in the Information section of this document.
Changes in the cost of doing business, such as office supplies, paper, utilities, fuel, rent, and maintenance/repair costs also have been incorporated into the FY 2023 Budget, based on specific analyses for each area.
Employee Benefits
Employee benefits include various non-cash compensations provided to employees in addition to their salaries or wages. Employee benefits are ongoing expenses for which the school division contributes a portion or all of the cost for its employees. Components of employee benefits include statutory, mandatory, and optional benefits.
ACPS provides the following employee benefits:
Statutory benefits:
• Federal Insurance Contributions Act (FICA)/ Social Security and Medicare
• Unemployment Compensation
• Workers’ Compensation
Mandatory benefits for which eligible employees are automatically enrolled include:
• Virginia Retirement System (VRS)
• VRS Retiree Health Insurance Credit (RHIC)
• VRS Basic Group Life Insurance
• ACPS Supplemental Retirement Plan
• Disability Insurance Plan
Optional benefits for which eligible employees may choose to participate include:
• Optional Group Life Insurance
• Tax Sheltered Annuities 403(b) and 457(b) Plans
• Health Insurance: Medical, Dental, and Vision Plans
• Dependent Care, Health Care Flexible Spending, and Health Care Savings Accounts
Other benefits offered to employees include:
• Leave Program (sick leave, personal leave, annual leave, family and medical leave)
• Employee Assistance Program
• Termination Benefits
• Education/Tuition Assistance
• National Board Certification
ACPS also offers health insurance to its eligible retirees for medical, dental, and vision.
Information regarding ACPS employee benefits, including the school division’s costs for these benefits is summarized in the following pages. Additional details can be found on the ACPS website at https://www.acps.k12.va.us/ Page/517.
Federal Insurance Contributions Act (FICA)/ Social Security and Medicare
Participation and rates are mandated by law. FICA is a federal program that requires both employees and employers to fund Social Security benefits that include retirement, Old-Age, Survivors and Disability Insurance (OASDI) and Medicare, which provides hospital or medical insurance.
In total, ACPS contributes 7.65 percent of employees’ salary. For calendar year 2021 the employer tax rate for the Social Security portion of FICA is 6.2 percent of earnings up to $142,800 and the tax rate for the Medicare portion of FICA is 1.45 percent.
Unemployment Compensation
Participation is mandatory and rates for unemployment compensation are determined by the state. The school system is considered a Reimbursable Employer and makes quarterly payments to the Virginia Employment
Page 79 ACPS FY 2024 Proposed Budget Expenditures
Expenditures
Commission. The budget for unemployment insurance is $0.13 million for FY 2024, unchanged from FY 2023.
Workers’ Compensation
Workers’ compensation is a mandatory program. In 1992, the school system instituted a self-insured program administered by a thirdparty administrator. The budgeted amount is based on an estimate of the open claims ACPS pays each fiscal year. The budget for workers’ compensation insurance is $1.25 million for FY 2024, an increase of $0.3K from FY 2023.
Virginia Retirement System (VRS)
Participation and rates are governed by state regulations. VRS rates have increased significantly over the past several years, as shown on the table on the following page. The VRS Board has worked to comply with
Governmental Accounting Standards Board (GASB) requirements to fully fund the long-term liability for retiree benefits.
For FY 2024, the total contribution, relative to projected compensation will remain at 21.62 percent of covered compensation for the professional groups, while Non-professional groups will also remain at 7.25 percent of covered compensation. VRS Plan 1 and Plan 2 members continue to pay 5.0 percent of their salary towards the plan.
The VRS Hybrid Retirement Plan will apply to most employees hired on or after January 01, 2014. The hybrid plan combines the features of a defined benefit plan and a defined contribution plan. Upon retirement, the defined benefit plan pays a monthly retirement benefit based on age, total service credit and average final compensation, whereas a defined contribution plan provides a retirement benefit
Employee Benefit Costs
Expenditures ACPS FY 2024 Proposed Budget Page 80
Benefits FY 2020 Actual FY 2021 Actual FY 2022 Final FY 2023 Final FY 2024 Proposed Change FY 2023 Final to FY 2024 Proposed ($) Change FY 2023 Final to FY 2024 Proposed (%) ACPS Supplement Retirement$ - $ - $ - $ - $ - $ NA Car Allowance12,000 12,000 12,000 12,000 12,000 - 0.0% Criminal Record Check2,383 21,406 30,000 30,000 30,000 - 0.0% Dental Insurance855,825 887,609 975,482 980,738 988,511 7,773 0.8% Education/Tuition Assistance279,116 295,984 194,400 185,493 264,850 79,357 42.8% Division-Wide Benefits- - - - - - NA Employee Assistance- - 40,000 40,000 40,000 - 0.0% FICA10,431,467 10,504,496 11,509,988 12,146,923 12,782,809 635,886 5.2% Hospital/Medical Plans21,584,683 22,988,852 24,308,975 26,024,183 24,436,024 (1,588,159) -6.1% ICMA Defined Contribution1,186,400 1,358,268 2,061,815 2,077,898 1,975,586 (102,312) -4.9% Long Term Care2,803 2,803 - - 3,000 3,000 NA LT Disability Ins- Hybrid105,023 112,241 142,500 143,264 163,978 20,714 14.5% LT Disability Insurance188,726 180,989 211,106 188,824 188,843 19 0.0% Medicare 2,446,985 2,460,441 2,695,171 2,860,124 3,021,549 161,425 5.6% Moving Expenses 4,412 - - - - - NA National Board Certification24,550 30,227 38,000 38,000 38,000 - 0.0% Parking Incentive 10,000 - - - - - NA Retiree Health1,705,515 2,780,267 2,477,177 2,600,000 2,570,000 (30,000) -1.2% Short Term Disability215,570 209,411 226,537 235,893 224,359 (11,534) -4.9% Short-Term Disability:Hybrid91,542 108,636 129,782 178,947 194,932 15,985 8.9% Termination Benefits755,754 641,604 1,000,000 1,000,000 1,000,000 - 0.0% Unemployment Insurance238,389 201,111 130,000 130,000 130,000 - 0.0% VRS Benefits Hybrid Plan7,732,110 8,754,361 9,388,526 11,010,559 12,579,601 1,569,042 14.3% VRS Group Life Insurance845,425 880,780 394,229 1,003,775 1,061,605 57,830 5.8% VRS Retirement15,592,327 15,700,056 16,451,505 16,389,630 16,273,504 (116,126) -0.7% VRS RHIC1,726,423 1,921,289 2,073,715 2,188,300 2,302,886 114,586 5.2% Workers' Compensation1,443,080 1,782,913 950,000 1,250,000 1,250,000 - 0.0% Grand Total $67,480,510 $71,835,743 $75,440,907 $80,714,551 $81,532,037 817,486 $ 1.1%
Expenditures
based on contributions to the plan and the investment performance of those contributions.
program provides eligible retired teachers and other retired professional groups a monthly health insurance credit to be used towards the cost of their individual health insurance premiums if they retire with at least 15 years of VRS credited services. The monthly health insurance credit amount is $4 per year of service, not to exceed the amount of the retiree’s health insurance premium for single coverage.
The employer contribution rate for the RHIC is 6.9 percent of covered compensation for FY 2024, an increase of 8.6 percentage points from FY 2023.
VRS Basic Group Life Insurance
Note: Beginning in FY 2013, employees contribute 5.00 percent of compensation to the plan in accordance with Senate Bill 497. Previously, the employee share was paid by ACPS. This 5.00 percent employee contribution is included in the total percentages listed in this table.
VRS Hybrid Retirement Plan members automatically contribute 4.0 percent of their covered compensation to the defined benefit plan and 1.0 percent to the defined contribution plan. Hybrid plan members may voluntarily contribute up to an additional 4.0 percent to the defined contribution plan, for a total of 5.0 percent contributed to this plan. ACPS matches this additional, voluntary contribution up to 3.5 percent. Additional information on the VRS Hybrid plan can be found at www.varetirement. org/hybrid.
The total VRS budget is $30.59 million, an increase of $2.28 million based on the rate changes described in this narrative.
VRS Retiree Health Insurance Credit (RHIC)
Participation in the VRS Retiree Health Insurance Credit program is mandatory for the professional employee group. The RHIC
Participation in VRS Basic Group Life Insurance is mandatory for all eligible employees. For FY 2024, the Group Life Insurance Program rate is projected to be 1.31 percent of the annual covered payroll. The employer portion will be 0.52 percent.
ACPS Supplemental Retirement Plan
Participation is mandatory and eligible employees are automatically enrolled in the Supplemental Retirement Plan currently managed by Principal Financial Group. As of January 01, 2013, the employee contribution is 1.5 percent and there is no ACPS contribution to the plan.
Tax Sheltered Annuities 403(b) and 457 Plans
ACPS provides employees with optional retirement savings plans: 403(b) and/or 457(b) plans. Both plans allow employees to set aside a portion of their salary on a pre-tax basis in accordance with Internal Revenue Service regulations. Employees are entirely responsible for managing the investment of their 403(b) and/ or 457(b) plans. A third-party administrator, TSA Consulting Group, manages compliance with IRS regulations.
Page 81 ACPS FY 2024 Proposed Budget Expenditures
Fiscal Year Professional Employees NonProfessional Employees 202421.62 7.25 202321.62 7.25 202221.62 7.25 202121.62 7.25 202020.68 7.25 201920.68 7.25 201821.32 7.25 201719.66 7.25 201619.06 10.64 201519.50 10.64
Expenditures
Health Insurance – Medical, Dental and Vision Plans
Participation in the ACPS health, dental or vision insurance program is optional.
Effective July 1, 2015, eligible employees are offered the choice of two medical plans: (1) a Health Maintenance Organization (HMO) plan with Kaiser Permanente and (2) a Point of Service (POS) plan with United Healthcare (UHC). Participants in the United Healthcare plan will automatically be enrolled in the prescription drug plan with CareFirst CVS/ Caremark. A third, high deductible plan is offered again in FY 2024.
This fiscal year, premiums for both Kaiser and United Healthcare plans are projected to increase by 7.5 percent.
In FY 2023, ACPS contributed between 80 percent and 90 percent of the health insurance premiums for full-time employees, depending on the employee group. Similarly, for parttime employees, ACPS contributed between 60 percent and 70 percent of the premiums, depending on the employee group. In FY 2024, the employee cost share for full-time administrators will increase by four percentage points from 16 percent to 20 percent, resulting in a 80/20 split. This change creates greater equity among employee groups.
CareFirst is the new dental insurance carrier, replacing MetLife, effective July 1, 2017. This change will provide members with access to a broad dental provider network, same dental coverages, and lower premiums. The FY 2024 projected cost for the dental plan increased by $0.05 milion from FY 2023. Employer costs are projected to be $0.98 million in FY 2024.
The vision plan offered by ACPS is through EyeMed and is paid solely by the employee. Premiums for the vision plan remain the same for FY 2024.
Dependent Care and Health Care Flexible Spending Accounts
Participation in the health care and dependent care flexible spending account is optional. Flexible Spending Accounts allow employees to set aside money to be used for eligible out-of-pocket health care and dependent care expenses using pre-tax dollars. The maximum election for the plan year has increased to $2,600 from $2,550. Participants in the healthcare FSA will be allowed to carry over to the next plan year a balance of up to $500. The dependent care flexible spending account will remain unchanged at $5,000.
Disability Insurance
ACPS offers a short-term and long-term disability program to all eligible employees. The disability program is an ACPS-pay-all plan, and eligible employees are automatically enrolled in the short-term and long-term disability plans. The Hartford Life Insurance Company is the third-party administrator for the short-term disability plan and also the insurance carrier for the fully insured long-term disability plan. The annual cost for the administrative fees of the short-term disability plan is estimated to total $0.1 million.
Long-Term Sick Leave
Eligible employees may take leave under the terms of the Family and Medical Leave Act (FMLA). Employees may use accumulated leave and/or donations of sick leave from other employees to continue to receive compensation payments during this time.
Employee Assistance Program
ACPS offers an employee assistance program which is embedded with the long-term disability program, and there is no additional cost to ACPS or its employees.
Expenditures ACPS FY 2024 Proposed Budget Page 82
Expenditures
Retiree Health Insurance Benefits
ACPS employees who retire while enrolled in an ACPS medical plan are eligible for an ACPS subsidy of up to $265 per month towards their retiree medical premiums. Retirees whose medical insurance premiums are less than this subsidy amount receive the amount of their actual premiums.
Medical plans available to eligible retirees include the same plans offered to active ACPS employees. In addition, retirees and their dependents who are Medicare eligible may choose to participate in a Medicare Advantage Plan currently with United Healthcare or HMO Medicare Plus with Kaiser.
Termination Benefits
ACPS’ leave program includes sick leave, personal leave and annual leave. Rates of leave accrual vary based on employee groups for professional, support, and administrative staff. Eligible employees are paid for unused annual and sick leave when they retire or leave their employment with ACPS. A maximum of 45 days of annual leave may be paid out at termination. Upon termination of employment, employees may receive a lump-sum payment based on the rate approved by the Board.
Education/Tuition Assistance
Courses eligible for tuition assistance for teachers and administrators will be classified according to the ACPS priority areas and may vary from year to year. Details of education tuition assistance for licensed and support employees are available on the ACPS website at https://www.acps.k12.va.us/Page/524. The budget for tuition assistance totals $0.19 million, a slight reduction from last year.
National Board Certification
National Board Certification is an optional program. The National Teacher Exam (NTE)
is a standardized examination that provides objective measures of academic achievement for those completing teacher education programs. ACPS pays the fees for selected new teachers. In addition, a contract premium of $2,200 is awarded to these teachers annually.
Page 83 ACPS FY 2024 Proposed Budget Expenditures
Capital Improvement Program
Capital Improvement Program (CIP) Introduction
circumstances and the need to reprioritize.
Strategic Planning Framework
Equity is an essential part of the ACPS 2025 Strategic Plan. This is particularly relevant in the facilities we offer our students and staff. This plan pledges to work for the modernization of schools so that every student has not just a beautiful building and learning space, but optimal learning environments with access to program opportunities.
The chart on the next page reflects ACPSs commitment to the School Board’s CIP Budget Priorities. Projects are listed under each priority and remain the focus of project execution throughout the 10 year CIP:
1. Systemic Alignment: This includes building systems and security upgrades to ensure our buildings are aligned.
The Alexandria City Public Schools (ACPS) FY 2024-2033 Capital Improvement Program (CIP) is framed by several major considerations: Systemic Alignment, Instructional Excellence, Student Accessibility and Support, Strategic Resource Allocation, Family & Community Engagement.
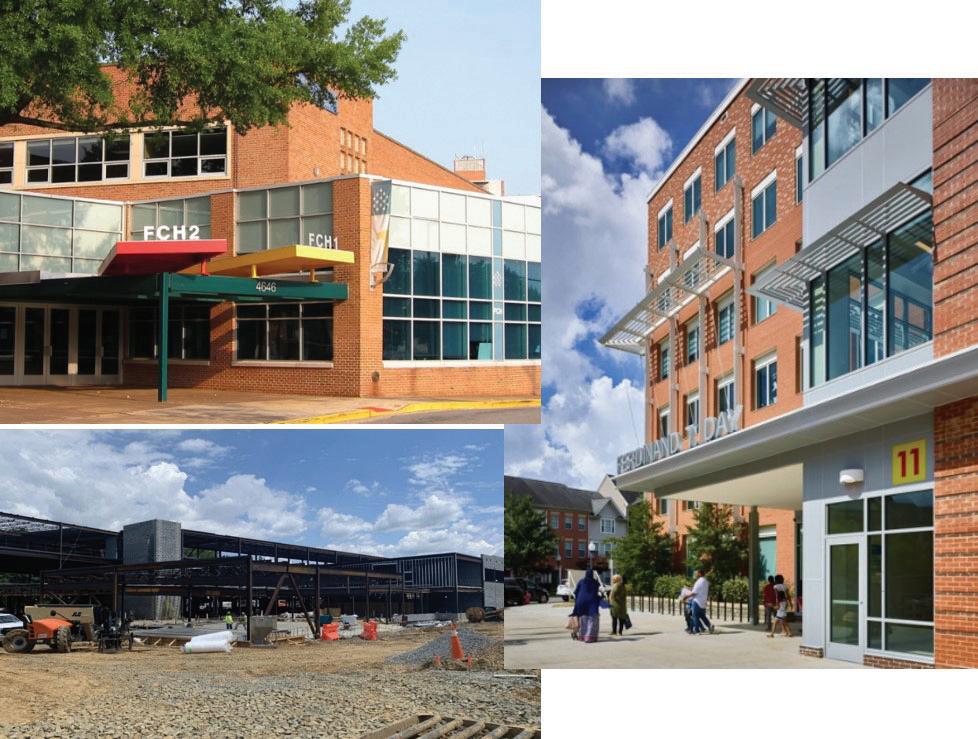
ACPS incorporates current enrollment information, program requirements, city population data, and planning & zoning assessments, along with principal and department head needs. In addition, staff uses operations and maintenance data, School Board strategic plans and facility needs assessments to determine capital needs. The Capital Improvement Program adoption reflects the annual commitment to a series of projects with estimated costs based on current knowledge,market conditions and priorities.
The City of Alexandria defines a capital project as one that acquires or improves a physical asset with a useful life of three or more years for greater than $10,000 not including daytoday maintenance tasks. While the program serves as a long range plan, it is reviewed and revised annually based on current planning
2. Instructional Excellence:
In recent years, the CIP has exanded to include textbooks and technology upgrades.
3. Student Accessibility and Support: This category includes transportation, kitchen, access and playground projects to provide the necessary supports for our students.
4. Strategic Resource Allocation: This focus ensures that we are adequately funding schools which are being replaced or modernized as well as considers capacity, interim use and complete renovation during any of our major projects.
5. Family and Community Engagement: This focus ensures that we are engaging our community and families on all major projects and allows for time in the projects to be transparent and obtain feedback.
FY 2024-2033 CIP Funding Request
This budget request contains three primary drivers:
1. Increasing capacity to accommodate anticipated enrollment growth and student needs
2. Modernization to aggressively address unmet facilities needs through a comprehensive approach
Page 84 ACPS FY 2024 Proposed Budget Capital Improvement Program
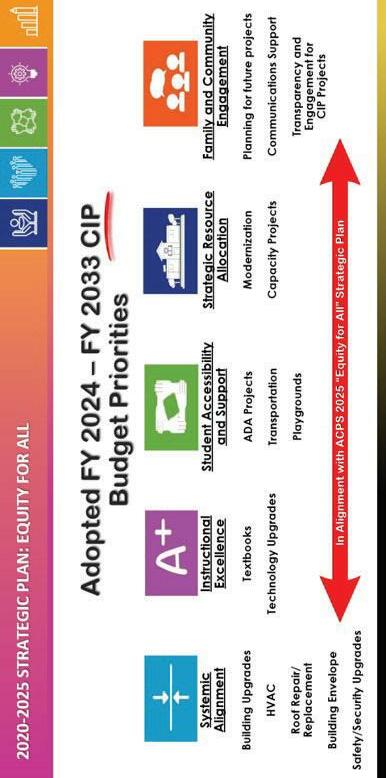
Program Page 85 ACPS FY 2024 Proposed Budget Capital Improvement Program
Capital Improvement
Capital Improvement Program
3. On-going major repairs of facilities that are not scheduled to be modernized within the 10year program
The ACPS School Board does not have the funding authority to issue debt, therefore the City of Alexandria City Council approves the appropriate funding option per the project requests.
The total CIP budget is $457,257,200. This is $40.5M less than the total ten-year City Council approved FY 2023-2032 CIP; which can be largely attributed to to the full funding of the High School Project in FY 2023 and reflects ACPS’s commitment to its partnership with the City in being fiscally responsible with taxpayers’ dollars.
The FY 2024-2033 Proposed CIP does include a deficit of $23.9M in the FY 2024 budget year which is largely due to cost escalations experienced or anticipated on FY 2023 and FY 2024 projects due to supply-chain challenges industry-wide. ACPS staff made every effort to defer projects which were not critical in FY 2024.
Please refer to the CIP Budget Summary Chart found on the last page of this section for details.
Educational Facilities Department and the CIP
The Educational Facilities Department of ACPS manages and executes the ACPS Capital Improvement Program. The department executes tasks ranging from small maintenance projects to the design and construction of new school buildings to increase capacity.
Capacity Program
The capacity portion of the CIP program totals $286,532,600 over the 10-year period. This includes funding for design, project management support for the renovation of existing buildings, and construction of additional capacity where necessary.
Major components of the Capacity Program are:
1. Adding Capacity: Based on enrollment projections completed in December 2021 based on September 30, 2021 enrollment, enrollment is expected to continue to increase but at a slower rate, or remain flat. There was a decrease in enrollment due to COVID-19 that has impacted this projection; however, enrollmentalready exceeds capacity in many of ACPS’s facilities and growth may increase in the future close to pre-pandemic levels. Enrollment will continue to be monitored to identify any long-term impacts.
Elementary Capacity will be added with replacements or major renovations, which will likely require temporary displacement of the school. George Mason and Cora Kelly are proposed for total replacement. Budgets for the replacement of these schools is included in the FY 2024-2033 budget. Funds for an adpative use project at the office building at 1703 N. Beauregard are also proposed in this budget, with the space intended to be used as swing space during George Mason and Cora Kelly construction before becoming a 600-student school.
Secondary Capacity will be added based on enrollment projections that show enrollment exceeding capacity in coming years. ACPS has begun The High School Project to better serve the high school students academic experience while accommodating enrollment. Additionally,ACPS staff are exploring options for alternative programming and are proposing design funding in FY 2024 and renovation funding in FY 2025 to fund renovation to new or existing leased space for this purpose.
The proposed permanent use for the 1703 N. Beauregard facility is to add a 600 student middle school.
2. Renovating existing buildings because of their age and building condition: The second major component of the modernization program is to renovate the
Page 86 ACPS FY 2024 Proposed Budget Capital Improvement Program
Capital Improvement Program
existing school facilities. This year, five ACPS schools are older than 75-years.
Mount Vernon, Naomi L. Brooks (formerly Matthew Maury), George Mason, Charles Barrett and George Washington (our second largest school) will all reach or exceed 75 years of age within the next five years. Over the next 20 years, an additional seven schools will reach 75-plus years. Part of the final CIP includes new buildings and modernizations to address building condition issues at select facilities.
3. Renovating the Transportation Facility: The transportation facility has not been upgraded since it was constructed in 1979 with the exception of an additional relocatable facility. Since then, ACPS has gained more than 4,000 students and expanded the school bus fleet. This project to upgrade the transportation facility will need to include an expanded garage and personnel space to meet the needs of the expanding fleet. Construction funding for the building expansion is shown in FY 2026; however, this will be part of a collaborative effort with the City’s departments near the site.
Non-Capacity Program:
The non-capacity portion of the CIP program totals $170,724,600 over the 10-year period. This includes funding for major repairs and minor construction ,projects as well as funding for transportation services, technology modernization and textbooks.The 10-year request includes:
• $47,472,800 for elementary
• $21,681,600 for secondary
• $101,818,200 for system-wide projects including HVAC, emergency repairs, planning, the Rowing Facility, safety and security, curriculum materials, technology upgrades and Transportation services
Basis of Modernization Estimates
Capacity Estimates: The capacity project estimates are based on costs per square foot. These are budgetary numbers for the purpose of
CIP planning. During the planning phase of the implementation of this program, budget numbers should be revised for each upcoming project.
New construction budgets are now developed based on the following hard cost estimates:
Building: $407/sf
Parking: $83,000/space
Sitework: $2.85M/acre
Demolition: $10/sf
Escalation: 3% annually
Soft Costs: 20% total hard costs
Non-Capacity Estimates: The current estimates included in the CIP for non-capacity come from various professional sources including most recently as updated by the 2021 Facility Conditions Assessments.
Operating Budget Impact
The Operations and Capital Improvement Program (CIP) budgets are closely connected. Year over year, CIP projects impact the Operating Budget by approximately $10M. The general increase over the next five years is predicted at the average inflation rate, 4% which puts the fith year closer to $11M of Operating Budget impact.
Routine maintenance costs associated with custodial contracts (ie. uniforms and apparel), routine preventative work (ie. HVAC repairs), unanticipated maintenance work and parts of comprehensive CIP planning are all considered major parts of this cost.
CIP sites that impact the Operating Budget the most in this budget cycle are: New School (3.9%); Patrick Henry (3.9%); Co-Location of Early Childhood Center (9.6%); Ferdinand T. Day (70.9%); and, Various CIP Projects/ Unanticipated Maintenance work (13.0%).
For additional information on how parts of the Operating Fund budget are associated with CIP projects, see the Maintenance and Operations Department in the Department Section.
Page 87 ACPS FY 2024 Proposed Budget Capital Improvement Program
Capital Improvement Program
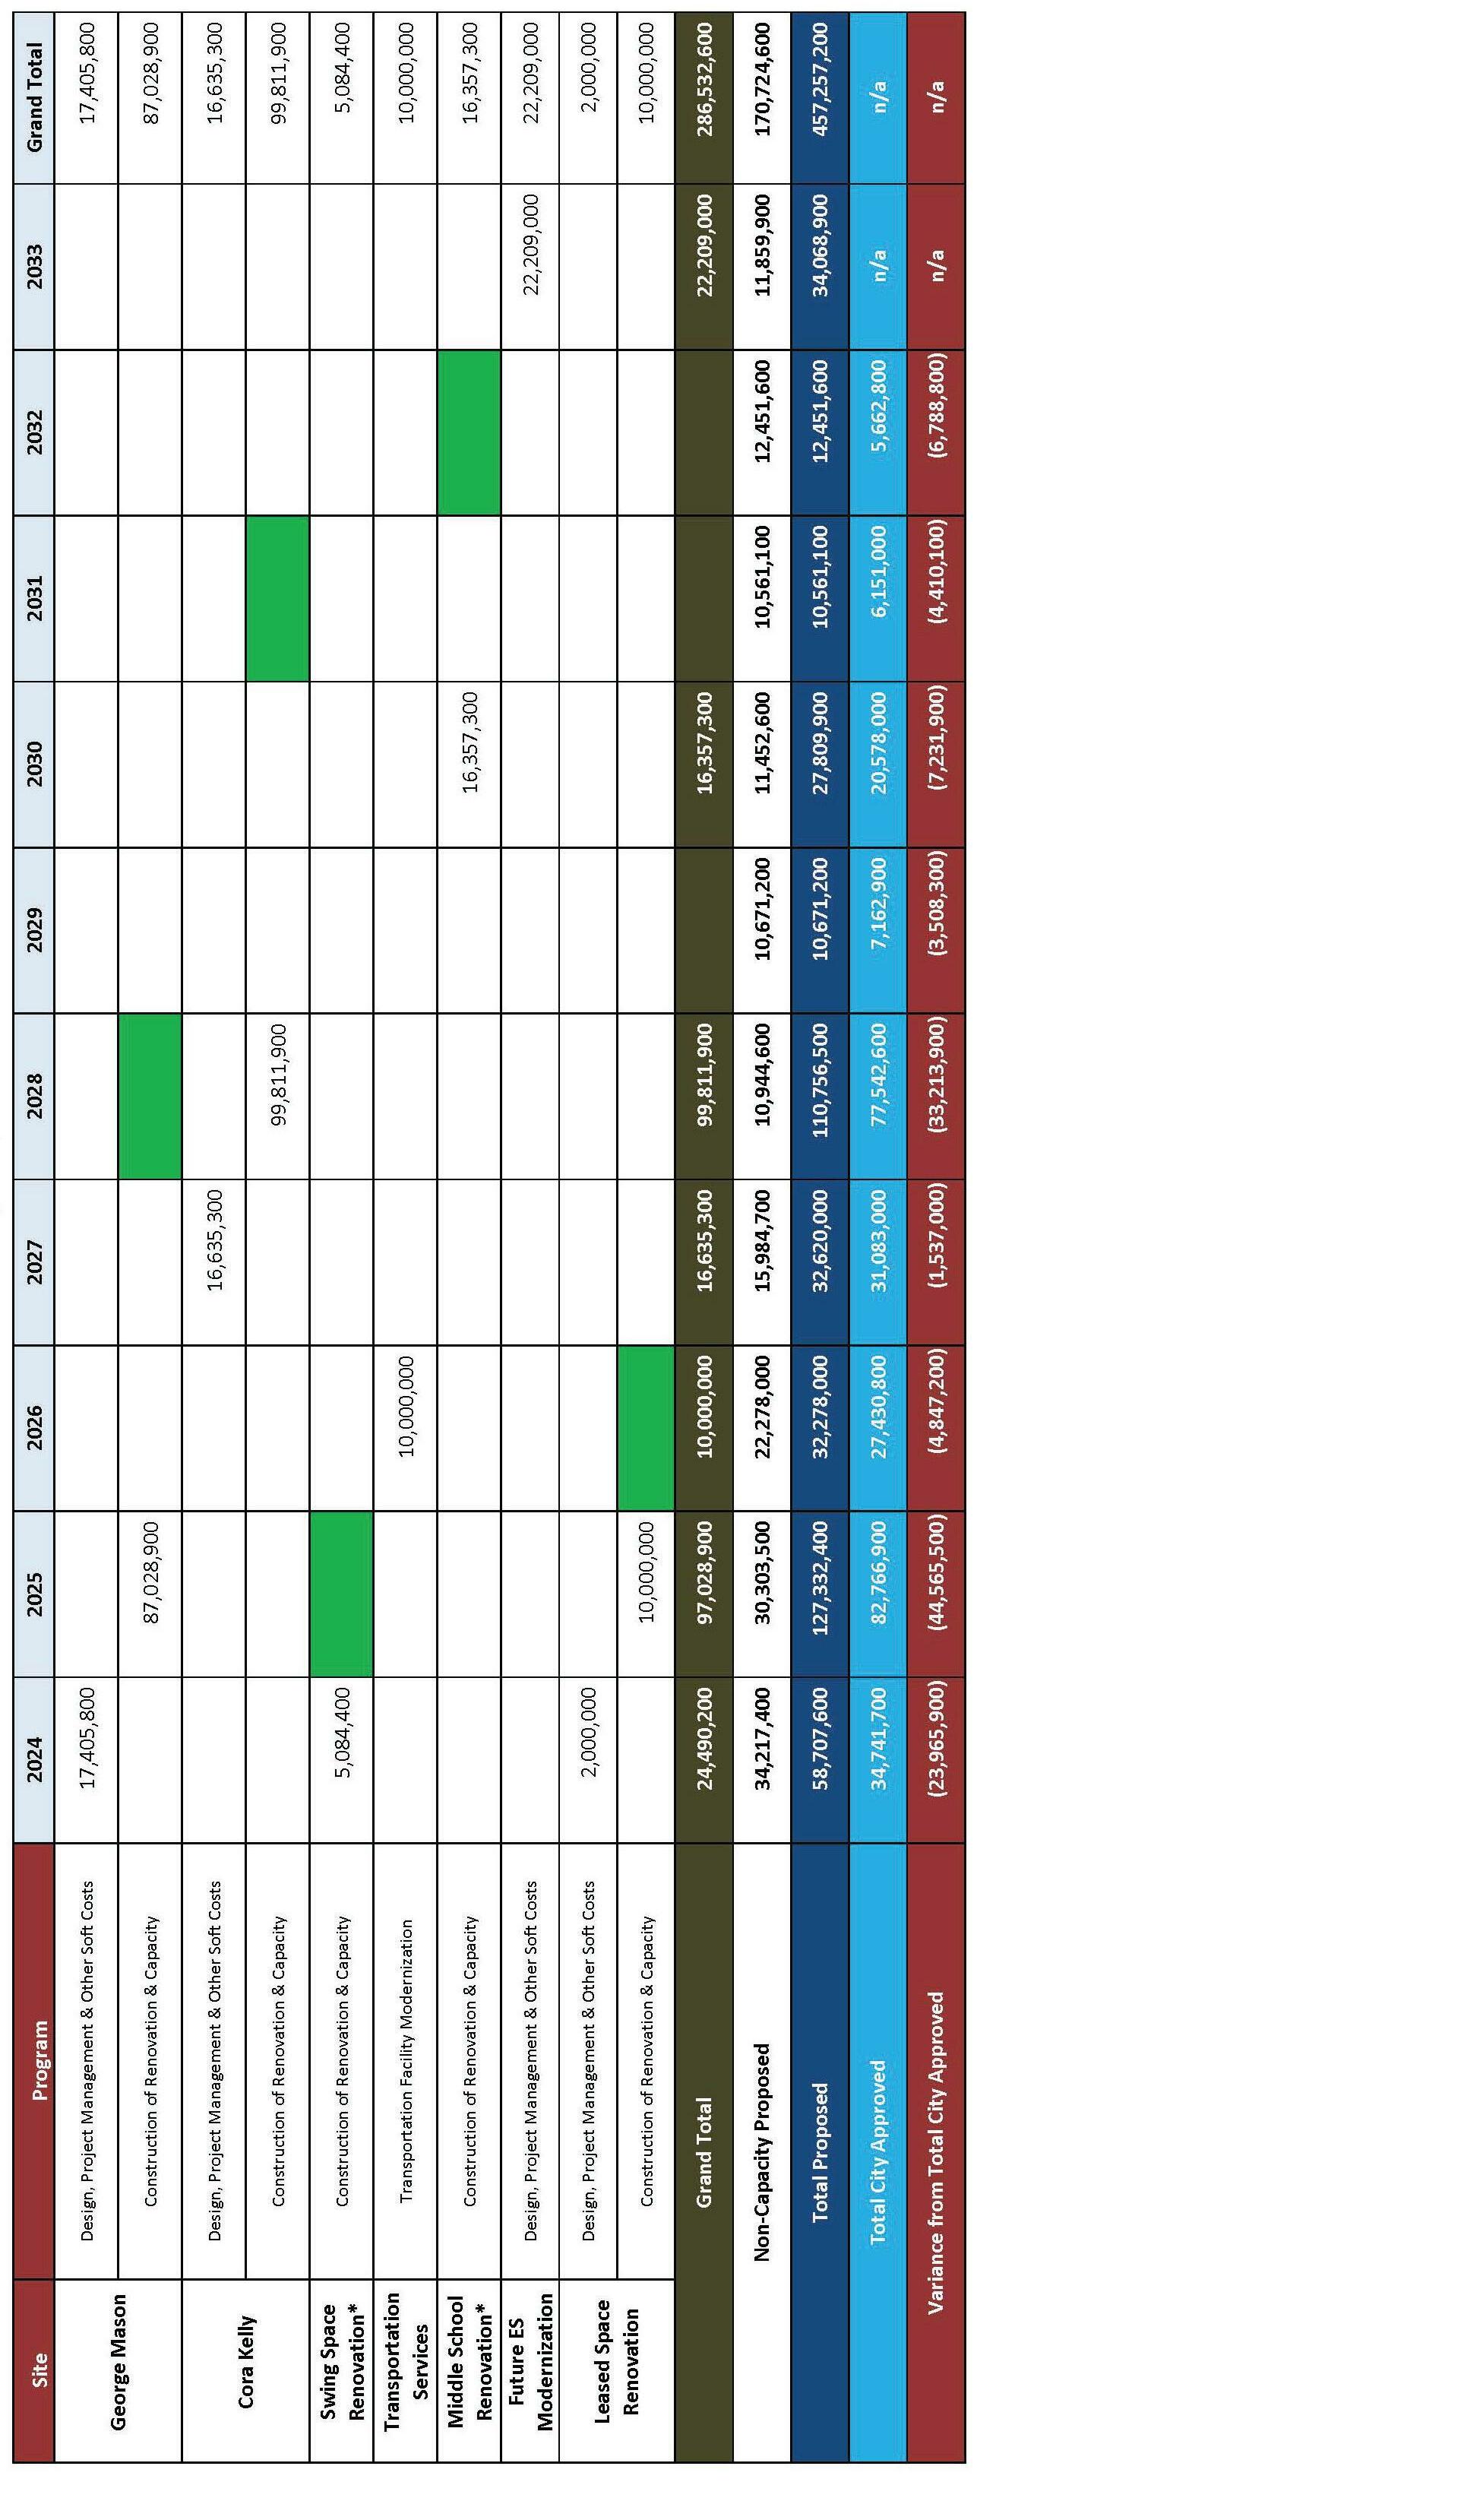
ACPS FY 2024-2033 CIP BUDGET SUMMARY
Page 88 ACPS FY 2024 Proposed Budget Capital Improvement Program
FY 2024-2028 Fiscal Forecast
FY 2024-2028 Fiscal Forecast
The FY 2024-2028 fiscal forecast incorporates the revenue and expenditures of the FY 2024 Proposed Budget and projects financial performance for the Operating Fund through FY 2028. The forecast utilizes assumptions concerning enrollment and demographics, class size and staffing levels, as well as revenue and expenditure inflation trends, to provide a long-range picture of the financial outlook and challenges facing ACPS. The model underlying the forecast provides an analytical framework that allows the Alexandria City School Board and ACPS leadership to examine how changes in operating assumptions affect this financial picture, and to determine how best to close the projected operating gap.
Multi-year Revenue and Expenditure Projections
The chart below displays the revenue (inclusive of other financing sources and uses) and expenditures from FY 2023 Final Budget through FY 2024- 2028 Projected Budget.
Budget Imbalance Given Baseline Assumptions
The FY 2023 Operating Fund Final Budget serves as the baseline for the FY 2024-2028 Fiscal Forecast. All future years are informed by additional assumptions as summarized in below chart and described in greater detail on subsequent pages of this Section.
Operating Fund Fiscal Forecast: FY 2024 -FY 2028
Page 89 ACPS FY 2024 Proposed Budget Fiscal Forecast
202320242025202620272028 Revenue 311,307,300313,156,270315,628,140325,946,680329,030,180329,611,280 With Use of Fund Balance 320,626,737318,937,370321,609,540332,155,580335,382,680336,144,380 Expenditures 316,852,637330,984,400342,438,570355,444,488363,654,473373,978,360 280,000,000 300,000,000 320,000,000 340,000,000 360,000,000 380,000,000
FY 2024-2028 Fiscal Forecast
Under the current assumptions, ACPS revenue and expenditures for FY 2024-FY 2028 are structurally imbalanced. The Operating Fund Revenue, principally the revenue from the City of Alexandria’s annual appropriation, is not anticipated to keep pace with the growth in Operating Fund expenditures. The gap in revenue and expenditures grows from $17.83 million in FY 2024 to $44.37 million in FY 2028.
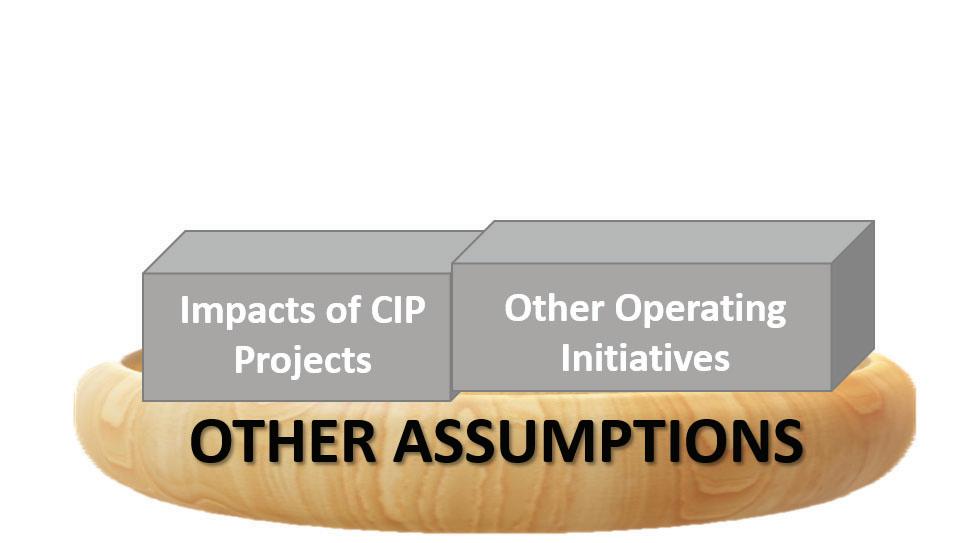
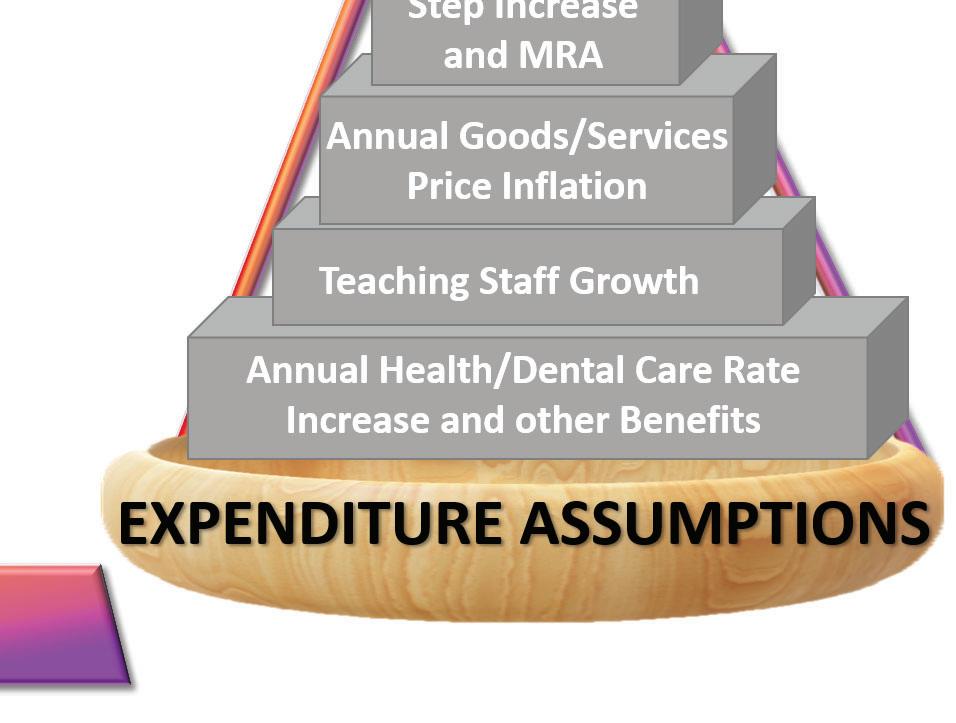
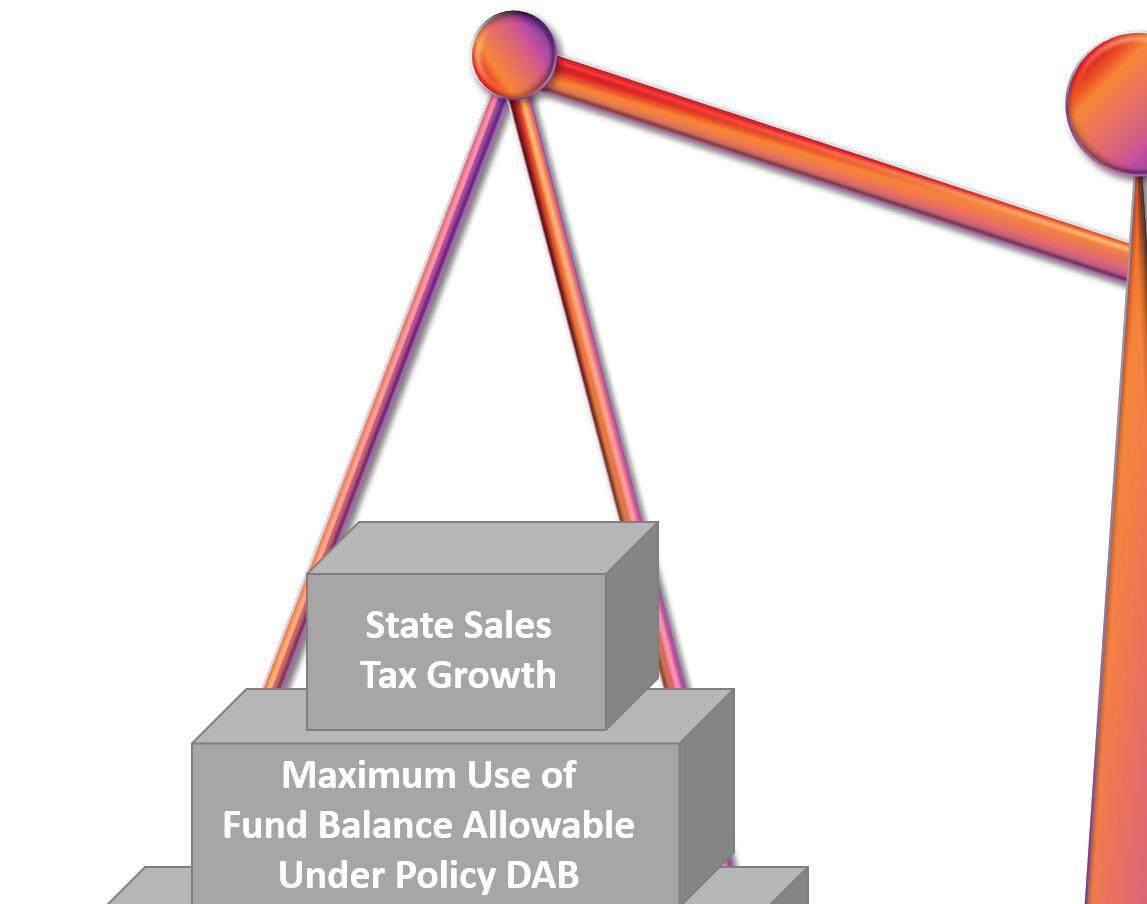
Revenue Growth Assumptions


Student enrollment is anticipated to increase from projected 16,585 students in FY 2024 to 16,854 students in FY 2026. The five-year average annual growth rate in enrollment is projected to be 1.2 percent. The FY 2023 actual membership was presented by ACPS in November 2022.
Same Per Pupil Appropriations: $12.8 million revenue growth in FY 2024. In the FY 2023 Final Budget, the City Appropriation totaled $248.7 million. With FY 2023 projected enrollment of 15,597, the Per Pupil Appropriation equaled $15,947 per student. Using the same per-pupil allocation assumptions, ACPS student enrollment is anticipated to increase by 543 students by FY 2028, which translates to a City of Alexandria Appropriation of $256.6 million in FY 2028. This same methodology is used to determine the revenue growth at the state, federal and local levels.
The result of these revenue assumptions are an overall revenue of $313.16 million in FY 2024 and $329.61 million by FY 2028. The FY 2024 revenue assumption includes a City Appropriation increase of $9.95 million, State
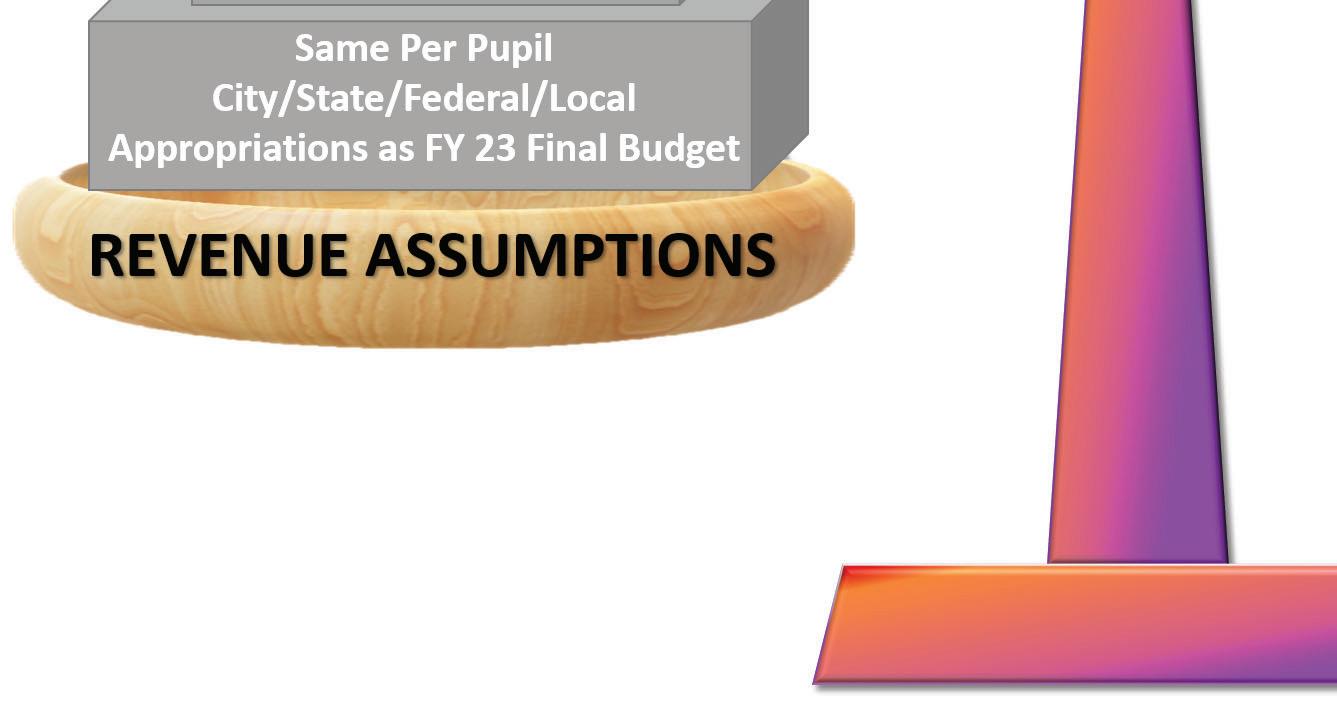
Fiscal Forecast Page 90 ACPS FY 2024 Proposed Budget
FY 2024-2028 Fiscal Forecast
Appropriation increase $2.14 million and combined federal and local appropriations of just $1.18 million. ACPS recognizes that the amount of appropriation may be impacted by City and State strategies to balance their budgets.
Maximum Use of Fund Balance: $5.78 million in FY 2024; $6.53 million in FY 2028. This projection also includes the maximum annual use of fund balance allowable under ACPS Policy DAB – Operating Fund Balance, jointly developed by the City of Alexandria and Alexandria City Public Schools. There are several restrictions on the use of fund balance within this policy. However, the one that is expected to prevail each year, as the most restrictive, limits annual use of fund balance to 1.8 percent of the previous year’s operating budget in FY 2023 and 1.5 percent of the previous year’s operating budget in FY 2024 and beyond. This assumption allows for ACPS to budget $4.95 million in use of fund balance within FY 2024. Policy DAB anticipates that, each year, overall fund balance will be replenished by a total budget underspent.
Expenditure Growth Assumptions
Expenditures are projected to grow at the following average annual rates across the projection period. All numbers shown below are comparisons to the FY 2023 Final Budget unless otherwise noted.
Annual Salary & Wage Increases: $7.35 million in FY 2024; $39.90 million by FY 2028. The annual salary of each employee is expected to increase at an average of 4.1 percent each projection year and wages are anticipated to increase at an average of 1.0 percent. ACPS recognizes that one of the key characteristics of a high-performing school division is recruiting and retaining exemplary staff. The Division also understands that it exists in a very competitive labor market for teachers and other school employees
in Northern Virginia. As nearby jurisdictions continue to offer salary increases in line with annual step increases, ACPS must do so as well. This will come at an estimated additional expense of $7.35 million in FY 2024; $39.90 million by FY 2028 when compared to the FY 2023 Final Budget.
Health Care and VRS Changes & Other
Benefits: $5.00 million in FY 2024; $28.43 million by FY 2028. Employee benefit costs incurred by the School Division are anticipated to continue to increase in upcoming years. Expenditures in the Health-Benefits fund have risen 32.6 percent between fund inception in FY 2018 and actual expenditures for FY 2022. Overall, ACPS projects a 9.00 percent annual health care cost increase and 1.00 percent Virginia Retirement System (VRS) rate increase throughout the projection period. The combined result, when compared to the FY 2022 budget, is $5.00 million more anticipated costs in the first projection year and $28.43 million projected in the fifth projection year.
Non-Personnel Changes: $1.91 million in FY 2024; $5.08 million in FY 2028. Non-personnel costs are projected to increase by 2.0 percent each year along with general inflation. This is in line with the escalator clauses in many ACPS multi-year goods and services contracts. It is also aligned with the 5-Year Forward Inflation Expectation Rates published daily by the Federal Reserve Bank of St. Louis (available online at https://fred. stlouisfed.org/series/T5YIFR).
Enrollment-Driven Staffing: $2.13 million in FY 2024; $5.03 million in FY 2028. Slight Escalation for Subsequent Years.
Over the previous decade, ACPS enrollment has grown by 46 percent or approximately 3.9 percent each year. The growth is expected to slow down at the elementary, middle school and high school levels through FY 2028. The ACPS and City of Alexandria joint model expects a decreasein enrollment growth.
Page 91 ACPS FY 2024 Proposed Budget Fiscal Forecast
FY 2024-2028 Fiscal Forecast
Enrollment is projected to increase at average annual rate of 1.1 percent over the next five years. Enrollment growth will still require an increase in workforce to meet growing student needs. This new staff will increase the annual budget by approximately $2.13 million in FY 2024 and $5.03 million in FY 2028.
Annual operating and maintenance cost increase to $2.41 million by FY 2028. Five critical new Capital Improvement Program (CIP) initiatives scheduled to be completed during the next five years. These CIP projects in subsequent years will result in annual operating and maintenance cost increases totaling $2.41 million by FY 2028.
Future Considerations
As the gap between revenue and expenditures grows, all areas of the division must be examined for efficiencies to continue to provide the services needed by the students.
Salaries and benefits comprise 88.0 percent of the current-year operating fund budget. All staffing levels will be examined to determine if additional efficiencies can be realized. Organizational changes and class size adjustments may need to be reviewed by the leadership team and School Board. In addition, outsourcing of certain functions or shared services with the City of Alexandria will be considered.
All programs and services will be reviewed to determine if further efficiencies are possible. Programs that are not meeting the benchmarks set may face reduction in funding or elimination.
Finally, additional sources of revenue will need to be identified. The division’s grant-writing capacity will need to be enhanced and other business development opportunities will need to be pursued.
Fiscal Forecast Page 92 ACPS FY 2024 Proposed Budget
Page 93 ACPS FY 2024 Proposed Budget Fiscal Forecast
FY 2024-2028 Fiscal Forecast
This page left blank intentionally.
Financial Reports
Reading the Financial Reports
ACPS employs a multi-segment account code structure that provides for valuable reporting capabilities. The reports in this section are based on five components of the account code structure:
Fund Segment
This segment identifies the source of funds for the activity: the Operating Fund, School Nutrition Fund, or Grants and Special Projects Fund (the specific grant that funds the expenditure). Financial reports by source of funds are included in this section.
Section (School/Department) Segment
Identifies the major and subsidiary organizational units in ACPS. This includes individual schools, the School Board, the Office of the Superintendent, and the other organizational units within Central Office.
Object Segment
The object code is the most detailed level of the expenditure categories and identifies the actual expenditure, goods or service, purchased. The major object is a grouping of object codes in accordance with their categories in the chart of accounts. For example, supplemental teacher, supplemental librarian, and supplemental counselor have different object codes but they all are grouped into a major object called ‘supplemental’ in the financial reports. A description of major object groupings follows:
Personnel Accounts
Personnel Salaries: Major groupings within the compensation codes are:
• Administrative: Salaries paid to regular, contracted administrators for full-time and part-time work. Administrators include directors, supervisors, coordinators, and managers.
• Professional Instruction: Salaries and
wages paid to principals, assistant principals, school counselors, library media specialists, instructional coaches, and classroom teachers for full-time and parttime work. Classroom teachers include PreK-8, encore, core and elective at the secondary level, reading, special education, English learner (EL), dual language, talented and gifted (TAG), and alternative education teachers.
• Professional Other: Salaries and wages paid to support teachers and other teacherscale positions for full-time and part-time work. Support positions include social workers, nurses, psychologists, instructional coaches, program managers, and system analysts.
• Technical: Salaries and wages paid to technical analysts, computer and network support, security guards, and other specialized personnel.
• Support: Salaries and wages paid to paraprofessional and clerical personnel.
• Trades: Salaries and wages paid to mechanics, maintenance supervisors, custodian supervisors, and general maintenance employees.
• Operative: Salaries and wages paid to bus monitors and drivers.
• Laborer and Services: Salaries and wages paid to laborers, food service workers, custodian, security, cafeteria aids, hall monitors, and building engineers. For those who perform tasks requiring some manual skills or relates to both protective and nonprotective support services.
• Intermittent: Compensation for casual temporary employees paid on an hourly basis for hours worked.
Page 94 ACPS FY 2024 Proposed Budget Financial Reports
Financial Reports
• Overtime: Compensation for non-exempt employees for hours worked in excess of 40 hours per week.
• Substitute: Compensation for non-contract employees who perform the work of regular full-time or part-time employees who are absent. Substitutes may also fill full-time positions on a long-term basis.
• Supplemental: Compensation for full-time and part-time regular employees for work performed outside of the scope of their full-time position. May include such pay as shift-premiums, incentives, and extra duty stipends as well as additional pay for extended learning.
Employee Benefits Accounts
Employee Benefits: Job-related benefits provided to employees as part of their total compensation. Fringe benefits include the employer’s portion of FICA, Medicare, retirement, insurance (life, health and dental, disability, etc.), and employee allowances.
Non-Personnel Accounts
Purchased Services: Services acquired from outside sources such as private vendors, public authorities, or other governmental entities including tuition payments to other school divisions for the education of students with disabilities. Purchase of the service is on a fee basis or fixed-price contract basis. Examples include HVAC maintenance, cleaning/janitorial work, legal, and other professional services.
Internal Services: Charges from one department of ACPS to another for items such as field trips and printing.
Other Charges: Expenditures to support operations including utilities, travel, insurance, phone charges, postage, and leases/rentals.
Materials and Supplies: Articles and commodities, including textbooks, that are consumed or materially altered when used and
equipment that is not capitalized.
Capital Outlay: Outlays that result in the acquisition of or additions to fixed assets. Capital outlay includes the purchase of replacement or additional fixed assets.
Other Uses of Funds: This series of codes is used to classify transactions that are not properly recorded as expenditures of the school division but require budgetary or accounting control. These include fund transfers and budgetary contingency funds and are used solely by the Financial Services Department as well as expenditures for indirect costs which are applied to certain grant funds.
ProgramSegment
The program code identifies one of nine major areas or one of its detailed sub-programs. The major units are instructional support, regular, special, vocational, gifted and talented, other, summer, adult education, and non-local education agency (LEA) programs.
Reports are organized by the major program level. Similar to the major object, the major program is a grouping of similar programs to provide a more streamlined reporting view.
FunctionSegment
The function code identifies what type of activity is supported by the transaction. Pursuant to Section 22.1-115 of the Code of Virginia, the major classifications of expenditures are established as (i) instruction, (ii) administration, attendance and health, (iii) pupil transportation, (iv) operation and maintenance, (v) school nutrition services and other non-instructional operations, (vi) facilities, (vii) debt service and fund transfers, (viii) technology and (ix) contingency reserves. These categories are further broken down into function areas, such as classroom instruction in category (i) and vehicle operation in category (iii). Function codes are used to complete the Annual School Report submitted to the Commonwealth of Virginia.
Page 95 ACPS FY 2024 Proposed Budget Financial Reports
Financial Reports
The following financial reports provide five years of data: FY 2019, FY 2020, and FY 2021 actual expenditures and final positions (FTE), FY 2022 and FY 2023 Final Budgets and positions. The change column is the difference between FY 2022 and FY 2023 budgets and FTEs.
Dollar amounts in the following reports are expressed in thousands as noted.
Budget and Positions by School/ Department for the Combined Funds: This is a summary report that shows expenditures and positions at the school and department level for the planning year only.
Budget and Positions by Major Object for the Operating Fund: This report shows expenditures and positions at the major object level.
Budget and Positions by Major Program for the Operating Fund: This report shows the expenditures and positions at the major program level.
Budget and Positions by Department for the Operating Fund: This report shows the expenditures and positions at the school and department level.
Budget and Positions by Function for the Operating Fund: This report shows the expenditures and positions at the function level.
Budget and Positions by Major Object for the School Nutrition Fund: This report shows expenditures and positions at the major object group level.
Budget and Positions by Major Program and Function for the School Nutrition Fund: These summary reports show expenditures and positions at the major program and major function group levels.
Budget and Positions by Fund for the Grants and Special Projects Fund: This report shows the grant and special projects funded expenditures and positions at the detail fund level.
Budget and Positions by Fund and School/ Department for the Grants and Special Projects Fund: This report shows the grant and special projects funded expenditures and positions at the detail fund level and is further broken down by individual school and department detail.
Budget and Positions by School/ Department for the Grants and Special Projects Fund: This report shows the expenditures and positions at the school and department level.
Budget and Positions by Major Program for the Grants and Special Projects Fund: This report shows the expenditures and positions at the major program level.
Budget and Positions by Function for the Grants and Special Projects Fund: This report shows the expenditures and positions at the function level.
Additional detailed reports for the operating fund by school and department can be found in the Information section of this document.
Page 96 ACPS FY 2024 Proposed Budget Financial Reports
Financial Reports
Combined Funds: Budget and Positions by School/Department
Page 97 ACPS FY 2024 Proposed Budget Financial Reports Dollar ($) FTE Dollar ($) FTE Dollar ($) FTE Dollar ($) FTE Charles Barrett ES 8,32871.15 8,32871.15 Cora Kelly School 6,93766.98 1521.00 7,08967.98 Douglas Macarthur ES 8,17073.60 6838.00 8,85381.60 George Mason ES 5,93747.20 5,93747.20 James K. Polk ES 10,505102.08 4052.00 10,910104.08 Jefferson-Houston School 10,25291.69 4815.00 10,73296.69 John Adams ES 11,473107.00 4253.00 11,899110.00 Lyles-Crouch Traditional Academy 5,85049.38 5,85049.38 Naomi L. Brooks ES 5,34246.09 5,34246.09 Mount Vernon Community School 11,20599.28 11,20599.28 Patrick Henry ES 11,344103.88 5752.50 11,920106.38 Samuel W. Tucker ES 10,36885.64 10,36885.64 William Ramsay ES 9,64288.94 7486.50 10,39095.44 Ferdinand T. Day ES 7,36572.38 3593.20 7,72475.58 Early Childhood Center 2,20120.79 1,57218.00 3,77438.79 Francis C. Hammond MS 21,884181.00 8946.50 22,777187.50 George Washington MS 19,746163.20 19,746163.20 Alexandria City HS King St 35,733281.03 13- 35,746281.03 Alexandria City HS Athletics 1,6285.00 1,6285.00 Alexandria City HS Financ Aid 14- 14Alexandria City HS Minnie Hwrd 11,11490.30 11,11490.30 Alexandria City HS Intl Acadmy 6,03751.00 6,03751.00 Alexandria City HS Satellite 1,0988.00 1,0988.00 NVJDC Juvenile Detention 1,71310.00 1,71310.00 Alternative Education 2,11315.70 2,11315.70 School Board 1,7324.00 1,7324.00 Office of the Superintendent 5532.00 5532.00 Elementary School Instruction 337- 337Secondary School Instruction 92- 92Accountability and Research 1,5156.00 1,5156.00 Office of School, Business & Community Parterships 4292.00 347- 7762.00 Partnerships & Community Engagement 1,3959.50 1,0902.00 2,48511.50 Communications 1,8559.50 1,8559.50 Chief Academic Officer 7704.00 7704.00 School Leadership 61- 61School-Wide Resources 2,26637.00 2,26637.00 Curriculum Design & Inst Srvcs 2,27513.00 2,27513.00 Career and Technical Education 4782.00 365- 8442.00 Humanities 443- 443Literacy 381- 381Science, Tech, Eng, and Math 645- 645Talent Development 1,2973.00 455- 1,7523.00 Pre-K-12 Programs 633- 633Adult Education 7593.00 4331.00 1,1924.00 Pre-Kindergarten Programs 143- 3882.00 5312.00 Talented And Gifted Programs 7893.70 7893.70 AVID/College Readiness 5961.00 5961.00 Specialized Instruction 7,99252.50 4,34332.50 12,33485.00 English Learner Services 3,62516.00 6753.00 4,29919.00 Title I Programs 3280.75 4924.25 8205.00 Elementary Instruction 5441.50 5441.50 Secondary Instruction 1,3341.50 1481.00 1,4822.50 Technology Services 12,61560.00 12,61560.00 Student Services 3,44417.88 31- 3,47417.88 Alternative Programs & Equity 1,1685.00 1,1685.00 Human Resources 2,80616.00 2,80616.00 Division-Wide Human Resources 8,471- 8,471Financial Services 5,12427.00 5,12427.00 Division-Wide FSD Reserve -10022.41 -10022.41 Pupil Transportation 12,211155.00 12,211155.00 Facilities & Operations 24,84343.00 24,84343.00 Safety & Security Services 2,372- 2,372School Nutrition Services 3- 12,601121.00 12,604121.00 Grand Total329,4462,439.50 17,851111.45 12,601121.00 359,8982,671.95 Note: Dollar amounts are presented in thousands. Operating Fund Grant and Special Projects School Nutrition Total Combined Funds Section Title
Financial Reports
Operating Fund: Budget and Positions by Major Object
Page 98 ACPS FY 2024 Proposed Budget Financial Reports Character Title Major Object TitleDollar ($) FTE Dollar ($) FTE Dollar ($) FTE Dollar ($)FTEDollar ($)FTEDollar ($) FTE Administrative Regular 5,52738.25 6,93148.25 7,83452.25 8,52755.25 9,45857.25 9312.00 Professional Instruction Regular 123,5241,534.60 125,8551,528.00 130,1861,541.90 136,4491,546.00 142,9451,554.20 6,4968.20 Professional Other Regular 9,902116.00 9,827103.70 10,540110.20 11,118110.80 11,652114.30 5343.50 Technical Regular 4,37369.10 4,70367.60 5,50878.60 5,46676.60 6,15279.60 6863.00 Support Regular 13,604375.35 13,833353.28 14,979378.70 15,663382.70 15,766368.70 103(14.00) Trades Regular 1,25223.00 1,33121.00 1,47022.00 1,60422.00 1,67922.00 74Operative Regular 3,770146.00 3,828123.00 4,509138.00 4,930144.00 5,165139.00 235(5.00) Services Regular 3,04590.42 2,98177.44 3,19583.05 3,30582.05 3,46582.04 160(0.01) Professional Instruction Intermittent 1,8111,8212,2332,2392,034-204Professional Other Intermittent 17220215816457-107Technical Intermittent 194333441447403-44Support Intermittent 265327236260245-15Trades Intermittent 3931 0Operative Intermittent 2321313753753750Service Intermittent 51023599285276-9Overtime 855332623618617-1Support OT 3 0Professional Instruction Substitutes 2,5137802,7122,6983,001303Support Substitutes 011-1Services Substitutes 0 0Professional Instruction Supplements 1,8871,4802,6112,4982,53436Technical Supplements 2616242420-4Support Supplements 0 0Trades Supplements 3310634282-352Services Supplements 11913440Division-Wide Salaries 611.00 -3,01818.00 -1,70919.10 -1,81122.41 -1013.31 Administrative Supplements 0 0173,5232,403.72 174,9922,322.27 184,7392,422.70 195,6002,438.50 204,3212,439.50 8,7211.00 FICA/Medicare 12,87812,96514,20515,98215,804-178Retirement/Group Life 27,08328,61530,37032,76534,1931,428Hospital/Medical Plans 24,14626,65727,76228,53529,045509Other Insurance 2,2822,5951,7902,1262,15226Other Benefits 1,0911,0041,3141,3051,38882Division-Wide Benefits -1,050-1,05067,48171,83675,44180,71581,532817Professional ServicesTemporary Help 7371,381350347456109Professional ServicesBusiness Services 6311,165958991984-7Professional ServicesInstructional Support 1,4361,3111,7561,7801,897117Transportation Services 1,5561601,0511,0401,05515Maintenance Services And Contracts 7,5718,0027,6619,61811,1541,536Computer and Software Services 58360574174175110Printing and Binding 201446254225201-24Professional ServicesOther 9935082,0132,0082,07163Purchase of Service from Other Divisions 15357151151151013,86113,63614,93516,90118,7201,820Print Shop -9-41077Food/Food Services 02220Transportation 5556160-1Data Processing 04000-4-46263695Utilities 3,2842,7893,7883,9034,304401Communications 9951,04883283586227Insurance 3343523994154150Leases and Rentals 4,8334,4134,9314,7405,146406Travel 4894569873976626Awards and Grants 2232769493-1Course/ Event Fees and Dues 27630335135140352Miscellaneous 2138902645142510,2539,01911,16511,10512,4411,336Educational and Recreational Supplies 1,9983,0042,6362,5892,61627Textbooks 470241500442438-3Food Supplies and Food Service Supplies 261153393643706Technology 2,3392,7232,6522,8892,96071Salaries Salaries Total Employee Benefits Employee Benefits Total Purchased Services Purchased Services Total Internal Services Internal Services Total Other Charges Other Charges Total Change FY 2023 to FY 2024 FY 2023 Final FY 2024 Proposed FY 2020 Actual FY 2021 Actual FY 2022 Final
Financial Reports
Operating Fund: Budget and Positions by Major Object (continue)
Page 99 ACPS FY 2024 Proposed Budget Financial Reports Character Title Major Object TitleDollar ($) FTE Dollar ($) FTE Dollar ($) FTE Dollar ($)FTEDollar ($)FTEDollar ($) FTE Change FY 2023 to FY 2024 FY 2023 Final FY 2024 Proposed FY 2020 Actual FY 2021 Actual FY 2022 Final Medical and Laboratory Supplies 3126374037-3Repair and Maintenance Supplies 4512983453463460Laundry, Housekeeping and Janitorial Supplies 336537494500490-10Vehicle/Power Equipment Fuels 270111381516466-50Vehicle/Power Equipment Supplies 302137352352332-20Other Supplies 5018748250248-1Division-Wide Materials & Supplies 07312,0122,5004886,5067,2798,51610,29910,804505Machinery and Equipment Replacement 1514033396Furniture and Fixtures Replacement 12217 0Communications Equipment Replacement 38807777770Technology Replacement 1,8612,3341,1111,1111,13120Machinery and Equipment Additional 17752737370Furniture and Fixtures Additional 774412295425Communications Equipment Additional 1914141410Technology Additional 38021218018018002,6892,6551,8881,5081,55951274,3092,403.72 279,4132,322.27 296,7462,422.70 316,1892,438.50 329,4462,439.50 13,2571.00 Note: Dollar amounts are presented in thousands. Grand Total Materials and Supplies Materials and Supplies Total Capital Outlay Capital Outlay Total
Financial Reports
Operating Fund: Budget and Positions by Major Program
Note: Dollar amounts are presented in thousands.
Page 100 ACPS FY 2024 Proposed Budget Financial Reports Program Group Title Dollar ($) FTE Dollar ($) FTE Dollar ($) FTE Dollar ($)FTEDollar ($)FTEDollar ($) FTE Board Services 9873.00 8793.00 1,2463.00 1,4763.00 1,7324.00 2571.00 Evaluation and Planning 1,1786.00 1,0876.00 1,2606.00 1,3116.00 1,4556.00 144Executive Administration 1,6169.00 1,4657.00 1,5157.00 1,2836.00 1,2936.00 11Financial Services 3,00524.00 3,04621.00 3,75026.00 4,13227.00 4,48028.00 3471.00 Human Resources 6,67614.00 7,30913.00 7,45215.00 8,19416.00 8,52616.00 332Communications and Information Services 4,39744.20 4,51641.40 5,24645.20 5,47145.20 5,50744.20 37(1.00) Business Development 1801.00 1841.00 1851.00 1921.00 1981.00 5Technology Services Management 9,70840.00 10,04338.00 9,50940.00 9,60740.00 9,75240.00 145Kindergarten and PreKindergarten 11,233151.79 11,556140.60 12,728154.29 12,788148.29 12,579136.29 -209(12.00) Instructional Core 68,839596.50 70,261608.90 71,949594.80 75,346601.80 78,861609.10 3,5157.30 Improvement of Instruction 7,60756.75 8,19853.35 8,98553.25 9,32552.25 9,28550.25 -40(2.00) Homebound Instruction 60141411411410Enrichment and Electives 24,615220.50 25,592223.40 26,918224.80 28,386225.60 30,493229.50 2,1083.90 Exemplary Programs 1,84210.50 1,8938.50 2,75010.50 2,82910.50 2,76910.50 -60Career and Technical Education 6,04149.40 6,15751.60 6,52753.60 6,82953.60 7,19352.80 363(0.80) Alternative and At-Promise Education 1,39615.00 1,40512.00 1,65013.00 2,08314.00 1,93614.00 -147EL 19,767177.50 20,734180.50 22,112183.00 22,979181.00 24,157184.00 1,1773.00 Special Education 31,755374.10 31,070350.10 34,620384.10 36,620389.50 37,710383.50 1,090(6.00) Summer and Extended Learning 2,0782,9682.00 2,6541.00 2,6101.00 2,4751.00 -135Adult Education 5703.00 4853.00 7173.00 7373.00 7593.00 23Partnerships, Family and Community Engagement 1,24214.00 1,31414.50 1,74117.50 1,82217.50 1,91617.50 95Financial Aid 1491.00 1541.00 1681.00 1751.00 1461.00 -28School Administration 17,520142.50 17,415136.00 17,691137.00 18,473138.00 18,953137.00 481(1.00) Student Services 17,499159.15 17,982157.38 18,792159.70 20,137162.20 21,936171.50 1,7999.30 Technology Services 2,69021.50 2,73121.00 2,90121.00 2,93621.00 3,13321.00 197Transportation 8,926162.00 8,139138.00 10,071154.00 11,015160.00 11,186155.00 170(5.00) Operations and Maintenance 22,27584.60 22,43377.60 24,63083.60 27,44883.60 30,19783.60 2,749School Food Services 46717.73 38512.44 60517.36 59617.36 63917.35 43(0.01) Division-Wide -85.00 -3-1,76613.00 1,25013.10 3916.41 -1,2103.31 274,3092,403.72 279,4132,322.27 296,7462,422.70 316,1892,438.50 329,4462,439.50 13,2571.00
Change FY 2023 to FY 2024 Grand Total FY 2020 Actual FY 2021 Actual FY 2022 Final FY 2023 Final FY 2024 Proposed
Financial Reports
Operating Fund: Budget and Positions by Function
Page 101 ACPS FY 2024 Proposed Budget Financial Reports State Function Roll-up Function Title Dollar ($) FTE Dollar ($) FTE Dollar ($) FTE Dollar ($)FTEDollar ($)FTEDollar ($) FTE Improvement of Instruction 12,47887.75 13,00086.35 14,48186.25 15,14388.25 17,37096.75 2,2278.50 Office of the Principal 17,624134.50 18,705138.00 19,668141.00 20,856143.00 20,520138.00 -336(5.00) Guidance Services 8,43475.60 8,89677.60 9,17178.30 9,56978.70 11,03285.50 1,4636.80 Classroom Instruction 158,0231,528.50 161,1051,506.30 169,9881,540.60 177,6851,546.30 182,5091,525.20 4,824(21.10) Library and Media Services 3,17436.20 3,18833.90 3,53135.70 3,70235.70 3,75034.70 48(1.00) School Social Worker Services 3,06628.10 3,14726.30 3,18726.30 3,50226.90 3,45726.90 -44Homebound Instruction 60141411411410202,8591,890.65 208,0551,868.45 220,1681,908.15 230,5971,918.85 238,7801,907.05 8,183(11.80) Reprographics-18-59-21-12-120Health Services 2,92328.15 3,13627.88 3,19928.00 3,44428.00 3,49028.00 46Planning Services 3,45822.50 3,46723.00 3,93225.50 3,81822.50 3,23118.50 -587(4.00) Information Services 1,4327.00 1,4546.50 1,8658.50 2,0799.50 2,0309.50 -49Personnel Services 6,31514.00 7,10813.00 7,24715.00 8,02316.00 8,46516.00 442Psychological Services 2,41021.90 2,56021.40 2,68821.90 2,83721.90 3,16424.40 3272.50 Fiscal Services 2,57419.00 2,65919.00 2,88719.00 3,01019.00 3,12519.00 115Executive Administration 1,77611.00 1,7449.00 1,7129.00 1,4958.00 1,5198.00 25Attendance Services 1,41218.00 1,46118.00 1,61319.00 1,73319.00 1,75019.00 16Purchasing Services 4685.00 4662.00 9227.00 1,1007.00 1,1698.00 691.00 General Administration 1722.00 531.00 591.00 721.00 811.00 9Board Services 9773.00 8773.00 1,2363.00 1,4663.00 1,7224.00 2571.00 Speech/Audiology Services 1481.00 1511.00 1531.00 1511.00 1571.00 724,045152.55 25,077144.78 27,492157.90 29,215155.90 29,891156.40 6770.50 Pupil Transp Monitoring 1,21030.00 1,08629.00 1,31730.00 1,40530.00 1,43530.00 30Pupil Transp Management 4762.00 9102.00 4212.00 4492.00 4432.00 -6Pupil Transp Operations 7,381122.00 5,566100.00 7,734114.00 8,308120.00 8,542115.00 234(5.00) Pupil Transp Maintenance 1,1258.00 8467.00 1,6758.00 1,9248.00 1,8418.00 -8310,191162.00 8,408138.00 11,146154.00 12,086160.00 12,261155.00 175(5.00) Ed Facilities Management 2,37520.00 0Ed Facilities Security 1,89622.00 0Ed Facilities Building 18,27064.60 0Ed Facilities Grounds 230 0Risk Management and Insurance 376 0Ed Facilities Equipment 34 0Ed Facilities Vehicle 2 0Ed FacilitiesManagement 1,5974.00 6825.00 7966.00 1,0216.00 225Ed Facilities - Security 1,71324.00 2,54124.00 3,02624.00 3,60124.00 575Insurance & Risk Management 3693894054050Ed FacilitiesBuildings 18,72264.60 20,28766.60 21,84566.60 23,86466.60 2,019Ed FacilitiesEquipment 891007007022Ed Facilities - Grounds 3242642642640Ed Facilities - Vehicles 53 023,183106.60 22,86792.60 24,26395.60 27,03696.60 29,85796.60 2,821School Nutrition Services 65718.42 39912.44 88118.05 90218.05 93918.04 38(0.01) Community Services 297504438-668718.42 40612.44 93118.05 94518.05 97718.04 32(0.01) Capital - Building Add/Improve 858585-1Capital - Planning & Design 4586.00 1,1909.00 1,3789.00 1,4149.00 36Capital - Site Acquisition 68 05276.00 1,2759.00 1,4649.00 1,4999.00 35Tech Instructional Support 7,22746.50 0Tech Classroom Instruction 2,758 0Tech Management and Admin 3,23515.00 0Tech Attendance & Health 1161.00 0Tech Ops and Maint 6 04 - Operations and Maintenance Total FY 2020 Actual FY 2021 Actual FY 2022 Final 1 - Instruction 1 - Instruction Total 2 - Admin, Attendance, and Health 2 - Admin, Attendance, and Health 5 - School Food Services & Other Ops 5 - School Food Services & Other Ops 6 - Facilities 6 - Facilities Total Change FY 2023 to FY 2024 FY 2024 Proposed 3 - Pupil Transportation 3 - Pupil Transportation Total 4 - Operations and Maintenance FY 2023 Final
Financial Reports
Operating Fund: Budget and Positions by Function (continue)
Page 102 ACPS FY 2024 Proposed Budget Financial Reports State Function Roll-up Function Title Dollar ($) FTE Dollar ($) FTE Dollar ($) FTE Dollar ($)FTEDollar ($)FTEDollar ($) FTE FY 2020 Actual FY 2021 Actual FY 2022 Final Change FY 2023 to FY 2024 FY 2024 Proposed FY 2023 Final Tech - Management & Admin 3,41515.00 3,42615.00 3,50515.00 3,61915.00 114Tech - Classroom Instruction 2,5602,2572,2884,33414.00 2,04614.00 Tech - Instructional Support 7,97944.00 7,62446.00 7,57045.00 7,92845.00 358Tech - Attendance & Health 1161.00 1201.00 1261.00 1331.00 6Tech - Transportation 14143420Tech - Oprtns & Maintnce 68292931Tech - Ed Facilities 222013,34262.50 14,07660.00 13,52462.00 13,59761.00 16,14175.00 2,54514.00 9 - DivisionWide Division-Wide 211.00 -3-2,05318.00 1,25019.10 3922.41 -1,2103.31 211.00 -3-2,05318.00 1,25019.10 3922.41 -1,2103.31 274,3092,403.72 279,4132,322.27 296,7462,422.70 316,1892,438.50 329,4462,439.50 13,2571.00 Note: Dollar amounts are presented in thousands. Grand Total 8 - Technology 8 - Technology Total 9 - Division-Wide Total
Financial Reports
School Nutrition Fund: Budget and Positions by Major Object
Page 103
FY 2024 Proposed Budget Financial Reports Character TitleMajor Object TitleDollar ($) FTE Dollar ($) FTE Dollar ($) FTE Dollar ($)FTEDollar ($)FTEDollar ($) FTE Administrative Regular 1501.00 1541.00 1571.00 1601.00 1681.00 7Professional Other Regular 1532.00 1742.00 1792.00 1892.00 1692.00 -20Support Regular 1774.00 1823.00 1863.00 1973.00 2063.00 9Operative Regular 1323.00 1573.00 1893.00 1983.00 2023.00 5Services Regular 2,192101.00 2,18696.00 3,177111.00 3,419112.00 3,585111.00 166(1.00) Service Intermittent 219190 0Overtime 1722 0Services OT 51 0Services Substitutes 9738 0Professional Instruction Supplements 33 0Trades Regular 61561.00 -51.00 Support Supplements 82-63,145111.00 3,104105.00 3,887120.00 4,231121.00 4,388121.00 157FICA/Medicare 22822730132333512Retirement/Group Life 259278345388358-30Hospital/Medical Plans 9359201,0811,1001,12828Other Insurance 10101512175Other Benefits 0 01,4331,4361,7421,8231,839 15Professional ServicesBusiness Services 102110Professional ServicesInstructional Support 10110Maintenance Services And Contracts 741148812517045Printing And Binding 81910122831169813718447Internal Services Print Shop 708880708880Communications 671110100Travel 1511020200Course/ Event Fees and Dues 44778125122837381Educational And Recreational Supplies 235289323380518138Food Supplies And Food Service Supplies 3,5002,9583,9914,2184,28669Technology 363450296031Repair and Maintenance Supplies 0Laundry, Housekeeping and Janitorial Supplies 4838575065163,8203,3184,4214,6774,929252Machinery and Equipment Replacement 5152002002000Technology Replacement 105561Machinery and Equipment Additional 8326458009001,000100Technology Additional 21252010-108866621,0101,1251,216919,397111.00 8,649105.00 11,194120.00 12,037121.00 12,601121.00 563Note: Dollar amounts are presented in thousands. Grand Total Salaries Salaries Total Employee Benefits Employee Benefits Total Purchased Services Purchased Services Total Internal Services Total Other Charges Other Charges Total Materials and Supplies Materials and Supplies Total Capital Outlay Capital Outlay Total Change FY 2023 to FY 2024 FY 2020 Actual FY 2021 Actual FY 2022 Final FY 2023 Final FY 2024 Proposed
ACPS
Financial Reports
School Nutrition Fund: Budget and Positions by Major Program
School Nutrition Fund: Budget and Positions by Function
Page 104 ACPS FY 2024 Proposed Budget Financial Reports Function Roll UpDollar ($) FTE Dollar ($) FTE Dollar ($) FTE Dollar ($)FTEDollar ($)FTEDollar ($) FTE School Food And Other 312102516-9School Food Services 9,394111.00 8,637105.00 11,184120.00 12,012121.00 12,585121.00 572Grand Total 9,397111.00 8,649105.00 11,194120.00 12,037121.00 12,601121.00 563Note: Dollar amounts are presented in thousands. Change FY 2023 to FY 2024 FY 2020 Actual FY 2021 Actual FY 2022 Final FY 2023 Final FY 2024 Proposed Program Group TitleDollar ($) FTE Dollar ($) FTE Dollar ($) FTE Dollar ($)FTEDollar ($)FTEDollar ($) FTE Division-Wide 0 0School Food Services 9,309111.00 8,597105.00 11,194120.00 12,037121.00 12,601121.00 563Summer and Extended 8853 0Grand Total 9,397111.00 8,649105.00 11,194120.00 12,037121.00 12,601121.00 563Note: Dollar amounts are presented in thousands. Change FY 2023 to FY 2024 FY 2020 Actual FY 2021 Actual FY 2022 Final FY 2023 Final FY 2024 Proposed
Financial Reports
Grants and Special Projects: Budget and Positions by Fund and Section
Page 105 ACPS FY 2024 Proposed Budget Financial Reports Fund Classification Fund Type Section TitleDollar ($) FTE Dollar ($) FTE Dollar ($) FTE Dollar ($)FTEDollar ($) FTE Dollar ($) FTE Non Department 0 0Adult Education 131131142152141-12Non Department 0 0Career and Technical 268- 141333- 317- 309-8Non Department 0 0Adult Education 160.12 1616- 16- 204Non Department 0 0Charles Barrett ES 00 0Jefferson-Houston School 00 0William Ramsay ES 1 0Early Childhood Center 00 0Ofc. of Schl, Bus. & Com Partn 172133 0Curriculum Design & Inst Srvcs 0 0Specialized Instruction 4 0Student Services 1 0School Nutrition Services 28 0Non Department 0 0Lyles-Crouch Traditional Acad 0 0Alexandria City HS King St 0Specialized Instruction 2,80826.00 3,01821.50 3,03022.50 3,03022.50 3,03023.50 01.00 Non Department 0 0Specialized Instruction 951.00 951.00 951.00 951.00 1011.00 6Non Department 0 0Student Services 25323030310Non Department 0 0Curriculum Design & Inst Srvcs 6456200Non Department 0 0Cora Kelly School 2411.00 1701.00 2231.00 2411.00 1521.00 -88James K. Polk ES 4781.60 4002.00 3852.00 4161.80 4052.00 -110.20 Jefferson-Houston School 3602.00 2992.40 2972.40 3215.50 3213.00 0(2.50) John Adams ES 4282.00 3882.00 3522.00 4052.00 4253.00 201.00 Patrick Henry ES 3201.50 1901.50 4731.50 5691.50 5752.50 61.00 William Ramsay ES 4412.00 3752.50 4022.50 4172.50 3632.50 -53Ferdinand T. Day ES 2230.50 2972.10 2952.10 3922.10 3593.20 -331.10 Francis C. Hammond MS 8996.00 8446.00 8276.50 9326.50 8946.50 -39Title I Programs 1,1824.75 1,2724.25 1,0114.25 6334.25 4924.25 -141Non Department 0 0NVJDC Juvenile Detention 220 0Financial Services 980Non Department 0 0Jefferson-Houston School 14751 0Title I Programs 50 0Non Department 0 0Talent Development 5131.00 418620- 1.00 447447(1.00) Instructional Support 5951481.00 -4471.00 Non Department 0 0English Learner Services 27564343430Non Department 0 0Mount Vernon Community 1.00 0- - 0English Learner Services 7302.00 4543.00 5823.00 5893.00 6323.00 43Non Department 0 0Community Partnerships & 6851.00 7961.00 8932.00 9081.00 9841.00 77Non Department 0 0Pre-Kindergarten Programs 32323224-24Non Department 0 0Pre-Kindergarten Programs 50515159-59Non Department 0 0Specialized Instruction 1024671.00 5523.00 5523.00 5523.00 0Ofc. of Schl, Bus. & Com Partn 3453403443473School Nutrition Services 83-5Ofc. of Schl, Bus. & Com Partn 0 0Community Partnerships & Engag 287 0Specialized Instruction 160 0English Learner Services 159 0Technology Services 3,515 0Student Services 77 0Facilities & Operations 1,187 0School Nutrition Services 552 0Division-Wide Rev and 0 0Financial Services 43 0FY 2021 Actual FY 2022 Final FY 2023 Final FY 2024 Proposed FY 2020 Actual Title III, Part A Title IV, Part B VQ Infant/Toddler Supp VQRIS Regular IDEA, Part B CEIS Title IV, Part A CARES Act Adult Ed & Family Literacy Act Carl Perkins Voc Ed DCJS-Detention Center Federal Miscellaneous Funds IDEA, Part B IDEA, Preschool McKinney Vento Safe Routes to School Title I, Part A Title I, Part D Title I, SIG 1003 (a) Title II, Part A Title III, Imm/Youth Federal Funds Change FY 2023 to FY 2024
Grants and Special Projects: Budget and Positions by Fund and Section (Continue)
Financial Reports
Page 106
FY
Proposed Budget Financial Reports Fund Classification Fund Type Section TitleDollar ($) FTE Dollar ($) FTE Dollar ($) FTE Dollar ($)FTEDollar ($) FTE Dollar ($) FTE FY 2021 Actual FY 2022 Final FY 2023 Final FY 2024 Proposed FY 2020 Actual Change FY 2023 to FY 2024 Teaching, Learning, Leadership 169 0Pupil Transportation 262 0Non Department 0 0School Nutrition Services 50 0Ofc. of Schl, Bus. & Com Partn 1.00 0Community Partnerships & Engag 1.00 0Career and Technical Education 1.00 0Student Services 4.00 0Financial Services 115,4921.00 0Human Resources 1,102 0ARP Act Financial Services 34,7930COPS Justice Safety & Security Services 97 010,49753.47 18,19451.25 61,42663.75 11,08858.65 10,77560.45 -3141.80 Non Department 0 0Adult Education 1210.88 1231.00 1231.00 1231.00 1231.00 00.01 Non Department 0 0Adult Education 55178282820Non Department 0 0Student Services 1 0Non Department 0 0Alexandria City HS King St 9 0Non Department 0-215215Technology Services 348 0Division-Wide Human 0Non Department 0 0Community Partnerships & 53100Non Department 0 0Curriculum Design & Inst Srvcs 276 0Non Department 0 0Cora Kelly School 22 0George Mason ES 1 0James K. Polk ES 51 0Jefferson-Houston School 10 0John Adams ES 57 0Lyles-Crouch Traditional Acad 5 0Naomi L. Brooks ES 60 0Patrick Henry ES 10 0Samuel W. Tucker ES 1 0William Ramsay ES 37 0Ferdinand T. Day ES 815 0Francis C. Hammond MS 0 0George Washington MS 11 0Alexandria City HS King St 73 0Ofc. of Schl, Bus. & Com 20 0Community Partnerships & Engag 2210 0Curriculum Design & Inst Srvcs 113 0Talent Development 67 0Pre-Kindergarten Programs 4 0Specialized Instruction 80 0Technology Services 33 0Student Services 0 0Alternative Programs & Equity 0 0Facilities & Operations 40 0School Nutrition Services 15 0Humanities 40 0Non Department 0 0NVJDC Juvenile Detention 0 0Science Fairs Non Department 0 0Non Department 0 0Alexandria City HS Athletics 0 0Interscholastic Funds Non Department 0 0Green School Challenge Non Department 0 0Exxon Mobile Non Department 0 0Remember Our Kids Non Department 0 0Your Place in History Non Department 0 0NVCC Subgrant Non Department 0 0CRRSA Act Adult Detention Center Adult Ed Revolving Account At-Risk Children's Fund ECMC Foundation E-rate FCC Universal Service Homes for America 21 CCLC Instrumental Music Local Miscellaneous Funds NVA Juvenile Detn Greenhouse Titans Robotics STEM Club Federal Funds Total Local Funds NSLP Equipment
ACPS
2024
Grants and Special Projects: Budget and Positions by Fund and Section (Continue)
Financial Reports
Page 107 ACPS FY 2024 Proposed Budget Financial Reports Fund Classification Fund Type Section TitleDollar ($) FTE Dollar ($) FTE Dollar ($) FTE Dollar ($)FTEDollar ($) FTE Dollar ($) FTE FY 2021 Actual FY 2022 Final FY 2023 Final FY 2024 Proposed FY 2020 Actual Change FY 2023 to FY 2024 Frank E. Mann Municipal Trust Non Department 0 0Earth Force Non Department 0 0NEA Nurse Project Non Department 0 0Non Department 0 0Specialized Instruction 5005125.00 6475.00 6475.00 6605.00 13Non Department 0 0Curriculum Design & Inst 2030 0Non Department 0 0James K. Polk ES 9 0John Adams ES 0 0Amazon Virtual PLUS+ Community Partnerships & Engag 67 0Charles Barrett ES 3 0Cora Kelly School 8 0Douglas MacArthur ES 0 0George Mason ES 0 0James K. Polk ES 17 0Jefferson-Houston School 2 0John Adams ES 0 0Lyles-Crouch Traditional Acad 1 0Naomi L. Brooks ES 1 0Samuel W. Tucker ES 1 0William Ramsay ES 7 0Ferdinand T. Day ES 14 0Alexandria City HS King St 5 0Alternative Education 0 0Community Partnerships & Engag 13 0Curriculum Design & Inst Srvcs 18 0Bilingual Family & Community Engagement Early Childhood Specialist Community Partnerships & Engag 1061.00 1061.00 9270.88 9676.00 8526.00 6376.00 9707.00 3331.01 Non Department 0 0Career and Technical Education 55561Non Department 0 0Career and Technical Education 12131312142Non Department 0 0Secondary School Instru INACT 8868959392-2Non Department 0 0Talent Development 1220-2Non Department 0 0Charles Barrett ES 21 0Cora Kelly School 60 0Douglas MacArthur ES 84 0George Mason ES 212 0James K. Polk ES 3000Jefferson-Houston School 34 0John Adams ES 40 0Lyles-Crouch Traditional Acad 0 0Naomi L. Brooks ES 0 0Mount Vernon Community School 0 0Patrick Henry ES 138 0Samuel W. Tucker ES 1519 0William Ramsay ES 0 0Ferdinand T. Day ES 1 0Elementary School Instru INACT 0191545337-208Non Department 0 0Adult Education 17171717170Non Department 0 0Adult Education 28183433330Non Department 0 0Career and Technical Education 14181813152Non Department 0 0Talent Development 026880Non Department 0 0Jefferson-Houston School 555550Non Department 0 0NVJDC Juvenile Detention 1,60112.00 1,67911.00 1,55611.00 1,74411.00 1,71310.00 -31(1.00) Non Department 0 0Alexandria City HS King St 171713130Non Department 0 0Adult Education 17171717170Non Department 0 0Cora Kelly School 7 0State Funds Local Funds Total SPED - Regional Tuition FIRST LEGO League Target US Soccer Foundation Algebra Readiness Career Switcher New Mentor NVJDC Juvenile Detention Project Graduation Mentor Teacher/ Clinical Middle School Teacher Corps Race to GED FY 2007 Early Reading Intervention General Adult Education Individual Student Alt. Ed. Industry Certification Exams Runningbrooke Add IndustryCredential STEM-H Additional CTE State Equipment
Grants and Special Projects: Budget and Positions by Fund and Section (Continue)
Note: Dollar amounts are presented in thousands.
Funding provided from Coronavirus Response and Relief Supplemental Appropriations (CRRSA) Act (ESSER II) and American Rescue Plan (ARP) (ESSER III) was appropriated in FY 2022.
Financial Reports
Page 108 ACPS FY 2024 Proposed Budget Financial Reports Fund Classification Fund Type Section TitleDollar ($) FTE Dollar ($) FTE Dollar ($) FTE Dollar ($)FTEDollar ($) FTE Dollar ($) FTE FY 2021 Actual FY 2022 Final FY 2023 Final FY 2024 Proposed FY 2020 Actual Change FY 2023 to FY 2024 Naomi L. Brooks ES 25 0William Ramsay ES 23 0George Washington MS 43 0Alexandria City HS King St 153 0Facilities & Operations 0Safety & Security Services 0 0Non Department 0 0Career and Technical Education 15161616182Non Department 0 0Cora Kelly School 0 0Jefferson-Houston School 11 0Francis C. Hammond MS 1515 0George Washington MS 1115 0Alexandria City HS King St 1730 0Alexandria City HS Athletics 1 0Alexandria City HS Minnie Hwrd 1817 0Community Partnerships & Engag 2 0Career and Technical Education 22893330Pre-Kindergarten Programs 6 0Non Department 0 0Pre-K-12 Programs 5819436336336330Non Department 0 0Douglas MacArthur ES 6838.00 6838.00 James K. Polk ES 216.00 0Jefferson-Houston School 1712.00 1752.00 1802.00 1462.00 1542.00 9Patrick Henry ES 260 0William Ramsay ES 3214.00 3294.00 3413.00 3603.00 3854.00 241.00 Early Childhood Center 1,37212.00 1,45518.00 1,48018.00 1,51618.00 1,57218.00 56Pre-Kindergarten Programs 2462.00 3752.00 5263.00 7043.00 3882.00 -317(1.00) Mentor Teacher/Hardto-Staff Non Department 0 04,67938.00 5,62237.00 5,17337.00 5,88537.00 6,10644.00 2207.00 16,10392.35 24,78394.25 67,451106.75 17,611101.65 17,851111.45 2409.81
VPI Reallocated Balance VPI VA Preschool Initiative State Funds Total Grand Total State Miscellaneous Funds School Security Equip Grant Secondary Technology VocEd
Financial Reports
Grants and Special Projects: Budget and Positions by Major Object
Character TitleMajor Object TitleDollar ($) FTE Dollar ($) FTE Dollar ($) FTE Dollar ($)FTEDollar ($)FTEDollar ($) FTE Administrative Regular 2941.75 2671.75 2506.75 4217.75 3072.75 -113(5.00) Operative Intermittent 00 0Overtime 681110Professional Instruction 5,97667.60 6,50571.00 7,09670.50 7,07372.40 7,50681.20 4338.80 Professional Instruction 160585841-18Professional Instruction 609271537875586-289Professional Instruction 50930667442851992Professional Other 5621509382-11Professional Other 3985.00 4563.50 43210.50 4283.50 3573.50 -71Support Intermittent 2957124-7Support Regular 56416.00 55616.00 58117.00 57416.00 70321.00 1295.00 Support Substitutes 01110Support Supplements 20- 21217- 56- 9236Technical Intermittent 8777867310-64Technical Regular 2302.00 1402.00 1102.00 -1012.00 1953.00 2951.00 Operative Regular 123 0Laborer Supplements 70-78,79492.35 8,75594.25 10,101106.75 9,999101.65 10,403111.45 405 9.80 FICA/Medicare 652643767963850-113Hospital/Medical Plans 9161,0041,1111,1571,279122Other Benefits 94330Other Insurance 27293336371Retirement/Group Life 1,2741,3721,4861,6171,689712,9643,0483,3973,7763,85781Maintenance Services 16543243Printing And Binding 775220Professional Services - 5118424770Professional Services - 8551,361806816762-54Professional Services - 2322,13950,458472277-196Professional Services - 220 0Transportation Services 5032294111Computer and Software 116141621,1664,08151,3291,3411,109-232Print Shop 264143Transportation 410545240-11Food/Food Services 0 0Data Processing 0 0436585344-9Awards and Grants 3700Communications 56812220Contribution to Other 5811,2196336336330Leases And Rentals 0000Miscellaneous 203000Travel 1488206188178-10Course/ Event Fees and 124341915-57531,920878842828-15Educational And 1,0071,935819845542-303Food Supplies And Food 29282646760-8Laundry, Housekeeping 115511Other Supplies 2449277050-21Repair and Maintenance 63781794536Technology 4071,089288229368138Textbooks 56111011031041Vehicle/Power Equipment 002220Medical and Laboratory 2423350001,5643,8211,3521,3271,170-156FY 2020 Actual FY 2021 Actual FY 2022 Final FY 2023 Final FY 2024 Proposed Materials and Supplies Materials and Supplies Total Purchased Services Total Internal Services Internal Services Total Other Charges Other Charges Total Salaries Salaries Total Employee Benefits Employee Benefits Total Purchased Services Change FY 2023 to FY 2024 Page 109 ACPS FY 2024 Proposed Budget Financial Reports
Financial Reports
Grants and Special Projects: Budget and Positions by Major Object (Continue)
Note: Dollar amounts are presented in thousands.
Funding provided from Coronavirus Response and Relief Supplemental Appropriations (CRRSA) Act (ESSER II) and American Rescue Plan (ARP) (ESSER III) was appropriated in FY 2022.
Character TitleMajor Object TitleDollar ($) FTE Dollar ($) FTE Dollar ($) FTE Dollar ($)FTEDollar ($)FTEDollar ($) FTE FY 2020 Actual FY 2021 Actual FY 2022 Final FY 2023 Final FY 2024 Proposed Change FY 2023 to FY 2024 Communications 7915150Communications 0Furniture and Fixtures 30 0Furniture and Fixtures 917 0Machinery and Equipment 1254411831-1Technology Additional 51,288 0Technology Replacement 2531,2915819520813Building Improvement 13 04083,043862132251215,69192.35 24,67494.25 67,202106.75 17,550101.65 17,636111.45 859.80
Capital Outlay Capital Outlay Total Grand Total
Page 110 ACPS FY 2024 Proposed Budget Financial Reports
Financial Reports
Grants and Special Projects: Budget and Positions by Major Program
Funding provided from Coronavirus Response and Relief Supplemental Appropriations (CRRSA) Act (ESSER II) and American Rescue Plan (ARP) (ESSER III) was appropriated in FY 2022.
Page 111 ACPS FY 2024 Proposed Budget Financial Reports Program Group Title Dollar ($) FTE Dollar ($) FTE Dollar ($) FTE Dollar ($)FTEDollar ($)FTEDollar ($) FTE Evaluation and Planning 169 0Technology Services Management 343,555 0Kindergarten and PreKindergarten 2,83326.00 3,36626.00 3,24526.00 3,44526.00 3,81534.00 3708.00 Instructional Core 2,0596.50 2,7056.50 1,6566.50 2,1056.90 2,0889.00 -172.10 Improvement of Instruction 2,49312.85 2,38914.65 2,72019.65 2,98223.15 2,56813.75 -414(9.40) Enrichment and Electives 186392555324-28Exemplary Programs 136380100200150-50Career and Technical Education 290- 2283331.00 317- 309-8Alternative and At-Promise Education 7133.00 9502.00 3942.00 2972.00 1212.00 -176EL 8464.00 7945.10 7214.10 8714.10 9005.10 291.00 Special Education 3,60528.00 4,33528.50 4,50727.50 4,43627.50 4,44935.50 138.00 Summer and Extended Learning 9691.00 8551.00 1,2732.00 1,0971.00 1,1071.00 10Adult Education 4161.00 3731.00 3421.00 4691.00 4651.00 -30.01 State Hospitals, Clinics, and Detention 1,27010.00 1,3109.00 1,3019.00 1,3559.00 1,3198.00 -36(1.00) Partnerships, Family and Community Engagement 953911691.00 183071.00 2891.00 School Administration 319300Student Services 941880.50 2835.00 1441.00 1401.10 -30.10 Technology Services 156527149-4Transportation 262 0Operations and Maintenance 41,56317077School Food Services 3664221247248Division-Wide 00-215215Executive Administration 0 0Communications and Information Services 5 0Business Development 1.00 0Financial Services 4450,2851.00 016,10392.35 24,97494.25 67,451106.75 17,611101.65 17,851111.45 2409.80 Note: Dollar amounts are presented in thousands. FY 2024 Proposed Change Grand Total FY 2020 Actual FY 2021 Actual FY 2022 Final FY 2023 Final
Financial Reports
Grants and Special Projects: Budget and Positions by Function
Funding provided from Coronavirus Response and Relief Supplemental Appropriations (CRRSA) Act (ESSER II) and American Rescue Plan (ARP) (ESSER III) was appropriated in FY 2022.
Page 112 ACPS FY 2024 Proposed Budget Financial Reports State Function Rollup Function Roll-up Dollar ($) FTE Dollar ($) FTE Dollar ($) FTE Dollar ($)FTEDollar ($)FTEDollar ($) FTE Classroom Instruction 7,88640.00 8,44340.60 7,80542.10 8,55441.50 8,79853.10 24411.61 Instructional SupportSchool Administration 1931.00 2201.00 2101.00 2171.00 2151.00 -2Instructional SupportStaff 6,30743.35 8,06445.15 7,46648.65 7,49451.15 7,12347.25 -371(3.90) Instructional SupportStudent 6564.00 6344.50 9185.00 7254.00 7316.10 62.10 15,04188.35 17,36091.25 16,39996.75 16,99197.65 16,868107.45 -1239.80 Administration 5384.00 6122.00 50,7247.00 2794.00 3973.00 118(1.00) Attendance and Health Services 362061.00 1263.00 89891.00 01.00 5744.00 8193.00 50,85010.00 3694.00 4874.00 118Vehicle Operation Services 101310100Other Vehicle and Equipment 262 012621310100Facilities, Management and Direction 1,024 0Grounds Services 0Security Services 361 0Building Services 4179131616041,5631316160Community Services 235140-4School Food Services 44644343985464699434428542Technology, Administration 34186 0Technology, Classroom Instruction 3751,045124395383-13Technology, Instructional Support 152,74413220Technology, Operations and Maintenance 040004243,975142398385-139 - Division-Wide Division-Wide 31,68432,419-21521531,68432,419-21521547,77492.35 57,39294.25 67,451106.75 17,611101.65 17,851111.45 2409.80 Note: Dollar amounts are presented in thousands. 1 - Instruction 1 - Instruction Total 2 - Admin, Attendance, and Health FY 2020 Actual FY 2021 Actual FY 2022 Final FY 2023 Final FY 2024 Proposed 2 - Admin, Attendance, and Health Total 3 - Pupil Transportation 3 - Pupil Transportation Total 4 - Operations and Maintenance 4 - Operations and Maintenance Total 5 - School Food Services & Other 5 - School Food Services & Other Ops Total 8 - Technology 8 - Technology Total 9 - Division-Wide Total Grand Total Change FY 2023 to FY 2024
Personnel Reports
Overview
The FY 2024 Final Budget personnel report is presented on the following pages. Information is included for FY 2021, FY 2022, and FY 2023 and FY 2024 Proposed Budget years.
Summary of Staffing Changes
Total division-wide staffing is projected to total 2,700.15 FTEs; Operating Fund to 2,439.50 FTEs, Grant and Special Projects Fund to 139.65 FTEs, and School Nutrition Fund to 121.00 FTEs. This is a net increase of 39.00 FTEs compared to the prior fiscal year.
The school budget contains non-enrollment and enrollment-driven staffing adjustments. Enrollment-driven staffing adjustments include elementary homeroom teachers and kindergarten instructional assistant, elementary encore (art, vocal music, physical education, and library media specialist), student improvement FTEs, assistant principals, English learner (EL) teachers, special education teachers and instructional assistant, and SOQ required positions. Staffing at the schools and alternative education will increase by 3.90 FTEs for FY 2023 compared to the prior fiscal year.
Major department staffing changes includes the addition of 6.00 FTE bus driver positions and the reorganization of the Human Resources and Facilities & Mainteance Department to improve or expand services provided throughout the division. The FY 2023 Final Budget adds an additional 7.80 FTEs compared to the prior fiscal year.
Page 113 ACPS FY 2024 Proposed Budget Personnel Reports
Combined Funds: Positions by Cost Center
Page 114 ACPS FY 2024 Proposed Budget Personnel Reports
Cost Center TitleFund Group Program Roll-Up Group Title Object Title FY 2020 Final FTE FY 2021 Final FTE FY 2022 Final FTE FY 2023 Final FTE FY 2024 Proposed FTE Change FY 2023 to FY2024 Division-WideOperating Fund Division-WideReserve Instructional Asst- - - - 4.00 4.00 Reserve Teachers5.00 9.00 13.00 13.10 12.41 (0.69) ELReserve Teachers- 2.00 - - -Special EducationReserve Paraprofessionals2.00 - - - -Reserve Teachers4.00 3.00 5.00 6.00 6.00Operating Fund Total11.00 14.00 18.00 19.10 22.41 3.31 Division-Wide Total 11.00 14.00 18.00 19.10 22.41 3.31 Elementary Grant and Special Projects Alternative and At-Pr Administrative Asst/ Clerical1.00 1.00 1.00 1.00 1.00Teacher- - - - 1.00 1.00 Teacher Specialist/ Coach2.00 1.00 1.00 - -ELTeacher- - 0.10 0.60 1.10 0.50 Teacher Specialist/ Coach1.00 - - - -Enrichment and ElectivTeacher- - - - 0.40 0.40 Exemplary ProgramsAdministrative Asst/ Clerical- - - - -Teacher Specialist/ Coach- - - - -Improvement of InstrucCoordinator/ Program Manager2.00 0.50 0.50 0.50 0.50Director0.75 0.75 0.75 0.75 0.75Executive Director- 0.50 - - -Other Technical/ Analyst- - - - 0.50 0.50 Teacher- - - - -Teacher Specialist/ Coach6.60 11.00 11.40 12.00 11.50 (0.50) Instructional CoreInstructional Assistant- - - - 1.00 1.00 Teacher3.00 2.00 2.00 1.30 2.50 1.20 Teacher Specialist/ Coach- - - 2.00 1.00 (1.00) Kindergarten and Pre- Paraprofessional- - - - -Teacher Specialist/ Coach- - - - 1.00 1.00 Special EducationAsst Director/ Manager1.00 1.00 1.00 1.00 1.00Director- - - 1.00 1.00Paraprofessional- - - - -Teacher1.00 3.00 3.50 3.50 4.50 1.00 Teacher Specialist/ Coach16.00 20.00 21.00 21.00 21.00Student ServicesCounselor- - 0.50 0.50 0.60 0.10 Summer and ExtendedCoordinator/ Program Manager- 2.00 1.00 1.00 1.00Grant and Special Projects Total34.35 42.75 43.75 46.15 51.35 5.20 Operating Fund Career and Technical Teacher0.60 - - - -Communications and I Administrative Asst/ Clerical11.20 11.80 11.70 11.70 11.70Librarian15.00 14.30 14.00 14.00 14.00ELAdministrative Asst/ Clerical1.50 1.50 1.50 1.50 1.50Executive Director0.50 0.50 0.50 0.50 0.50Other Technical/ Analyst0.50 0.50 0.50 0.50 0.50Teacher89.00 91.00 90.50 90.50 93.00 2.50 Teacher Specialist/ Coach5.50 5.25 5.75 4.75 3.50 (1.25) Enrichment and ElectivDirector- - 0.50 0.50 0.50Teacher109.50 111.80 107.30 107.60 108.00 0.40 Teacher Specialist/ Coach0.50 0.50 - - 2.00 2.00 Exemplary ProgramsTeacher2.50 - - - -Teacher Specialist/ Coach1.50 1.50 1.50 1.50 1.50Improvement of InstrucAdministrative Asst/ Clerical1.00 1.00 1.00 1.00 1.00Director0.25 0.25 0.25 0.25 0.25Executive Director1.00 1.00 1.50 1.50 1.50Student Improvement (FLEX) Adj- - - - -Teacher2.00 - - - -Teacher Specialist/ Coach27.00 25.10 24.50 23.50 22.00 (1.50) Instructional CoreEncore Adjustments- 0.00 - - -Paraprofessional2.00 - - - -Student Improvement (FLEX) Adj- - - - -Teacher322.00 336.20 318.10 326.10 330.80 4.70 Teacher Specialist/ Coach1.50 0.50 3.00 2.00 3.00 1.00 Kindergarten and Pre- Administrative Asst/ Clerical1.00 1.00 1.00 1.00 1.00Assistant Principal/ Dean0.50 1.00 1.00 1.00 1.00Encore Adjustments- - - - -Instructional Assistant- 70.00 74.00 73.00 65.00 (8.00) Paraprofessional73.00 - - - -Principal1.00 1.00 1.00 1.00 1.00Social Worker0.60 0.60 0.60 0.60 0.60Teacher73.00 70.00 74.00 69.00 66.00 (3.00) Partnerships, Family a Administrative Asst/ Clerical0.50 1.50 1.00 1.00 1.00Other Technical/ Analyst5.00 5.00 6.00 6.00 6.00School AdministrationAdministrative Asst/ Clerical24.50 24.50 24.00 24.00 24.00Assistant Principal/ Dean24.00 25.00 25.00 25.00 25.00Hall Monitor1.00 - - - -Principal14.00 14.00 14.00 14.00 14.00Teacher Specialist/ Coach- - - - -Special EducationAdministrative Asst/ Clerical1.50 1.50 1.50 1.50 1.50Asst Director/ Manager1.00 1.00 1.00 - -Coordinator/ Program Manager- - - - -Executive Director0.50 0.50 0.50 0.50 0.50Instructional Assistant- 117.00 117.00 119.00 113.00 (6.00) Other Technical/ Analyst0.50 0.50 1.50 1.50 1.50Paraprofessional112.00 - - - -Teacher124.10 126.60 129.60 129.00 127.00 (2.00) Teacher Specialist/ Coach3.00 4.50 2.00 2.00 2.00Student ServicesAdministrative Asst/ Clerical- 0.50 0.50 - -Counselor19.60 21.00 21.30 21.70 24.60 2.90 Instructional Assistant- 3.00 3.00 3.00 3.00Paraprofessional3.00 - - - - -
Personnel Reports
Combined Funds: Positions by Cost Center (cont.)
Page 115 ACPS FY 2024 Proposed Budget Personnel Reports
ElementaryOperating Fund Student ServicesSocial Worker14.00 14.00 14.00 14.00 14.00Operating Fund Total1,091.85 1,106.40 1,095.60 1,095.20 1,086.95 (8.25) Elementary Total 1,126.20 1,149.15 1,139.35 1,141.35 1,138.30 (3.05) Instructional Supp Grant and Special Adult EducationTeacher1.00 1.00 1.00 1.00 1.00ELAdministrative Asst/ Clerical- - - - 2.00 2.00 Other Technical/ Analyst2.00 3.00 2.00 2.00 2.00Teacher Specialist/ Coach- - 1.00 1.00 1.00Evaluation and PlanninOther Prof/ Senior Analyst- - - - 2.00 2.00 Exemplary ProgramsOther Prof/ Senior Analyst- - - - -Teacher Specialist/ Coach- - - - -Improvement of InstrucTeacher Specialist/ Coach- - - 1.00 2.00 1.00 Instructional CoreTeacher Specialist/ Coach- - - - -Kindergarten and Pre- Administrative Asst/ Clerical1.00 2.00 1.00 1.00 1.00Coordinator/ Program Manager1.00 1.00 1.00 1.00 1.00Instructional Assistant- 11.00 12.00 12.00 12.00Paraprofessional12.00 - - - -Teacher12.00 12.00 12.00 12.00 12.00Partnerships, Family a Coordinator/ Program Manager- - 1.00 - 1.00 1.00 Other Technical/ Analyst- - - - 1.00 1.00 Special EducationTeacher- - - - 1.00 1.00 State Hospitals, ClinicsAdministrative Asst/ Clerical1.00 1.00 1.00 1.00 1.00Teacher9.00 9.00 8.00 8.00 7.00 (1.00) Teacher Specialist/ Coach- - - - -Student ServicesCounselor- - - - 2.00 2.00 Director- - - - 1.00 1.00 Nurse- - 1.00 - 0.40 0.40 Other Prof/ Senior Analyst- - 1.00 - 1.00 1.00 Other Technical/ Analyst- - - - 1.00 1.00 Psychologist- - 2.00 - 2.00 2.00 Social Worker- - - - 0.70 0.70 Summer and ExtendedAdministrative Asst/ Clerical- - - - 1.00 1.00 Coordinator/ Program Manager1.00 - 1.00 - 1.00 1.00 Other Prof/ Senior Analyst- - - - 1.00 1.00 Technology ServicesTeacher Specialist/ Coach- - - - -Technology Services MAdministrative Asst/ Clerical- - - - -Grant and Special Projects Total40.00 40.00 45.00 40.00 58.10 18.10 Operating Fund Adult EducationAdministrative Asst/ Clerical2.00 2.00 2.00 2.00 2.00Coordinator/ Program Manager1.00 1.00 - - -Director- - 1.00 1.00 1.00Alternative and At-Pro Administrative Asst/ Clerical1.00 1.00 1.00 1.00 1.00Assistant Principal/ Dean- 1.00 1.00 - -Instructional Assistant- 1.00 1.00 1.00 1.00Paraprofessional1.00 - - - -Teacher6.00 5.00 5.00 5.00 5.00Board ServicesAdministrative Asst/ Clerical2.00 2.00 2.00 2.00 3.00 1.00 Director1.00 1.00 1.00 1.00 - (1.00) Executive Director- - - - 1.00 1.00 Business Developmen Other Prof/ Senior Analyst1.00 1.00 1.00 1.00 1.00Career and Technical Teacher- 2.00 - - -ELAdministrative Asst/ Clerical2.00 2.50 3.00 3.00 3.00Teacher1.00 1.00 1.00 1.00 1.00Enrichment and ElectivTeacher Specialist/ Coach- - - 1.00 1.00Evaluation and PlanninAdministrative Asst/ Clerical1.00 1.00 1.00 1.00 1.00Asst Sup/Chief Officer- - 1.00 1.00 1.00Executive Director1.00 1.00 - - -Other Prof/ Senior Analyst3.00 3.00 3.00 3.00 3.00Other Technical/ Analyst1.00 1.00 1.00 1.00 1.00Executive Administrati Administrative Asst/ Clerical2.00 2.00 2.00 2.00 2.00Asst Sup/Chief Officer- - 2.00 1.00 1.00Coordinator/ Program Manager1.00 1.00 1.00 1.00 1.00Executive Director1.00 1.00 - - -Other Technical/ Analyst1.00 1.00 1.00 1.00 1.00Superintendent1.00 1.00 1.00 1.00 1.00Exemplary ProgramsAdministrative Asst/ Clerical- - - - -Assistant Principal/ Dean1.00 - - - -Paraprofessional- - - - -Teacher- - - - -Improvement of InstrucAdministrative Asst/ Clerical4.00 4.00 4.00 4.00 4.00Asst Sup/Chief Officer- - 1.00 1.00 1.00Counselor2.00 2.00 2.00 2.00 - (2.00) Director1.00 - - - 1.00 1.00 Executive Director1.00 2.00 1.00 1.00 1.00Teacher Specialist/ Coach1.00 1.00 1.00 1.00 2.00 1.00 Instructional CoreAdministrative Asst/ Clerical1.00 - - - -Counselor1.00 1.00 1.00 1.00 1.00Nurse0.50 0.50 0.50 1.00 1.00Psychologist1.00 1.00 1.00 1.00 1.00Social Worker0.50 0.70 0.70 0.70 0.70Teacher500100100100100-
Personnel Reports
Combined Funds: Positions by Cost Center (cont.)
Page 116 ACPS FY 2024 Proposed Budget Personnel Reports
Instructional Supp Operating Fund Special EducationTeacher1.00 1.00 1.00 1.00 2.00 1.00 Teacher Specialist/ Coach1.00 1.00 1.00 1.00 1.00Student ServicesAdministrative Asst/ Clerical18.75 17.88 17.88 18.88 18.88Coordinator/ Program Manager1.00 - - - -Counselor1.00 1.00 1.00 1.00 3.00 2.00 Director1.00 3.00 3.00 3.00 3.00Executive Director1.00 2.00 2.00 2.00 2.00Nurse19.50 19.50 19.50 19.00 19.00Psychologist20.90 19.90 19.90 19.90 22.40 2.50 Social Worker3.00 2.00 1.00 1.60 1.60Teacher- - - - -Teacher Specialist/ Coach- - - - 1.00 1.00 Technology ServicesCoordinator/ Program Manager1.00 1.00 - - -Director- - 2.00 2.00 2.00Teacher Specialist/ Coach20.50 20.50 19.00 19.00 19.00Technology Services MAdministrative Asst/ Clerical2.00 2.00 2.00 2.00 2.00Asst Director/ Manager- 1.00 - - -Asst Sup/Chief Officer- - 1.00 1.00 1.00Computer and Network Support30.00 29.00 30.00 30.00 30.00Coordinator/ Program Manager1.00 1.00 1.00 1.00 1.00Director1.00 1.00 1.00 1.00 1.00Executive Director1.00 1.00 - - -Systems Analyst/ Programmer3.00 3.00 3.00 3.00 3.00Operating Fund Total204.57 200.02 200.02 200.62 208.12 7.49 #N/A Partnerships, Family a Other Technical/ Analyst- - - - 1.00 1.00 #N/A Total - - - - 1.00 1.00 Instructional Support Total 244.57 240.02 245.02 240.62 267.22 26.59 Operational Suppo Grant and Special Business Developmen Coordinator/ Program Manager- - 1.00 - 2.00 2.00 Communications and I Other Technical/ Analyst- - - - 3.00 3.00 Financial ServicesAdministrative Asst/ Clerical- - 0.50 - 1.00 1.00 Other Prof/ Senior Analyst- - - - 1.00 1.00 Human ResourcesAdministrative Asst/ Clerical- - - - 1.00 1.00 Grant and Special Projects Total- - 1.50 - 8.00 8.00 Operating Fund Communications and I Administrative Asst/ Clerical1.00 1.00 1.00 1.00 1.00Asst Director/ Manager- - - 1.00 1.00Asst Sup/Chief Officer- 1.00 1.00 1.00 1.00Computer and Network Support1.00 1.00 1.00 - -Director1.00 - - - -Executive Director- 1.00 1.00 1.00 1.00Other Technical/ Analyst5.00 6.00 5.50 5.50 5.50Executive Administrati Administrative Asst/ Clerical1.00 1.00 - - -Asst Sup/Chief Officer- 1.00 - - -Executive Director1.00 - - - -Other Prof/ Senior Analyst1.00 - - - -Financial ServicesAdministrative Asst/ Clerical7.00 8.00 6.00 6.00 6.00Asst Director/ Manager2.00 2.00 3.00 3.00 3.00Asst Sup/Chief Officer- - 1.00 1.00 1.00Director3.00 3.00 3.00 3.00 3.00Executive Director1.00 1.00 - 1.00 - (1.00) Other Prof/ Senior Analyst8.00 8.00 8.00 8.00 8.00Other Technical/ Analyst3.00 3.00 5.00 5.00 7.00 2.00 Human ResourcesAdministrative Asst/ Clerical3.00 3.00 3.00 3.00 1.00 (2.00) Asst Director/ Manager1.00 1.00 - - -Asst Sup/Chief Officer- - - 1.00 1.00Director2.00 2.00 3.00 3.00 3.00Executive Director1.00 1.00 1.00 1.00 1.00Other Technical/ Analyst7.00 7.00 8.00 8.00 10.00 2.00 Operations and MainteAdministrative Asst/ Clerical3.00 3.00 4.00 4.00 4.00Asst Director/ Manager2.00 1.00 1.00 1.00 1.00Asst Sup/Chief Officer- - - 1.00 1.00Building Engineer14.00 14.00 14.00 14.00 16.00 2.00 Coordinator/ Program Manager- 1.00 1.00 1.00 1.00Custodian35.00 32.00 30.00 29.00 27.00 (2.00) Custodian Supervisor1.00 1.00 1.00 1.00 1.00Director3.00 5.00 4.00 4.00 4.00Executive Director- 1.00 1.00 1.00 1.00General Maintenance13.00 12.00 9.00 9.00 9.00Maintenance Supervisor1.00 1.00 4.00 4.00 4.00Other Prof/ Senior Analyst10.00 9.00 13.00 13.00 13.00Other Technical/ Analyst1.60 1.60 1.60 1.60 1.60Security Guard1.00 1.00 - - -School AdministrationHall Monitor20.00 21.00 21.00 21.00 - (21.00) Security Guard1.00 1.00 - - 21.00 21.00 Student ServicesOther Technical/ Analyst- - 1.00 1.00 1.00TransportationAdministrative Asst/ Clerical2.00 2.00 2.00 2.00 2.00Asst Director/ Manager- - 1.00 1.00 1.00Bus Driver116.00 107.00 108.00 108.00 103.00 (5.00) Bus Monitor30.00 30.00 30.00 30.00 30.00Coordinator/ Program Manager1.00 1.00 - - -Director1.00 1.00 1.00 1.00 1.00 -
Personnel Reports
Combined Funds: Positions by Cost Center (cont.)
Page 117 ACPS FY 2024 Proposed Budget Personnel Reports
Operational Suppo School Nutrition School Food ServicesGeneral Maintenance- - - 1.00 1.00Other Driver3.00 3.00 3.00 3.00 3.00Other Prof/ Senior Analyst1.00 1.00 1.00 1.00 1.00School Nutrition Total111.00 125.00 120.00 121.00 121.00Operational Support Total 427.60 433.60 431.60 439.10 443.10 4.00 Secondary Grant and Special Career and Technical Supplmt Admin Asst/ Clerical- - - - -Teacher Specialist/ Coach- - 1.00 - 1.00 1.00 ELInstructional Assistant- - 1.00 - -Teacher1.00 1.00 1.00 2.00 3.00 1.00 Exemplary ProgramsTeacher Specialist/ Coach- - - - -Improvement of InstrucExecutive Director- 0.50 - - -Paraprofessional- - - - -Teacher Specialist/ Coach3.50 2.00 2.00 2.00 1.00 (1.00) Instructional CoreCoordinator/ Program Manager1.00 1.00 1.00 1.00 1.00Principal1.00 1.00 1.00 1.00 1.00Teacher- - - 2.00 2.00Teacher Specialist/ Coach1.50 2.50 2.50 0.50 0.50Special EducationInstructional Assistant- 1.00 1.00 1.00 1.00Paraprofessional1.00 - - - -Teacher- - - - -Teacher Specialist/ Coach9.00 7.00 5.00 5.00 8.00 3.00 Student ServicesCounselor- - 0.50 1.00 1.50 0.50 Psychologist- - - - 1.20 1.20 Grant and Special Projects Total18.00 16.00 16.00 15.50 21.20 5.70 Operating Fund Alternative and At-Pro Assistant Principal/ Dean- - - 1.00 1.00Other Technical/ Analyst1.00 2.00 2.00 2.00 2.00Social Worker1.00 - - - -Teacher2.00 3.00 3.00 3.00 3.00Teacher Specialist/ Coach- - - 1.00 1.00Career and Technical Coordinator/ Program Manager1.00 1.00 1.00 1.00 - (1.00) Counselor1.00 1.00 1.00 - -Director- - - - 1.00 1.00 Paraprofessional- - - - -Teacher46.80 49.60 50.60 51.60 50.80 (0.80) Teacher Specialist/ Coach- - 1.00 1.00 1.00Communications and I Administrative Asst/ Clerical2.00 2.00 2.00 2.00 2.00Librarian8.00 8.00 8.00 8.00 7.00 (1.00) ELAdministrative Asst/ Clerical1.50 1.50 3.50 3.50 3.50Assistant Principal/ Dean- - 3.00 3.00 3.00Coordinator/ Program Manager3.00 3.00 1.00 1.00 1.00Counselor4.00 - 4.00 3.00 3.00Executive Director0.50 0.50 0.50 0.50 0.50Other Technical/ Analyst2.50 2.50 2.50 2.50 2.50Paraprofessional1.00 - - - -Social Worker- - 1.00 1.00 1.00Teacher63.00 61.00 61.00 61.00 63.00 2.00 Teacher Specialist/ Coach2.00 4.25 3.75 3.75 3.50 (0.25) Enrichment and ElectivAdministrative Asst/ Clerical1.00 1.00 1.00 1.00 1.00Asst Director/ Manager1.00 1.00 1.00 1.00 1.00Director- - 2.50 2.50 1.50 (1.00) Executive Director- - - - 1.00 1.00 Instructional Assistant- - 1.00 1.00 1.00Paraprofessional- - - - -Teacher107.00 109.60 110.50 111.00 111.50 0.50 Teacher Specialist/ Coach1.50 1.50 1.00 - 1.00 1.00 Exemplary ProgramsOther Technical/ Analyst- - - - -Social Worker- - - - -Teacher7.50 5.50 8.00 8.00 8.00Teacher Specialist/ Coach1.00 1.00 1.00 1.00 1.00Financial AidAdministrative Asst/ Clerical1.00 1.00 1.00 1.00 1.00Improvement of InstrucAdministrative Asst/ Clerical1.00 1.00 1.00 1.00 1.00Executive Director1.00 1.00 1.50 1.50 1.50Teacher Specialist/ Coach14.50 14.50 14.50 14.50 13.50 (1.00) Instructional CoreAdministrative Asst/ Clerical1.00 - - - -Counselor- - - - -Paraprofessional- - - - -Teacher259.50 270.50 269.50 269.00 269.00Teacher Specialist/ Coach1.50 - - - -Partnerships, Family a Administrative Asst/ Clerical2.00 2.00 2.00 2.00 2.00School AdministrationAdministrative Asst/ Clerical28.00 29.00 27.00 27.00 27.00Assistant Principal/ Dean27.00 27.00 22.00 23.00 22.00 (1.00) Coordinator/ Program Manager- - 1.00 1.00 1.00Principal3.00 3.00 3.00 3.00 3.00Special EducationAdministrative Asst/ Clerical0.50 0.50 0.50 0.50 0.50Assistant Principal/ Dean- - 1.00 1.00 1.00Director- - - 1.00 1.00Executive Director0.50 0.50 0.50 0.50 0.50Instructional Assistant- 43.00 41.00 43.00 43.00Other Technical/ Analyst3.50 3.50 3.50 3.50 3.50Paraprofessional4100
Personnel Reports
Combined Funds: Positions by Cost Center (cont.)
Page 118 ACPS FY 2024 Proposed Budget Personnel Reports
SecondaryOperating Fund Student ServicesSocial Worker10.00 10.00 9.00 9.00 9.00Teacher Specialist/ Coach0.50 1.00 - - -Summer and ExtendedTeacher- 1.00 1.00 1.00 1.00Technology Services MComputer and Network Support2.00 2.00 2.00 2.00 2.00Operating Fund Total779.70 796.08 798.98 805.48 807.93 2.45 Secondary Total 797.70 812.08 814.98 820.98 829.13 8.15 Grand Total 2,607.07 2,648.84 2,648.95 2,661.15 2,700.15 39.00
Personnel Reports
Overview, Schools, Departments


Section IV: Information Overview

✓ Alexandria Community Demographics

✓ Enrollment & Staffing

✓ School Allocations


✓ Cost per Pupil
Section
IV:
Alexandria Community Demographics


Overview
The City of Alexandria has a total area of 15.48 square miles and has a population of 154,706 people, as of the 2021 Census Bureau Population Estimate. The 2021 dataset is a one year estimate collected between April 01, 2020 and July 1, 2021. ACPS is considered a component unit of the City of Alexandria. The city funds 79.9 percent of the FY 2024 operating budget. The quality of ACPS is a major factor in making Alexandria City a desirable place to live and work.
The chart below shows the city’s income below poverty level at 9.7 percent in FY 2021 while over half of ACPS students were eligible for free and reduced-price meals (FARM) in the following year. The FARM rate is the highest percentage of all Northern Virginia school divisions, and significantly different than the general Alexandria City population.

As shown in the chart above, the 2021 American Community Survey shows that 61.6 percent of Alexandria students attend kindergarten through grade 12, 31.7 percent attend college or graduate school, and 6.7 percent attend nursery school and preschool. Alexandria compares favorably to the rest of the country when it comes to economic characteristics of the community. In wealth and diversity, Alexandria is comparable to its neighbors; however, it differs substantially in the percentage of its school-age population.
As shown in the following chart, only 10.3 percent of the total city population is of school age (between ages 5 and 19) and is enrolled in public school.
City/County Income Below Poverty Level
Page 119 Enrollment & Staffing ACPS FY 2024 Proposed Budget
0.0% 5.0% 10.0% 15.0% 20.0% 25.0% Arlington County Fairfax County Loudoun County Prince William County Alexandria City 11.5% 16.6% 20.3% 19.6% 10.3% Percent of Total Population Ages 5 to 19 Enrolled in Public School Selected Northern Virginia Jurisdictions Source:U.S. Census Bureau, 2021 American Community Survey 6.7% 5.1% 40.1% 16.4% 17.1% 14.6% 0.0%5.0%10.0%15.0%20.0%25.0%30.0%35.0%40.0%45.0% Nursery school, preschool Kindergarten Elementary/Middle (grades 1 - 8) High school (grades 9 - 12) College, undergraduate Graduate or professional school School Levels of Current Alexandria Students Source: U.S. Census Bureau, 2021 American Community Survey 0.0% 1.0% 2.0% 3.0% 4.0% 5.0% 6.0% 7.0% 8.0% 9.0% 10.0% 201920202021 8.2% 9.5% 9.7% 8.8% 8.1% 8.3% 5.8% 7.1% 7.1% 3.0% 3.7% 3.5% 6.3% 6.5% 6.3%
Alexandria Arlington Fairfax Loudoun Prince William Source: U.S. Census Bureau, 2021 American Community Survey
Alexandria Community Demographics
City of Alexandria and Neighboring Jurisdictions
The following tables show City of Alexandria’s diversity compared to neighboring jurisdictions on the basis of a language other than English spoken at home, school-aged population, and per capita income. These factors are indicators to ACPS’ challenges and current status.
Nearly one-third of residents over the age of five years speak a language other than English at home. This is a decrease of 2.5 percentage points compared to the prior year.
As measured on a per capita income basis, Alexandria City is one of the wealthiest regions in Northern Virginia. Per capita income was $68,020 in 2021 (see table below), second to Arlington County.
Source: U.S. Census Bureau, 2021
A total of 13.2 percent of the Alexandria’s population are children of school age (between ages 5 and 19) whom attend either public, private or are not in school. 78.5 percent of the total school age population in Alexandria attend public school. These percentages are the smallest of the Northern Virginia jurisdictions, as shown in the chart below.
Source: U.S. Census Bureau, 2021
Page 120 Enrollment & Staffing ACPS FY 2024 Proposed Budget
Locality2018201920202021 Alexandria32.7%91,43831.9%29.4% Arlington29.6%29.5%28.9%28.4% Fairfax39.2%39.7%39.0%38.0% Loudoun30.8%33.5%32.3%31.7% Prince William34.7%35.6%34.3%36.2%
Locality % of School Age Enrolled in Public School % of Population That is School Age Alexandria 78.5%13.2% Arlington 80.4%14.4% Fairfax 81.7%20.3% Loudoun 84.4%24.1% Prince William83.7%23.4%
Language other than English Spoken at Home
Population
Municipalities Locality2018201920202021 Annual Change Alexandria61,15868,43964,83568,0203,185 $ Arlington71,06174,53773,07880,9967,918 $ Fairfax55,76757,49258,33862,6424,304 $ Loudoun56,99858,52257,51359,9332,420 $ Prince William40,57541,98842,29844,3272,029 $ Source: U.S. Census Bureau, 2021
School-age
Ages 5-19 Selected Northern Virginia
Per Capita Income US Census Estimates
Alexandria Community Demographics
ACPS and Other Northern Virginia School Divisions
The Washington Area Boards of Education (WABE) Guide is an annual publication that provides data collected from school divisions in a standardized format. Data are collected through a survey form provided to school districts and reviewed by the WABE committee.
The ACPS school division will serve 15,847 students in grades Pre-kindergarten to 12 for FY 2024. According to the Virginia Department of Education, as of fall 2020, ACPS was the 16th largest school division of Virginia’s 132 divisions.
Class Size
Historically, ACPS has maintained smaller class sizes than neighboring school divisions.
The data in the first chart lists students per teacher
scale positions including classroom and other teachers such as library media specialists, coaches, music, art, English learner (EL), and etc. The second chart lists only classroom teachers including EL and special education teachers.
Alexandria City’s ratio is the lowest in elementary for teacher scale positions as well as students per classroom teacher. These numbers are the result of the low class size caps that the School Board adopts annually. In addition, the EL and special education programs are staffed above state ratios, decreasing the ratio of students per teacher.
ACPS elementary schools are generally staffed at a ratio of 24 students per teacher with the addition of elective teachers. Middle schools and Alexandria City High School are staffed in relation to program needs and tend to have smaller class sizes than neighboring school divisions.
*Intermediate or Middle calculation reflects five daily periods per Core teacher.
*ACPS district's special placement, Pre-K, and kindergarten student enrollments are not included.
*Elementary classroom teacher count includes "flex" positions which are categorized as student improvement FTEs.
WABE calculation excludes certain positions that ACPS includes in calculation of students per teacher.
Page 121 Enrollment & Staffing ACPS FY 2024 Proposed Budget
DivisionElementary Intermediate or Middle Secondary or High Alexandria City* 9.2 15.4 18.3 Arlington County 9.7 14.8 16.4 Fairfax County 14.1 20.2 21.1 Loudoun County 12.8 17.8 19.9 Prince William County 12.5 18.0 19.9 DivisionElementary Intermediate or Middle Secondary or High Alexandria City 15.3 22.8 25.6 Arlington County 21.7 19.1 19.6 Fairfax County 21.3 24.7 25.6 Loudoun County 21.6 21.7 24.1 Prince William County 20.5 29.7 32.9 Students per Teacher Scale Position WABE Guide Data FY 2023 Students per Classroom Teacher WABE Guide Data FY 2023
Alexandria Community Demographics


Ethnic Enrollment


The ethnic composition of the ACPS student population varies from that of the City of Alexandria. The table on the right compares population by ethnicity with the City of Alexandria and the United States. The majority of the city’s population, per the U.S. Census Bureau, identifies as white (52.8 percent), followed by black (21.0 percent), Hispanic (16.5 percent) and other (26.2 percent). This is in contrast to the national population of white (61.2 percent), black (12.1 percent), Hispanic (18.8 percent) and other (26.8 percent).
Based on VDOE fall enrollment data, ACPS is one of the most ethnically diverse school divisions in Virginia. The chart below shows ACPS ethnic enrollment compared to that of seven northern Virginia school divisions - Arlington, Fairfax, Loudoun and Prince William counties, as well as Falls Church City, Manassas City and Manassas Park City.
DISTRIBUTION OF ENROLLMENT BY ETHNICITY NORTHERN VIRGINIA SCHOOL DIVISIONS, FALL 2022-2023
Page 122 Enrollment & Staffing ACPS FY 2024 Proposed Budget
U.S. Census Bureau, 2021
U.S. Census Bureau, 2021 0.0%10.0%20.0%30.0%40.0%50.0%60.0%70.0% United States Alexandria City United StatesAlexandria City Some other race 7.20%6.20% Two or more races 12.60%14.40% White 61.20%52.80% Hispanic 18.80%16.50% Black 12.10%21.00% Asian, American Indian, Hawaiian 7.0%5.6%
States and City Population by Ethnicity Source: Virginia Department of Education, 2022-2023 Fall Membership 6.9% 25.3% 37.6% 26.5% 3.6% 9.0% 10.6% 29.7% 42.6% 8.0% 19.4% 9.8% 28.1% 36.6% 6.2% 7.3% 3.2% 12.3% 64.4% 12.8% 26.3% 7.3% 19.0% 41.6% 5.9% 6.2% 7.2% 69.6% 10.8% 6.2% 11.0% 19.4% 36.6% 26.9% 6.1% 3.7% 9.2% 69.3% 12.5% 5.4% 0% 10% 20% 30% 40% 50% 60% 70% 80% 90% 100% Asian, American Indian, Hawaiian Black Hispanic WhiteTwo or more races
Poverty Source:
Source:
United
Alexandria City Arlington County Fairfax County Falls Church City Loudoun County Manassas City Manassas Park City Prince William County
Alexandria Community Demographics
The economic status of the majority of families with children enrolled in ACPS is quite different from that of the average family in the City of Alexandria. Although the City’s population has a high per capita income, with only 9.7 percent living under the poverty line in 2021, over half of ACPS students were eligible for free and reduced-price meals as shown in the table below. This is the highest percentage of the surrounding Northern Virginia school divisions.
Please note that some free and reduced meal rate information is not available from other school divisions because the reporting requirement related to this information was waived by the Virginia Department of Education for FY 21-22. This was done to help facilitate
the provision of meals for children and to allow LEAs to reallocate resources to meal service and relevant COVID-19 response activities.
The federal government establishes the income guidelines for free and reduced-price meals annually. These income guidelines vary depending on the size of household. The chart below expresses the maximum values for the guidelines on a per capita basis (dividing the household income by the number of members in the household). The per capita income ranges from $16,937 for a family of two to a low of $10,783 for a family of 8.
While the U.S. Census reports per capita income of $68,020 for the City of Alexandria in
Per Capita Income by Size of Household
Page 123 Enrollment & Staffing ACPS FY 2024 Proposed Budget
Household size 2345678 Max per capita income for reduced price meals 16,937 $ 14,202 $ 12,835 $ 12,014 $ 11,467 $ 11,076 $ 10,783 $
U.S. Department of Agriculture Food and Nutrition Services Child Nutrition Programs-Income Eligibility Guidelines July 1, 2022 to June 30, 2023 DivisionFY 2018FY 2019FY 2020 FY 2021FY 2022FY 2023Change Alexandria City* 58.6%58.8%56.4%54.0%59.0%54.0%-2.4% Arlington County 31.2%29.1%28.6%n/an/a30.1%-0.5% Fairfax County 29.0%29.6%30.7%n/a31.0%n/a1.1% Loudoun County 17.4%17.7%18.0%n/an/an/a0.3% Prince William County 41.7%42.1%42.4%n/an/an/a0.3%
Source:
*WABE calculation is based on total student enrollment. Data FY 2023
School Free and Reduced-Price Eligible
WABE Guide
Alexandria Community Demographics
2021, FY 2021 data from the free and reducedprice meal program suggests that 54.0 percent of ACPS students are from households with significantly less per capita income.
Special Education
The FY 2023 WABE Guide reports that ACPS’s approved special education enrollment is 13.1 percent of the total student population for FY 2023. The table below shows an average enrollment percentage for students who receive special education services compared with surrounding Northern Virginia school divisions.
Cost per Pupil
Many of the preceding characteristics-class size, poverty, special education, and EL enrollment--are associated with higher educational risk, needs, and costs. Studies sponsored by the National Center for Education Statistics have found that the higher the enrollment of students with special needs, the higher the average per student educational cost.
These factors, coupled with ACPS’ competitive teacher salaries, contribute to making the ACPS cost per student the second highest of the five Northern Virginia divisions, as shown in the table below. These costs are calculated per the methodology of the WABE guide to allow for comparisons across jurisdictions.
For the time period FY 2022 to FY 2023, the cost per pupil in ACPS has increased by 8.9 percent, while the cost per pupil in Prince William school division has increased by 12.1 percent.
English Learner (EL)
Alexandria City Schools has the highest percentage of students receiving EL services of the Northern Virginia school divisions at 36.1 percent, followed by Arlington and Fairfax Counties.
Enrollment of EL students (receiving services at proficiency Levels 1 through 5) is shown in the table below.
Page 124 Enrollment & Staffing ACPS FY 2024 Proposed Budget
Division Percent of Total Enrollment Alexandria City13.1% Arlington County18.1% Fairfax County15.1% Loudoun County12.6% Prince William County12.8% Enrollment of Students with Disabilities WABE Guide Data FY 2023 Division Percent of Total Enrollment Alexandria City* 36.1% Arlington County 20.3% Fairfax County 19.0% Loudoun County 13.8% Prince William County 19.5% Enrollment of EL Students WABE Guide Data FY 2023
DivisionFY 2021FY 2022FY 2023 Change, $ FY 2022 to FY 2023 Change, % FY 2022 to FY 2023 Alexandria City $ 18,147 $ 18,921 $ 20,777 $ 1,856 8.9% Arlington County $ 19,581 $ 20,000 $ 23,521 $ 3,521 15.0% Fairfax County $ 16,505 $ 16,674 $ 18,772 $ 2,098 11.2% Loudoun County $ 15,214 $ 17,120 $ 18,719 $ 1,599 8.5% Prince William County $ 12,641 $ 13,536 $ 15,406 $ 1,870 12.1% Cost Per Pupil WABE Guide Data FY 2023
* ACPS includes participants in the adult education and adult alternative education programs.
Drop Out Rate
For the time period FY 2021 to FY 2022, the drop out rate for ACPS has increased by 3.5 percent, while the drop out rate for Prince William County school division has increased by 0.9 percent.
VDOE: Graduation data for Virginia school divisions is from the Department of Educations website.
Page 125 Enrollment & Staffing
ACPS FY 2024 Proposed Budget
DivisionFY 2018FY 2019 FY 2020FY 2021FY 2022 Change, % FY 2021 to FY 2022 Alexandria City 10.4%7.7%14.1%5.3%8.8%3.5% Arlington County 5.0%5.6%4.9%3.7%4.5%0.8% Fairfax County 7.1%7.3%6.2%4.7%4.8%0.1% Loudoun County 3.3%3.3%2.4%1.4%1.8%0.4% Prince William County 5.6%5.9%5.3%5.1%6.0%0.9% Drop Out Rate VDOE Data 4 Year Drop Out Rate
Real Estate Property Tax Information
Alexandria City Real Estate Property Tax Information
Real estate property tax rates in the City of Alexandria are set by the Alexandria City Council.
All real estate parcels in the City of Alexandria are assessed annually at 100 percent of estimated fair market value as of Jan. 1. Real estate assessed values are based on trends in the region and in the city, but primarily from large numbers of sales that are analyzed to determine values for groups of properties. Real estate taxes are based on these assessed values and the real estate tax rate.
Alexandria has the third lowest tax rate in Northern Virginia for CY 2022 (FY 2023), as shown in the real estate tax rate line graph. The graph show a comparison of tax rates among the City of Alexandria and neighboring jurisdictions, including Arlington County,
Fairfax County, Loudoun County, and Prince William County over the past ten calendar years. Rates listed are per $100 of assessed value.
The FY 2023 budget reflects a real property tax rate of $1.110 per $100 of assessed value, unchanged compared to the prior fiscal year rate. Changes to the real estate tax rate can impact budget through revenue collection and average residential tax bill.
Statement of Real Property Tax Revenues
Source: City of Alexandria - FY 2023 Approved Budget
Real Estate Tax Rates Cents Per $100 of Assessed Value
Arlington County's rate includes a transportation add-on tax on commercial property of 12.5 cents.
The Fairfax County rate includes add-on tax rates of 0.1 cents for pest infestation and 12.5 cents on commercial properties for transportation.
Prince William includes a county-wide fire and rescue levy of 7.5 cents and 0.25 cents for mosquito and forest pest management.
Source: City of Alexandria - FY 2023 Approved Budget
Page 126 Enrollment & Staffing ACPS FY 2024 Proposed Budget
$1.110 $1.138 $1.236 $0.890 1.1075 $0.80 $0.90 $1.00 $1.10 $1.20 $1.30 $1.40 20132014201520162017 20182019202020212022
CY 2013-2022 Alexandria City Arlington (Commercial) Fairfax (Commercial) Loudoun Prince William Fiscal Year Tax Rate (per $100) Net Tax Revenue % Change in Revenue from Prior Year 2023 Approved1.110514,554,739 6.5% 2022 Approved1.110483,311,548 1.0% 2021 Actual1.130478,601,885 4.1% 2020 Actual1.130459,756,284 1.8% 2019 Actual1.130451,685,949 3.0%
Real Estate Property Tax Information
The FY 2023 rate includes the following set-asides:
• $0.022 reserved for transportation improvements
• $0.010 for affordable housing
The statement of real property tax revenues table displays five years of data; FY 2019-FY 2022 actual, and FY 2022 and FY 2023 approved. Real property tax includes residential, commercial multi-family, office/retail and other commercial, and public service corporation. The net tax revenue will increase to $514.55 million, an increase of 6.5 percent or $31.24 million compared to the prior fiscal year.
The chart and table to the right shows the average residential tax bill and assessment since CY 2017. The average tax per household will increase by 21.9 percent or $1,310 in CY 2022 compared to the prior calendar year.
Alternative tax collected by the City includes sales, utility, business license, transient lodging, and restaurant meal taxes, as shown in the other major tax revenue table below.
Other
Source:
Page 127 Enrollment & Staffing
ACPS FY 2024 Proposed Budget
Tax FY 2018 Actual FY 2019 Actual FY 2020 Actual FY 2021 Actual FY 2022 Approved FY 2023 Approved Sales27,257,656 $ 28,787,034 $ 29,940,417 $ 32,258,892 $ 31,720,000 $ 37,440,000 $ Utility12,069,408 11,264,818 12,077,396 11,534,144 11,760,000 11,760,000 Business License33,846,543 36,883,865 35,154,223 37,042,157 34,135,900 39,824,300 Transient Lodging12,883,323 12,879,159 8,663,346 4,762,880 6,500,000 9,500,000 Restaurant Meals18,283,682 23,999,949 19,765,936 21,934,868 19,980,000 27,600,000 Source: City of Alexandria - FY 2023 Approved Budget
Major Tax Revenue
City of Alexandria Approved Budget $6,188 $6,272 $6,584 $6,836 $7,281 $$1,000 $2,000 $3,000 $4,000 $5,000 $6,000 $7,000 $8,000 20182019202020212022
Residential Tax Bill CY 2018-2022 (FY 2019-2023) Tax Year Average Assessed Value of Residential Property Average Tax Rate Per $100 Average Tax Per Household 2022655,901 1.110 7,281 2021615,858 1.110 6,836 2020582,636 1.130 6,584 2019555,002 1.130 6,272 2018547,626 1.130 6,188 2017528,421 1.130 5,971 Source: City of Alexandria Approved Budget
Residential Assessment and Tax Bill
Average
Average
Enrollment Overview
Overview
Alexandria City Public Schools’ enrollment has fluctuated over the last four years, but now appears to be on a path of annual growth, and may maintain this pattern through FY 2028 once those numbers are available. The projected growth for FY 2024 is 61 students, or 0.4 percent compared to the actual enrollment in FY 2023.
This section details three data series: 1) total division enrollment by grade, school level, and school; 2) special education enrollment; and, 3) English Learner (EL) enrollment. Staffing projections associated with each series, as well as explanations of the formulas used to calculate staffing are provided.
Enrollment projections are prepared annually as a collaborative effort by ACPS’ Facilities and Maintenance Department and the City’s Planning and Zoning Department. In general, the enrollment projections are based on trends experienced throughout the school division by school and by grade. ACPS and the City use
an average “Cohort Survival Rate” from the previous 3 or 4 years at each school and grade to determine the numbers of students who would be retained or added in each school and at each grade.
Grades 6 and 9 are considered “transition grades”, and the enrollment projection model uses the sum of the feeder schools for either the middle schools or Minnie Howard and applies the cohort survival rate to that entire sum. Sixth graders projected to enter one of the K-8 schools are removed from the middle schools’ projections.
Kindergarten is projected by applying a “K Capture Rate” or percentage of K enrollment compared to births to mothers who are Alexandria City residents from five years ago (applying the cutoff date of October 1st). Birth data are obtained from the Virginia Department of Health.
All projections are adjusted to anticipate space challenges and budget constraints to optimize space and staffing throughout the division.
Page 128 Enrollment & Staffing ACPS FY 2024 Proposed Budget
Grade FY 2018 Actual FY 2019 Actual FY 2020 Actual FY 2021 Actual FY 2022 Actual FY 2023 Actual FY 2024 Projected FY 2025 Projected FY 2026 Projected FY 2027 Projected FY 2028 Projected FY 2029 Projected PK 331 329 311 273 287 306 355 Not AvailableNot AvailableNot AvailableNot AvailableNot Available K 1,474 1,516 1,448 1,266 1,337 1,330 1,343 Not AvailableNot AvailableNot AvailableNot AvailableNot Available 1 1,416 1,433 1,488 1,383 1,282 1,415 1,350 Not AvailableNot AvailableNot AvailableNot AvailableNot Available 2 1,410 1,394 1,368 1,358 1,266 1,249 1,355 Not AvailableNot AvailableNot AvailableNot AvailableNot Available 3 1,308 1,324 1,335 1,267 1,287 1,268 1,220 Not AvailableNot AvailableNot AvailableNot AvailableNot Available 4 1,270 1,254 1,320 1,258 1,196 1,274 1,253 Not AvailableNot AvailableNot AvailableNot AvailableNot Available 5 1,292 1,248 1,225 1,221 1,177 1,156 1,231 Not AvailableNot AvailableNot AvailableNot AvailableNot Available 6 1,125 1,208 1,156 1,127 1,103 1,096 1,076 Not AvailableNot AvailableNot AvailableNot AvailableNot Available 7 1,001 1,095 1,215 1,120 1,076 1,057 1,061 Not AvailableNot AvailableNot AvailableNot AvailableNot Available 8 917 977 1,078 1,164 1,085 1,075 1,028 Not AvailableNot AvailableNot AvailableNot AvailableNot Available 9 1,217 1,156 1,269 1,136 1,342 1,226 1,256 Not AvailableNot AvailableNot AvailableNot AvailableNot Available 10 991 1,029 973 1,127 937 1,285 1,091 Not AvailableNot AvailableNot AvailableNot AvailableNot Available 11 886 883 919 906 1,030 883 1,194 Not AvailableNot AvailableNot AvailableNot AvailableNot Available 12 855 891 957 982 1,069 1,112 980 Not AvailableNot AvailableNot AvailableNot AvailableNot Available Special Placements 47 58 55 47 52 54 54 Not AvailableNot AvailableNot AvailableNot AvailableNot Available Total 15,540 15,795 16,117 15,635 15,526 15,786 15,847 - - - -Number Change 435255322(482)(109)26061- - -Percent Change 2.9%1.6%2.0%-3.0%-0.7%1.7%0.4%- - - -Annual Change in Enrollment Historical and Projected Enrollment by Grade All students, including ages 4 & under and over the age of 20 All data based on ACPS September reports
Enrollment Overview
Total ACPS Enrollment
ACPS’ enrollment data series counts all students, including students under the age of 5 and over the age of 20, as well as all special placements. The division incurs costs for all enrolled students even if they are not included in the state’s definition of average daily membership. As shown on the previous table, over the five-year period from FY 2018 to FY 2023, enrollment increased by 246 students. With a projected increase in FY 2024 of another 61 students, ACPS will see a total rise in enrollment of 307 students over this six-year period, a cumulative growth of 2.0 percent.
From FY 2020 through FY 2023: elementary school enrollment decreased from 8,497 to 7,998 students; middle school decreased from 3,449 to 3,228 students; and, high school increased from 4,118 to 4,506 students.
For FY 2024, elementary school enrollment is projected at 8,107 and secondary school at 7,686. Special placements are projected to remain at 54 students. With the projected changes in enrollment for FY 2024, elementary school enrollment represents 51.4 percent of total enrollment, with middle and high schools at 20.0 percent and 28.6 percent, respectively.
Enrollment data by school are provided on the following page. Actual enrollment data are shown for FY 2019 through FY 2023 and projected enrollments are shown for FY 2024.
Historical enrollment for each ACPS school and demographic information on the ACPS student population is contained in the following pages.
*Includes Jefferson-Houston and Patrick Henry enrollments forgrades six, seven,and eight.
Page 129 Enrollment & Staffing ACPS FY 2024 Proposed Budget
8,497 8,026 7,832 7,998 8,107 3,449 3,411 3,264 3,228 3,165 4,118 4,151 4,378 4,506 4,521 55 47 52 54 54 0 2,000 4,000 6,000 8,000 10,000 12,000 14,000 16,000 FY 2020 ActualFY 2021 ActualFY 2022 ActualFY 2023 ActualFY 2024 Projected
Elementary (PreK-5) Middle (6-8)* High (9-12) Special Placements
ACPS Enrollment History by Grade Level Data based on September 30 Fall Membership
Page 130 Enrollment & Staffing ACPS FY 2024 Proposed Budget
FY 2019FY 2020FY 2021FY 2022FY 2023FY 2024 Elementary Charles Barrett 543 581 520 523 527 526 (1)-0.2% Cora Kelly 365 339 298 262 265 265 - 0.0% Douglas MacArthur 696 654 568 549 552 603 51 9.2% Early Childhood Center 174 200 169 178 174 222 48 27.6% Ferdinand T. Day 417 508 596 558 583 588 5 0.9% George Mason 482 442 386 328 306 304 (2)-0.7% James K. Polk 786 752 712 736 779 787 8 1.0% Jefferson-Houston 425 425 441 438 425 430 5 1.2% John Adams 725 669 658 688 717 716 (1)-0.1% Lyles-Crouch 464 484 441 391 409 418 9 2.2% Mount Vernon 866 886 865 859 855 857 2 0.2% Naomi L. Brooks 381 392 351 338 329 327 (2)-0.6% Patrick Henry 680 691 694 667 696 702 6 0.9% Samuel Tucker 819 776 738 719 731 705 (26)-3.6% William Ramsay 675 698 589 598 591 657 66 11.2% Elementary Subtotal8,498 8,497 8,026 7,832 7,939 8,107 168 2.1% Secondary Francis C. Hammond 1,470 1,458 1,420 1,413 1,466 1,480 14 1.0% George Washington 1,505 1,579 1,567 1,440 1,367 1,271 (96)-7.0% Jefferson-Houston¹ 208 234 207 199 198 194 (4)-2.0% Patrick Henry¹ 97 178 217 212 256 220 (36)-14.1% ACHS -Minnie Howard 849 908 972 1,036 1,226 1,010 (216)-17.6% Alexandria City High School - King Street 3,110 3,210 3,179 3,342 3,280 3,511 231 7.0% Secondary Subtotal7,239 7,567 7,562 7,642 7,793 7,686 (107) -1.4% Special Placements 58 55 47 52 54 54 - 0.0% Grand Total15,79516,11915,63515,52615,78615,847610.4% Change SY 2023 to 2024 Projected % Change SY 2023 to 2024 Projected
Enrollment Overview
SY 20192020 Actual SY 20182019 Actual SY 20232024 Projected
as of Sept. 30 Includes District-Wide Special Education (DW SE): Under 5/Over 20 and Special Placements SY 20222023 Actual SY 20202021 Actual SY 20212022 Actual
¹Jefferson-Houston and Patrick Henry include grades six, seven, and eight students in the secondary enrollment total.
Enrollment by School
Enrollment & Staffing: Demographics
* Special education enrollment includes grades K-12.
** English learner enrollment does not include monitor years one and two.
ACPS Student Demographics
Special education, English learner (EL), and free and reduced-price meal (FARM) eligible enrollment totals are shown above.
For FY 2024, special education enrollment is projected to increase to 1,976 students. This brings the percentage of special education students to 13.4 percent of total enrollment.
The EL program enrollment is expected to increase for FY 2024, with a projected enrollment of 5,784 receiving services, or 36.5 percent of the total ACPS enrollment.
The FARM program serves students whose family income meets federal eligibility requirements. As of October 2022, 8,589 students were eligible for free or reduced-price meals. Using a two-year trend analysis, ACPS
projects FARM eligibility will increase to 8,654 or, 54.3 percent of total enrollment for FY 2024.
Studies show that well-nourished students are better prepared to learn. To this end, schools help maintain a healthy environment by providing nutritious meals, healthy snacks, and opportunities for physical and nutritional education. Through school nutrition programs, 1.42 million lunches, 48.9 million breakfasts and 1.29 million after-school snacks are served on a typical day in Virginia public schools. In FY 2022, ACPS served a total of approximately 1.4 million lunches, 858,300 breakfasts, 102,200 after-school snacks and 43,000 suppers.
The FARM is part of the National School Lunch Program (NSLP), a federally-assisted meal program that operates in more than 100,000 public and non-profit private schools and residential child care institutions. The NSLP
Page 131 Enrollment & Staffing ACPS
FY 2024 Proposed Budget
1,915 1,886 1,956 1,976 1,976 4,806 5,062 4,853 5,713 5,784 9,500 8,385 9,099 8,589 8,654 0 2,750 5,500 8,250 11,000 FY 2020 FY 2021 FY 2022 FY 2023 FY 2024
Special Education* English Learners (EL)** Free & Reduced-Price Meal
Special Education, English Learner, and Free & Reduced-Price Meal Eligible Student Totals
Enrollment & Staffing: Demographics
Free and Reduced-Price Meal Eligibility as a Percentage of School Membership
William Ramsay
Patrick Henry
Samuel W. Tucker
Francis C. Hammond
Ferdinand T. Day
ACHS - Minnie Howard
John Adams
Cora Kelly
James K. Polk
Alexandria City High School
Jefferson-Houston
George Washington
Mount Vernon
Charles Barrett
Douglas MacArthur
Early Childhood Center
George Mason
Naomi L. Brooks
Lyles-Crouch
October 31, 2022
Free Meal Reduced-Price Meal
provides nutritionally-balanced low-cost or free meals to more than 31.0 million children each school day.
Children from families with incomes at or below 130 percent of the federal poverty level are eligible for free meals. Those with incomes between 130 and 185 percent of the poverty level are eligible for reduced-price meals, for which students can be charged no more than $0.40 per meal. ACPS absorbs the entire meal cost for all eligible students. For the period July 2022 through June 2023, the annual federal poverty level for a household of 4 is $27,750; 130 percent of that level is $36,075 and 185
percent of that level is $51,338.
ACPS’s free and reduced-price meal program eligibility ranges from 20.6 percent of school membership at Lyles-Crouch Elementary to 67.7 percent of school membership at William Ramsay Elementary, shown above.
The chart on the righthand side of the following page shows the division-wide average eligibility for free and reduced-price meals over the past 10 years. The percentage of qualifying students has now stabilized and has ranged between 53.8 and 59.0 percent within the most recent five years.
Page 132 Enrollment & Staffing ACPS FY 2024 Proposed Budget
0.0%10.0%20.0%30.0%40.0%50.0%60.0%70.0%80.0%90.0%100.0%
Division Averageis 54.2% of membership forFY2023
Enrollment & Staffing: Demographics
The number of students served by this program has fluctuated in the most recent three years, with 7,884 students eligible for free meals and 705 students eligible for reduced-price meals for FY 2023.
FY 2023
FY 2022
FY 2021
FY 2020
FY 2019
FY 2018
FY 2017
FY 2016
FY 2015
FY


Page 133 Enrollment & Staffing ACPS FY 2024 Proposed Budget
0.0%20.0%40.0%60.0%
2014
Free Meal Reduced-Price Meal
Division-wide Average Free and Reduced-Price Meal Eligibility as a Percentage of School Membership
Enrollment & Staffing: Special Education
Special Education Enrollment
Special education students are reported, per federal and state requirements, by primary disability category and level of service:
• Disability category: The student’s disability category is determined during the special education eligibility process. State regulations now mandate that all students receiving special education services are identified with a specific disability by age 7.
• Level of service: Student service levels have been modified to more appropriately tier service times and are categorized by the percent of instructional support:
Level I: 0-30%; 1.0 Points
Level II: 31-49%; 1.5 Points
Level III: 50-70%; 2.0 Points
Level III: 50% or more; 2.5 Points (Autism, Intellectual, Emotional and Multiple Disabilities)
Level IV: 71% or more; 2.5 Points
Students in special placements are included in the total special education enrollment figures, but do not receive services in ACPS facilities. Special education enrollment will total 2,139 students in FY 2024 compared to 2,122 in FY 2023.
Special Education Staffing
The allocation of special education staffing is determined by disability category and level of service.
The provision of special education services, including special education staffing, is governed by state and federal regulations.
Federal and state regulations also mandate the availability of a continuum of services from least restrictive to most restrictive environments. At the least restrictive level, special education services are provided in the general education classroom. At the most restrictive level, students are served in separate special
placements for students with disabilities.
The staffing ratios, which vary from the state requirements, are shown in the table below. There are special ratios for specific city-wide classes requiring a more restrictive placement, including early childhood special education, autism, intellectual, emotional and multiple disability. The instructional assistant staffing ratio in intellectual emotional and multiple disability city-wide classes remains at to 2.00 FTE per classroom to allow for more support in these classes.
In an effort to further support inclusion and coteaching across content areas, the formula was revised beginning in FY 2017 by adjusting the service intensity point values which determine staff ratios and further differentiating levels of service values. This results in additional teachers and instructional assistants at both elementary and secondary schools. All elementary schools continue to have a base staffing ratio of three teachers and two instructional assistants. The revised formula will continue for FY 2024 and is projected to generate no additional FTEs for special education teacher and no additional FTEs instructional assistants for kindergarten through grade 12.
All instructional assistant II and certified nursing
Page 134 Enrollment & Staffing ACPS FY 2024 Proposed Budget
Disability/Program Student with Disabilities Teacher Instructional Assistant Elementary Autism classroom (including preschool Autism classes) 6 students1 teacher2 Instructional Assist. Multiple Disability classroom8 students1 teacher2 Instructional Assist. Intellectual and Emotional Disabilities classroomElementary 8 students1 teacher2 Instructional Assist. Intellectual Disabilities and Autism Emotional Disabilities classroom- Secondary 7 students1 teacher2 Instructional Assist. Emotional Disabilities classroom- Secondary 8 students1 teacher1 Instructional Asst. Early Childhood Special Education classroom 8 students 8 students 1 teacher AM class 1 teacher PM class 1 Instructional Asst. shared across AM/PM classes
ACPS Staffing Ratios in City-wide Learning Environments
Page 135 Enrollment & Staffing ACPS FY 2024 Proposed Budget
TchrsInst. Asst Cert Nurs Asst Non- Ratio IEP TotalTchrsInst. Asst Cert Nurs Asst Non- Ratio IEP TotalTchrsInst. Asst Cert Nurs Asst Non- Ratio IEP TotalTchrsInst. Asst Cert Nurs Asst Non- Ratio IEP Total Charles Barrett 85 85 79 77 109 109 10.00 5.0015.00 4.00 5.009.00 4.00 5.009.00--Cora Kelly 47 51 55 49 58 58 8.00 14.0022.00 7.00 14.0021.00 7.00 14.0021.00--Douglas MacArthur 97 60 47 56 61 67 4.00 6.0010.00 6.00 6.0012.00 6.00 6.0012.00--George Mason 54 33 34 37 35 35 3.00 2.005.00 3.00 2.005.00 3.00 2.005.00--James K. Polk 79 73 66 70 76 77 7.00 8.0015.00 7.00 8.0015.00 7.00 8.0015.00--Jefferson Houston 102 92 73 97 57 58 11.00 8.0019.00 9.00 8.0017.00 9.00 8.0017.00--John Adams 88 70 72 75 71 71 9.00 10.0019.00 8.00 10.0018.00 8.00 10.0018.00--Lyles-Crouch 53 36 38 41 44 45 4.00 2.006.00 3.00 2.005.00 3.00 2.005.00--Naomi L. Brooks 51 50 36 46 43 43 3.00 2.005.00 3.00 2.005.00 3.00 2.005.00--Mount Vernon 66 67 62 65 66 67 7.00 6.0013.00 7.00 6.0013.00 7.00 6.0013.00--Patrick Henry 90 74 49 101 93 90 7.00 4.0011.00 8.00 4.0012.00 8.00 4.0012.00--Samuel Tucker 85 61 54 66 70 68 6.00 3.009.00 6.00 3.009.00 6.00 3.009.00--William Ramsay 72 58 51 74 71 79 6.00 8.0014.00 7.00 8.0015.00 7.00 8.0015.00--Ferdinand T. Day 27 30 33 56 58 59 3.00 3.006.00 3.00 3.006.00 3.00 3.006.00--Early Childhood Center54 48 18 38 49 6.00 5.0011.00 1.00 5.006.00 1.00 5.006.00--Elementary Subtotal 996 894 797 928 950 975 94.00 86.00180.00 82.00 86.00168.00 82.00 86.00168.00--Francis C. Hammond 145 127 122 149 171 173 11.00 7.00 18.00 11.00 7.0018.00 11.00 7.0018.00--George Washington 179 186 185 176 180 168 14.00 8.00 22.00 14.00 8.0022.00 14.00 8.0022.00--Jefferson Houston37 37 37 37---------Patrick Henry20 21 21 21---------Alexandria City H.S.Minnie Howard Campus 89 92 88 127 133 110 8.00 2.0010.00 8.00 2.0010.00 8.00 2.0010.00--SchoolKing Street Campus 1 334 309 341 311 327 351 30.00 18.0048.00 30.00 18.0048.00 30.00 18.0048.00--Secondary Subtotal 747 714 793 821 869 860 63.00 35.0098.00 63.00 35.0098.00 63.00 35.0098.00--Teacher Reserve--3.00 3.006.00 3.00 3.00 6.00 3.00 3.00 6.00--Non Ratio Para----30.00 30.00-30.00 30.00-30.00 30.00--Certified Nursing---9.009.009.009.009.009.00--Chance for Change 4 3 3 9 9 9 1.00-1.00 1.00-1.00 1.00-1.00--Satellite Campus 11------------Special Placements: 51 55 54 52 54 54---------Tuition Paid Another 1------------Speech Language 249 249 249 213 240 241 28.002 8.00 28.00-28.00 28.00-28.00----Grand Total 2,059 1,915 1,896 2,023 2,122 2,139 189.00 124.00 9.00 30.00 352.00 177.00 124.00 9.00 30.00 340.00 177.00 124.00 9.00 30.00 340.00--Special education enrollment includes grades K-12 FY 2024 Proposed Budget FY 2023 Final FY 2023 Final Budget FY 2022 Dec FY 2022 Final Budget FY 2024 Proposed Change in FTE, FY 2023 Final Budget to FY 2024 Proposed Budget Special Education Staffing FY 2019 Dec FY 2020 Dec FY 2021 Dec
Enrollment & Staffing: Special Education
Enrollment & Staffing: Special Education and English Learner
assistant positions are placed in a centralized pool allowing more flexibility as students move from school to school.
In the FY 2024 budget, there are 3.00 FTE special education reserve teachers and 3.00 FTE reserved instructional assistants budgeted.
The program continues to improve instructional delivery to special education students and implement inclusionary models.
English Learner Enrollment
ACPS is projected to experience a 361 student increase in the enrollment of English Learner (EL) students for FY 2023 or 6.8 percent.
The table below will show final FY 2023 EL enrollment, with enrollment broken down into English Language Proficiency (ELP)
levels. Monitored students are included for informational purposes; these students have exited the EL program and are not counted in ACPS staffing methodologies.
EL students, excluding students in monitoring services, comprised 36.1 percent of total ACPS enrollment in FY 2023.
Levels of proficiency information for FY 2024 was not available for the proposed FY 2024 budget book, but will be updated and provided in the final FY 24 budget book.
The methodology of reporting on EL students may differ among various sources. The state reports on EL students (students at WIDA Access for ELLs English proficiency levels 1-5 and WIDA Alternate ACCESS for ELLs levels). Separately, the state also reports on former EL students who are in monitoring status. As of FY 2017, Every Student Succeeds Act (ESSA)
Page 136 Enrollment & Staffing ACPS FY 2024 Proposed Budget
ELP Level FY 2020 Actual FY 2021 Actual FY 2022 Final FY 2023 Projected* Change FY 2022 to FY 2023 % Change FY 2022 to FY 2023 Kindergarten605 580 580 626 46 7.9% ELP Level 1727 688 992 1,257 265 26.7% ELP Level 2571 545 597 640 43 7.2% ELP Level 31,046 1,012 951 750 (201) -21.1% ELP Level 4289 311 265 192 (73) -27.5% ELP Level 54 - - 1 1 0.0% Elementary ELP Subtotal3,242 3,136 3,385 3,466 81 2.5% Monitor Year 1303 278 325 335 10 3.2% Monitor Year 2153 156 208 160 (48) -23.2% Elementary Monitor Year Subtotal456 434 533 495 (38) -7.0% ELP Level 1550 403 410 516 106 25.9% ELP Level 2367 401 406 416 10 2.5% ELP Level 3676 747 787 935 148 18.8% ELP Level 4227 216 295 309 14 4.7% ELP Level 53 2 2 4 2 100.0% Secondary ELP Subtotal1,823 1,769 1,900 2,180 280 17.3% Monitor Year 1187 177 191 214 23 11.9% Monitor Year 2243 279 276 277 1 0.3% Secondary Monitor Year Subtotal430 456 467 490 24 6.1% Total Students Receiving Services5,065 4,905 5,285 5,646 361 6.8% Total Monitor Year Students886 890 999 985 (14) -1.4% Total Enrollment16,006 16,473 16,144 15,644 (500) -3.1% Students Receiving Services as a Percent of Total Enrollment 31.6%29.8%32.7%36.1%3.4%10.2% English Learner Students at ACPS By Level of Proficiency, including Monitor Year 1 and 2 Students *Secondary ELP
not include projections for Chance for Change/Satellite program enrollment
does
Enrollment & Staffing: English Learner
requires monitoring students for two years (students in Monitoring Year 1 and Monitoring Year 2) and, for accountability purposes, permits EL students who have exited the EL program to be included in the EL sub group for up to four years.
ELP levels correspond to: 1) Entering; 2) Emerging; 3) Developing; 4) Expanding; and, 5) Bridging. After reaching a composite overall proficiency level of 4.4 or higher on access for ELLS, students in Virginia are considered to have attained proficiency in English and are monitored for four years to ensure success in the general education classroom. Additional information on ELP levels can be found at https://www.acps.k12.va.us/Page/387, and on the WIDA consortium website at https://wida. wisc.edu/.
International Academy
The International Academy (IA) model of service is designed to meet the needs of
recent immigrant students learning the English language while earning course credit toward the next grade level and on-time high school graduation with college/career preparation. The IA model of service is currently offered at Francis C. Hammond Middle School and Alexandria City High School, in addition to the traditional content-based English learner model of service.
English Learner Staffing
Beginning in FY 2017, adjustments were made to the English learner staffing methodology. The new methodology addressed staffing challenges at smaller elementary schools. It incorporates a tiered allocation of teachers for schools with EL student populations up to 119 students as follows:
1-30 students: 1.00 FTE
31-60 students: 2.00 FTE 61-119 students: 3.00 FTE
1 Rising ninth graders in ELP Level 1 are projected to go to Alexandria City High School International Academy. 2 ACPS does not project enrollment for CFC or Satellite programs
3There is a 0.10 FTE EL Teacher position at Ferdinand T. Day that is funded by Title I funds and a
FTE EL Teacher position at ACHS that is funded by ESSER II funds.
Page 137 Enrollment & Staffing ACPS FY 2024 Proposed Budget
FY 2020 Sept FY 2021 Sept FY 2022 Sept FY 2023 Actual FY 2024 Proposed FY 2020 Final Budget FY 2021 Final Budget FY 2022 Final Budget FY 2023 Final Budget FY 2024 Proposed Budget Change FY 2023 to FY 2024 Charles Barrett 136 139 179 202 202 4.00 4.00 4.00 4.00 4.00Cora Kelly205 165 153 140 140 6.00 6.00 6.00 6.00 6.00Douglas MacArthur123 124 120 127 139 4.00 4.00 4.00 4.00 4.00George Mason111 106 108 105 105 4.00 3.00 3.00 3.00 3.00James K. Polk362 361 414 419 424 10.00 10.00 10.00 10.00 10.00Jefferson-Houston84 76 73 60 79 3.00 3.00 3.00 4.00 4.00John Adams401 392 416 409 409 11.00 11.00 11.00 11.00 11.00Lyles-Crouch33 39 34 40 41 2.00 2.00 2.00 2.00 2.00Naomi L. Brooks24 17 27 19 20 1.00 1.00 1.00 1.00 1.00Mount Vernon386 375 400 380 378 10.00 10.00 10.00 10.00 10.00Patrick Henry295 305 313 384 371 7.00 7.00 7.00 7.00 9.00 2.00 Samuel W. Tucker277 265 289 289 279 8.00 8.00 8.00 8.00 8.00William Ramsay443 366 381 406 452 11.00 11.00 11.00 11.00 11.00Ferdinand T. Day357 406 404 392 396 9.00 10.00 9.50 10.00 10.00Elementary Subtotal3,237 3,136 3,311 3,372 3,435 90.00 90.00 89.50 91.00 93.00 2.00 Francis C. Hammond460 444 491 614 620 16.00 16.00 16.00 15.00 15.00George Washington288 277 306 320 298 12.00 12.00 12.00 11.00 12.00 1.00 Jefferson-Houston26 24 32 33 15 1.00 1.00 1.00 1.00 1.00Patrick Henry19 23 36 72 71 1.00 1.00 1.00 1.00 1.00Middle School Subtotal793 768 865 1,039 1,004 30.00 30.00 30.00 28.00 29.00 1.00 Alexandria City High School- Minnie Howard Campus140 163 159 204 169 5.00 5.00 5.00 5.00 5.00Alexandria City High School- King Street 1 890 829 935 1,098 1,176 27.00 27.00 27.00 29.00 29.00Secondary Subtotal1,030 992 1,094 1,302 1,345 32.00 32.00 32.00 34.00 34.00Chance for Change / Satellite Program2 5 9 7 7 7 1.00 1.00 1.00 1.00 1.00Alternative Education Program Subtotal5 9 7 7 7 1.00 1.00 1.00 1.00 1.00Reserve Positions 2.00 4.00 4.00 4.00Grand Total, Excluding Monitoring Years5,065 4,905 5,277 5,720 5,791 153.00 155.00 156.50 158.00 161.00 3.00
1.00
School EL ENROLLMENT EL STAFFING
Enrollment & Staffing: English Learner
Elementary schools with 120 or more EL students are staffed using the service minutes formula, which applies service minutes to a student based on their grade and ELP level, and incorporates instructional hours per teacher with a caseload cap to allocate teacher FTEs.
There will be a 3.00 FTE increase in EL teacher in FY 2024. The EL teacher reserve will remain at 4.00 FTE in FY 2024.
At the middle school level, Francis C. Hammond has both a traditional model and an International Academy (IA) model of services. Francis C. Hammond Middle School is allocated a total of 15.00 FTE EL teachers. There are 11.00 FTE core content teachers to support the traditional model of EL services and 4.00 FTE to support the IA model of EL services. George Washington will receive an allocation of 12.00 FTE, and Jefferson-Houston and Patrick Henry will each receive 1.00 FTE to support the traditional model of EL services.
At the high school level, staffing for the International Academy (IA) model of service at the Alexandria City High School campus provides each of seven student cohorts with core content teachers and EL support teachers. In addition, both Alexandria City High School and Minnie Howard campuses are allocated EL support to provide services to EL students who receive traditional content-based EL services. Staffing for Alexandria City High School campus includes 29.00 FTE EL teachers and the Minnie Howard campus includes 5.00 FTE EL support teachers.
Page 138 Enrollment & Staffing ACPS FY 2024 Proposed Budget
Enrollment & Staffing: Elementary
Elementary Homeroom Staffing
Elementary homeroom staffing is based on grade-by-grade enrollment projections and on the Capacity Reassignment (formerly referred to as Modified Open Enrollment) Ratios or class size caps shown to the right. All students are part of the homeroom staffing calculations, including students receiving specialized instruction and English learner (EL) services.
ACPS uses a conservative approach to staffing, as enrollment projections for the next several years show continuing growth. In an effort to manage increasing student enrollment within the constraints of the physical capacity of existing schools, ACPS implemented a capacity reassignment model in FY 2011.
Capacity reassignment places grade level caps on schools that are over capacity. As new families enroll in these full grade levels, they are offered the option to enroll in other ACPS schools. ACPS staff helps families choose a different Alexandria school with space at their child’s grade level and provide transportation to the affected students. This practice allows building administrators to utilize limited space more effectively and to staff appropriately, resulting in lower costs.
Capacity reassignment does not affect students who are currently enrolled or their siblings; every effort is made to keep families together. In addition, ACPS also makes a special effort to reach out to parents who may wait until the first day of school to register their children.
Enrollment and staffing projections by grade level and school using capacity reassignment are shown in the table on the following page.
Capacity Reassignment Ratios
For FY 2023, homeroom staffing will decrease by 5.00 FTE positions compared to the prior fiscal year.
Page 139 Enrollment & Staffing ACPS FY 2024 Proposed Budget
Kindergarten Students Teachers (FTE) Increase Factor Minimum Class Size Maximum Class Size Student Capacity -1 1.00 22 23 2.00 2211.522.044 45 3.00 2215.022.066 67 4.00 2216.822.088 89 5.00 2217.822.0110 111 6.00 2218.522.0132 133 7.00 2219.022.0154 155 8.00 2219.422.0176 177 9.00 2219.722.0198 Grades 1-2 Students Teachers (FTE) Increase Factor Minimum Class Size Maximum Class Size Student Capacity -1 1.00 24 25 2.00 2412.524.048 49 3.00 2416.324.072 73 4.00 2418.324.096 97 5.00 2419.424.0120 121 6.00 2420.224.0144 145 7.00 2420.724.0168 169 8.00 2421.124.0192 193 9.00 2421.424.0216 Grades 3-5 Students Teachers (FTE) Increase Factor Minimum Class Size Maximum Class Size Student Capacity -1 1.00 26 27 2.00 2613.526.052 53 3.00 2617.726.078 79 4.00 2619.826.0104 105 5.00 2621.026.0130 131 6.00 2621.826.0156 157 7.00 2622.426.0182 183 8.00 2622.926.0208 209 9.00 2623.226.0234
Enrollment & Staffing: Elementary
Elementary Student and Homeroom Teacher Projections FY 2024 Proposed Budget
¹Effective FY 2021, all Paraprofessional positions were re-titled to Instructional Assistant (IA).
²Elementary student enrollment excludes preschool.
³Jefferson-Houston and Patrick Henry have middle school positions that are not reflected on this table.
Page 140 Enrollment & Staffing ACPS FY 2024 Proposed Budget
School Name Grade¹ FY 2023 Projected Enrollment ² FY 2023 Final FTE FY 2024 Projected Enrollment ² FY 2024 Final FTE Change, FY 2023 to FY 2024 School Name Grade¹ FY 2023 Projected Enrollment ² FY 2023 Final FTE FY 2024 Projected Enrollment ² FY 2024 Final FTE Change, FY 2023 to FY 2024 K Tchr5.00 4.00 (1.00) K Tchr4.00 4.00K IA91 5.00 88 4.00 (1.00) K IA82 4.00 72 4.00184 4.00 75 4.00 - 162 3.00 72 3.00283 4.00 93 4.00 - 280 4.00 67 3.00 (1.00) 385 4.00 88 4.00 - 361 3.00 71 3.00480 4.00 78 3.00 (1.00) 473 3.00 65 3.00567 3.00 77 3.00 - 546 2.00 71 3.00 1.00 Total490 29.00 499 26.00 (3.00) Total404 23.00 418 23.00K Tchr3.00 3.00 - K TchrK IA49 3.00 53 3.00 - K IA138 2.00 46 2.00 - DL K Tchr 7.00 7.00236 2.00 38 2.00 - DL K IA 151 7.00 154 7.00335 2.00 42 2.00 - 1172 144444 2.00 40 2.00 - DL 17.00 6.00 (1.00) 546 2.00 40 2.00 - 2153 164Total248 16.00 259 16.00 - DL 27.00 7.00K Tchr5.00 5.00 - 3139 136K IA102 5.00 100 5.00 - DL 36.00 6.00197 4.00 103 5.00 1.00 4144 126280 4.00 91 4.00 - DL 46.00 5.00 (1.00) 385 4.00 84 4.00 - 5125 133499 4.00 99 4.00 - DL 55.00 6.00 1.00 590 4.00 94 4.00 - Total884 45.00 857 44.00 (1.00) Total553 30.00 571 31.00 1.00 K Tchr3.00 3.00K Tchr6.00 5.00 (1.00) K IA55 3.00 55 3.00K IA111 6.00 105 5.00 (1.00) 158 3.00 64 3.00177 4.00 118 5.00 1.00 255 3.00 51 3.002111 5.00 87 4.00 (1.00) 354 2.00 51 2.00383 4.00 110 5.00 1.00 449 2.00 55 3.00 1.00 490 4.00 86 4.00 - 553 2.00 51 2.005102 4.00 82 4.00 - Total324 18.00 327 19.00 1.00 Total574 33.00 588 32.00 (1.00) K Tchr6.00 4.00 (2.00) K Tchr3.00 3.00 - K IA121 6.00 88 4.00 (2.00) K IA67 3.00 58 3.00 - 1110 5.00 120 5.00148 3.00 46 2.00 (1.00) 2112 5.00 141 6.00 1.00 256 2.00 45 2.00 - 3105 4.00 123 5.00 1.00 354 3.00 54 3.00 - 4124 5.00 102 4.00 (1.00) 452 2.00 52 2.00 - 5104 4.00 128 5.00 1.00 548 3.00 49 2.00 (1.00) Total676 35.00 702 33.00 (2.00) Total325 19.00 304 17.00 (2.00) K Tchr6.00 6.00K Tchr6.00 6.00 - K IA128 6.00 127 6.00K IA123 6.00 131 6.00 - 1123 6.00 124 6.001157 7.00 133 6.00 (1.00) 2101 5.00 134 6.00 1.00 2103 5.00 158 7.00 2.00 3109 5.00 97 4.00 (1.00) 3125 5.00 110 5.00 - 497 4.00 124 5.00 1.00 4126 6.00 144 6.00 - 5112 5.00 99 4.00 (1.00) 5114 5.00 111 5.00 - Total670 37.00 705 37.00Total748 40.00 787 41.00 1.00 K Tchr5.00 6.00 1.00 K Tchr4.00 3.00 (1.00) K IA105 5.00 127 6.00 1.00 K IA72 4.00 66 3.00 (1.00) 194 5.00 109 5.00173 3.00 58 3.00 - 288 4.00 106 5.00 1.00 263 3.00 65 3.00 - 3110 5.00 83 4.00 (1.00) 361 3.00 58 3.00 - 487 4.00 101 4.00477 3.00 69 3.00 - 575 3.00 95 4.00 1.00 559 3.00 82 4.00 1.00 Total559 31.00 621 34.00 3.00 Total405 23.00 398 22.00 (1.00) Grand Total7,536 417.00 7,752 415.00 (2.00) K Tchr4.00 4.00K IA117 4.00 119 4.00DL K Tchr 2.00 2.00DL K IA 2.00 2.001121 4.00 138 5.00 1.00
DL 12.00 2.002110 3.00 115 4.00 1.00 DL 22.00 2.003112 3.00 113 3.00DL 32.00 2.004111 3.00 112 3.00DL 42.00 2.005105 3.00 119 3.00DL 52.00 2.00Total676 38.00 716 40.00 2.00 Douglas MacArthur William Ramsay Ferdinand T. Day George Mason James K. Polk JeffersonHouston³
Naomi L. Brooks
Charles Barrett
LylesCrouch
Mount Vernon
John Adams Cora Kelly Samuel Tucker Patrick Henry³
Enrollment & Staffing: Elementary
Elementary Dual Language
Mount Vernon implemented a school-wide dual language model of instruction in FY 2017. All classrooms in grades K - 2 and math and science content areas in grades 3 -5 will continue to be dual language in FY 2023. For staffing allocations, class size caps are applied assuming the same number of dual language classrooms for the rising classes. The general classrooms are adjusted to accommodate any changes in projected enrollment. This is done for the higher grades at Mount Vernon Community School and for all grades at John Adams.
Elementary Encore Staffing
Elementary encore staffing includes library media specialist, art, vocal music, and physical education teachers, however at the discretion of the School Principal, encore allocations can be assigned in other areas of need to serve the entire student body. Positions have been allocated according to standard instructional time periods for art, vocal music, and physical education for all elementary schools.
In FY 2019, the staffing formula for art, vocal music, and physical education
teachers was revised to better meet the needs of the school division. Staffing for elementary encore teachers is formulated at 1.00 FTE for every five K-5 classrooms and 1.00 FTE for every eight preschool and city-wide classrooms projected for FY 2022. Additionally, staffing for middle encore teachers for Jefferson-Houston and Patrick Henry is formulated at 1.00 FTE for every 125 projected students. Formula driven staffing is rounded to the nearest 0.20 FTE.
The encore staffing formula continues to consider preschool classes, as these students also receive encore instruction. It also allows for common planning time within the school.
Instrumental music (band and orchestra) is available to students in grades four and five. Since this is not a required class, staffing is provided based on course registration. Details of school-based instrumental music teachers can be found in the staffing report in the Schools Information section.
For FY 2023, elementary encore teachers will increase by 1.70 FTE. In FY 2022, additional FTEs at Jefferson-Houston and Patrick Henry were added as part of Human Resources and Budget approval. The FY 2019 through FY 2023 allocation is shown in the table below.
Page 141 Enrollment & Staffing ACPS FY 2024 Proposed Budget
Position Type¹School Name FY 2020 Final Budget FY 2021 Final Budget FY 2022 Final Budget FY 2023 Final Budget FY 2024 Proposed Budget Change, FY 2023 to FY 2024 Charles Barrett 5.60 5.80 5.40 5.40 5.40Cora Kelly 5.00 5.00 5.00 5.00 5.00Douglas MacArthur 6.20 5.60 5.20 5.60 5.60Early Childhood Center²2.00 2.10 2.00 2.00 2.00Ferdinand T. Day5.00 5.00 5.40 5.00 5.00George Mason 5.00 5.00 5.00 5.00 5.00James K. Polk 7.20 7.20 7.00 7.00 7.00Jefferson-Houston 6.20 7.20 6.00 7.00 7.00John Adams²6.40 6.50 6.20 6.20 6.20Lyles-Crouch 5.00 5.00 5.00 5.00 5.00Mount Vernon 7.80 8.00 7.80 7.80 7.80Naomi L. Brooks5.00 5.00 5.00 5.00 5.00Patrick Henry³7.60 8.30 7.80 8.50 8.50Samuel W. Tucker 7.00 6.60 6.20 6.20 6.20William Ramsay 5.40 6.40 5.80 5.80 5.80Elementary Encore Total86.40 88.70 84.80 86.50 86.50 -
¹Elementary encore positions are assigned at the Principal's discretion.
Elementary Encore
(FTE) Elementary Encore (Art Teacher,
Music
and
Library Media Specialist) FY 2024 Proposed Budget
Note: The table displays formula driven encore allocation which includes Jefferson-Houston and Patrick Hentry middle school encore. It does not include non-formula driven encore staffing.
Positions
Vocal
Teacher, Health
Physical Education Teacher, and
Enrollment & Staffing: Elementary
Student Improvement FTE
Each elementary school receives a base of 3.50 student improvement FTE (formerly referred to as FLEX). Those schools with projected enrollment greater than 700 students and free and reduced-price meal eligibility greater than 60 percent will receive an additional student improvement FTE. In FY 2024, no adjustments to student improvement staffing were applied, keeping staffing unchanged. These positions are assigned at the principals’ discretion based on individual school needs and are shown in the below table.
Page 142 Enrollment & Staffing ACPS FY 2024 Proposed Budget
Position TypeSchool Name FY 2019 Final Budget FY 2020 Final Budget FY 2021 Final Budget FY 2022 Final Budget FY 2023 Final Budget FY 2024 Proposed Budget Student Improvement Charles Barrett 3.50 3.50 3.50 3.50 3.50 3.50 Cora Kelly 3.50 3.50 3.50 3.50 3.50 3.50 Douglas MacArthur 3.50 3.50 3.50 3.50 3.50 3.50 Ferdinand T. Day3.50 3.50 3.50 3.50 3.50 3.50 George Mason 3.50 3.50 3.50 3.50 3.50 3.50 James K. Polk 4.50 4.50 4.50 4.50 4.50 4.50 Jefferson-Houston 3.50 3.50 3.50 3.50 3.50 3.50 John Adams 4.50 4.50 4.50 4.50 4.50 4.50 Lyles-Crouch 3.50 3.50 3.50 3.50 3.50 3.50 Mount Vernon 3.50 3.50 3.50 3.50 3.50 3.50 Naomi L. Brooks3.50 3.50 3.50 3.50 3.50 3.50 Patrick Henry 4.50 4.50 4.50 4.50 4.50 4.50 Samuel W. Tucker 4.50 4.50 4.50 4.50 4.50 4.50 William Ramsay 4.50 4.50 4.50 4.50 4.50 4.50 54.00 54.00 54.00 54.00 54.00 54.00
FY 2024 Proposed Budget Student Improvement Total
Student Improvement (FTE)
Enrollment & Staffing: Assistant Principals
Assistant Principal Staffing
ACPS provides assistant principal positions for elementary schools via formula. Dean of Students positions are included in this number. In FY 2016, the formula was expanded to add assistant principal positions at a rate of:
1.00 FTE for up to 600 students;
2.00 FTE for 601 to 900 students; and,
3.00 FTE for more than 900 students. In the FY 2024 Budget, the FTE’s remain at 24.0 overall although there may be shifts among schools.
Page 143 Enrollment & Staffing
ACPS FY 2024 Proposed Budget
Position TypeSchool Name FY 2020 Final Budget FY 2021 Final Budget FY 2022 Final Budget FY 2023 Final Budget FY 2024 Proposed Budget Change, FY 2023 to FY 2024 Charles Barrett1.00 1.00 1.00 1.00 1.00Cora Kelly1.00 1.00 1.00 1.00 1.00Douglas MacArthur2.00 2.00 2.00 2.00 2.00Early Childhood Center- - 0.50 1.00 1.00Ferdinand T. Day1.00 1.00 1.00 1.00 1.00George Mason1.00 1.00 1.00 1.00 1.00James K. Polk2.00 2.00 2.00 2.00 2.00Jefferson-Houston2.00 2.00 2.00 2.00 2.00John Adams2.50 3.00 2.50 2.00 2.00Lyles-Crouch1.00 1.00 1.00 1.00 1.00Mount Vernon1.00 1.00 1.00 1.00 1.00Naomi L. Brooks3.00 3.00 3.00 3.00 3.00Patrick Henry2.00 2.00 2.00 2.00 2.00Samuel W. Tucker2.00 2.00 2.00 2.00 2.00William Ramsay2.00 2.00 2.00 2.00 2.00Grand Total23.50 24.00 24.00 24.00 24.00 -
Principal
Elementary Assistant Principal Positions (FTE) FY 2024 Proposed Budget Assistant
Enrollment & Staffing: Standards of Quality
Virginia Standards of Quality (SOQ)
The School Board is required to design and implement an instructional program that is aligned with the Standards of Learning set forth by the Virginia Board of Education. These standards encompass the requirements that must be met by the school division. Additionally, the Virginia Board of Education has established maximum student-to-teacher ratios for the following areas:
• Elementary homeroom
• Special education
• English
• Reading
• Prevention, intervention, and remediation
• English learners
• Principals and Assistant Principals
• Librarians
• School Counselors
• Art, music, and physical education (K-5)
• Technology support
• Instructional technology resource
ACPS routinely confirms that staffing across all schools meets or exceeds the ratios established by the Virginia Board of Education. For FY 2023, ACPS increased emphasis in the areas Prevention, intervention, and remediation as well as School Counselors. Although ACPS meets the minimum requirement in the areas of technology support and instructional technology resources, these are areas that will need to be monitored and assessed as enrollment continues to grow.
Staffing for some of these SOQ areas are displayed in the following pages.
Library Media Assistant
For FY 2024, the library media assistant FTE will remain unchanged compared to the prior fiscal year. Library media assistants allocations are shown in the table below.
Note: Does not include Library Media Assistant positions assigned from encore allocations.
Page 144 Enrollment & Staffing ACPS FY 2024 Proposed Budget
Position TypeSchool Name FY 2020 Final Budget FY 2021 Final Budget FY 2022 Final Budget FY 2023 Final Budget FY 2024 Proposed Budget Change, FY 2023 to FY 2024 Charles Barrett0.60 0.60 0.60 0.60 0.60Cora Kelly0.60 0.60 0.60 0.60 0.60Douglas MacArthur1.00 1.00 1.00 1.00 1.00Early Childhood Center- 0.50 0.50 0.50 0.50Ferdinand T. Day0.60 0.60 0.60 0.60 0.60George Mason0.60 0.60 0.60 0.60 0.60James K. Polk1.00 1.00 1.00 1.00 1.00Jefferson-Houston1.00 1.00 1.00 1.00 1.00John Adams1.00 1.00 1.00 1.00 1.00Lyles-Crouch0.60 0.60 0.60 0.60 0.60Mount Vernon1.00 1.00 1.00 1.00 1.00Naomi L. Brooks0.60 0.60 0.60 0.60 0.60Patrick Henry0.60 0.60 0.60 0.60 0.60Samuel W. Tucker1.00 1.00 1.00 1.00 1.00William Ramsay1.00 1.00 1.00 1.00 1.00Grand Total11.20 11.70 11.70 11.70 11.70 -
FY 2024 Proposed Budget
Elementary Library Media Assistant Positions (FTE)
Library Media Assistant
Enrollment & Staffing: Standards of Quality
Talented and Gifted Staffing
The Local Plan for Gifted Education was revised in 2012 and provides for additional services in order to reach a broader, more representative group of students in ACPS. Once the plan was implemented, staffing availability needed to be thoroughly reviewed. Historically, Talented and Gifted (TAG) teachers were assigned one per building in each elementary school. As a result, available staff was imbalanced requiring a new allocation process of TAG teachers across schools.
A staffing formula to address enrollment and services for the TAG program was designed with the following factors taken into consideration:
• Scheduling options for TAG services including Young Scholars, General Intellectual Ability (GIA) and Specific Academic Ability;
• Class size and enrollment;
• Teacher time requirements; and,
• Dual Language program at John Adams and Mount Vernon.
TAG teachers are needed as teachers of record to provide advanced English/language arts and math instruction to two grade levels, as well as serve as either consultants or direct service providers to K-3 services and Young Scholars. The need for staffing is primarily dependent on enrollment levels. The net change for TAG is zero though code corrections occured to reflect the shifts correctly.
Page 145 Enrollment & Staffing ACPS FY 2024 Proposed Budget
Position TypeSchool Name FY 2020 Final Budget FY 2021 Final Budget FY 2022 Final Budget FY 2023 Final Budget FY 2024 Proposed Budget Change, FY 2023 to FY 2024 Charles Barrett1.00 1.00 1.00 1.00 1.00Cora Kelly1.00 1.00 1.00 1.00 1.00Douglas MacArthur2.00 2.00 2.00 2.00 2.00Ferdinand T. Day1.30 1.30 1.30 1.00 1.00George Mason2.00 2.00 2.00 2.00 2.00James K. Polk2.00 2.00 2.00 2.00 2.00Jefferson-Houston1.00 1.00 1.00 1.00 1.00John Adams1.00 1.00 1.00 1.00 1.00Lyles-Crouch1.50 1.50 1.50 1.50 1.50Mount Vernon2.00 2.00 2.00 2.00 2.00Naomi L. Brooks2.00 2.00 2.00 2.00 2.00Patrick Henry1.00 1.00 1.00 1.00 1.00Samuel W. Tucker1.20 1.20 1.20 1.00 1.00William Ramsay1.20 1.20 1.20 1.00 1.00Talented & Gifted Programs*1.00 1.00 1.00 1.70 1.70Grand Total21.20 21.20 21.20 21.20 21.20* Includes TAG Coordinator Talented and Gifted Teacher Elementary Talented and Gifted Positions (FTE) FY 2024 Proposed Budget
Standard School Allocations
Standard School Allocations
The table on the following page shows FY 2024 non-personnel base allocations for each school. Enrollment projections, on which these school base and stipend allocations are based, were not applied, but are typically calculated in November using FY 2024 projected PreK12 enrollment data. For the FY 2024 budget, school allocations were unchanged from the prior fiscal year, so schools would not be impacted due to the changing enrollment.
The total school base allocation includes the costs of instructional materials, services, and capital outlay. The FY 2024 per pupil rates are as follows:
• Elementary: $ 95.00
• Middle: $155.00
• High: $195.00
Each elementary school receives a base allocation of $10,000 for FY 2024. The per pupil rate is multiplied by the projected enrollment base, then an additional $10,000 is added for elementary schools to determine the total school base allocations.
Enrollment at each school is reviewed every fall after the school year has begun. Schools where actual enrollment is significantly higher than projected receive an increase to their allocations through the enrollment adjustment reserve.
School base allocation for Alexandria City HS Division-Wide Athletics, Alexandria City HS Financial Aid, Alexandria City HS International Academy, Alexandria City HS Satellite, and Alexandria City HS Chance for Change Academy is based on prior fiscal year nonpersonnel budget which will carry into FY 2024.
Additional Standard Allocations
Elementary Exemplary Programs: Elementary schools will continue their exemplary programs in FY 2024 with funding based on specific program needs. For FY 2024, the schools have
chosen the following exemplary programs:
• Charles Barrett: Changing Education Through the Arts (CETA)
• Cora Kelly: Science, Technology, and Math Focus
• Douglas MacArthur: Responsive Classroom
• Ferdinand T. Day: Science, Technology, Engineering, and Math (STEM)
• George Mason: Science Focus
• James K. Polk: Soaring with Pride
• Jefferson-Houston: International Baccalaureate Primary and Middle Years Programmes
• John Adams: Dual Language (Spanish) and Changing Education Through the Arts (CETA)
• Lyles-Crouch: Core Knowledge
• Naomi L. Brooks: Habits of Mind
• Mount Vernon: Dual Language (Spanish)
• Patrick Henry: Discourse and Rigor
• William Ramsay: Guided Language Acquisition Design (GLAD)
Details on each school’s exemplary program can be found in the Schools section of the budget document.
Other Supplemental Personnel
Teacher Substitutes: Funding for two teacher substitute days when licensed personnel are on professional leave was previously included in the schools’ base allocations. Funding for teacher substitutes when licensed personnel are on paid or unpaid leave is located in the Division-Wide Human Resources budget.
Standard School and Athletic Stipends: All schools, with the exception of Early Childhood Center, receive standard school stipends for the grade level/department chair and to conduct student activities and bus duty. Early Childhood Center receives standard school stipend for grade level/department chair and bus duty only. Details on the standard school, departmentfunded, and athletic stipends are provided later in the Stipends section of this chapter.
Page 146 ACPS FY 2024 Proposed Budget School Allocations
Standard School Allocations
¹Enrollment does not include special placement students.
Tucker offers an intersession program as part of the modified school calendar in lieu of an exemplary program.
exemplary program, exte nded learning, K-Prep and sti pend allocations include benef its at 7.65%, as applicable.
The stipend amounts match the levels developed in September 2013 by the Human Resources department.
2 days per teacher for professional development. All other funding for substitutes is budgeted centrally in the
Page 147 ACPS FY 2024 Proposed Budget School Allocations
Substitutes FY 2024 Projected PreK-12 Enrollment¹ Base Allocation Per Pupil Rate Total School Base Allocation Student Activity Grade Level/ Department Chair Bus Duty Stipends Athletics Number of Substitute Days ⁵ Charles Barrett52610,000 $ 95 $ 59,970 $ 22,125 $ 1,651 $ 6,605 $ 2,907 $$ 93,258 $ 104 Cora Kelly26510,0009535,17529,800 1,651 6,605 2,90776,13890 Douglas MacArthur60310,0009567,28513,000 1,651 6,605 3,87592,417102 Early Childhood Center22210,0009531,090-1,651 16,14848,88939 Ferdinand T. Day58810,0009565,86020,000 1,651 6,605 2,90797,023116 George Mason30410,0009538,88071,211 1,651 6,605 2,907121,25481 James Polk78710,0009584,76510,000 1,651 6,605 3,875106,897142 Jefferson-Houston (PreK-gr 5)43010,0009550,85028,850 1,651 6,605 4,84492,801102 John Adams71610,0009578,02052,855 1,651 6,605 3,875143,007139 Lyles-Crouch41810,0009549,71039,292 1,651 6,605 2,907100,16580 Mount Vernon85710,0009591,41510,000 1,651 6,605 4,844114,516151 Naomi L. Brooks32710,0009541,0655,000 1,651 6,605 2,90757,22871 Patrick Henry (K-gr 5)70210,0009576,69015,000 1,651 6,605 4,844104,791149 Samuel Tucker70510,0009576,9751,651 6,605 4,84490,076126 William Ramsay65710,0009572,41530,000 1,651 6,605 3,875114,547129 SUB-TOTAL8,107920,165347,13323,11994,12768,46501,453,0091,622 Jefferson-Houston (Gr 6-8)19415530,07026,3504,58361,00337 Patrick Henry (Gr 6-8)22015534,100-4,58338,68311 Francis C. Hammond1,480155229,40018,331 12,220259,951298 George Washington1,271155197,00518,331 12,220227,556256 SUB-TOTAL3,165490,57526,35036,66133,60600587,192603 Alexandria CityMinnie Howard Campus 1,010195196,95021,995 13,986232,931439 Alexandria CityKing Street Campus 3,511195684,645263,346 67,360 48,9511,064,301145 Alexandria CityDivision-wide Athletics 186,800--478,728 665,528Alexandria CityFinancial Aid 13,648--13,648Alexandria CityInternational Acaademy 0--096 Alexandria CitySatellite 46,439--46,43910 Chance for Change Academy 67,857--67,85724 SUB-TOTAL4,5211,196,340263,34689,35562,9360478,7282,090,705714 GRAND TOTAL15,7932,607,080 $ 636,829 $ 149,135 $ 190,670 $ 68,465 $ 478,728 $ 4,130,907 $ 2,939
²Samuel
³All
⁴
⁵
Human R esources
School School Base Allocations Grand Total Allocation FY 2024 Standard School Allocations Exemplary Program 2,3 Stipends³ ⁴
Allots
budget.
Additional School Allocations
Additional School Allocations
Additional school allocations, not defined on the standard school allocations page, are also provided to schools each year, including student improvement FTEs, field trips, and extended learning and summer programs. These allocations are explained below with detailed allocation information found on the following pages.
Kindergarten Prep (K-Prep): All kindergarten elementary schools on a traditional calendar receive a K-Prep allocation for summer 2023. The K-Prep program is a four-day, four-anda-half-hour per day program offered in August to introduce rising kindergartners to their respective schools and classrooms. All students are introduced to beginning academic skills and are prepared for early success in school.
For FY 2024, each K-Prep classroom is allocated one teacher, one instructional assistant, and $50 for instructional supplies. In addition, each school is allocated a school nurse and a special education teacher to support the program.
Middle School Prep: The Middle School Prep program is a two-day, four-hour per day program offered in August to provide all rising sixth graders an opportunity to become acclimated to the middle school experience through information sessions with teachers, school counselors, school administrators, and various staff members. These sessions may include the following topics: organizational and study skills, team building opportunities with new classmates, tours, a scavenger hunt throughout the building, managing a multicourse load, and school policies. Each Middle School Prep classroom is allocated $25 for instructional supplies.
Summer Language Academy: Mount Vernon Community School was first allocated funding in FY 2015 for the Summer Language Academy as part of the transition from a modified to a traditional calendar. The academy is offered
to all rising first through fifth grade Mount Vernon Community School students and to John Adams Elementary School dual language students.
Modified Calendar School: Starting with the 2004-2005 school year, Samuel W. Tucker Elementary School converted from a traditional school calendar to a modified school calendar.
Samuel W. Tucker students attend school the same number of days as included in the traditional calendar, but have the option of attending up to 20 additional days of school.
Samuel W. Tucker students begin school in early August and have the summer break days redistributed throughout the year so that students attend school for approximately nine weeks and have a break before the next nine-week term begins. During this break or extended learning session, the school hosts a two-week intersession where students can attend additional remediation or enrichment classes.
Samuel W. Tucker Elementary School is allocated additional funds for extended learning opportunities as part of the modified school calendar. The FY 2024 budget includes the total funding necessary for four weeks of additional time; intersession revenue from fees collected will be credited to ACPS’s general operating fund.
Division-Wide Summer Learning: In addition to the individual schools’ summer programs, three division-wide summer learning programs will be held: two at the elementary level and one at the middle school level. Funding is located in the budgets for the Office of Instructional Support. These summer programs focus on Tier 2 and Tier 3 students.
Alexandria City HS Summer Learning: Summer learning funds are allocated for the credit recovery summer learning program at Alexandria City High School. Also included are additional summer work days for school counselors at Alexandria City HS to assist students with registration, applications, and
Page 148 ACPS FY 2024 Proposed Budget School Allocations
Additional School Allocations
Page 149 ACPS FY 2024 Proposed Budget School Allocations
FY 2024 Projected Student Base FY 2024 Proposed Allocation Kindergarten Prep* Charles Barrett88 10,739 $ Cora Kelly53 7,394 Douglas MacArthur100 12,412 Ferdinand T. Day105 12,412 George Mason58 9,067 James K. Polk131 14,084 Jefferson-Houston66 9,067 John Adams119 12,412 Lyles-Crouch72 9,067 Mount Vernon154 15,757 Naomi L. Brooks55 7,394 Patrick Henry88 10,739 William Ramsay127 12,412 Total Kindergarten Prep142,956 Middle School Prep Jefferson-Houston64 125 $ Patrick Henry85 100 Francis C. Hammond499 525 George Washington428 525 Total Middle School Prep1,275 Mount Vernon and John Adams Summer Language Academy 222,834 $ Samuel Tucker Modified School Calendar 356,332 Division-Wide Summer Learning Programs 449,963 Alexandria City HS Summer Learning/Credit Recovery 276,882 Extended School Year (ESY) 300,655 English Learner (EL) Summer 241,282 Summer Transportation 236,830 Total Summer Learning2,084,779 $ FY 2023 Projected Student Base FY 2023 Final Allocation FY 2024 Projected Student Base FY 2024 Proposed Allocation Change, FY 2023 to FY 2024 Extended Learning/Tutoring Charles Barrett519 34,165 $ 526 34,165 $ - $ Cora Kelly301 24,925 265 24,925Douglas MacArthur576 46,519 603 46,519Ferdinand T. Day631 42,560 588 42,560George Mason405 40,048 304 40,048James K. Polk790 59,122 787 59,122Jefferson-Houston615 50,616 624 50,616John Adams657 49,490 716 49,490Lyles-Crouch470 29,479 418 29,479Mount Vernon894 81,443 857 81,443Naomi L. Brooks368 28,871 327 28,871Patrick Henry919 64,920 922 64,920Samuel Tucker735 52,284 705 52,284William Ramsay610 66,517 657 66,517Francis C. Hammond1,406 26,585 1,480 26,585George Washington1,486 23,415 1,271 23,415Alexandria City HS King St4,392 40,000 4,521 40,000Total Extended Learning/Tutoring760,960 $ 760,960 $ - $ Grand Total2,845,739 $ School School Summer Learning and Extended Learning Funds
Additional School Allocations
course scheduling.
Extended School Year (ESY): Certain students with disabilities are served through the Extended School Year program during the summer months. The students must be identified for the program through their Individualized Education Plan (IEP). Funding is budgeted centrally at the Special Education Office.
English Learner Summer: English learner (EL) students are served through the EL summer learning program. Funding is centrally budgeted at the English Learner Services Office.
Summer Transportation: Transportation for all summer learning programs is provided and funded through a transportation allocation.
Extended Learning Opportunities: Schools receive extended learning/tutoring funds to supplement classroom instruction. Each principal has the ability to create a unique
program to support students.
Each elementary and middle school, except Early Childhood Center, will receive a base allocation determined by student enrollment as well as a differentiated amount based on the enrollment and performance of special education, EL, and economically disadvantaged students, known as Gap Group 1. For FY 2024, no adjustments were made to school’s extended learning allocations.
Field Trips: Each school, excluding Early Childhood Center, is given an annual field trip allocation. The Athletics Department receives a set allocation and the remaining funds are allocated to the schools based on each school’s percentage of total projected enrollment. If the school or program anticipates additional needs, these may be funded through the school’s base allocation or its local school activity fund. Funding for school field trips are budgeted centrally in the Pupil Transportation Department. For FY 2024, no adjustments were made to school field trip allocations.
Page 150 ACPS FY 2024 Proposed Budget
Allocations
School
$* as a % of total** # as a % of total $ Change % Change Charles Barrett4,560 $ 2.03%526 3.38%113 2.53% Cora Kelly2,298 1.02%265 1.70%(282) -10.93% Douglas MacArthur5,228 2.32%603 3.87%292 5.91% Ferdinand T. Day5,098 2.27%588 3.78%(310) -5.73% George Mason2,636 1.17%304 1.95%(835) -24.06% James K. Polk6,823 3.03%787 5.05%53 0.78% Jefferson Houston (PreK-Gr 5)3,728 1.66%430 2.76%283 8.21% John Adams6,208 2.76%716 4.60%577 10.25% Lyles-Crouch3,624 1.61%418 2.68%(404) -10.03% Mount Vernon7,430 3.30%857 5.50%(231) -3.02% Naomi L. Brooks2,835 1.26%327 2.10%(319) -10.11% Patrick Henry (K-Gr 5)6,086 2.71%702 4.51%207 3.53% Samuel Tucker 6,112 2.72%705 4.53%(187) -2.96% William Ramsay5,696 2.53%657 4.22%468 8.96% Jefferson Houston (Gr 6-8)1,682 0.75%194 1.25%(143) -7.86% Patrick Henry (Gr 6-8)1,907 0.85%220 1.41%(89) -4.48% Francis C. Hammond12,832 5.70%1,480 9.50%782 6.49% George Washington11,020 4.90%1,271 8.16%(1,716) -13.47% AC Minnie Howard8,757 3.89%1,010 6.49%(2,187) -19.99% AC King Street Campus30,440 13.53%3,511 22.55%3,745 14.03% AC Athletics90,000 Total225,000 $ 15,571 101%(184) 0.00% *Allocation does not include benefits.
SCHOOL Allocation FY 2024 Projected K-12 Enrollment*** Change FY 2023 to FY 2024
FY 2024 Final Budget Field Trip Allocation
Stipends
Stipends
Stipends are provided for duties performed outside the scope of the regular work day and in addition to regular duties. The standard school stipends for grade level/department chair and student activity are shown in the tables below. The expectation is that each school will award the same standard stipend for the additional duties performed.
The following types of stipends have been budgeted for each school:
• Grade level, department chair, or team leader stipends are awarded when a teacher coordinates instruction within the grade, department, or team level.
• Student activity stipends are provided to employees who supervise an after-school club or coordinate a student activity, such as the student newspaper or safety patrol.
• Bus Duty stipends compensate staff to monitor activity before and after school to increase safety and efficiency as children disembark and board school buses. Each elementary school, except Early Childhood Center (ECC), receives a base of two bus duty stipends and one additional for every three additional buses. Early Childhood Center receives a fixed allocation for the number of pre-school students attending programs at that location.
¹All elementary schools, except Early Childhood Center, each receive eight grade level/department chair and two student activity stipends. Early Childhood Center receives two stipends for lead teachers.
²Francis C. Hammond and George Washington Middle Schools each receive eight department chair and 12 student activity stipends. Jefferson-Houston receives three stipends and Patrick Henry receives two stipends to cover all grades 6-8 activities.
³The high school stipends are shared across all campuses of Alexandria City High School.
Page 151 ACPS FY 2024 Proposed Budget School Allocations
Elementary School Stipend ¹ # per School $ per Stipend Benefits Total Amount Elementary School Grade Level/Department Chair Stipend8767 $ 59 $ 6,605 $ Student Activity Stipend2767 59 1,651 Total Elementary School Stipend8,257 $ Early Childhood Center Grade Level/Department Chair Stipend2767 59 1,651 Total Early Childhood Center Stipend1,651 $ Middle School Stipend ² # per School $ per Stipend Benefits Total Amount Middle School Department Chair Stipend81,419 $ 109 $ 12,220 $ Student Activity Stipend121,419 109 18,331 Total Middle School Stipend30,551 $ Jefferson-Houston and Patrick Henry grades 6-8 Department Chair Stipend31,419 109 4,583 Total Jefferson-Houston and Patrick Henry grades 6-8 Stipend4,583 $ High School Stipend ³ # per School $ per Stipend Benefits Total Amount High School Department Chair/Team Leader Stipend361,624 $ 124 $ 62,936 $ Student Activity Stipend651,277 98 89,355 Total High School Stipend152,291 $ Standard School Stipends FY 2024
Stipends
Additional Stipends: Stipends are budgeted in departments for other activities at the school level which are undertaken outside of regular contract hours to support specific programs.
At the elementary level, lead teacher stipends are awarded in the program areas of English learners (EL), special education, positive behavior interventions and supports (PBIS), and talented and gifted (TAG). For EL, special education, and PBIS stipends, the amount of the stipend is consistent across all eligible elementary schools. For TAG, the stipend is formula-driven and based on the number of students referred for services. Stipends are also offered for mentor teachers. The amount of the stipend varies based on the experience of the mentee and the number of mentees mentors monitor. Test coordinator stipends are
ELEMENTARY SCHOOL
funded through the Accountability Department and are given to the employees responsible for the administration of the standardized testing program. Additionally, Charles Barrett funds a Changing Education Through the Arts (CETA) stipend, Douglas MacArthur funds a Responsive Classroom stipend, and Lyles-Crouch funds a Core Knowledge stipend through their respective exemplary program funds.
At the middle and high school levels, stipends are provided for the special education lead teachers, mentoring, and test coordination. Middle schools also receive stipends for PBIS lead teachers.
Details of these stipends are below, totaling $312,746, excluding the exemplary program stipends funded at the school level.
Department Level Stipends FY 2024
MIDDLE SCHOOL
Note:Allstipendamountsaboveincludebenefitsat7.65%.
Page 152 ACPS FY 2024 Proposed Budget
School Allocations
School EL Special Education PBIS TAGMentoring Test Coordinator Total Charles Barrett1,099 $ 1,722 $ 1,077 $ 1,130 $ 1,399 $ 6,428 $ Cora Kelly1,099 1,722 1,077 565 1,399 5,863 Douglas MacArthur1,099 1,722 1,077 1,130 1,399 6,428 Early Childhood Center1,099 - - - - 1,099 Ferdinand T. Day1,099 1,722 - 565 1,399 4,786 George Mason1,099 1,722 1,077 848 1,399 6,145 James Polk1,099 1,722 1,077 1,130 1,399 6,428 Jefferson-Houston1,099 1,722 1,077 283 1,399 5,580 John Adams1,099 1,722 1,077 848 1,399 6,145 Lyles-Crouch1,099 1,722 1,077 1,413 1,399 6,710 Mount Vernon1,099 1,722 1,077 1,130 1,399 6,428 Naomi L. Brooks1,099 1,722 1,077 848 1,399 6,145 Patrick Henry1,099 1,722 1,077 565 1,399 5,863 Samuel W. Tucker1,099 1,722 1,077 1,130 1,399 6,428 Wiliam Ramsay1,099 1,722 1,077 1,130 1,399 6,428 Francis C. Hammond$ 1,722 $ 1,077 $ 283 $ 1,096 $ 4,177 $ George Washington- 1,722 1,077 283 1,096 4,177 Alexandria City King Street Campus - $ 1,722 $ 1,077 $ - $ - $ 2,799 $ Alexandria City Minnie Howards Campus - 1,722 1,077 - - 2,799 Alexandria City Satellite Campus - - 1,077 - 1,096 2,172 Alexandria City Chance for Change Academy - - 1,077 - 1,096 2,172 Total 16,487 $ 31,003 $ 20,454 $ 13,281 $ 207,546 $ 23,976 $ 312,746 $
HIGH SCHOOL / ALTERNATIVE EDUCATION
Stipends
The Alexandria City HS Division-wide Athletics department also awards stipends for a variety of athletic duties for coaches, trainers, equipment managers, and the assistant athletic director.
Details for all athletic stipends are displayed below.
1All stipend amounts have been rounded to the nearest dollar and include benefits at 7.65%.
Page 153 ACPS FY 2024 Proposed Budget School Allocations
Athletic Stipend Title# Amount per Stipend1 Total Amount1 Athletic Stipend Title# Amount per Stipend1 Total Amount1 Head Baseball Coach 14,790 $ 4,790 $ Assistant Rugby Coach 22,761 5,522 Head Basketball Coach 24,790 9,580 Assistant Soccer Coach 62,761 16,566 Head Varsity Cheerleader Coach 24,790 9,580 Assistant Softball Coach 42,761 11,044 Head Crew Coach 24,790 9,580 Assistant Swimming Coach 32,761 8,283 Head Cross Country Coach 14,790 4,790 Assistant Tennis Coach 22,761 5,522 Head Field Hockey Coach 14,790 4,790 Assistant Track Coach, Indoor 52,761 13,805 Head Football Coach 17,310 7,310 Assistant Track Coach, Outdoor 52,761 13,805 Head Golf Coach 13,890 3,890 Assistant Wrestling Coach 32,761 8,283 Head Lacrosse Coach 24,790 9,580 Assistant Volleyball Coach 43,452 13,808 Head Rugby Coach 24,790 9,580 Assistant Coach Subtotal85256,447 $ Head Soccer Coach 24,790 9,580 Sr. High Equipment Manager 13,797 3,797 Head Softball Coach 14,790 4,790 Assistant Equipment Manager 23,106 6,212 Head Swimming Coach 14,790 4,790 Assistant Athletic Dir.-Administrator 110,010 10,010 Head Tennis Coach (Spring) 23,890 7,780 Head Athletic Trainer 112,426 12,426 Head Track Coach, Indoor (Winter) 14,790 4,790 Athletic Trainer 211,736 23,472 Head Track Coach, Outdoor (Spring) 14,790 4,790 Weight Trainer Fall 11,726 1,726 Head Volleyball Coach 14,790 4,790 Weight Trainer Winter 11,382 1,382 Head Wrestling Coach 14,790 4,790 Weight Trainer Spring 11,726 1,726 Head Coach Subtotal25119,570 $ Weight Trainer Summer 12,071 2,071 Assistant Baseball Coach 42,761 $ 11,044 $ Manager/Trainer Subtotal1162,822 $ Assistant Basketball Coach 82,761 22,088 AC KSC: Study Hall Supervisor1 3,452 3,452 Assistant Crew Coach 102,761 27,610 AC MHC: Study Hall Supervisor1 2,417 2,417 Crew Rigger 13,102 3,102 Study Hall Supervisor Subtotal25,869 $ Assistant Varsity Cheerleader Coach 42,761 11,044 Total Salaries123444,708 $ Assistant Varsity Cross Country 23,452 6,904 Assistant Football Coach 104,143 41,430 Benefits34,020 $ Assistant Field Hockey Coach 53,452 17,260 Assistant Golf Coach 12,761 2,761 Athletics Total119478,728 $ Assistant Lacrosse Coach 62,761 16,566
Athletic Stipends FY 2024
Cost per Pupil: General Education, Special Education, EL
Cost per Pupil
Cost per pupil is a measure frequently used by school systems to put school budgets into perspective and relate total expenditures to the central purpose of schools -- the education of each student. The per pupil amount also supports comparisons over time to easily identify overall cost trends.
General Education, Special Education, and English Learner per Pupil Costs
This set of calculations compares the average cost for all ACPS students and then disaggregates that cost into three components:
• the average cost for a special education student;
• the average cost for an EL student; and,
• the average cost for a student who receives neither of these services, termed “general education.”
There are 15,847 projected students for FY 2024. This total includes 2,130 special education and 5,784 EL students.
General education includes many specialized services that are not shown separately. For example, the general education category includes the costs of exemplary programs and advanced placement participation.
It should be noted that these costs are averages and that actual costs for students in each of these subgroups may vary significantly.
The chart below shows the various components of the cost per pupil for each of these groups. The first cylinder shows the cost for a general education student, with the caveats previously mentioned. The cost for general education students is $17,211, a 3.7 percent increase from the prior fiscal year and 16.1 percent increase from FY 2020 Actual cost per pupil, as shown in the table on the following page.
The second cylinder shows the cost of educating a special education student. The top half cylinders show the costs above the general education cost per pupil. This is a composite of the cost of general education at $17,211 plus the additional cost for special education services at $20,044. The total cost to educate a special education student is $37,255, a 2.4
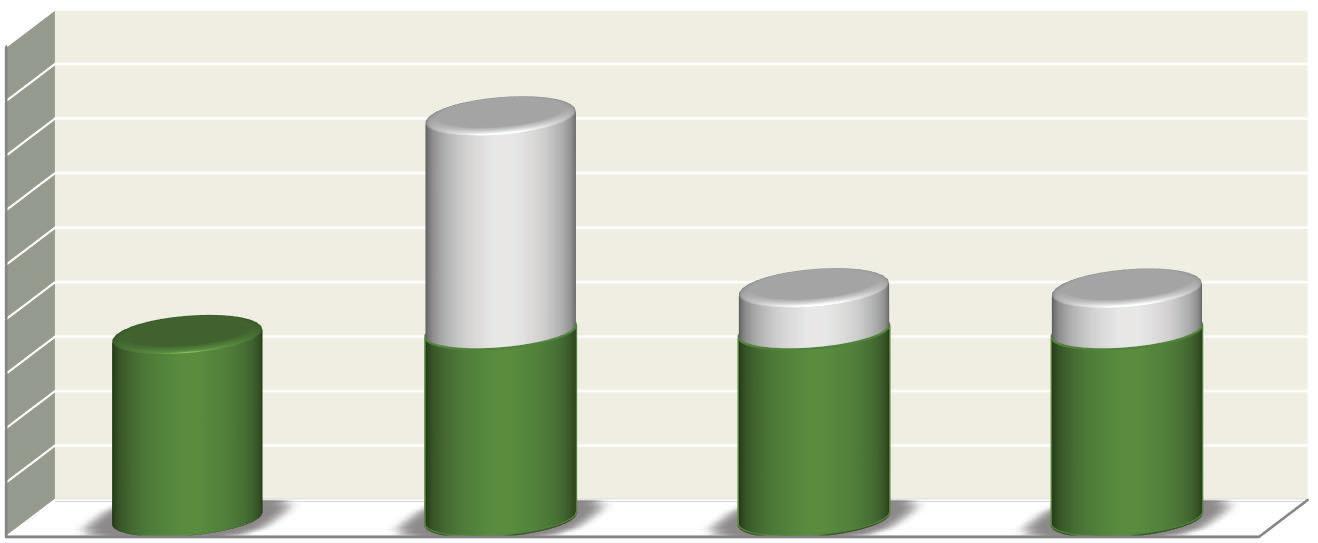
Page 154 ACPS FY 2024 Proposed Budget Cost per Pupil
Note: Totals may vary due to rounding $$5,000 $10,000 $15,000 $20,000 $25,000 $30,000 $35,000 $40,000 $45,000 General EducationSpecial EducationELAverage All Students $17,211 $17,211 $17,211 $17,211 $20,044 $4,297 $4,263
FY 2024 Final Budget
Components of Cost per Pupil
Cost per Pupil: Components
percent increase compared to the prior fiscal year and a -1.5 percent decrease compared to FY 2020 Actual cost per pupil.
The third cylinder in the chart shows the cost of educating an EL student. The total cost of educating an EL student is $21,508, a 3.7 percent increase from the prior fiscal year and a 14.1 percent increase from FY 2020 Actual.
The fourth cylinder shows the average cost for all ACPS students. The average cost per student is expected to be $21,474 in FY 2024. This represents a 3.6 percent increase from the prior fiscal year and a 16.8 percent increase from the FY 2020 Actual cost per pupil.
ACPS Methodology
The ACPS methodology considers general operating funds and federal entitlement grants that support students in grades pre-kindergarten (PreK)-12 in relation to PreK-12 enrollment. Exclusions include the adult education and summer learning programs because these expenditures support programming for students not included in general K-12 enrollment, and the school nutrition program, which is a selfsufficient special revenue fund.
In addition, ACPS disaggregates the educational delivery cost for EL students and students with disabilities to illustrate the additional support provided to these special student groups. General education costs represent the services provided to all students, including classroom teachers, principals and other administrative personnel, and operational costs.
The ACPS cost per pupil formula includes the Virginia Preschool Initiative (VPI) grant expenditures and updates the special education transportation cost factor, which apportions a share of the transportation cost to special education based on the ratio of special education buses to standard school buses.
Please note that the methodology used by ACPS differs from the WABE methodology shown in the Information section.
Page 155 ACPS FY 2024 Proposed Budget Cost per Pupil
New Enrollment / Objects FY 2020 Actual FY 2021 Actual FY 2022 Final Budget FY 2023 Final Budget FY 2024 Proposed Budget Percent Change FY 2023 to FY 2024 Percent Change FY 2020 to FY 2024 General Education14,826 $ 15,574 $ 16,865 $ 16,587 $ 17,211 $ 3.7%16.1% Special Education37,837 38,548 40,799 36,273 37,255 2.4%-1.5% English Learner18,846 $ 19,745 $ 21,336 $ 20,723 $ 21,508 $ 3.7%14.1% Average All Students18,385 19,666 21,066 20,719 21,474 3.6%16.8%
Cost per Pupil: Trends
Trends
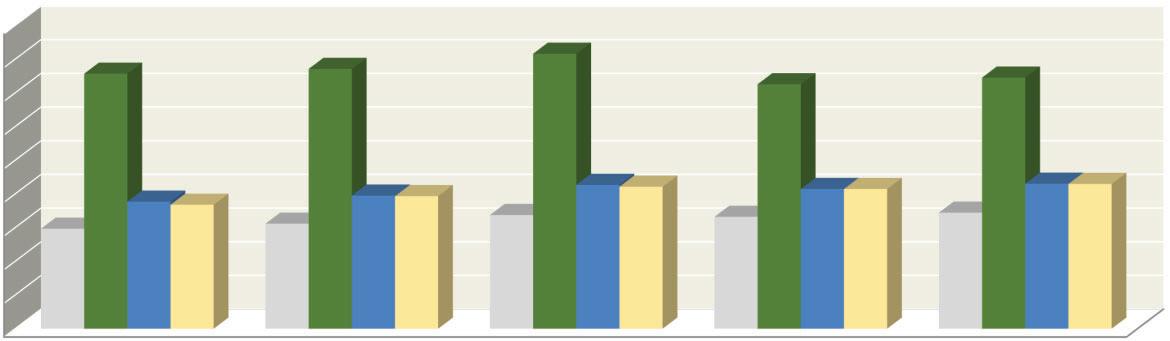
Page 156 ACPS FY 2024 Proposed Budget
per Pupil
Cost
$$5,000 $10,000 $15,000 $20,000 $25,000 $30,000 $35,000 $40,000 $45,000 FY 2020 Actual FY 2021 Actual FY 2022 Final Budget FY 2023 Final Budget FY 2024 Proposed Budget $14,826 $15,574 $16,865 $16,587 $17,211 $37,837 $38,548 $40,799 $36,273 $37,255 $18,846 $19,745 $21,336 $20,723 $21,508 $18,385 $19,666 $21,066 $20,719 $21,474
Actual
General Education Special Education English Learner Average All Students
in Cost per Pupil, FY 2020
-FY 2024 Proposed Budget
Page 157 ACPS FY 2024 Proposed Budget Cost per Pupil
This page intentionally left blank.
Overview, Schools, Departments


Section IV: Information Schools
✓ Schools Summary

✓ Elementary Schools Summary
✓ Middle Schools Summary
✓ High School Summary
✓ Alternative Education Summary


✓ School wide Resources


School Summary
School Overview:
ACPS has 12 elementary schools, one Pre-Kindergarten to grade 8 school, one Kindergarten to grade 8 school, one Early Childhood Center, two middle shools, and one high school. Additionally, ACPS provides flexible online learning through the Alexandria City Satellite Program and Chance for Change Program. Enrollment is projected at 15,847, an increase of 203 students compared to the prior fiscal year. For details on enrollment please see the Information section of the Budget Book.
Effective FY 2022, Matthew Maury Elementary School and T.C. Williams High School were renamed to Naomi L. Brooks Elementary and Alexandria City High School, respectively. For reporting purposes, the new school names are not reflected in prior fiscal years budget and staffing data.
The following pages includes an elementary, middle, high, and alternative education summary, followed by the individual school or alternative education sections. Each school or alternative education section consist of the contact information, overview, staffing table, budget table, and performance table, if applicable.
Staffing Reports:
The staffing reports are shown by program, position title and funding source. Reports include four fiscal years of data, FY 2020, FY 2021, FY 2022, FY 2023 and FY 2024
Proposed Budgets, with the variance from FY 2023 to FY 2024 displayed in the last column. Major changes to staffing levels is described earlier in the section.
These reports are found on the individual school pages in this section of the budget book.
Budget Reports:
The tables on the individual school pages show the budget summary by program group by character, or major expenditure category. The reports show the FY 2020 and FY 2021 Actual expenditures, FY 2022/FY 2023 Final and FY 2024 Proposed Budgets and the variance from FY 2023 to FY 2024.
The budget reports includes six character categories as explained below.
• Salaries: All compensation for the direct labor of persons in the employment of the local government. This includes regular, intermittent, supplement and overtime pay.
• Benefits: Job related benefits provided to employees as part of their total compensation such as FICA, medicare, VRS, and hospital/medical plans.
• Purchased Services: Payment for services acquired from outside sources such as staff development, other professional services, professional temporary employees, and other printing and binding.
• Internal Services: Charges from one department of ACPS to another for items such as field trips and printing.
• Other Charges: Payments for other services such as travel, lease and rental, and dues/ association memberships.
• Materials and Supplies: Includes articles and commodities that are consumed or materially altered when used and minor equipment that is not capitalized such as instructional, office and paper supplies, textbooks, software/online charges, and other technology equipment.
The major changes in the school budgets include school allocation and staffing changes based on enrollment, other non-formula staffing changes and the reallocation of substitute Page 158
ACPS
FY 2024 Proposed Budget Elementary Schools
funding.
Performance Report:
The performance report shows the progress of schools in raising achievement and improving learning. The US Department of Education established target school quality indicators for reducing proficient gaps between low-performing and high-performing schools. In December, 2015, the Elementary and Secondary Act of 1965 (ESEA) was reauthorized, replacing the No Child Left Behind Act of 2001 (NCLB) with the Every Student Succeeds Act (ESSA). The revised state requirements for schools to meet accreditation and for students to graduate took effect in FY 2019.
The report includes the targeted school quality indicator, if the school has met the AMO target, the accreditation status, SOL pass percentages and PALS pass percentages (for elementary schools) for reading and mathematics.
School Improvement Plans:
School Improvement Plans (formerly School Education Plans) are required by ACPS to be submitted by each school. For each school, there is a SMART (Specific, Measurable, Aggressive and Achievable, ResultsDriven, Time-Bound) goal in the areas of math, reading, science, and the teaching, empowering, leading and learning (TELL) survey. Following the SMART goal are the school goal and strategy. The final column is a reference to the ACPS 2025: Equity for All.
The Department Improvement Plans and School Improvement Plans are currently being revised and updated according to the new ACPS Strategic Plan, ACPS 2025: Equity for All
School’s individual Student Improvement Plans can be found in the supporting documents package on the Budget webpage https://www. acps.k12.va.us/budget.
Page 159 ACPS FY 2024 Proposed Budget Elementary Schools
School Summary
Elementary Schools Summary
Elementary Schools Overview:
ACPS has 12 elementary schools, one Pre-Kindergarten to grade 8 school, one Kindergarten to grade 8 school, and one Early Childhood Center. Across the division, elementary school enrollment is projected to
increase by 0.6 percent to a total of 8,703, which includes 211 students in JeffersonHouston grades 6-8 and 211 students in Patrick Henry grades 6-8 for FY 2024. Major programs can be seen in the table below.
School Name Principal Address and Contact
Charles Barrett Elementary School
Cora Kelly School for Math, Science & Technology
Loren Brody 1115 Martha Custis Drive
Alexandria, VA 22302
Tel: 703-824-6960
https://cb.acps.k12.va.us/
Jasibi Crews 3600 Commonwealth Avenue
Alexandria, VA 22305
Tel: 703-706-4420
https://ck.acps.k12.va.us/
Grades Served
Major Programs
Pre-K-Gr 5 Changing Education Through the Arts (CETA) Young Scholars Early Childhood Special Education
Pre-K-Gr 5 Math, Science & Technology Focus Young Scholars Title I School Early Childhood Special EducationAutism City-Wide Special Education Child & Family Network Center Head Start*
Douglas MacArthur Elementary School
Penny Hairston 4633 Taney Avenue
Alexandria, VA 22304
Tel: 703-619-8520
https://dm.acps.k12.va.us/
Early Childhood Center Heidi A. Haggerty Wagner 5651 Rayburn Avenue Alexandria, VA 22311
Tel: 703-578-6822
https://ecc.acps.k12.va.us/
Ferdinand T. Day Elementary School Rachael R. B. Dischner 1701 N. Beauregard Street Alexandria, VA 22311
George Mason Elementary School
https://ftd.acps.k12.va.us/
Dr. Seazante Williams Oliver 2601 Cameron Mills Road Alexandria, VA 22302
Tel: 703-706-4470
https://gm.acps.k12.va.us/
James K. Polk Elementary School Carla Price Carter 5000 Polk Avenue
Alexandria, VA 22304
Tel: 703-461-4180
https://jkp.acps.k12.va.us/
K-Gr 5 Responsive Classroom Young Scholars City-Wide Special Education
Pre-K Early Childhood Special Education Virginia PreSchool Initiative Head Start*
K-Gr 5 Science, Technology, Engineering and Math
Young Scholars
K-Gr 5 Science Focus Young Scholars
K-Gr 5 Young Scholars
City-Wide Special Education Program Title I School House System Girls On the Run Mentor Program for Students
Jefferson-Houston School Dr. John McCain 1501 Cameron Street
Alexandria, VA 22314
Tel: 703-706-4400
https://jh.acps.k12.va.us/
Pre-K-Gr 8 International Baccalaureate Young Scholars
Title I School - Priority School AVID
Early Childhood Special Education
City-Wide Special Education Virginia PreSchool Initiative Head Start*
Page 160
ACPS FY 2024 Proposed Budget Elementary Schools
Elementary Schools
John Adams Elementary School
Dr. Alicia Kingcade
Lyles-Crouch Traditional Academy
5651 Rayburn Avenue
Alexandria, VA 22311
Tel: 703-824-6970
https://ja.acps.k12.va.us/
Dr. Patricia Zissios 530 S. St. Asaph Street
Alexandria, VA 22314
Tel: 703-706-4430
https://lcta.acps.k12.va.us/
K-Gr 5 Dual Language Programs
Changing Education Through the Arts Young Scholars
Guided Language Acquisition Design (GLAD)
Title I School
City-Wide Special Education
K-Gr 5 Core Knowledge Young Scholars
Mount Vernon Community School Dr. Liza BurrellAldana
Naomi L. Brooks Elementary School
Suzanne Hess
2601 Commonwealth Avenue
Alexandria, VA 22305
Tel: 703-706-4460
https://mvcs.acps.k12.va.us/
600 Russell Road
Alexandria, VA 22301
Tel: 703-706-4440
https://nlb.acps.k12.va.us/
Patrick Henry School Dr. Ingrid Bynum 4643 Taney Avenue
Alexandria, VA 22304
Tel: 703-461-4170
https://ph.acps.k12.va.us/
Samuel W. Tucker Elementary School Adaarema Kelly 435 Ferdinand Day Drive
Alexandria, VA 22304
Tel: 703-933-6300
https://swt.acps.k12.va.us/
K-Gr 5 Dual Language Programs
Summer Language Academy
Young Scholars
City-Wide Special Education
K-Gr 5 Habits of Mind (HOM) Young Scholars
K-Gr 8 Discourse and Rigor Young Scholars
Title I School
City-Wide Special Education
K-Gr 5 Modified School Calendar
Young Scholars
Guided Language Acquisition Design (GLAD)
William Ramsay Elementary School Michael Routhouska
5700 Sanger Avenue
Alexandria, VA 22311
Tel: 703-824-6950
https://wr.acps.k12.va.us/
Pre-K-Gr 5 Guided Language Acquisition Design (GLAD)
Young Scholars
Title I School
City-Wide Special Education
Early Childhood Special Education
Virginia PreSchool Initiative
School Name Principal Address and Contact Grades Served Major Programs
Page 161 ACPS FY 2024 Proposed Budget Elementary Schools
* ACPS provides space and custodial services and supplies.
Elementary Schools
Enrollment and Demographics:
Elementary School enrollment for PreKindergarten through 5th grade was 7,832 as of September 30, 2022 and is projected to increase to 8,107. Pre-Kindergarten through 8th grade enrollment, which includes students in grades 6-8 at Jefferson-Houston and Patrick Henry Elementary Schools, is projected to increase to 8,521. Elementary schools across the division have experienced varying levels of change in enrollment over the past few years as displayed in the chart below.
For reporting purposes, Jefferson-Houston and Patrick Henry enrollment, staffing, and budget reports presented in this section includes grades 6 through 8.
With increasing enrollment, the number of students with additional needs continues to grow as well.
Significant numbers of English learner (EL) students attend ACPS schools, as displayed in the table below. In total, the number of EL students at the elementary level is projected to increase by 1.3 percent to a total of 3,521.
200 400 600 800 1,000 Total Enrollment Elementary Schools by Fiscal Year FY 2020 FY 2021 FY 2022 FY 2023 FY 2024 Projected
* Includes sixth-,seventh-, and eighth-grade students in the school's total enrollment.
100 200 300 400 500 600 English Learner Enrollment Elementary Schools by Fiscal Year FY 2020 FY 2021 FY 2022 FY 2023 FY 2024 Projected Page 162 ACPS FY 2024 Proposed Budget Elementary Schools
* Includes sixth-,seventh-, and eighth-grade students in the school's total enrollment.
Elementary Schools
* Includes sixth-,seventh-, and eighth-grade students in the school's total enrollment.
Additional information describing the EL program is located within the Information and Department sections of the budget book.
The trends of numbers of students requiring specialized instruction is shown by school in the table above.
In total, the number of students receiving specialized instruction at the elementary level is projected to increase by 2.5 percent, to a total of 1,033. For more information on Specialized Instruction, please refer to the Information and
Department sections of the budget book.
Many of the students in ACPS elementary schools come from families that are economically disadvantaged; this is reflected in the number of students qualifying for free and reduced-price meals, shown in the table below. Assuming that the proportion of students qualifying for free and reduced-price meals stays constant, the FY 2024 projected number of students meeting this criteria will increase to 4,519, which includes grades 6-8 at JeffersonHouston and Patrick Henry.
* Includes sixth-,seventh-, and eighth-grade students in the school's total enrollment.
20 40 60 80 100 120 140 160
FY 2020 FY 2021 FY 2022 FY 2023 FY 2024 Projected
Special Education Enrollment Elementary Schools by Fiscal Year
100 200 300 400 500 600 700 Free
Reduced-Price
Year FY 2020 FY 2021 FY 2022 FY 2023 FY 2024 Projected Page 163 ACPS FY 2024 Proposed Budget Elementary Schools
and
Meal Enrollment Elementary Schools by Fiscal
Elementary Schools
Staffing:
Elementary schools are staffed based on formulas for homeroom teachers, kindergarten instructional assistants (previously titled paraprofessionals), specialized instruction teachers and instructional assistants, English learner (EL) teachers, talented and gifted (TAG) education teachers, assistant principals, student improvement FTEs, and encore teachers such as art, vocal music, and physical education. The Information section of the budget book contains details on the formulas for each of these areas.
For FY 2024, staffing formulas were not applied to elementary positions. Staffing adjustments were based on enrollment discussions to reflect needs of the schools. Division-wide, operating funded staffing at elementary schools is projected to decrease by 2.00 FTEs.
Total Operating Funded homeroom K-5 teacher and K instructional assistant I staffing is adjusted at the following schools: Charles Barrett (-3.00 FTE); Cora Kelly (0.00 FTE); Douglas MacArthur (+1.00 FTE) ; Ferdinand T. Day (-1.00 FTE); George Mason (-2.00 FTE); James K. Polk (+1.00 FTE); Jefferson-Houston (-1.00 FTE); John Adams (+2.00 FTE); LylesCrouch (0.00 FTE); Naomi L. Brooks (+1.00 FTE); Mount Vernon (-1.00 FTE); Patrick Henry (-2.00 FTE); Samuel W. Tucker (0.00 FTE); and William Ramsay (+3.00 FTE). Total Operating Funded homeroom and k instructioanl assistant I staffing is decreased by 2.00 FTE position.
Encore positions will remain the same at 86.50 FTE for FY 2024, which generally includes art, vocal music, health and physical education, and library media.
Specialized Instruction: For FY 2024, staffing will remain at 168.00 FTE teacher and instructional assistant positions at the elementary schools. All elementary schools continue to have a base staffing ratio of three teachers and two instructional assistants. For details, please refer to Specialized Instruction in
the Information section.
English Learners: The EL methodology addresses staffing challenges at smaller elementary schools so it incorporates a tiered teacher allocation. In FY 2024 this will result in a total of 93.00 FTE EL positions at the elementary schools. For details, please refer to English Learners in the Information section.
Total Grant and Special Projects Funded positions are adjusted at the following schools: Charles Barrett (+ 1.00 FTE); Cora Kelly (0.00 FTE); Early Childhood Center (0.00 FTE); Ferdinand T. Day (+0.30 FTE); James K. Polk (0.00 FTE); Jefferson-Houston (+1.00 FTE); John Adams (0.00 FTE); Patrick Henry (0.00 FTE); Samuel Tucker (0.40 FTE); and William Ramsay (0.00 FTE). Total Grant and Special Projects Funded positions increase by 2.70 FTEs.
Budget:
Compensation and Benefits: Operating funded salaries for elementary schools are projected to increase to $88.92 million and benefits are projected to increase to $34.60 million. As noted in the Financials section of the budget book, the FY 2024 budget includes compensation enhancements for eligible employees.
The division-wide cost of employee benefits is projected to increase. Further information about these changes can be found in the Salary and Employee Benefits pages of the Financials section.
Non-Compensation: Operating funded noncompensation for elementary schools are projected to relatively remain flat for FY 2024.
Grant Support of Elementary Schools:
Elementary schools also receive funding through grants that supplement the operating funds. In addition to the grants listed below, schools may apply for competitive grants to
Page 164
ACPS FY 2024 Proposed Budget Elementary Schools
Elementary Schools
support specific programs.
Title I: Title I, Part A of the Elementary and Secondary Education Act (ESEA), as amended, provides financial assistance to local educational agencies (LEAs) and schools with high numbers or high percentages of children from low-income families to help ensure that all children meet challenging state academic standards. For FY 2024 Cora Kelly, Ferdinand T. Day, James K. Polk, Jefferson-Houston, John Adams, Patrick Henry, and William Ramsay will receive Title I funding. These funds will be used for school-based personnel and non-personnel such as instructional material and professional development. All items must supplement what is provided to all schools in the operating budget.
Early Intervention Reading Initiative: The Early Intervention Reading Initiative (EIRI) furnishes incentive funds for school divisions to provide identified students with additional reading instruction. Each elementary school receives these funds based on the number of students, grades K-3, who are identified through the Phonological Awareness Literacy Screening. These funds are used for tutoring or intervention materials.
Virginia Preschool Initiative: The Virginia Preschool Initiative (VPI) distributes state funds to schools and community-based organizations to provide quality preschool programs for at-risk four-year olds who are not served by Head Start. There are 16 VPI classrooms in ACPS, 9 housed at Early Childhood Center, 4 at Douglas MacAuther, 1 at Jefferson Houston, and 2 at William Ramsay. The VPI program provides funding per student and a transfer from the operating fund completes the funding for these classrooms.
Middle School Teachers Corps: JeffersonHouston will continue to receive $5,000 in State Funds to support mathematics.
Page 165 ACPS FY 2024 Proposed Budget Elementary Schools
Page 166 ACPS FY 2024 Proposed Budget Elementary Schools
This page intentionally left blank.
Charles Barrett
School Contact
Charles Barrett Elementary School (Grades PreK-5)
Loren Brody, Principal
1115 Martha Custis Drive
Alexandria, Virginia 22302
Tel: 703-824-6960 | Fax: 703-379-3782
loren.brody@acps.k12.va.us
https://cb.acps.k12.va.us/
Charles Barrett is an elementary school with a strong arts-integrated academic program, dedicated staff, committed local community, and a diverse student body. The staff of Charles Barrett provides a program of academic excellence, social-emotional learning, and equity. We are dedicated to a learning partnership with our students and their families and support systems. The following beliefs define our vision as well as our daily practices.
• We believe in preparing each student to thrive in our diverse and ever-changing world.
• We believe meaningful learning takes place in a positive, structured, nurturing, and childcentered environment.
• We believe our diversity enriches our learning environment and we value the opportunities that it brings.
• We believe collaboration among teachers, staff members, and caregivers is vital to achieving success in our school and community.
Exemplary Program:
The CETA program provides arts integrated professional learning opportunities to teachers and staff at Barrett. Students are taught to construct and demonstrate understanding through an art form. Students engage in a creative process that connects an art form and another subject area to meet objectives in both. Non-compensation and non-personnel support totals $22,125 for teacher substitute, professional development, travel - mileage, course and event fees, refreshments, instructional supplies, and audiovisual supplies. substitute, professional development, travelmileage, course and event fees, refreshments, instructional supplies, and audiovisual supplies.
Page 167 ACPS FY 2024 Proposed Budget Elementary Schools
Elementary Schools
Section Title Program Roll-Up Group Title Position Title FY 2020 Final FTE FY 2021 Final FTE FY 2022 Final FTE FY 2023 Final FTE FY 2024 Propose d FTE Change FY 2023 to FY2024 Charles Barrett ES Communications and Information Services ENCORE - MEDIA SPEC 1.00 1.30 1.00 1.00 - (1.00) LIBRARY MEDIA ASSIST 0.60 0.60 0.60 0.60 0.60LIBRARY/MEDIA SPECIALIST - - - - 1.00 1.00 Communications and Information Services Total 1.60 1.90 1.60 1.60 1.60EL EL TCHR 3.00 4.00 4.00 4.00 4.00ESSER II - EL TEACHER (CB) - - - - 1.00 1.00 EL Total 3.00 4.00 4.00 4.00 5.00 1.00 Enrichment and Electives ENCORE - ART TCHR 1.00 1.00 1.00 1.00 1.00ENCORE - MUSIC TCHR 1.00 1.00 1.00 1.00 1.00ENCORE - PE TCHR 2.60 2.50 2.00 2.00 2.00MUSIC TCHR-INSTR 0.50 0.50 1.00 1.00 1.00TAG TCHR 1.00 1.00 1.00 1.00 1.00Enrichment and Electives Total 6.10 6.00 6.00 6.00 6.00Instructional Core 1ST GRADE TCHR 5.00 4.00 4.00 4.00 4.002ND GRADE TCHR 4.00 4.00 4.00 4.00 4.003RD GRADE TCHR 3.00 4.00 4.00 4.00 4.004TH GRADE TCHR 4.00 4.00 3.00 4.00 3.00 (1.00) 5TH GRADE TCHR 3.00 4.00 3.00 3.00 3.00ACAD INTERVENTIONIST - - 4.00 0.50 0.50ACAD INTERVENTIONIST - STD IMPV - - - 3.50 3.50ACAD INTERVENTIONIST (MATH) - 1.00 - - -ACAD INTERVENTIONIST (READING) - 2.50 - - -ENCORE - MATH INTERVENTION TCHR - - 0.40 0.40 0.40RESOURCE TCHR 0.50 0.50 - - -S.I. - ACDMC INTRVNST MATH 1.00 - - - -S.I. - ACDMC INTRVNST RDNG 2.50 - - - -Instructional Core Total 23.00 24.00 22.40 23.40 22.40 (1.00) Kindergarten and PreKindergarten INST ASST I - 5.00 - - -INSTRUCTIONAL ASST - KINDERGARTEN - - 5.00 5.00 4.00 (1.00) INSTRUCTIONAL ASST I - - - - -KINDERGARTEN TCHR 5.00 5.00 5.00 5.00 4.00 (1.00) PARAPROFESSIONAL I 5.00 - - - -Kindergarten and Pre-Kindergarten Total 10.00 10.00 10.00 10.00 8.00 (2.00) Operations and Maintenance BUILDING ENGINEER I 1.00 1.00 1.00 1.00 1.00CUSTODIAN 2.00 2.00 2.00 2.00 2.00HEAD CUST I 1.00 1.00 1.00 1.00 1.00Operations and Maintenance Total 4.00 4.00 4.00 4.00 4.00School Administration ADMIN ASSISTANT I 2.00 2.00 2.00 2.00 2.00ASST PRINCIPAL 1.00 1.00 1.00 1.00 1.00PRINCIPAL-ELEMENTARY 1.00 1.00 1.00 1.00 1.00School Administration Total 4.00 4.00 4.00 4.00 4.00School Food Services CAFETERIA AIDE 0.75 0.75 0.75 0.75 0.75School Food Services Total 0.75 0.75 0.75 0.75 0.75Special Education INST ASST II - 2.00 - - -INST ASST II ECSE - 3.00 - - -INSTRUCTIONAL ASSISTANT II - - 2.00 2.00 2.00INSTRUCTIONAL ASST II - - - - -INSTRUCTIONAL ASST II - ECSE - - 3.00 3.00 3.00PARA II 3.00 - - - -PARA II ECSE 3.00 - - - -PARAPROFESSIONAL I 3.00 - - - -SPECIAL EDUCATION TCHR - - - - 4.00 4.00 SPED TCHR 4.00 4.00 4.00 4.00 - (4.00) SPED TCHR ECSE 6.00 6.00 6.00 6.00 6.00Special Education Total 19.00 15.00 15.00 15.00 15.00Page 168 ACPS FY 2024 Proposed Budget Elementary Schools
Charles Barrett ES Staffing
Elementary Schools
Section Title Program Roll-Up Group Title Position Title FY 2020 Final FTE FY 2021 Final FTE FY 2022 Final FTE FY 2023 Final FTE FY 2024 Propose d FTE Change FY 2023 to FY2024 Student Services COUNSELOR - (0.60) - - -PSYCHOLOGIST 1.00 1.00 1.00 1.00 1.00REGISTRAR I 1.00 1.00 1.00 1.00 1.00SCHOOL COUNSELOR 1.00 1.60 1.00 1.00 1.40 0.40 SCHOOL NURSE 1.00 1.00 1.00 1.00 1.00SOCIAL WORKER 1.00 1.00 1.00 1.00 1.00Student Services Total 5.00 5.00 5.00 5.00 5.40 0.40 Charles Barrett ES Total 76.45 74.65 72.75 73.75 72.15 (1.60) Grand Total 76.45 74.65 72.75 73.75 72.15 (1.60) Page 169 ACPS FY 2024 Proposed Budget Elementary Schools
Section Title Page 170 ACPS FY 2024 Proposed Budget Elementary Schools
Elementary Schools
Section Title Page 171 ACPS FY 2024 Proposed Budget Elementary Schools
Elementary Schools
Elementary Schools
Accreditation Benchmarks and School Status: Charles Barrett
Target School Quality Indicators for All Students*
*Schools must develop a multi-year plan for continuous improvement.
Accreditation statuses are based on the Standards of Learning (SOL) tests administered during the previous school year.
School Quality Indicators:
Level 1 = Meets or exceeds state standard or sufficient improvement
Level 2 = Near state standard or sufficient improvement
Level 3 = Below state standard
Too Small = Too few students in school or group to evaluate
Source: VDOE's School Accreditation Report.
Performance Data: Charles Barrett
Passing Across All Grade Levels (Federal)
Detailed SOL results are available on the Virginia Department of Education (VDOE) website.
Key: Yes-3YR = Met objective based on the three year average result.
Yes-R10 = Met objective by reducing failure rate by at least 10 percent.
Yes-MP = Maintain Progress: Current year pass rate equal to prior year’s pass rate, or stayed within 5%.
< = A group below state definition for personally identifiable results.
- = No data for group.
Source: VDOE's SOL Test Pass Rates and Other Results Report.
20192020 20202021 20212022 20222023 20232024
English Lvl 1 & 2 NA NA Lvl 1 & 2 TBD Mathematics Lvl 1 & 2 NA NA Lvl 1 & 2 TBD Accreditation Status Accredited Accreditation Waived Accreditation Waived Accredited TBD
20182019 20192020 20202021 20212022 20222023
of Students
English All Students 80 NA 61 67 TBD Asian Students 100 NA < < TBD White Students 92 NA 85 93 TBD Students with Disabilities 41 NA 33 35 TBD Economically Disadvantaged Students 54 NA 33 34 TBD Limited English Proficient Students 44 NA 17 26 TBD Gap Group 1 - Students with Disabilities, English Learners, Economically Disadvantaged Students (unduplicated) NA NA NA NA TBD Gap Group 2 - Black Students 58 NA 47 53 TBD Gap Group 3 - Hispanic Students 57 NA 35 33 TBD Mathematics All Students 82 NA 48 59 TBD Asian Students 100 NA < 60 TBD White Students 95 NA 76 90 TBD Students with Disabilities 44 NA 22 37 TBD Economically Disadvantaged Students 58 NA 13 25 TBD Limited English Proficient Students 49 NA 4 17 TBD Gap Group 1 - Students with Disabilities, English Learners, Economically Disadvantaged Students (unduplicated) NA NA NA NA TBD Gap Group 2 - Black Students 58 NA 26 35 TBD Gap Group 3 - Hispanic Students 60 NA 14 23 TBD PALS: Percent of Students Passing Kindergarten: Fall 84 78 59 64 TBD Kindergarten: Spring 85 NA 55 72 TBD Grade 1: Fall 90 74 75 52 TBD Grade 1: Spring 86 NA 55 53 TBD Grade 2: Fall 72 77 64 55 TBD Grade 2: Spring 63 NA 46 42 TBD
Student
SOL: Percent
Page 172 ACPS FY 2024 Proposed Budget Elementary Schools
Cora Kelly
School Contact
Cora
Jasibi Crews, Principal
3600 Commonwealth Avenue
Alexandria, Virginia 22305
Tel: 703-706-4420 | Fax: 703-706-4425
jasibi.crews@acps.k12.va.us
https://ck.acps.k12.va.us/
Cora Kelly Elementary School is a diverse learning community dedicated to educating all students for success in the 21st century with a focus on math, science, and technology. Its highly-qualified faculty and staff, in collaboration with parents and community partners, hold high expectations for every student in academic achievement and citizenship. Cora Kelly students are encouraged to be effective problem solvers and critical thinkers to prepare them to become leaders in the global community.
Exemplary Program:
The Science, Technology, and Math initiative prepares students for success in the 21st century and cultivates scientists, mathematicians, and engineers beginning at a young age by equipping them with strategies to think critically, solve problems, utilize higher-order thinking, and engage in cooperative learning and inquiry-based lessons. This program is supported by a 1.00 FTE math teacher as well as an updated STEM Lab that includes an outdoor habitat area. The STEM Lab has acquired Engineering is Elementary kit which encourage project-based learning and exploration. Our goal at CK this year is to build our STEM program by integrating it into our math and science curriculum. We updated our Digital Lab with a green screen as well as robotics equipment, coding activities, and a 3-D printer. The Digital Lab is supported by a part time Technology Integration Specialist. Non-compensation support totals $24,558.34. There is also $19,081 STEM instructional support that is grant funded.
AVID Elementary is a foundational component of the AVID College Readiness System and supports AVID’s mission and vision to provide a comprehensive model of success for all students, from elementary through higher education. The AVID Elementary (AE) model supports students as they become independent learners and is designed to promote WICOR (writing, inquiry, collaboration, organization, and reading) throughout the academic day. It also supports students as independent thinkers—thinking about thinking and learning, and about their own learning. Student success skills, organizational skills, and partnership development are all facets of the AVID School wide model. Like AVID Secondary, AVID Elementary Essentials focuses on the four necessary areas that ensure all students are poised for academic success: Instruction, Culture, Leadership, and Systems. Funding for this program is found in the AVID/ College Readiness budget for FY 2022.
Kelly Elementary School for Math, Science and Technology (Grades Pre-K-5)
Page 173
ACPS FY 2024 Proposed Budget Elementary Schools
Cora Kelly School Staffing
Elementary Schools
Section Title Program Roll-Up Group Title Position Title FY 2020 Final FTE FY 2021 Final FTE FY 2022 Final FTE FY 2023 Final FTE FY 2024 Propose d FTE Change FY 2023 to FY2024 Cora Kelly School Communications and Information Services ENCORE - MEDIA SPEC 1.00 1.00 1.00 1.00 - (1.00) LIBRARY MEDIA ASSIST 0.60 0.60 0.60 0.60 0.60LIBRARY/MEDIA SPECIALIST - - - - 1.00 1.00 Communications and Information Services Total 1.60 1.60 1.60 1.60 1.60EL EL TCHR 7.00 6.00 6.00 6.00 6.00EL Total 7.00 6.00 6.00 6.00 6.00Enrichment and Electives ENCORE - ART TCHR 1.00 1.00 1.00 1.00 1.00ENCORE - MUSIC TCHR 1.00 1.00 1.00 1.00 1.00ENCORE - PE TCHR 2.00 2.00 2.00 2.00 2.00MUSIC TCHR-INSTR 1.00 1.00 1.00 1.00 1.00TAG TCHR 1.00 1.00 1.00 1.00 1.00Enrichment and Electives Total 6.00 6.00 6.00 6.00 6.00Exemplary Programs S.I. - ACDMC INTRVNST MATH 0.50 - - - -S.I. - INSTRCL COACH - MATH 0.50 - - - -S.I. - INSTRCL COACH - STEM 0.50 - - - -Exemplary Programs Total 1.50 - - - -Improvement of Instruction INSTRUCTIONAL COACH - 1.50 1.50 - -INSTRUCTIONAL COACH - STD IMPV - - - 1.50 1.50INTERVENTIONIST 1.00 1.00 - - -STEM SPECIALIST - 0.50 0.50 0.50 0.50TITLE I - DATA COACH/INTERVENTION SPECIALIST - - - 1.00 1.00TITLE I - INTERVENTIONIST - - 1.00 - -Improvement of Instruction Total 1.00 3.00 3.00 3.00 3.00Instructional Core 1ST GRADE TCHR 3.00 3.00 2.00 2.00 2.002ND GRADE TCHR 3.00 3.00 2.00 2.00 2.003RD GRADE TCHR 2.00 2.00 2.00 2.00 2.004TH GRADE TCHR 2.00 2.00 2.00 2.00 2.005TH GRADE TCHR 3.00 2.00 2.00 2.00 2.00ACAD INTERVENTIONIST - 2.00 2.00 - -ACAD INTERVENTIONIST - STD IMPV - - - 2.00 2.00MATH TCHR 1.00 - - - -MATHEMATICS TCHR - 1.00 1.00 1.00 1.00READING TCHR 0.50 - - - -S.I. - ACDMC INTRVNST RDNG 1.00 - - - -S.I. - INSTR COACH - LITRCY 1.00 - - - -Instructional Core Total 16.50 15.00 13.00 13.00 13.00Kindergarten and Pre-Kindergarten INST ASST I - 3.00 - - -INSTRUCTIONAL ASST - KINDERGARTEN - - 3.00 3.00 3.00INSTRUCTIONAL ASST I - - - - -KINDERGARTEN TCHR 3.00 3.00 3.00 3.00 3.00PARAPROFESSIONAL I 3.00 - - - -Kindergarten and Pre-Kindergarten Total 6.00 6.00 6.00 6.00 6.00Partnerships, Family and Community Engagement FAMILY LIAISON - - - - 1.00 1.00 PARENT LIAISON - 0.50 1.00 1.00 - (1.00) SPPT SPEC/PARENT LIA 0.50 - - - -Partnerships, Family and Community Engagement Total 0.50 0.50 1.00 1.00 1.00School Administration ADMIN ASSISTANT I 1.00 1.00 1.00 1.00 1.00ASST PRINCIPAL 1.00 1.00 1.00 1.00 1.00PARENT LIAISON - 0.50 - - -PRINCIPAL-ELEMENTARY 1.00 1.00 1.00 1.00 1.00SPPT SPEC/PARENT LIA 0.50 - - - -School Administration Total 3.50 3.50 3.00 3.00 3.00School Food Services CAFETERIA AIDE 1.38 1.38 1.38 1.38 1.38 (0.00) School Food Services Total 1.38 1.38 1.38 1.38 1.38 (0.00) Special Education ECSE AUT TCHR - 1.00 1.00 1.00 1.00INST ASST II - 2.00 - - -INST ASST II AUT - 6.00 - - -INST ASST II ED - 6.00 - - -INSTRUCTIONAL ASSISTANT II - - 2.00 2.00 2.00INSTRUCTIONAL ASST II - AUTISM - - 6.00 6.00 6.00INSTRUCTIONAL ASST II - ED - - 6.00 6.00 6.00PARA II 2.00 - - - -PARA II AUT 6.00 - - - -PARA II ED 6.00 - - - -SPECIAL EDUCATION TCHR - - - - 3.00 3.00 Page 174 ACPS FY 2024 Proposed Budget Elementary Schools
Elementary Schools
Section Title Program Roll-Up Group Title Position Title FY 2020 Final FTE FY 2021 Final FTE FY 2022 Final FTE FY 2023 Final FTE FY 2024 Propose d FTE Change FY 2023 to FY2024 SPED TCHR 3.00 3.00 3.00 3.00 - (3.00) SPED TCHR - AUTISM - - - 2.00 2.00SPED TCHR AUT 3.00 2.00 2.00 - -SPED TCHR ED 3.00 3.00 3.00 3.00 2.00 (1.00) Special Education Total 23.00 23.00 23.00 23.00 22.00 (1.00) Student Services COUNSELOR - (0.50) - - -PSYCHOLOGIST 1.00 1.00 1.00 1.00 1.00REGISTRAR I 1.00 1.00 1.00 1.00 1.00SCHOOL COUNSELOR 1.00 1.50 1.00 1.00 1.00SCHOOL NURSE 1.00 1.00 1.00 1.00 1.00SOCIAL WORKER 1.00 1.00 1.00 1.00 1.00Student Services Total 5.00 5.00 5.00 5.00 5.00Cora Kelly School Total 72.98 70.98 68.98 68.98 67.98 (1.00) Grand Total 72.98 70.98 68.98 68.98 67.98 (1.00) Page 175 ACPS FY 2024 Proposed Budget Elementary Schools
Section Title Page 176 ACPS FY 2024 Proposed Budget Elementary Schools
Elementary Schools
Section Title Page 177 ACPS FY 2024 Proposed Budget Elementary Schools
Elementary Schools
Elementary Schools
Accreditation Benchmarks and School Status: Cora Kelly
for All Students*
*Schools must develop a multi-year plan for continuous improvement.
Accreditation statuses are based on the Standards of Learning (SOL) tests administered during the previous school year.
School Quality Indicators:
Level 1 = Meets or exceeds state standard or sufficient improvement
Level 2 = Near state standard or sufficient improvement
Level 3 = Below state standard
Too Small = Too few students in school or group to evaluate
Source: VDOE's School Accreditation Report. Student Performance Data: Cora Kelly
SOL: Percent
Students Passing Across All Grade Levels (Federal)
Detailed SOL results are available on the Virginia Department of Education (VDOE) website.
Key: Yes-3YR = Met objective based on the three year average result.
Yes-R10 = Met objective by reducing failure rate by at least 10 percent.
Yes-MP = Maintain Progress: Current year pass rate equal to prior year’s pass rate, or stayed within 5%.
< = A group below state definition for personally identifiable results.
- = No data for group.
Source: VDOE's SOL Test Pass Rates and Other Results Report.
20192020 20202021 20212022 20222023 20232024 Target School Quality Indicators
English Lvl 1 & 2 NA NA Lvl 1 & 2 TBD Mathematics Lvl 1 & 2 NA NA Lvl 1 & 2 TBD Accreditation Status Accredited Accreditation Waived Accreditation Waived Accredited TBD
20182019 20192020 20202021 20212022 20222023
English All Students 56 NA 34 47 TBD Asian Students NA NA < < TBD White Students 77 NA 73 87 TBD Students with Disabilities 23 NA 4 13 TBD Economically Disadvantaged Students 52 NA 26 40 TBD Limited English Proficient Students 41 NA 11 27 TBD Gap Group 1 - Students with Disabilities, English Learners, Economically Disadvantaged Students (unduplicated) NA NA NA NA TBD Gap Group 2 - Black Students 46 NA 33 56 TBD Gap Group 3 - Hispanic Students 57 NA 27 39 TBD Mathematics All Students 78 NA 22 46 TBD Asian Students NA NA < < TBD White Students 86 NA 71 80 TBD Students with Disabilities 37 NA 4 22 TBD Economically Disadvantaged Students 77 NA 15 43 TBD Limited English Proficient Students 73 NA 7 33 TBD Gap Group 1 - Students with Disabilities, English Learners, Economically Disadvantaged Students (unduplicated) NA NA NA NA TBD Gap Group 2 - Black Students 69 NA 20 41 TBD Gap Group 3 - Hispanic Students 80 NA 13 41 TBD PALS: Percent of Students Passing Kindergarten: Fall 54 48 46 32 TBD Kindergarten: Spring 65 NA 34 54 TBD Grade 1: Fall 52 52 54 44 TBD Grade 1: Spring 45 NA 34 45 TBD Grade 2: Fall 51 37 47 39 TBD Grade 2: Spring 55 NA 36 41 TBD
of
Page 178 ACPS FY 2024 Proposed Budget Elementary Schools
Page 179 ACPS FY 2024 Proposed Budget Elementary Schools
This page intentionally left blank.
Penny Hairston, Principal
4633 Taney Avenue
Alexandria, Virginia 22304
Tel: 703-619-8520 | Fax: 703-370-2719
penny.hairston@acps.k12.va.us
https://dm.acps.k12.va.us/
Douglas MacArthur Elementary School is a welcoming and inclusive community. The school community fosters academic achievement, respect, responsibility, and citizenship. Students are developing thinking and problem-solving skills that will lead to lifelong success. As a Responsive Classroom school each day begins with a morning meeting, designed to build a strong sense of community. Douglas MacArthur celebrates its increasingly diverse school community and works to build strong partnerships with each family. Our professional learning community includes highly trained staff that provides job-embedded learning through various coaching opportunities that supports student achievement and well-being. The school takes a multi-tiered approach to supporting students emotionally and academically with early interventions. Support programs include early reading and math intervention programs, extended-day learning, and the use of technology to enhance the learning experience and provide access to targeted skill development and targeted literacy instruction. Our mission is to eliminate race, class, gender, and ethnicity as predictors of success. “MacArthur Stars Shine Brightly” has everything to do with the school and surrounding community’s commitment to work together to improve student academic achievement, self-efficacy, motivation and resilience.
Exemplary Program:
Responsive Classroom (RC) is a research and evidence-based approach to education that leads to greater teacher effectiveness, higher student achievement, and improved school climate. RC has been recognized by the Collaborative for Academic, Social, and Emotional Learning (CASEL) as one of the most well-designed, evidence-based social and emotional learning programs supporting academic growth for all students.
Douglas MacArthur
Douglas MacArthur Elementary School (Grades K-5)
Page 180 ACPS FY 2024 Proposed Budget Elementary Schools
School Contact
Elementary Schools
Section Title Program Roll-Up Group Title Position Title FY 2020 Final FTE FY 2021 Final FTE FY 2022 Final FTE FY 2023 Final FTE FY 2024 Proposed FTE Change FY 2023 to FY2024 Douglas MacArthur ES Communications and Information Services ENCORE - - - - -ENCORE - MEDIA SPEC 1.00 1.00 1.00 1.00 - (1.00) LIBRARY MEDIA ASSIST 1.00 1.00 1.00 1.00 1.00LIBRARY MEDIA SPEC - - - - -LIBRARY/MEDIA SPECIALIST - - - - 1.00 1.00 Communications and Information Services Total 2.00 2.00 2.00 2.00 2.00EL EL TCHR 4.00 4.00 4.00 4.00 4.00EL Total 4.00 4.00 4.00 4.00 4.00Enrichment and Electives ART TCHR - - - - -ENCORE - - - - -ENCORE - ART TCHR 1.20 1.00 1.00 1.00 1.00ENCORE - FINE ART TCHR - 0.60 - - -ENCORE - FINE ARTS TCHR - - - - -ENCORE - MUSIC TCHR 1.20 - - - -ENCORE - PE TCHR 3.00 3.00 3.00 3.00 3.00MUSIC TCHR-INSTR 2.00 2.00 1.50 1.00 1.00MUSIC TCHR-VOCAL - - - 0.50 0.50PHYSICAL ED TCHR - - - - -TAG TCHR 2.00 2.00 2.00 2.00 2.00Enrichment and Electives Total 9.40 8.60 7.50 7.50 7.50Improvement of Instruction ACAD INTERVENTIONIST (READING) - 1.00 - - -INSTRUCTIONAL COACH - - - - -INTERVENTIONIST-DATA - - - - -S.I. - INSTRCL COACH - DATA 1.00 - - - -STUDENT IMPROVEMENT - - - - -Improvement of Instruction Total 1.00 1.00 - - -Instructional Core 1ST GRADE TCHR 6.00 5.00 4.00 4.00 5.00 1.00 2ND GRADE TCHR 5.00 5.00 4.00 4.00 4.003RD GRADE TCHR 4.00 4.00 4.00 4.00 4.004TH GRADE TCHR 5.00 4.00 4.00 4.00 4.005TH GRADE TCHR 5.00 5.00 4.00 4.00 4.00ACAD INTERVENTIONIST - - 2.00 0.50 0.50ACAD INTERVENTIONIST - STD IMPV - - - 1.50 2.50 1.00 ACAD INTERVENTIONIST (READING) - 0.50 - - -ACADEMIC INTERVENTIONIST - STD IMPV - - - 1.00 - (1.00) ENCORE - 0.00 - - -INSTRUCTIONAL COACH - - 1.00 - -INSTRUCTIONAL COACH - LITERACY - - 1.00 - -INSTRUCTIONAL COACH - LITERACY - STD IMPV - - - - -INSTRUCTIONAL COACH - STD IMPV - - - 1.00 1.00INSTRUCTIONAL COACH (MATH) - 1.00 - - -INSTRUCTIONAL COACH (READING) - 1.00 - - -READING TCHR - - - - -S.I. - ACDMC INTRVST 1.00 - - - -S.I. - ACDMC INTRVST - RDNG 1.50 - - - -STUDENT IMPROVEMENT - - - - -STUDENT IMPROVEMENT - - - - -STUDENT IMPROVEMENT (FLEX) - - - - -Instructional Core Total 27.50 25.50 24.00 24.00 25.00 1.00 Kindergarten and Pre-Kindergarten INST ASST I - 5.00 - - -INSTRUCTIONAL ASST - KINDERGARTEN - - 6.00 5.00 5.00INSTRUCTIONAL ASST I - - - - -KINDERGARTEN TCHR 6.00 5.00 6.00 5.00 5.00PARAPROFESSIONAL I 6.00 - - - -Kindergarten and Pre-Kindergarten Total 12.00 10.00 12.00 10.00 10.00Operations and Maintenance BUILDING ENGINEER I - - - - -CUSTODIAN - - - - -HEAD CUST I - - - - -Operations and Maintenance Total - - - - -Partnerships, Family and Community Engagement SUPPORT SPECIALIST I - - - - -Partnerships, Family and Community Engagement Total - - - - -School Administration ADMIN ASSISTANT I 1.00 1.00 1.00 1.00 1.00ASST PRINCIPAL 2.00 2.00 2.00 2.00 2.00PRINCIPAL-ELEMENTARY 1.00 1.00 1.00 1.00 1.00SUPPORT SPECIALIST I 1.00 1.00 1.00 1.00 1.00School Administration Total 5.00 5.00 5.00 5.00 5.00School Food Services CAFETERIA AIDE 1.88 1.50 1.50 1.50 1.50School Food Services Total 1.88 1.50 1.50 1.50 1.50Special Education INST ASST II - 2.00 - - -INSTRUCTIONAL ASSISTANT II - - 2.00 2.00 2.00INSTRUCTIONAL ASST II - - - - -INSTRUCTIONAL ASST II - AUTISM - - - 4.00 4.00INSTRUCTIONAL ASST II - AUTISM (FROM RESERVE #9212) ## - - - - -INSTRUCTIONAL ASST II - AUTISM (FROM RESERVE #9213) ## - - - - -Page 181 ACPS FY 2024 Proposed Budget Elementary Schools
Douglas MacArthur ES Staffing
Elementary Schools
Section Title Program Roll-Up Group Title Position Title FY 2020 Final FTE FY 2021 Final FTE FY 2022 Final FTE FY 2023 Final FTE FY 2024 Proposed FTE Change FY 2023 to FY2024 PARA II 2.00 - - - -PARAPROFESSIONAL II - - - - -SPECIAL ED TCHR - - - - -SPECIAL EDUCATION TCHR - - - - 4.00 4.00 SPED TCHR 4.00 4.00 4.00 4.00 - (4.00) SPED TCHR - AUTISM - - - 2.00 2.00SPED TCHR - AUTISM (FROM RESERVE #9211) ## - - - - -Special Education Total 6.00 6.00 6.00 12.00 12.00Student Services CLINIC ASSISTANT 0.40 0.40 0.40 0.40 0.40COUNSELOR - (0.60) - - -ENCORE - - - - -ENCORE - SCHOOL COUNSELOR - - 0.20 0.60 - (0.60) ENCORE - TBD (was COUNSELOR) - - - - 0.60 0.60 PSYCHOLOGIST 1.00 1.00 1.00 1.00 1.00REGISTRAR I 1.00 1.00 1.00 1.00 1.00SCHOOL COUNSELOR 1.40 2.00 1.40 1.40 1.60 0.20 SCHOOL NURSE 1.00 1.00 1.00 1.00 1.00SOCIAL WORKER 1.00 1.00 1.00 1.00 1.00Student Services Total 5.80 5.80 6.00 6.40 6.60 0.20 Douglas MacArthur ES Total 74.58 69.40 68.00 72.40 73.60 1.20 Grand Total 74.58 69.40 68.00 72.40 73.60 1.20 Page 182
ACPS FY 2024 Proposed Budget Elementary Schools
Section Title Page 183 ACPS FY 2024 Proposed Budget Elementary Schools
Elementary Schools
Section Title Page 184 ACPS FY 2024 Proposed Budget Elementary Schools
Elementary Schools
Section Title Page 185 ACPS FY 2024 Proposed Budget Elementary Schools
Elementary Schools
Elementary Schools
Accreditation Benchmarks and School Status: Douglas MacArthur
for All Students*
*Schools must develop a multi-year plan for continuous improvement.
Accreditation statuses are based on the Standards of Learning (SOL) tests administered during the previous school year.
School Quality Indicators:
Level 1 = Meets or exceeds state standard or sufficient improvement
Level 2 = Near state standard or sufficient improvement
Level 3 = Below state standard
Too Small = Too few students in school or group to evaluate
Source: VDOE's School Accreditation Report. Student Performance Data: Douglas MacArthur
Passing Across All Grade Levels (Federal)
Detailed SOL results are available on the Virginia Department of Education (VDOE) website.
Key: Yes-3YR = Met objective based on the three year average result.
Yes-R10 = Met objective by reducing failure rate by at least 10 percent.
Yes-MP = Maintain Progress: Current year pass rate equal to prior year’s pass rate, or stayed within 5%.
< = A group below state definition for personally identifiable results.
- = No data for group.
Source: VDOE's SOL Test Pass Rates and Other Results Report.
20192020 20202021 20212022 20222023 20232024 Target
Quality Indicators
English Lvl 1 & 2 NA NA Lvl 1 & 2 TBD Mathematics Lvl 1 & 2 NA NA Lvl 1 & 2 TBD Accreditation Status Accredited Accreditation Waived Accreditation Waived Accredited TBD
School
20182019 20192020 20202021 20212022 20222023 SOL: Percent of Students
English All Students 72 NA 63 78 TBD Asian Students 77 NA 71 85 TBD White Students 93 NA 86 92 TBD Students with Disabilities 46 NA 20 19 TBD Economically Disadvantaged Students 41 NA 30 61 TBD Limited English Proficient Students 39 NA 17 51 TBD Gap Group 1 - Students with Disabilities, English Learners, Economically Disadvantaged Students (unduplicated) NA NA NA NA TBD Gap Group 2 - Black Students 34 NA 44 58 TBD Gap Group 3 - Hispanic Students 52 NA 25 65 TBD Mathematics All Students 76 NA 51 70 TBD Asian Students 77 NA 43 64 TBD White Students 92 NA 71 87 TBD Students with Disabilities 46 NA 10 15 TBD Economically Disadvantaged Students 54 NA 14 50 TBD Limited English Proficient Students 54 NA 11 36 TBD Gap Group 1 - Students with Disabilities, English Learners, Economically Disadvantaged Students (unduplicated) NA NA NA NA TBD Gap Group 2 - Black Students 43 NA 25 47 TBD Gap Group 3 - Hispanic Students 69 NA 25 55 TBD PALS: Percent of Students Passing Kindergarten: Fall 89 90 85 79 TBD Kindergarten: Spring 97 NA 81 82 TBD Grade 1: Fall 88 92 76 76 TBD Grade 1: Spring 73 NA 46 83 TBD Grade 2: Fall 81 79 78 54 TBD Grade 2: Spring 76 NA 66 63 TBD
Page 186 ACPS FY 2024 Proposed Budget Elementary Schools
Page 187 ACPS FY 2024 Proposed Budget Elementary Schools
This page intentionally left blank.
Early Childhood Center
School Contact
Early Childhood Center (Grade Pre-K)
Heidi Haggerty Wagner, Principal
5651 Rayburn Avenue
Alexandria, Virginia 22311
Tel: 703-578-6822 | Fax: 703-379-4853
heidi.haggerty.wagner@acps.k12.va.us
https://ecc.acps.k12.va.us/

At Early Childhood Center (ECC), our children are the center of our instruction and we are committed to empowering children and inspiring them to be healthy, joyful learners who are compassionate citizens and stewards of the environment.
Early Childhood Center’s core values are relationships, equity, teamwork, inclusion, and empowerment. We love our children, welcome and affirm our families, and celebrate the rich diversity within our community. We educate the whole child within the context of our community and the natural world. We examine all practices to ensure equity and work to remove barriers to educational access. We embrace change and commit to continuous professional growth. We set ambitious goals and design instruction based on data, best practices, and research. We are all leaders in the work.
ECC houses 24 classrooms including 9 ACPS Virginia Preschool Initiative (VPI) classes, 6 Early Childhood Special Education classes and 1 Preschool Autism program, as well as 8 Campagna Head Start and VPI classes. This unique center brings together many Alexandria City early childhood stakeholders for collaboration and inclusive professional opportunities that foster student growth. The Early Childhood Special Education (ECSE) and Preschool Autism programs serve students ages 2-5, while VPI serves students who will enter kindergarten the following year, and Head Start serves 3-5 year olds. Family engagement is crucial to early childhood education and we connect with our families through home visits, family nights, principal’s coffees, and volunteer opportunities.
Page 188 ACPS FY 2024 Proposed Budget Elementary Schools
Elementary Schools
Section Title Program Roll-Up Group Title Position Title FY 2020 Final FTE FY 2021 Final FTE FY 2022 Final FTE FY 2023 Final FTE FY 2024 Proposed FTE Change FY 2023 to FY2024 Early Childhood Center Communications and Information Services ENCORE - LIBRARY MEDIA ASSIST - 0.10 - - -LIBRARY MEDIA ASSIST - - 0.50 0.50 0.50OVERSTAFF - LIB ASST - 0.50 - - -Communications and Information Services Total - 0.60 0.50 0.50 0.50Enrichment and Electives ENCORE - ART TCHR 0.50 0.50 0.50 0.50 0.50ENCORE - MUSIC TCHR 0.50 0.50 0.50 0.50 0.50ENCORE - PE TCHR 1.00 1.00 1.00 1.00 1.00Enrichment and Electives Total 2.00 2.00 2.00 2.00 2.00Kindergarten and PreKindergarten ADMIN ASSISTANT I 1.00 1.00 1.00 1.00 1.00ASST PRINCIPAL 0.50 1.00 1.00 1.00 1.00CAFETERIA AIDE 0.69 0.69 0.69 0.69 0.69INST ASST I - VPI - 9.00 - - -INSTRUCTIONAL ASST - VPI - - 9.00 9.00 9.00PARAPROFESSIONAL I 6.00 - - - -PRE-SCHOOL TCHR 6.00 9.00 9.00 9.00 9.00PRINCIPAL-PRESCHOOL 1.00 1.00 1.00 1.00 1.00REGISTRAR I 1.00 1.00 1.00 1.00 1.00SCHOOL NURSE 1.00 1.00 1.00 1.00 1.00SOCIAL WORKER 0.60 0.60 0.60 0.60 0.60Kindergarten and Pre-Kindergarten Total 17.79 24.29 24.29 24.29 24.29Special Education ECSE AUT TCHR - 1.00 1.00 1.00 1.00INST ASST II - ECSE AUT - 2.00 - - -INST ASST II ECSE - 5.00 - - -INSTRUCTIONAL ASST II - ECSE - - 3.00 3.00 3.00INSTRUCTIONAL ASST II - ECSE AUTISM - - 2.00 2.00 2.00PARA II AUT 2.00 - - - -PARA II ECSE 4.00 - - - -SPED TCHR AUT 1.00 - - - -SPED TCHR ECSE 8.00 8.00 6.00 6.00 6.00Special Education Total 15.00 16.00 12.00 12.00 12.00Early Childhood Center Total 34.79 42.89 38.79 38.79 38.79Grand Total 34.79 42.89 38.79 38.79 38.79Page 189 ACPS FY 2024 Proposed Budget Elementary Schools
Early Childhood Center Staffing
Section Title Page 190 ACPS FY 2024 Proposed Budget Elementary Schools
Elementary Schools
Page 191 ACPS FY 2024 Proposed Budget Elementary Schools
This page intentionally left blank.
Rachael Dischner, Principal
1701 North Beauregard Street
Alexandria, Virginia 22311
rachael.dischner@acps.k12.va.us
https://ftd.acps.k12.va.us/
Ferdinand T. Day Elementary
Ferdinand T. Day (FTD) is a neighborhood school that opened its doors for the first time in the 2018-2019 school year. FTD is a Title 1 school that serves a diverse population on the west end of Alexandria City. Most of our students speak a language other than English at home. There are more than 30 languages spoken by our families. To meet the needs of our diverse population, we incorporate Guided Language Acquisition Design (GLAD) strategies throughout all content areas. FTD embraces our greater community and helps students make meaningful connections between the diverse background, languages, cultures and experiences brought to our school. Staff support this by including students and families in building upon culturally rich knowledge and work towards supporting students as lifelong learners through a collaborative process. All families have the opportunity to engage in home visits with school staff. Staff engages and supports the whole child with a focus on every student’s social, emotional, and academic needs. Our students engage in daily morning meetings and cooperative learning structures within core instruction. Our professional learning community includes highly trained staff that provides job-embedded learning through various coaching opportunities that supports student achievement and well-being.
Exemplary Program:
Ferdinand T. Day Elementary School embraces pedagogy founded in STEM (Science, Technology, Engineering, and Mathematics) education. STEM education is a student-centered approach to teaching and learning that involves the intentional integration of rigorous content, processes, and skills such as critical thinking, creativity, collaboration, and innovation to solve relevant problems in both academic and real-world contexts. Current educational research is clear that an integrated, problem-based, and real-world approach to learning maximizes student engagement, authenticity, and purpose. Through performance tasks and culminating projects in a blended learning environment, students are engaged in regular hands-on scientific and mathematical investigations involving engineering-based scenarios and real-world problem solving. All FTD staff implement teaching the STEM framework with all students. The school also seeks partnerships with local area cutting-edge businesses to mentor students and present career options in the STEM field.
Operating funded non-compensation support totals $20,000 for STEM instructional supplies, plus an additional $20,000 funded through grant funding.
Ferdinand T. Day Elementary (Grades K-5)
Page 192
ACPS
FY 2024 Proposed Budget Elementary Schools
Day ES Staffing
Elementary Schools
Ferdinand
Section Title Program Roll-Up Group Title Position Title FY 2020 Final FTE FY 2021 Final FTE FY 2022 Final FTE FY 2023 Final FTE FY 2024 Proposed FTE Change FY 2023 to FY2024 Ferdinand T. Day ES Communications and Information Services ENCORE - MEDIA SPEC 1.00 1.00 1.00 1.00 - (1.00) ENCORE - MUSIC TCHR 1.00 - - - -LIBRARY MEDIA ASSIST 0.60 0.60 0.60 0.60 0.60LIBRARY/MEDIA SPECIALIST - - - - 1.00 1.00 Communications and Information Services Total 2.60 1.60 1.60 1.60 1.60EL EL TCHR 8.50 9.00 9.50 9.50 10.00 0.50 TITLE I - EL TEACHER - - - 0.50 - (0.50) TITLE I - TEACHER: EL CORE CONTENT - - 0.10 0.10 0.10EL Total 8.50 9.00 9.60 10.10 10.10Enrichment and Electives ENCORE - ART TCHR 1.00 1.00 1.00 1.00 1.00ENCORE - MUSIC TCHR - 1.00 1.00 1.00 1.00ENCORE - PE TCHR 1.00 2.00 2.00 2.00 2.00ENCORE Adjustment - - 0.40 - -MUSIC TCHR-INSTR 0.50 1.00 1.00 1.00 1.00S.I. - ACDMC INTRVNST 0.50 - - - -S.I. - ACDMC INTRVNST RDNG 1.00 - - - -TAG TCHR 1.30 1.30 1.30 1.00 1.00Enrichment and Electives Total 5.30 6.30 6.70 6.00 6.00Exemplary Programs S.I. - INSTRCL COACH - STEM 1.00 - - - -Exemplary Programs Total 1.00 - - - -Improvement of Instruction ENCORE - PE TCHR 1.00 - - - -INSTRCL COACH - MATH - STD IMPV - - - 0.50 0.50INSTRCOACH-MATH - 0.50 0.50 - -INSTRUCTIONAL COACH - 1.50 2.00 - -INSTRUCTIONAL COACH - STD IMPV - - - 2.00 2.00INSTRUCTIONAL COACH (MATH) - 0.50 - - -INSTRUCTIONAL COACH (STEM) - 1.00 - - -INTERVENTIONIST 0.50 0.50 0.50 0.50 - (0.50) S.I. - INSTRCL COACH 1.00 - - - -TITLE I - INSTRUCTIONAL COACH - - 1.00 1.00 1.00TITLE I - INSTRUCTIONAL COACH: MATH - - 0.50 0.50 1.00 0.50 Improvement of Instruction Total 2.50 4.00 4.50 4.50 4.50Instructional Core 1ST GRADE TCHR 4.00 5.00 5.00 4.00 5.00 1.00 2ND GRADE TCHR 5.00 4.00 4.00 5.00 4.00 (1.00) 3RD GRADE TCHR 3.00 4.00 4.00 4.00 5.00 1.00 4TH GRADE TCHR 4.00 3.00 5.00 4.00 4.005TH GRADE TCHR 2.00 3.00 3.00 4.00 4.00ACAD INTERVENTIONIST - - 1.00 - -ACAD INTERVENTIONIST - STD IMPV - - - 1.00 1.00ACAD INTERVENTIONIST (READING) - 1.00 - - -INSTRUCTIONAL COACH - 0.50 - - -INTERVENTIONIST - - - - 0.50 0.50 TITLE I - INTERVENTIONIST: READING - - - 0.30 - (0.30) TITLE I - READING SPECIALIST - - - - 0.50 0.50 Instructional Core Total 18.00 20.50 22.00 22.30 24.00 1.70 Kindergarten and Pre-Kindergarten INST ASST I - 5.00 - - -INSTRUCTIONAL ASST - KINDERGARTEN - - 6.00 6.00 5.00 (1.00) KINDERGARTEN TCHR 5.00 5.00 6.00 6.00 5.00 (1.00) PARAPROFESSIONAL I 5.00 - - - -Kindergarten and Pre-Kindergarten Total 10.00 10.00 12.00 12.00 10.00 (2.00) Operations and Maintenance BUILDING ENGINEER I 1.00 1.00 - - -BUILDING ENGINEER II - - 1.00 1.00 1.00Operations and Maintenance Total 1.00 1.00 1.00 1.00 1.00Partnerships, Family and Community Engagement FAMILY LIAISON - BILINGUAL - - - - 1.00 1.00 PARENT LIAISON-BILIN 1.00 1.00 1.00 1.00 - (1.00) Partnerships, Family and Community Engagement Total 1.00 1.00 1.00 1.00 1.00School Administration ADMIN ASSISTANT I 1.00 1.00 1.00 1.00 1.00ASST PRINCIPAL 1.00 1.00 1.00 1.00 1.00PRINCIPAL-ELEMENTARY 1.00 1.00 1.00 1.00 1.00SCH SECURITY OFFICER - 1.00 - - -SCHOOL SECURITY OFFICER - - 1.00 1.00 1.00SECURITY MONITOR 1.00 - - - -School Administration Total 4.00 4.00 4.00 4.00 4.00School Food Services CAFETERIA AIDE 1.38 1.38 1.38 1.38 1.38 (0.00) School Food Services Total 1.38 1.38 1.38 1.38 1.38 (0.00) Page 193 ACPS FY 2024 Proposed Budget Elementary Schools
T.
Elementary Schools
Section Title Program Roll-Up Group Title Position Title FY 2020 Final FTE FY 2021 Final FTE FY 2022 Final FTE FY 2023 Final FTE FY 2024 Proposed FTE Change FY 2023 to FY2024 Special Education INST ASST II - 3.00 - - -INSTRUCTIONAL ASSISTANT II - - 3.00 3.00 3.00PARA II 3.00 - - - -SPECIAL EDUCATION TCHR - - - - 3.00 3.00 SPED TCHR 3.00 3.00 3.00 3.00 - (3.00) Special Education Total 6.00 6.00 6.00 6.00 6.00Student Services COUNSELOR - (0.50) - - -PSYCHOLOGIST 1.00 1.00 1.00 1.00 1.00REGISTRAR I 1.00 1.00 1.00 1.00 1.00SCHOOL COUNSELOR 1.00 1.50 1.00 1.00 1.40 0.40 SCHOOL NURSE 1.00 1.00 1.00 1.00 1.00SOCIAL WORKER 1.00 1.00 1.00 1.00 1.00TITLE I - SCHOOL COUNSELOR - - 0.50 0.50 0.60 0.10 Student Services Total 5.00 5.00 5.50 5.50 6.00 0.50 Ferdinand T. Day ES Total 66.28 69.78 75.28 75.38 75.58 0.20 Grand Total 66.28 69.78 75.28 75.38 75.58 0.20 Page 194
ACPS FY 2024 Proposed Budget Elementary Schools
Section Title Page 195 ACPS FY 2024 Proposed Budget Elementary Schools
Elementary Schools
Section Title Page 196 ACPS FY 2024 Proposed Budget Elementary Schools
Elementary Schools
Elementary Schools
*Schools must develop a multi-year plan for continuous improvement.
Accreditation statuses are based on the Standards of Learning (SOL) tests administered during the previous school year.
School Quality Indicators:
Level 1 = Meets or exceeds state standard or sufficient improvement
Level 2 = Near state standard or sufficient improvement
Level 3 = Below state standard
Too Small = Too few students in school or group to evaluate
Report.
Detailed SOL results are available on the Virginia Department of Education (VDOE) website.
Key: Yes-3YR = Met objective based on the three year average result.
Yes-R10 = Met objective by reducing failure rate by at least 10 percent.
Yes-MP = Maintain Progress: Current year pass rate equal to prior year’s pass rate, or stayed within 5%.
< = A group below state definition for personally identifiable results.
- = No data for group.
Source: VDOE's SOL Test Pass Rates and Other Results Report.
Page 197 ACPS FY 2024 Proposed Budget Elementary Schools
Day 20192020 20202021 20212022 20222023 20232024 Target School Quality Indicators for All Students* English Lvl 1 & 2 NA NA Lvl 1 & 2 TBD Mathematics Lvl 1 & 2 NA NA Lvl 1 & 2 TBD Accreditation Status Accredited Accreditation Waived Accreditation Waived Accredited with Conditions TBD
Accreditation Benchmarks and School Status: Ferdinand T.
Student Performance Data: Ferdinand T. Day 20182019 20192020 20202021 20212022 20222023 SOL: Percent of Students Passing Across All Grade Levels (Federal) English All Students 51 NA 32 39 TBD Asian Students 54 NA < 31 TBD White Students 65 NA 32 71 TBD Students with Disabilities 10 NA 7 12 TBD Economically Disadvantaged Students 45 NA 31 34 TBD Limited English Proficient Students 34 NA 17 25 TBD Gap Group 1 - Students with Disabilities, English Learners, Economically Disadvantaged Students (unduplicated) NA NA NA NA TBD Gap Group 2 - Black Students 61 NA 42 51 TBD Gap Group 3 - Hispanic Students 37 NA 25 22 TBD Mathematics All Students 49 NA 19 25 TBD Asian Students 69 NA 33 30 TBD White Students 56 NA 23 44 TBD Students with Disabilities 10 NA 0 0 TBD Economically Disadvantaged Students 47 NA 19 20 TBD Limited English Proficient Students 39 NA 12 15 TBD Gap Group 1 - Students with Disabilities, English Learners, Economically Disadvantaged Students (unduplicated) NA NA NA NA TBD Gap Group 2 - Black Students 57 NA 24 35 TBD Gap Group 3 - Hispanic Students 33 NA 13 11 TBD PALS: Percent of Students Passing Kindergarten: Fall 76 67 NA 57 TBD Kindergarten: Spring 91 NA 52 80 TBD Grade 1: Fall 72 80 100 49 TBD Grade 1: Spring 62 NA 46 47 TBD Grade 2: Fall 58 60 65 48 TBD Grade 2: Spring 50 NA 46 46 TBD
Source: VDOE's School Accreditation
Page 198 ACPS FY 2024 Proposed Budget Elementary Schools
This page intentionally left blank.
George Mason
George Mason Elementary School (Grades K-5)
Dr. Seazante` Williams Oliver, Principal
2601 Cameron Mills Road
Alexandria, Virginia 22302
Tel: 703-706-4470 | Fax: 703-683-9011
seazante.oliver@acps.k12.va.us
https://gm.acps.k12.va.us/
George Mason Elementary School is dedicated to developing students’ love of learning, academic excellence, with respect and appreciation for the community’s diversity. To this end, it prepares learners to utilize knowledge and skills in a variety of contexts and for a variety of purposes. It seeks academic excellence for all students through a best-practices approach to teaching and learning with a focus on equity. The school provides experiences that foster academic, social, physical, and cognitive growth. It prepares competent learners who are self-directed, self-evaluative risk takers. George Mason provides a responsive, supportive, challenging, and nurturing environment, facilitating this growth in harmony with the home and greater community.
Exemplary Program:
With a science teacher funded through exemplary program funding, George Mason is able to provide students with a curriculum rich in hands-on science instruction and experimentation. This program is supported by two .5 FTE’s STEM teachers.
Page 199 ACPS FY 2024 Proposed Budget Elementary Schools
School Contact
Elementary Schools
ACPS FY 2024 Proposed Budget
Section Title Program Roll-Up Group Title Position Title FY 2020 Final FTE FY 2021 Final FTE FY 2022 Final FTE FY 2023 Final FTE FY 2024 Proposed FTE Change FY 2023 to FY2024 George Mason ES Communications and Information Services ENCORE - MEDIA SPEC 1.00 1.00 1.00 1.00 - (1.00) LIBRARY MEDIA ASSIST 0.60 0.60 0.60 0.60 0.60LIBRARY MEDIA SPEC - - - - -LIBRARY/MEDIA SPECIALIST - - - - 1.00 1.00 Communications and Information Services Total 1.60 1.60 1.60 1.60 1.60EL EL TCHR 4.00 4.00 3.00 3.00 3.00EL Total 4.00 4.00 3.00 3.00 3.00Enrichment and Electives ENCORE - ART TCHR 1.00 1.00 1.00 1.00 1.00ENCORE - MUSIC TCHR 1.00 1.00 1.00 1.00 1.00ENCORE - PE TCHR 2.00 2.00 2.00 2.00 2.00MUSIC TCHR-INSTR 1.50 1.60 1.60 1.60 1.60TAG TCHR 2.00 2.00 2.00 2.00 2.00Enrichment and Electives Total 7.50 7.60 7.60 7.60 7.60Improvement of Instruction ## OVERSTAFF POSITION: GM SCIENCE COACH - *ONE YEAR ONLY* - - - - -INSTRUCTIONAL COACH - 1.00 1.00 - -INSTRUCTIONAL COACH - STD IMPV - - - 1.00 1.00S.I. - ACDMC INTRVNST 1.00 - - - -S.I. - INSTRCL COACH 1.00 - - - -Improvement of Instruction Total 2.00 1.00 1.00 1.00 1.00Instructional Core 1ST GRADE TCHR 4.00 3.00 3.00 2.00 2.002ND GRADE TCHR 3.00 3.00 3.00 3.00 2.00 (1.00) 3RD GRADE TCHR 3.00 3.00 3.00 3.00 3.004TH GRADE TCHR 3.00 3.00 2.00 3.00 2.00 (1.00) 5TH GRADE TCHR 4.00 3.00 3.00 2.00 2.00ACAD INTERVENTIONIST - 0.50 2.00 - -ACAD INTERVENTIONIST - SCIENCE - - - 0.50 0.50ACAD INTERVENTIONIST - STD IMPV - - - 1.50 1.50ACAD INTERVENTIONIST (READING) - 1.00 - - -INSTRUCTIONAL COACH - 1.00 - - -INTERVENTIONIST - MATH - - 1.00 - -INTERVENTIONIST - MATH - STD IMPV - - - 1.00 1.00S.I. - ACDMC INTRVNST 1.00 - - - -S.I. - ACDMC INTRVNST STEM 0.50 - - - -SCIENCE TCHR 0.50 0.50 - - -Instructional Core Total 19.00 18.00 17.00 16.00 14.00 (2.00) Kindergarten and PreKindergarten INST ASST I - 4.00 - - -INSTRUCTIONAL ASST - KINDERGARTEN - - 4.00 3.00 3.00INSTRUCTIONAL ASST I - - - - -KINDERGARTEN TCHR 4.00 4.00 4.00 3.00 3.00PARAPROFESSIONAL I 4.00 - - - -Kindergarten and Pre-Kindergarten Total 8.00 8.00 8.00 6.00 6.00School Administration ADMIN ASSISTANT I 1.00 1.00 1.00 1.00 1.00ASST PRINCIPAL 1.00 1.00 1.00 1.00 1.00PRINCIPAL-ELEMENTARY 1.00 1.00 1.00 1.00 1.00School Administration Total 3.00 3.00 3.00 3.00 3.00School Food Services CAFETERIA AIDE 1.00 1.00 1.00 1.00 1.00 (0.00) School Food Services Total 1.00 1.00 1.00 1.00 1.00 (0.00) Special Education INST ASST II - 2.00 - - -INSTRUCTIONAL ASSISTANT II - - 2.00 2.00 2.00PARA II 2.00 - - - -SPECIAL EDUCATION TCHR - - - - 3.00 3.00 SPED TCHR 3.00 3.00 3.00 3.00 - (3.00) Special Education Total 5.00 5.00 5.00 5.00 5.00Student Services PSYCHOLOGIST 0.80 0.80 0.80 0.80 0.80REGISTRAR I 1.00 1.00 1.00 1.00 1.00SCHOOL COUNSELOR 1.20 1.20 1.20 1.20 1.20SCHOOL NURSE 1.00 1.00 1.00 1.00 1.00SOCIAL WORKER 1.00 1.00 1.00 1.00 1.00Student Services Total 5.00 5.00 5.00 5.00 5.00George Mason ES Total 56.10 54.20 52.20 49.20 47.20 (2.00) Grand Total 56.10 54.20 52.20 49.20 47.20 (2.00) Page 200
George Mason ES Staffing
Elementary Schools
Section Title Page 201 ACPS FY 2024 Proposed Budget Elementary Schools
Elementary Schools
Section Title Page 202 ACPS FY 2024 Proposed Budget Elementary Schools
Elementary Schools
Elementary Schools
Accreditation Benchmarks and School Status: George Mason
*Schools must develop a multi-year plan for continuous improvement.
Accreditation statuses are based on the Standards of Learning (SOL) tests administered during the previous school year.
School Quality Indicators:
Level 1 = Meets or exceeds state standard or sufficient improvement
Level 2 = Near state standard or sufficient improvement
Level 3 = Below state standard
Too Small = Too few students in school or group to evaluate
Source: VDOE's School Accreditation Report.
Student Performance Data: George Mason
SOL: Percent
Students Passing Across All Grade Levels (Federal)
Detailed SOL results are available on the Virginia Department of Education (VDOE) website.
Key: Yes-3YR = Met objective based on the three year average result.
Yes-R10 = Met objective by reducing failure rate by at least 10 percent.
Yes-MP = Maintain Progress: Current year pass rate equal to prior year’s pass rate, or stayed within 5%.
< = A group below state definition for personally identifiable results.
- = No data for group.
Source: VDOE's SOL Test Pass Rates and Other Results Report.
20192020 20202021 20212022 20222023 20232024
English Lvl 1 & 2 NA NA Lvl 1 & 2 TBD Mathematics Lvl 1 & 2 NA NA Lvl 1 & 2 TBD Accreditation Status Accredited Accreditation Waived Accreditation Waived Accredited TBD
Target School Quality Indicators for All Students*
20182019 20192020 20202021 20212022 20222023
of
English All Students 71 NA 67 73 TBD Asian Students - NA < < TBD White Students 86 NA 85 98 TBD Students with Disabilities 14 NA 31 15 TBD Economically Disadvantaged Students 38 NA 18 30 TBD Limited English Proficient Students 23 NA 9 19 TBD Gap Group 1 - Students with Disabilities, English Learners, Economically Disadvantaged Students (unduplicated) NA NA NA NA TBD Gap Group 2 - Black Students 75 NA < 60 TBD Gap Group 3 - Hispanic Students 41 NA 26 32 TBD Mathematics All Students 79 NA 53 69 TBD Asian Students - NA < 40 TBD White Students 95 NA 69 94 TBD Students with Disabilities 39 NA 23 8 TBD Economically Disadvantaged Students 46 NA 13 21 TBD Limited English Proficient Students 38 NA 6 13 TBD Gap Group 1 - Students with Disabilities, English Learners, Economically Disadvantaged Students (unduplicated) NA NA NA NA TBD Gap Group 2 - Black Students 75 NA < 50 TBD Gap Group 3 - Hispanic Students 50 NA 17 28 TBD PALS: Percent of Students Passing Kindergarten: Fall 79 78 72 62 TBD Kindergarten: Spring 75 NA 57 65 TBD Grade 1: Fall 86 64 69 67 TBD Grade 1: Spring 84 NA 59 71 TBD Grade 2: Fall 88 76 62 60 TBD Grade 2: Spring 91 NA 61 74 TBD
Page 203 ACPS FY 2024 Proposed Budget Elementary Schools
James K. Polk
School Contact
James K. Polk Elementary School (Grades K-5)
Carla Price Carter, Principal
5000 Polk Avenue
Alexandria, Virginia 22304
Tel: 703-461-4180 | Fax: 703-751-8614
ccarter@acps.k12.va.us
https://jkp.acps.k12.va.us/
James K. Polk (JKP) Elementary School serves nearly 800 students in grades K-5 and is proud of its widely-diverse student community. Our student enrollment has increased annually, which has resulted in an increase in our English Language (EL) and special education populations. The dedicated staff of JKP continues to embrace equity of all, researchedbased instructional practices to support student achievement, a positive school climate, and the positive impact inclusive classrooms and co-teaching models have on our students. We see this commitment to inclusion as we find creative ways to integrate students in our 3 citywide self-contained classes into the general education setting. JKP also has 9 National Board-Certified teachers and has consistently had anywhere from 2 to 4 teachers pursue this certification annually. We pride ourselves on building strong teacher leaders who support our climate of shared leadership and decision making.
JKP is entering its seventh year of Title I status. With the added resources that come along with Title 1, it is our goal to strengthen and enrich the academic program by: extending the school day through increased afterschool tutoring; embedding reading and/or mathematics curricula into other instructional areas; using technology to enhance the learning experience and provide access to targeted skill development; providing additional staff for reading remediation; and, increasing science and math investigations with both students and their families.
Further, it is our goal to increase our student and family support services through Positive Behavioral Interventions and Supports (PBIS), an on-site full-time Parent Liaison, dental assistance through the Wellness on Wheels program (WOW Bus), and programs like EmpowHer and Space of Her Own (SOHO), all supporting students social and emotional development. We were also able to have our two cafeteria hostesses and support specialist extend their hours as Community Outreach Specialists to increase parent engagement and ensure that necessary resources get to our families.
JKP also prides itself on the strong sense of community that we have cultivated as our
Page 204 ACPS FY 2024 Proposed Budget Elementary Schools
Elementary Schools
school staff and PTA consistently work together for the betterment of the students. Over the years, the PTA has sponsored a variety of activities that engage the entire school community and ultimately result in valuable programs and resources that have improved our school. For a number of years, we have hosted phenomenal book fairs that have provided us with many resources such as much-needed Smart Boards and classroom libraries. Our award-winning Safe Routes to School Program with monthly Fitness Fridays is another example of the collaboration of our PE department and our parent liaison who are committed to finding ways to keep kids healthy and active. #PolkPride has everything to do with the school and surrounding community’s commitment to work together to improve student achievement.
Exemplary Program:
In the fall of 2002, the staff at JKP adopted a house system inspired by the Ron Clark Academy to encourage collaboration among students. JKP has started the house system to further the closeness of our small communities, as well as to add some fun to the academic atmosphere. Our house system aims to help students find a sense of belonging. It allows our students to build a community where they have ownership and leadership. Our houses also address a mindset of growth and modeling good character, with an additional focus on culture and diversity.
Students are sorted into houses by spinning the “house wheel.” Each of the 8 houses represent important character traits we desire to instill in our students. Throughout the year, students will have “house huddles” (meetings) and work together to gain Class Dojo points for their house. Each house has a house leader and co-house leader who are also staff members at JKP. The house leader and co-house leader work with other staff members in their house to plan house huddles and support students within their house.
Page 205 ACPS
Proposed Budget Elementary Schools
FY 2024
Elementary Schools
James K. Polk ES Staffing
Section Title Program Roll-Up Group Title Position Title FY 2020 Final FTE FY 2021 Final FTE FY 2022 Final FTE FY 2023 Final FTE FY 2024 Proposed FTE Change FY 2023 to FY2024 James K. Polk ES Communications and Information Services ENCORE - MEDIA SPEC 1.00 1.00 1.00 1.00 - (1.00) LIBRARY MEDIA ASSIST 1.00 1.00 1.00 1.00 1.00LIBRARY/MEDIA SPECIALIST - - - - 1.00 1.00 Communications and Information Services Total 2.00 2.00 2.00 2.00 2.00EL EL TCHR 9.00 10.00 10.00 10.00 10.00EL Total 9.00 10.00 10.00 10.00 10.00Enrichment and Electives ENCORE - ART TCHR 2.00 2.00 2.00 2.00 2.00ENCORE - MUSIC TCHR 1.50 1.20 1.00 1.00 1.00ENCORE - PE TCHR 2.70 3.00 3.00 3.00 3.00MUSIC TCHR-INSTR 1.00 1.00 1.50 1.50 1.50TAG TCHR 2.00 2.00 2.00 2.00 2.00Enrichment and Electives Total 9.20 9.20 9.50 9.50 9.50Improvement of Instruction ACAD INTERVENTIONIST (STEM) - 0.50 - - -INSTRUCTIONAL COACH - 0.60 2.00 - -INSTRUCTIONAL COACH - STD IMPV - - - 2.00 2.00INSTRUCTIONAL COACH (DATA) - 1.00 - - -INTERVENTIONIST 0.60 1.00 - - -S.I. - INSTRCL COACH - DATA 1.00 - - - -TITLE I - INSTRUCTIONAL COACH - - 1.00 1.00 1.00Improvement of Instruction Total 1.60 3.10 3.00 3.00 3.00Instructional Core 1ST GRADE TCHR 6.00 6.00 6.00 7.00 6.00 (1.00) 2ND GRADE TCHR 6.00 6.00 6.00 5.00 7.00 2.00 3RD GRADE TCHR 5.00 5.00 5.00 5.00 5.004TH GRADE TCHR 5.00 5.00 5.00 6.00 6.005TH GRADE TCHR 5.00 5.00 4.00 5.00 5.00ACAD INTERVENTIONIST - - 2.00 - -ACAD INTERVENTIONIST - STD IMPV - - - 2.00 2.00ACAD INTERVENTIONIST (READING) - 2.00 - - -PARA II 2.00 - - - -READING SPECIALIST - 1.00 - - -S.I. - ACDMC INTRVNST RDNG 2.00 - - - -S.I. - INSTR COACH - LITRCY 1.00 - - - -S.I. - SCHOOL COUNSELOR 0.50 - - - -TITLE I - READING SPECIALIST - - 1.00 1.00 1.00Instructional Core Total 32.50 30.00 29.00 31.00 32.00 1.00 Kindergarten and Pre-Kindergarten INST ASST I - 7.00 - - -INSTRUCTIONAL ASST - KINDERGARTEN - - 7.00 6.00 6.00INSTRUCTIONAL ASST I - - - - -KINDERGARTEN TCHR 6.00 7.00 7.00 6.00 6.00PARAPROFESSIONAL I 9.00 - - - -PRE-SCHOOL TCHR 3.00 - - - -Kindergarten and Pre-Kindergarten Total 18.00 14.00 14.00 12.00 12.00Operations and Maintenance BUILDING ENGINEER I 1.00 1.00 1.00 1.00 1.00CUSTODIAN 4.00 4.00 4.00 4.00 3.00 (1.00) HEAD CUST I 1.00 1.00 1.00 1.00 1.00HEAD CUST II 1.00 1.00 1.00 1.00 1.00Operations and Maintenance Total 7.00 7.00 7.00 7.00 6.00 (1.00) School Administration ADMIN ASSISTANT I 1.00 1.00 1.00 1.00 1.00ASST PRINCIPAL 2.00 2.00 2.00 2.00 2.00FAMILY LIAISON - - - - 1.00 1.00 PARENT LIAISON 1.00 1.00 1.00 1.00 - (1.00) PRINCIPAL-ELEMENTARY 1.00 1.00 1.00 1.00 1.00SUPPORT SPECIALIST I 1.00 1.00 1.00 1.00 1.00School Administration Total 6.00 6.00 6.00 6.00 6.00School Food Services CAFETERIA AIDE 1.38 1.38 1.38 1.38 1.38 (0.00) School Food Services Total 1.38 1.38 1.38 1.38 1.38 (0.00) Special Education INST ASST II - 2.00 - - -INST ASST II AUT - 6.00 - - -INSTRUCTIONAL ASSISTANT II - - 2.00 2.00 2.00INSTRUCTIONAL ASST II - AUTISM - - 6.00 6.00 6.00PARA II 2.00 - - - -Page 206 ACPS FY 2024 Proposed Budget Elementary Schools
Elementary Schools
Section Title Program Roll-Up Group Title Position Title FY 2020 Final FTE FY 2021 Final FTE FY 2022 Final FTE FY 2023 Final FTE FY 2024 Proposed FTE Change FY 2023 to FY2024 PARA II AUT 6.00 - - - -SPECIAL EDUCATION TCHR - - - - 4.00 4.00 SPED TCHR 5.00 4.00 4.00 4.00 - (4.00) SPED TCHR - AUTISM - - - 3.00 3.00SPED TCHR AUT 3.00 3.00 3.00 - -Special Education Total 16.00 15.00 15.00 15.00 15.00Student Services CLINIC ASSISTANT 0.40 0.40 0.40 0.40 0.40COUNSELOR - STD IMPV - - 0.50 0.50 0.50PSYCHOLOGIST 1.00 1.00 1.00 1.00 1.20 0.20 REGISTRAR I 1.00 1.00 1.00 1.00 1.00SCHOOL COUNSELOR 1.60 2.00 1.60 1.60 2.10 0.50 SCHOOL NURSE 1.00 1.00 1.00 1.00 1.00SOCIAL WORKER 1.00 1.00 1.00 1.00 1.00Student Services Total 6.00 6.40 6.50 6.50 7.20 0.70 James K. Polk ES Total 108.68 104.08 103.38 103.38 104.08 0.70 Grand Total 108.68 104.08 103.38 103.38 104.08 0.70 Page 207 ACPS FY 2024 Proposed Budget Elementary Schools
Section Title Page 208 ACPS FY 2024 Proposed Budget Elementary Schools
Elementary Schools
Section Title Page 209 ACPS FY 2024 Proposed Budget Elementary Schools
Elementary Schools
Elementary Schools
*Schools must develop a multi-year plan for continuous improvement.
Accreditation statuses are based on the Standards of Learning (SOL) tests administered during the previous school year.
School Quality Indicators:
Level 1 = Meets or exceeds state standard or sufficient improvement
Level 2 = Near state standard or sufficient improvement
Level 3 = Below state standard
Too Small = Too few students in school or group to evaluate
Source: VDOE's School Accreditation Report.
Detailed SOL results are available on the Virginia Department of Education (VDOE) website.
Key: Yes-3YR = Met objective based on the three year average result.
Yes-R10 = Met objective by reducing failure rate by at least 10 percent.
Yes-MP = Maintain Progress: Current year pass rate equal to prior year’s pass rate, or stayed within 5%.
< = A group below state definition for personally identifiable results.
- = No data for group.
Source: VDOE's SOL Test Pass Rates and Other Results Report.
20192020 20202021 20212022 20222023 20232024 Target School Quality Indicators for All Students* English Lvl 1 & 2 NA NA Lvl 1 & 2 TBD Mathematics Lvl 1 & 2 NA NA Lvl 1 & 2 TBD Accreditation Status Accredited Accreditation Waived Accreditation Waived Accredited TBD
Accreditation Benchmarks and School Status: James K. Polk
Student Performance Data:
Polk 20182019 20192020 20202021 20212022 20222023 SOL: Percent of Students Passing Across All Grade Levels (Federal) English All Students 67 NA 41 58 TBD Asian Students 68 NA 35 77 TBD White Students 84 NA 65 85 TBD Students with Disabilities 23 NA 19 15 TBD Economically Disadvantaged Students 59 NA 35 51 TBD Limited English Proficient Students 37 NA 16 41 TBD Gap Group 1 - Students with Disabilities, English Learners, Economically Disadvantaged Students (unduplicated) NA NA NA NA TBD Gap Group 2 - Black Students 69 NA 37 57 TBD Gap Group 3 - Hispanic Students 53 NA 29 38 TBD Mathematics All Students 79 NA 31 54 TBD Asian Students 82 NA 24 63 TBD White Students 90 NA 60 78 TBD Students with Disabilities 38 NA 19 21 TBD Economically Disadvantaged Students 73 NA 23 47 TBD Limited English Proficient Students 63 NA 15 35 TBD Gap Group 1 - Students with Disabilities, English Learners, Economically Disadvantaged Students (unduplicated) NA NA NA NA TBD Gap Group 2 - Black Students 77 NA 25 49 TBD Gap Group 3 - Hispanic Students 72 NA 17 37 TBD PALS: Percent of Students Passing Kindergarten: Fall 77 75 58 62 TBD Kindergarten: Spring 80 NA 47 73 TBD Grade 1: Fall 76 81 72 39 TBD Grade 1: Spring 63 NA 48 49 TBD Grade 2: Fall 72 66 57 53 TBD Grade 2: Spring 71 NA 57 62 TBD
James K.
Page 210 ACPS FY 2024 Proposed Budget Elementary Schools
Page 211 ACPS FY 2024 Proposed Budget Elementary Schools
This page intentionally left blank.
Jefferson-Houston School Contact
Jefferson-Houston School (Grades Pre-K-8)
Dr. John McCain, Principal
1501 Cameron Street
Alexandria, Virginia 22314
Tel: 703-706-4400 | Fax: 703-836-7923
john.mccain@acps.k12.va.us
https://jh.acps.k12.va.us/
Jefferson-Houston institutes a culture of high expectations and rigorous instruction. It is the shared goal of administration and staff to encourage and support Jefferson-Houston students in seeking knowledge and becoming life-long learners.
Exemplary Program:
International Baccalaureate/Primary Years Programme (IB-PYP) is an internationally-recognized curriculum framework for children aged 3-12 years designed to promote the development of the children socially, emotionally, and academically. IB-PYP places major emphasis on inquiry-based teaching and learning, trandisciplinary lesson implementation, community service, real world applications, and character development.
International Baccalaureate/Middle Years Programme (IB-MYP) is a challenging framework that encourages students to make practical connections between their studies and the real world. The MYP curriculum framework comprises eight subject groups, incorporates holistic approaches to teaching and learning, and focuses on authentic assessments through inquiry-based instruction.
These programs are supported by a 1.00 FTE IB coordinator. This coordinator supports both the Primary Years and Middle Years Programmes. Non-compensation support totals $28,850 for the Primary Years Programme and $26,691 for the Middle Years Programme.
AVID Secondary Schoolwide model is a foundational component of the AVID College Readiness System and supports AVID’s mission and vision to provide a comprehensive model of success for all students, from elementary through higher education. The AVID Secondary model, which spans grades 6-12, includes a two-prong approach that supports students through the promotion of WICOR (writing, inquiry, collaboration, organization, and reading) across the entire campus. It also includes a selective elective course for students who have a desire to enroll in higher education. This course supports students’ rigorous course schedules by providing a tutorial component, (supported by college-age tutors), college knowledge curriculum, and college visits. The AVID Secondary model is a schoolwide model that changes the trajectory of an entire school campus by focusing on the four areas necessary to ensure all students are poised for academic success: Instruction, Culture, Leadership, and Systems. Funding for this program is found in the AVID/ College Readiness budget.
Page 212
ACPS FY 2024 Proposed Budget Elementary Schools
Jefferson-Houston School Staffing
Elementary Schools
Section Title Program Roll-Up Group Title Position Title FY 2020 Final FTE FY 2021 Final FTE FY 2022 Final FTE FY 2023 Final FTE FY 2024 Proposed FTE Change FY 2023 to FY2024 Jefferson-Houston School Alternative and At-Promise Education INSTRCOACH-IMPROVE 1.00 - - - -Alternative and At-Promise Education Total 1.00 - - - -Career and Technical Education CTE TCHR - - 1.00 1.00 - (1.00) CTE TECHNOLOGY TCHR - - - - 1.00 1.00 ENCORE - CTE TCHR 0.20 - - - -OVERSTAFF CTE TCHR - 1.00 - - -Career and Technical Education Total 0.20 1.00 1.00 1.00 1.00Communications and Information Services ENCORE - MEDIA SPEC 1.00 1.00 1.00 1.00 - (1.00) LIBRARY MEDIA ASSIST 1.00 1.00 1.00 1.00 1.00LIBRARY/MEDIA SPECIALIST - - - - 1.00 1.00 Communications and Information Services Total 2.00 2.00 2.00 2.00 2.00EL EL TCHR 4.00 4.00 4.00 4.00 4.00EL Total 4.00 4.00 4.00 4.00 4.00Enrichment and Electives ENCORE - ART TCHR 2.00 2.00 2.00 2.00 2.00ENCORE - DANCE TCHR - 0.60 0.60 - -ENCORE - INTERVENTIONIST: READING & MATH - - 0.40 0.40 0.40ENCORE - MUSIC TCHR 1.00 1.00 1.00 1.00 1.00ENCORE - PE TCHR 2.00 2.60 2.00 2.60 2.60MUSIC TCHR-INSTR 2.00 2.00 2.00 2.00 2.00TAG TCHR 1.00 1.00 1.00 1.00 1.00WORLD LANG TCHR-SPAN 2.00 3.00 3.00 3.00 3.00Enrichment and Electives Total 10.00 12.20 12.00 12.00 12.00Exemplary Programs AVID TCHR 0.50 0.50 - - 1.00 1.00 AVID TEACHER - - 1.00 1.00 - (1.00) COORD - IB/MYP/PYP - - 0.50 0.50 0.50COORD IB MYP/PYP 0.50 0.50 - - -INSTRUCTIONAL COACH - 0.50 0.50 - -INSTRUCTIONAL COACH - STD IMPV - - - 0.50 0.50S.I. - INSTRCL COACH 0.50 - - - -STUDENT IMPROVEMENT - - - - -Exemplary Programs Total 1.50 1.50 2.00 2.00 2.00Improvement of Instruction INSTRCOACH-IMPROVE - 1.00 - - -INSTRCOACH-LITERACY 1.00 1.00 - - -INSTRCOACH-MATH - 1.00 - - -INSTRUCTIONAL COACH - - 1.00 - -INSTRUCTIONAL COACH - STD IMPV - - - 1.00 1.00S.I. - INSTRCL COACH - DATA 1.00 - - - -TITLE I - INSTRUCTIONAL COACH: LITERACY - - 1.00 1.00 1.00TITLE I - INSTRUCTIONAL COACH: MATH - - 1.00 1.00 1.00TITLE I - INTERVENTIONIST: READING & MATH - - 0.40 - -Improvement of Instruction Total 2.00 3.00 3.40 3.00 3.00Instructional Core 1ST GRADE TCHR 4.00 3.00 3.00 3.00 3.002ND GRADE TCHR 3.00 3.00 3.00 3.00 3.003RD GRADE TCHR 3.00 3.00 3.00 3.00 3.004TH GRADE TCHR 3.00 3.00 2.00 3.00 3.005TH GRADE TCHR 2.00 3.00 3.00 3.00 4.00 1.00 ACAD INTERVENTIONIST - 2.00 1.00 - -ACAD INTERVENTIONIST - STD IMPV - - - 1.00 1.00ENCORE - (0.00) - - -LANG ARTS TCHR 3.00 3.00 3.00 3.00 3.00MATH TCHR - 2.00 - - -MATHEMATICS TCHR 2.00 2.00 3.00 3.00 3.00READING TCHR - - - - -READING/MATH INTERVENTION TCHR - - 1.00 1.00 1.00S.I. - ACDMC INTRVNST RDNG 1.00 - - - -S.I. - MATH TCHR 1.00 - - - -SCIENCE TCHR 2.00 2.00 2.00 2.00 2.00SOCIAL STUDIES TCHR 2.00 2.00 2.00 2.00 2.00TITLE I - INSTRUCTIONAL ASST: INSTRUCTIONAL SUPPORT (ONE YEAR ONLY) - - - - 1.00 1.00 TITLE I - INTERVENTIONIST: READING & MATH - - - - -Instructional Core Total 26.00 28.00 26.00 27.00 29.00 2.00 Kindergarten and Pre-Kindergarten INST ASST I - 4.00 - - -INST ASST I - VPI - 1.00 - - -INSTRUCTIONAL ASST - KINDERGARTEN - - 4.00 4.00 3.00 (1.00) INSTRUCTIONAL ASST - VPI - - 1.00 1.00 1.00INSTRUCTIONAL ASST I - - - - -KINDERGARTEN TCHR 4.00 4.00 4.00 4.00 3.00 (1.00) PARAPROFESSIONAL I 5.00 - - - -PRE-SCHOOL TCHR 1.00 1.00 1.00 1.00 1.00Kindergarten and Pre-Kindergarten Total 10.00 10.00 10.00 10.00 8.00 (2.00) Operations and Maintenance BUILDING ENGINEER II 1.00 1.00 1.00 1.00 1.00Operations and Maintenance Total 1.00 1.00 1.00 1.00 1.00Partnerships, Family and Community Engagement FAMILY LIAISON - BILINGUAL - - - - 1.00 1.00 Page 213 ACPS FY 2024 Proposed Budget Elementary Schools
Elementary Schools
Elementary Schools
ACPS FY 2024 Proposed Budget
Section Title Program Roll-Up Group Title Position Title FY 2020 Final FTE FY 2021 Final FTE FY 2022 Final FTE FY 2023 Final FTE FY 2024 Proposed FTE Change FY 2023 to FY2024 PARENT LIAISON-BILIN 1.00 1.00 1.00 1.00 - (1.00) Partnerships, Family and Community Engagement Total 1.00 1.00 1.00 1.00 1.00School Administration ACADEMIC PRINCIPAL 1.00 1.00 1.00 1.00 1.00ADMIN ASSISTANT I 2.00 2.00 2.00 2.00 2.00ASST PRINCIPAL 1.00 1.00 1.00 1.00 1.00DEAN OF STUDENTS - 1.00 1.00 1.00 1.00PRINCIPAL - PK-8 - - 1.00 1.00 1.00PRINCIPAL-ELEMENTARY 1.00 1.00 - - -SCH SECURITY OFFICER - 1.00 - - -SCHOOL SECURITY OFFICER - - 1.00 1.00 1.00School Administration Total 5.00 7.00 7.00 7.00 7.00School Food Services CAFETERIA AIDE 0.69 0.69 0.69 0.69 0.69 (0.00) School Food Services Total 0.69 0.69 0.69 0.69 0.69 (0.00) Special Education ACCOUNTABILITY SPECIALIST - - - 1.00 1.00INST ASST II - 3.00 - - -INST ASST II ECSE - 1.00 - - -INST ASST II MD - 4.00 - - -INSTRUCTIONAL ASSISTANT II - - 3.00 3.00 3.00INSTRUCTIONAL ASST II - - - - -INSTRUCTIONAL ASST II - ECSE - - 1.00 1.00 1.00INSTRUCTIONAL ASST II - MD - - 4.00 4.00 4.00PARA II 3.00 - - - -PARA II ECSE 1.00 - - - -PARA II MD 4.00 - - - -SPECIAL EDUCATION TCHR - - - - 7.00 7.00 SPED EARLY CHLD TCHR - - - - -SPED TCHR 6.00 7.00 7.00 7.00 - (7.00) SPED TCHR ECSE 2.00 2.00 2.00 2.00 2.00SPED TCHR MD 2.00 2.00 2.00 2.00 2.00Special Education Total 18.00 19.00 19.00 20.00 20.00Student Services PSYCHOLOGIST 1.00 1.00 1.00 1.00 1.00REGISTRAR I 1.00 1.00 1.00 1.00 1.00SCHOOL COUNSELOR 1.60 2.00 2.00 2.00 2.00SCHOOL NURSE 1.00 1.00 1.00 1.00 1.00SOCIAL WORKER 1.00 1.00 1.00 1.00 1.00Student Services Total 5.60 6.00 6.00 6.00 6.00Jefferson-Houston School Total 87.99 96.39 95.09 96.69 96.69Grand Total 87.99 96.39 95.09 96.69 96.69Page 214
Section Title Page 215 ACPS FY 2024 Proposed Budget Elementary Schools
Elementary Schools
Section Title Page 216 ACPS FY 2024 Proposed Budget Elementary Schools
Elementary Schools
Section Title Page 217 ACPS FY 2024 Proposed Budget Elementary Schools
Elementary Schools
Elementary Schools
Accreditation Benchmarks and School Status: Jefferson-Houston
*Schools must develop a multi-year plan for continuous improvement.
Accreditation statuses are based on the Standards of Learning (SOL) tests administered during the previous school year.
School Quality Indicators:
Level 1 = Meets or exceeds state standard or sufficient improvement
Level 2 = Near state standard or sufficient improvement
Level 3 = Below state standard
Too Small = Too few students in school or group to evaluate
Source: VDOE's School Accreditation Report.
Detailed SOL results are available on the Virginia Department of Education (VDOE) website.
Key: Yes-3YR = Met objective based on the three year average result.
Yes-R10 = Met objective by reducing failure rate by at least 10 percent.
Yes-MP = Maintain Progress: Current year pass rate equal to prior year’s pass rate, or stayed within 5%.
No-A = Did not meet benchmark but is within the narrow margin.
No-W = Did not meet benchmark or criteria for narrow margin or improvement.
< = A group below state definition for personally identifiable results.
- = No data for group.
Source: VDOE's SOL Test Pass Rates and Other Results Report.
20192020 20202021 20212022 20222023 20232024 Target School Quality Indicators
English Lvl 1 & 2 NA NA Lvl 1 & 2 TBD Mathematics Lvl 1 & 2 NA NA Lvl 1 & 2 TBD Accreditation Status Accredited Accreditation Waived Accreditation Waived Accredited with Conditions TBD
for All Students*
Student Performance Data: Jefferson-Houston 20182019 20192020 20202021 20212022 20222023 SOL: Percent of Students Passing Across All Grade Levels (Federal) English All Students 61 NA 44 46 TBD Asian Students 57 NA < 75 TBD White Students 89 NA 86 76 TBD Students with Disabilities 28 NA 31 22 TBD Economically Disadvantaged Students 51 NA 31 36 TBD Limited English Proficient Students 29 NA 15 28 TBD Gap Group 1 - Students with Disabilities, English Learners, Economically Disadvantaged Students (unduplicated) NA NA NA NA TBD Gap Group 2 - Black Students 49 NA 29 32 TBD Gap Group 3 - Hispanic Students 62 NA 40 50 TBD Mathematics All Students 59 NA 23 33 TBD Asian Students 57 NA 20 54 TBD White Students 80 NA 39 64 TBD Students with Disabilities 30 NA 21 15 TBD Economically Disadvantaged Students 53 NA 13 23 TBD Limited English Proficient Students 44 NA 8 20 TBD Gap Group 1 - Students with Disabilities, English Learners, Economically Disadvantaged Students (unduplicated) NA NA NA NA TBD Gap Group 2 - Black Students 50 NA 18 20 TBD Gap Group 3 - Hispanic Students 59 NA 14 36 TBD PALS: Percent of Students Passing Kindergarten: Fall 81 75 77 77 TBD Kindergarten: Spring 75 NA 48 68 TBD Grade 1: Fall 86 74 67 54 TBD Grade 1: Spring 78 NA 56 53 TBD Grade 2: Fall 79 68 61 37 TBD Grade 2: Spring 70 NA 55 51 TBD
Page 218 ACPS FY 2024 Proposed Budget Elementary Schools
Dr. Alicia Kingcade, Principal
5651 Rayburn Avenue
Alexandria, Virginia 22311
Tel: 703-824-6970 | Fax: 703-379-4853
alicia.kingcade@acps.k12.va.us
https://ja.acps.k12.va.us/
John Adams Elementary School is a Changing Education Through the Arts (CETA) school. This partnership is in association with the John F. Kennedy Center for the Performing Arts. John Adams also offers a two-way immersion Dual Language Program.
Exemplary Program:
The CETA program provides arts-integrated, professional learning opportunities to teachers and staff at John Adams so that they can teach students to construct and demonstrate understanding through an art form. This site has focused on Tableau, Tableau II, and Reading Art Across the Curriculum in recent years. Students engage in a creative process that connects an art form and another subject area, meeting evolving objectives in both. This program is supported by a 0.50 FTE CETA coordinator.
In recent years, John Adams Elementary teachers have participated in “Reading Art Across the Curriculum.” This year, many teachers are building on their previous experience with reading art by participating in coursework called, “I See A Feeling” which connects reading art to social emotional learning about characters and feelings. Visual art is a text that students of all reading abilities can access. This original workshop introduced the language of visual art so that teachers would feel confident looking, thinking, and talking about art with their students. Teachers this school year are going a step further, learning how to read artwork from picture books as a window into characters’ emotions and feelings. Last year, many teachers participated in refresher workshop series aimed at transferring the approaches learned in previous arts integration courses to the virtual setting and learning about technology tools and programs to support this transition. Teachers will also continue to build a library of images, including primary sources that can be used to efficiently build background knowledge, teach content, generate points of inquiry for research, and assess understandings in social studies, science, and reading. Educators will continue to participate in a variety of other arts integration workshops. Non-compensation and non-personnel support totals $31,684 for teacher substitute, professional development, course and event fees and instructional supplies.
The John Adams Dual Language program provides an immersion program in English and
John Adams
John Adams Elementary School (Grades K-5)
Page 219 ACPS FY 2024 Proposed Budget Elementary Schools
School Contact
John Adams
Spanish. The aim of this program is to promote “bilingualism, biliteracy and biculturalism” for all students. John Adams Elementary school offers the 70/30 model in Kindergarten and First grade and a 50/50 model in grades 2-5. In the 70/30 model, students receive most core subjects (Math, Science, Social Studies and Language Arts) in Spanish, while English Language Arts and Encore are taught in English. In the 50/50 model, Science and Math are taught during the Spanish half day, while Social Studies, English Language Arts and Encore subjects are taught in English. ACPS provides funds to support the program with 10-full time elementary dual language teachers, 2-full time paraprofessionals, and 1-fulltime dual language instructional coach with noncompensation support for a total of $4,946.
Page 220 ACPS FY 2024 Proposed Budget Elementary Schools
John Adams ES Staffing
Elementary Schools
Section Title Program Roll-Up Group Title Position Title FY 2020 Final FTE FY 2021 Final FTE FY 2022 Final FTE FY 2023 Final FTE FY 2024 Proposed FTE Change FY 2023 to FY2024 John Adams ES Alternative and At-Promise Education SCHOOL IMPROVE COACH 1.00 1.00 - - -TITLE I - INTERVENTIONIST - MTSS TIERED SUPPORTS - - - - 1.00 1.00 TITLE I - SCHOOL IMPROVEMENT COACH - - 1.00 - -Alternative and At-Promise Education Total 1.00 1.00 1.00 - 1.00 1.00 Communications and Information Services ENCORE - MEDIA ASST - - - - -ENCORE - MEDIA SPEC 1.00 1.00 1.00 1.00 - (1.00) LIBRARY MEDIA ASSIST 1.00 1.00 1.00 1.00 1.00LIBRARY/MEDIA SPECIALIST - - - - 1.00 1.00 Communications and Information Services Total 2.00 2.00 2.00 2.00 2.00EL COORD - DUAL LANG - - 0.50 - -DUAL LANG COORD 0.50 0.50 - - -EL TCHR 11.50 11.00 11.00 11.00 11.00INSTRUCTIONAL COACH - DL - - - 1.00 - (1.00) INSTRUCTIONAL COACH - EL - - 1.00 - -LIT LANG ACQ SPEC 1.00 - - - -READING SPECIALIST - 1.00 - - -EL Total 13.00 12.50 12.50 12.00 11.00 (1.00) Enrichment and Electives ENCORE - ART TCHR 1.00 1.50 1.20 1.20 1.50 0.30 ENCORE - ART TCHR *OVERSTAFF* - - - - -ENCORE - MUSIC TCHR 1.40 1.00 1.00 1.00 1.00ENCORE - PE TCHR 3.00 3.00 3.00 3.00 2.70 (0.30) INSTRUCTIONAL COACH - DL - - - - 1.00 1.00 MUSIC TCHR-INSTR 1.00 1.00 1.00 1.00 1.00S.I. - ACDMC INTRVNST RDNG 1.00 - - - -TAG TCHR 1.00 1.00 1.00 1.00 1.00Enrichment and Electives Total 8.40 7.50 7.20 7.20 8.20 1.00 Exemplary Programs COORD - CETA - - 0.50 0.50 0.50COORD CETA 0.50 0.50 - - -SCHOOL IMPRVMT COACH - - - - -Exemplary Programs Total 0.50 0.50 0.50 0.50 0.50Improvement of Instruction INSTRUCTIONAL COACH - 2.00 2.00 - -INSTRUCTIONAL COACH - STD IMPV - - - 2.00 2.00S.I. - ACDMC INTRVNST 0.50 - - - -S.I. - ACDMC INTRVNST RDNG 1.00 - - - -S.I. - INSTRCL COACH 1.00 - - - -S.I. - INSTRCL COACH - MATH 1.00 - - - -SPED ACCTABILITY SPC 1.00 1.00 - - -TITLE I - ACCOUNTABILITY SPECIALIST: SPED - - 1.00 1.00 - (1.00) TITLE I - SCHOOL IMPROVEMENT COACH/ SCIENCE SPEC - - - 1.00 - (1.00) Improvement of Instruction Total 4.50 3.00 3.00 4.00 2.00 (2.00) Instructional Core 1ST GRADE DL TCHR 2.00 2.00 2.00 2.00 3.00 1.00 1ST GRADE TCHR 3.00 3.00 3.00 4.00 4.002ND GRADE DL TCHR 2.00 2.00 2.00 2.00 3.00 1.00 2ND GRADE TCHR 3.00 3.00 3.00 3.00 3.003RD GRADE DL TCHR 2.00 2.00 2.00 2.00 2.003RD GRADE TCHR 2.00 3.00 2.00 3.00 3.004TH GRADE DL TCHR 2.00 2.00 2.00 2.00 2.004TH GRADE TCHR 3.00 2.00 2.00 3.00 3.005TH GRADE DL TCHR 2.00 2.00 2.00 2.00 2.005TH GRADE TCHR 2.00 3.00 2.00 3.00 3.00ACAD INTERVENTIONIST - 2.50 2.50 - -ACAD INTERVENTIONIST - STD IMPV - - - 1.50 1.50ENCORE - 0.00 - - -INTERVENTIONIST - READING - STD IMPV - - - 1.00 - (1.00) INTERVENTION-READING 0.50 - - - -SCHOOL IMPROVEMENT COACH: SCIENCE - - - - 1.00 1.00 TITLE I - INSTRUCTIONAL COACH - MATH - - - 1.00 - (1.00) TITLE I - INTERVENTIONIST - READING - - - - 1.00 1.00 Instructional Core Total 23.50 26.50 24.50 29.50 31.50 2.00 Kindergarten and Pre-Kindergarten INST ASST I - 6.00 - - -INSTRUCTIONAL ASST - DL KINDERGARTEN - - 2.00 2.00 2.00INSTRUCTIONAL ASST - KINDERGARTEN - - 4.00 4.00 4.00KINDER DL TCHR 2.00 2.00 2.00 2.00 - (2.00) KINDERGARTEN DL TCHR - - - - 2.00 2.00 KINDERGARTEN TCHR 4.00 4.00 4.00 4.00 4.00PARAPROFESSIONAL I 6.00 - - - -Page 221 ACPS FY 2024 Proposed Budget Elementary Schools
Elementary Schools
Section Title Program Roll-Up Group Title Position Title FY 2020 Final FTE FY 2021 Final FTE FY 2022 Final FTE FY 2023 Final FTE FY 2024 Proposed FTE Change FY 2023 to FY2024 Kindergarten and Pre-Kindergarten Total 12.00 12.00 12.00 12.00 12.00Operations and Maintenance BUILDING ENGINEER I 1.00 1.00 - - -BUILDING ENGINEER II - - 1.00 1.00 1.00CUSTODIAN 7.00 7.00 6.00 6.00 6.00HEAD CUST II 1.00 1.00 1.00 1.00 - (1.00) Operations and Maintenance Total 9.00 9.00 8.00 8.00 7.00 (1.00) Partnerships, Family and Community Engagement FAMILY LIAISON - - - - 1.00 1.00 PARENT LIAISON - 1.00 1.00 1.00 - (1.00) Partnerships, Family and Community Engagement Total - 1.00 1.00 1.00 1.00School Administration ADMIN ASSISTANT I 1.00 1.00 1.00 1.00 1.00ASST PRINCIPAL 3.00 2.00 2.00 2.00 2.00PRINCIPAL-ELEMENTARY 1.00 1.00 1.00 1.00 1.00SCH SECURITY OFFICER - 1.00 - - -SCHOOL SECURITY OFFICER - - 1.00 1.00 1.00SUPPORT SPECIALIST I 1.00 1.00 1.00 1.00 1.00School Administration Total 6.00 6.00 6.00 6.00 6.00School Food Services CAFETERIA AIDE 2.00 2.00 2.00 2.00 2.00 (0.00) School Food Services Total 2.00 2.00 2.00 2.00 2.00 (0.00) Special Education INST ASST II - 2.00 - - -INST ASST II AUT - 4.00 - - -INST ASST II ID - 4.00 - - -INSTRUCTIONAL ASSISTANT II - - 2.00 2.00 2.00INSTRUCTIONAL ASST II - - - - -INSTRUCTIONAL ASST II - AUTISM - - 4.00 4.00 4.00INSTRUCTIONAL ASST II - ID - - 4.00 4.00 4.00PARA II 2.00 - - - -PARA II AUT 4.00 - - - -PARA II ID 3.00 - - - -PARENT LIAISON 1.00 - - - -SPECIAL EDUCATION TCHR - - - - 4.00 4.00 SPED AUT TCHR - - 1.00 - -SPED TCHR 6.00 6.00 5.00 4.00 - (4.00) SPED TCHR - AUTISM - - - 2.00 2.00SPED TCHR - ID - - - 1.00 - (1.00) SPED TCHR AUT 2.00 2.00 2.00 - -SPED TCHR ID 1.00 1.00 2.00 1.00 2.00 1.00 TITLE I - ACCOUNTABILITY SPECIALIST: SPED - - - - 1.00 1.00 Special Education Total 19.00 19.00 20.00 18.00 19.00 1.00 Student Services CLINIC ASSISTANT 0.60 0.60 0.60 0.60 0.60PSYCHOLOGIST 1.00 1.00 1.00 1.00 1.20 0.20 REGISTRAR I 1.00 1.00 1.00 1.00 1.00SCHOOL COUNSELOR 2.00 2.00 2.00 2.00 2.00SCHOOL NURSE 1.00 1.00 1.00 1.00 1.00SOCIAL WORKER 1.00 1.00 1.00 1.00 1.00Student Services Total 6.60 6.60 6.60 6.60 6.80 0.20 John Adams ES Total 107.50 108.60 106.30 108.80 110.00 1.20 Grand Total 107.50 108.60 106.30 108.80 110.00 1.20 Page 222
Proposed Budget Elementary Schools
ACPS FY 2024
Section Title Page 223 ACPS FY 2024 Proposed Budget Elementary Schools
Elementary Schools
Section Title Page 224 ACPS FY 2024 Proposed Budget Elementary Schools
Elementary Schools
Section Title Page 225 ACPS FY 2024 Proposed Budget Elementary Schools
Elementary Schools
Elementary Schools
Accreditation Benchmarks and School Status: John Adams
School
for All Students*
*Schools must develop a multi-year plan for continuous improvement.
Accreditation statuses are based on the Standards of Learning (SOL) tests administered during the previous school year.
School Quality Indicators:
Level 1 = Meets or exceeds state standard or sufficient improvement
Level 2 = Near state standard or sufficient improvement
Level 3 = Below state standard
Too Small = Too few students in school or group to evaluate
Source: VDOE's School Accreditation Report.
Student Performance Data: John Adams
Passing Across All Grade Levels (Federal)
Detailed SOL results are available on the Virginia Department of Education (VDOE) website.
Key: Yes-3YR = Met objective based on the three year average result.
Yes-R10 = Met objective by reducing failure rate by at least 10 percent.
Yes-MP = Maintain Progress: Current year pass rate equal to prior year’s pass rate, or stayed within 5%.
< = A group below state definition for personally identifiable results.
- = No data for group.
Source: VDOE's SOL Test Pass Rates and Other Results Report.
20192020 20202021 20212022 20222023 20232024 Target
English Lvl 1 & 2 NA NA Lvl 1 & 2 TBD Mathematics Lvl 1 & 2 NA NA Lvl 1 & 2 TBD Accreditation Status Accredited Accreditation Waived Accreditation Waived Accredited TBD
Quality Indicators
20182019 20192020 20202021 20212022 20222023
Percent of Students
English All Students 64 NA 51 56 TBD Asian Students 59 NA 57 70 TBD White Students 67 NA 50 64 TBD Students with Disabilities 35 NA 45 37 TBD Economically Disadvantaged Students 61 NA 47 52 TBD Limited English Proficient Students 47 NA 31 46 TBD Gap Group 1 - Students with Disabilities, English Learners, Economically Disadvantaged Students (unduplicated) NA NA NA NA TBD Gap Group 2 - Black Students 70 NA 62 64 TBD Gap Group 3 - Hispanic Students 60 NA 42 47 TBD Mathematics NA All Students 78 NA 32 43 TBD Asian Students 74 NA 38 48 TBD White Students 79 NA 35 48 TBD Students with Disabilities 49 NA 40 30 TBD Economically Disadvantaged Students 78 NA 31 39 TBD Limited English Proficient Students 72 NA 14 34 TBD Gap Group 1 - Students with Disabilities, English Learners, Economically Disadvantaged Students (unduplicated) NA NA NA NA TBD Gap Group 2 - Black Students 79 NA 38 47 TBD Gap Group 3 - Hispanic Students 77 NA 24 36 TBD PALS: Percent of Students Passing Kindergarten: Fall 67 67 63 62 TBD Kindergarten: Spring 83 NA 44 60 TBD Grade 1: Fall 79 76 61 47 TBD Grade 1: Spring 72 NA 49 45 TBD Grade 2: Fall 65 69 55 48 TBD Grade 2: Spring 72 NA 57 59 TBD
SOL:
Page 226 ACPS FY 2024 Proposed Budget Elementary Schools
Lyles-Crouch
Dr. Patricia Zissios, Principal
530 S. St. Asaph Street
Alexandria, Virginia 22314
Tel: 703-706-4430 | Fax: 703-684-0252
patricia.zissios@acps.k12.va.us
https://lcta.acps.k12.va.us/
Lyles-Crouch Traditional Academy is a kindergarten through fifth grade public school located in Old Town, Alexandria. Its diverse and dynamic student body is comprised of students from southwest Old Town as well as many other neighborhoods throughout Alexandria. Lyles-Crouch Traditional Academy embraces the “whole child” approach to education, addressing each student’s social, emotional, physical, and academic requirements through the support of families, staff, and community resources. The school believes the true measure of a student’s success transcends test scores. True success is measured by the preparation necessary to meet the 21st century demands for career, college, and citizenship. Partnering with parents and community resources can ensure this goal is achieved.
Exemplary Program:
Through a rigorous vetting process, Lyles-Crouch Traditional has been recognized as a Core Knowledge School of Distinction with special recognition for content integration and teaching practices, one of only ten schools nationally to attain this designation. Core Knowledge (CK), the main focus of instruction at Lyles-Crouch Traditional Academy, is built around the 4C’s: a content rich curriculum that is coherent, cumulative, and context-specific. Content is built into the program with rich vocabulary, emphasis on building background knowledge, and enhanced focus on language development through read-alouds. Coherence is incorporated as grade-level teams make decisions on the scope and sequence of content taught that best-aligns with state standards. The cumulative nature of learning is built into the CK sequence as content spirals through the grades. The Core Knowledge allocation totals $39,292.
Lyles-Crouch Traditional Academy (Grades K-5)
School Contact Page 227 ACPS FY 2024 Proposed Budget Elementary Schools
Elementary Schools
Elementary Schools
Lyles-Crouch Traditional Acad Staffing Section Title Program Roll-Up Group Title Position Title FY 2020 Final FTE FY 2021 Final FTE FY 2022 Final FTE FY 2023 Final FTE FY 2024 Proposed FTE Change FY 2023 to FY2024 Lyles-Crouch Traditional Acad Communications and Information Services ENCORE - - - - -ENCORE - MEDIA SPEC 1.00 1.00 1.00 1.00 - (1.00) LIBRARY MEDIA ASSIST 0.60 0.60 0.60 0.60 0.60LIBRARY/MEDIA SPECIALIST - - - - 1.00 1.00 Communications and Information Services Total 1.60 1.60 1.60 1.60 1.60EL EL TCHR 2.00 2.00 2.00 2.00 2.00EL Total 2.00 2.00 2.00 2.00 2.00Enrichment and Electives ENCORE - ART TCHR 1.00 1.00 1.00 1.00 1.00ENCORE - MUSIC TCHR 1.00 1.00 1.00 1.00 1.00ENCORE - PE TCHR 2.00 2.00 2.00 2.00 2.00MUSIC TCHR-INSTR 0.50 0.50 0.50 0.50 0.50TAG TCHR 1.50 1.50 1.50 1.50 1.50Enrichment and Electives Total 6.00 6.00 6.00 6.00 6.00Improvement of Instruction S.I. - ACDMC INTRVNST MATH 1.00 - - - -S.I. - ACDMC INTRVNST RDNG 1.00 - - - -Improvement of Instruction Total 2.00 - - - -Instructional Core 1ST GRADE TCHR 5.00 4.00 4.00 3.00 3.002ND GRADE TCHR 3.00 5.00 3.00 4.00 3.00 (1.00) 3RD GRADE TCHR 3.00 3.00 4.00 3.00 3.004TH GRADE TCHR 3.00 3.00 3.00 3.00 3.005TH GRADE TCHR 3.00 3.00 3.00 2.00 2.00ACAD INTERVENTIONIST - - 3.50 - -ACAD INTERVENTIONIST - STD IMPV - - - 3.50 3.50ACAD INTERVENTIONIST (MATH) - 1.00 - - -ACAD INTERVENTIONIST (READING) - 1.50 - - -ACAD INTERVENTIONIST (SCIENCE) - 1.00 - - -S.I. - ACDMC INTRVNST RDNG 1.00 - - - -S.I. - ACDMC INTRVNST SCNC 0.50 - - - -Instructional Core Total 18.50 21.50 20.50 18.50 17.50 (1.00) Kindergarten and PreKindergarten 5TH GRADE TCHR - - - - 1.00 1.00 INST ASST I - 4.00 - - -INSTRUCTIONAL ASST - KINDERGARTEN - - 4.00 4.00 4.00KINDERGARTEN TCHR 5.00 4.00 4.00 4.00 4.00PARAPROFESSIONAL I 5.00 - - - -Kindergarten and Pre-Kindergarten Total 10.00 8.00 8.00 8.00 9.00 1.00 School Administration ADMIN ASSISTANT I 1.00 1.00 1.00 1.00 1.00ASST PRINCIPAL 1.00 1.00 1.00 1.00 1.00PRINCIPAL-ELEMENTARY 1.00 1.00 1.00 1.00 1.00School Administration Total 3.00 3.00 3.00 3.00 3.00School Food Services CAFETERIA AIDE 0.47 0.47 0.48 0.48 0.48School Food Services Total 0.47 0.47 0.48 0.48 0.48Special Education INST ASST II - 2.00 - - -INST ASST II AUT - 2.00 - - -INSTRUCTIONAL ASSISTANT II - - 2.00 2.00 2.00INSTRUCTIONAL ASST II - AUTISM - - 2.00 - -PARA II 2.00 - - - -PARA II AUT 1.00 - - - -SPECIAL EDUCATION TCHR - - 1.00 1.00 3.00 2.00 SPED TCHR 2.00 3.00 2.00 2.00 - (2.00) SPED TCHR AUT 1.00 1.00 1.00 - -Special Education Total 6.00 8.00 8.00 5.00 5.00Student Services PSYCHOLOGIST 0.60 0.60 0.60 0.60 0.80 0.20 REGISTRAR I 1.00 1.00 1.00 1.00 1.00SCHOOL COUNSELOR 1.00 1.00 1.00 1.00 1.00SCHOOL NURSE 1.00 1.00 1.00 1.00 1.00SOCIAL WORKER 1.00 1.00 1.00 1.00 1.00Student Services Total 4.60 4.60 4.60 4.60 4.80 0.20 Lyles-Crouch Traditional Acad Total 54.17 55.17 54.18 49.18 49.38 0.20 Grand Total 54.17 55.17 54.18 49.18 49.38 0.20 Page 228
ACPS FY 2024 Proposed Budget
Section Title Page 229 ACPS FY 2024 Proposed Budget Elementary Schools
Elementary Schools
Section Title Page 230 ACPS FY 2024 Proposed Budget Elementary Schools
Elementary Schools
Elementary Schools
Accreditation Benchmarks and School Status: Lyles-Crouch
*Schools must develop a multi-year plan for continuous improvement.
Accreditation statuses are based on the Standards of Learning (SOL) tests administered during the previous school year.
School Quality Indicators:
Level 1 = Meets or exceeds state standard or sufficient improvement
Level 2 = Near state standard or sufficient improvement
Level 3 = Below state standard
Too Small = Too few students in school or group to evaluate
Source: VDOE's School Accreditation Report.
Detailed SOL results are available on the Virginia Department of Education (VDOE) website.
Key: Yes-3YR = Met objective based on the three year average result.
Yes-R10 = Met objective by reducing failure rate by at least 10 percent.
Yes-MP = Maintain Progress: Current year pass rate equal to prior year’s pass rate, or stayed within 5%.
< = A group below state definition for personally identifiable results.
- = No data for group.
Source: VDOE's SOL Test Pass Rates and Other Results Report.
20192020 20202021 20212022 20222023 20232024
School Quality Indicators
English Lvl 1 & 2 NA NA Lvl 1 & 2 TBD Mathematics Lvl 1 & 2 NA NA Lvl 1 & 2 TBD Accreditation Status Accredited Accreditation Waived Accreditation Waived Accredited TBD
Target
for All Students*
Student Performance Data: Lyles-Crouch 20182019 20192020 20202021 20212022 20222023 SOL: Percent of Students Passing Across All Grade Levels (Federal) English All Students 85 NA 78 89 TBD Asian Students 86 NA 60 100 TBD White Students 92 NA 84 94 TBD Students with Disabilities 38 NA 32 58 TBD Economically Disadvantaged Students 73 NA 61 70 TBD Limited English Proficient Students 78 NA 62 62 TBD Gap Group 1 - Students with Disabilities, English Learners, Economically Disadvantaged Students (unduplicated) NA NA NA NA TBD Gap Group 2 - Black Students 72 NA 70 79 TBD Gap Group 3 - Hispanic Students 84 NA 86 86 TBD Mathematics All Students 89 NA 62 80 TBD Asian Students 86 NA 60 83 TBD White Students 96 NA 70 88 TBD Students with Disabilities 50 NA 15 58 TBD Economically Disadvantaged Students 80 NA 44 57 TBD Limited English Proficient Students 78 NA 31 40 TBD Gap Group 1 - Students with Disabilities, English Learners, Economically Disadvantaged Students (unduplicated) NA NA NA NA TBD Gap Group 2 - Black Students 80 NA 38 58 TBD Gap Group 3 - Hispanic Students 94 NA 86 86 TBD PALS: Percent of Students Passing Kindergarten: Fall 94 88 93 85 TBD Kindergarten: Spring 94 NA 80 81 TBD Grade 1: Fall 88 94 89 80 TBD Grade 1: Spring 91 NA 67 89 TBD Grade 2: Fall 92 88 89 78 TBD Grade 2: Spring 96 NA 78 76 TBD
Page 231 ACPS FY 2024 Proposed Budget Elementary Schools
Page 232 ACPS FY 2024 Proposed Budget Elementary Schools
This page intentionally left blank.
Mount Vernon
Mount Vernon Community School (Grades K-5)
Dr. Liza Burrell-Aldana, Principal
2601 Commonwealth Avenue
Alexandria, Virginia 22305
Tel: 703-706-4460 | Fax: 703-706-4466
liza.burrell-aldana@acps.k12.va.us
https://mvcs.acps.k12.va.us/
Mount Vernon Community School (MVCS) offers a positive learning environment where dedicated staff, students, and families actively engage in and provide meaningful educational experiences that allow for language acquisition in English and Spanish. Students in the dual language program will become bilingual, bi-literate and culturally aware, while maintaining high levels of academic achievement. A Summer Language Academy based in literacy in Spanish and English has been offered since 2015 and will continue to be offered to all Mount Vernon Community School rising first through fifth grade students as well as rising first through fifth grade dual language students at John Adams Elementary School.
Exemplary Program:
Mount Vernon Community School Dual Language program is a 50/50 immersion program in English and Spanish. Students in the dual language program will become bilingual, bi-literate and culturally aware, while maintaining high levels of academic achievement. Students in the MVCS dual language program receive bilingual instruction in all content areas. This program will fund $10,000 for purchased services and is supported by 43.00 FTE dual language teachers and paraprofessionals.
Page 233 ACPS FY 2024 Proposed Budget Elementary Schools
School Contact
Elementary Schools
Mount Vernon Community
Section Title Program Roll-Up Group Title Position Title FY 2020 Final FTE FY 2021 Final FTE FY 2022 Final FTE FY 2023 Final FTE FY 2024 Proposed FTE Change FY 2023 to FY2024 Mount Vernon Community School Communications and Information Services ENCORE - MEDIA SPEC 1.00 1.00 1.00 1.00 - (1.00) LIBRARY MEDIA ASSIST 1.00 1.00 1.00 1.00 1.00LIBRARY/MEDIA SPECIALIST - - - - 1.00 1.00 Communications and Information Services Total 2.00 2.00 2.00 2.00 2.00EL COORD - DUAL LANG - - 0.50 - -DUAL LANG COORD 0.50 0.50 - - -EL TCHR 10.00 10.00 10.00 10.00 10.00INSTR COACH-DUAL LAN 1.00 - - - -EL Total 11.50 10.50 10.50 10.00 10.00Enrichment and Electives ENCORE - ART TCHR 1.80 2.00 2.00 2.00 2.00ENCORE - MUSIC TCHR 2.00 2.00 1.80 1.80 2.00 0.20 ENCORE - PE TCHR 3.00 3.00 3.00 3.00 3.00MUSIC TCHR-INSTR 1.00 1.00 1.00 1.00 1.00TAG TCHR 2.00 2.00 2.00 2.00 2.00Enrichment and Electives Total 9.80 10.00 9.80 9.80 10.00 0.20 Improvement of Instruction INSTRUCTIONAL COACH - 1.50 1.50 - -INSTRUCTIONAL COACH - STD IMPV - - - 1.50 1.50INSTRUCTIONAL COACH (READING) - 1.00 - - -INTERVENTIONIST - READING - - 1.00 - -INTERVENTIONIST - READING - STD IMPV - - - 1.00 1.00S.I. - INSTRCL COACH 1.00 - - - -S.I. - INSTRCL COACH - MATH 1.00 - - - -S.I. - INTRVNST-DATA 1.00 - - - -Improvement of Instruction Total 3.00 2.50 2.50 2.50 2.50Instructional Core 1ST GRADE DL TCHR 7.00 7.00 7.00 7.00 6.00 (1.00) 2ND GRADE DL TCHR 7.00 7.00 6.00 7.00 7.003RD GRADE DL TCHR 6.00 6.00 6.00 6.00 6.003RD GRADE TCHR - - - - -4TH GRADE DL TCHR 6.00 6.00 5.00 6.00 5.00 (1.00) 4TH GRADE TCHR - - - - -5TH GRADE DL TCHR 5.00 6.00 6.00 5.00 6.00 1.00 5TH GRADE TCHR - - - - -ACAD INTERVENTIONIST - 1.00 1.00 - -ACAD INTERVENTIONIST - STD IMPV - - - 1.00 1.00INSTRUCTIONAL COACH - READING - - 1.00 1.00 1.00S.I. - SCIENCE TCHR 0.50 - - - -Instructional Core Total 31.50 33.00 32.00 33.00 32.00 (1.00) Kindergarten and Pre-Kindergarten INST ASST I - 7.00 - - -INSTRUCTIONAL ASST - DL KINDERGARTEN - - 8.00 7.00 - (7.00) INSTRUCTIONAL ASST - KINDERGARTEN - - - - 7.00 7.00 INSTRUCTIONAL ASST I - - - - -KINDER DL TCHR 7.00 7.00 8.00 7.00 - (7.00) KINDERGARTEN DL TCHR - - - - 7.00 7.00 PARAPROFESSIONAL I 7.00 - - - -Kindergarten and Pre-Kindergarten Total 14.00 14.00 16.00 14.00 14.00Partnerships, Family and Community Engagement SPPT SPEC/PARENT LIA 1.00 1.00 1.00 1.00 1.00Partnerships, Family and Community Engagement Total 1.00 1.00 1.00 1.00 1.00School Administration ADMIN ASSISTANT I 1.00 1.00 1.00 1.00 1.00ASST PRINCIPAL 3.00 3.00 3.00 3.00 3.00PRINCIPAL-ELEMENTARY 1.00 1.00 1.00 1.00 1.00SUPPORT SPECIALIST I 1.00 1.00 1.00 1.00 1.00School Administration Total 6.00 6.00 6.00 6.00 6.00School Food Services CAFETERIA AIDE 1.38 1.38 1.38 1.38 1.38 (0.00) School Food Services Total 1.38 1.38 1.38 1.38 1.38 (0.00) Special Education INST ASST II - 2.00 - - -INST ASST II ID - 4.00 - - -INSTRUCTIONAL ASSISTANT II - - 2.00 2.00 2.00INSTRUCTIONAL ASST II - ID - - 4.00 4.00 4.00PARA II 2.00 - - - -PARA II ID 4.00 - - - -SPECIAL EDUCATION TCHR - - - - 5.00 5.00 SPED TCHR 5.00 5.00 5.00 5.00 - (5.00) SPED TCHR ID 2.00 2.00 2.00 2.00 2.00Special Education Total 13.00 13.00 13.00 13.00 13.00Page 234 ACPS FY 2024 Proposed Budget Elementary Schools
School Staffing
Elementary Schools
Section Title Program Roll-Up Group Title Position Title FY 2020 Final FTE FY 2021 Final FTE FY 2022 Final FTE FY 2023 Final FTE FY 2024 Proposed FTE Change FY 2023 to FY2024 Student Services CLINIC ASSISTANT 0.60 0.60 0.60 0.60 0.60COUNSELOR - (0.20) - - -PSYCHOLOGIST 1.00 1.00 1.00 1.00 1.40 0.40 REGISTRAR I 1.00 1.00 1.00 1.00 1.00SCHOOL COUNSELOR 1.80 2.00 1.80 1.80 2.40 0.60 SCHOOL NURSE 1.00 1.00 1.00 1.00 1.00SOCIAL WORKER 1.00 1.00 1.00 1.00 1.00Student Services Total 6.40 6.40 6.40 6.40 7.40 1.00 Mount Vernon Community School Total 99.58 99.78 100.58 99.08 99.28 0.20 Grand Total 99.58 99.78 100.58 99.08 99.28 0.20 Page 235 ACPS FY 2024 Proposed Budget Elementary Schools
Section Title Page 236 ACPS FY 2024 Proposed Budget Elementary Schools
Elementary Schools
Section Title Page 237 ACPS FY 2024 Proposed Budget Elementary Schools
Elementary Schools
Elementary Schools
Accreditation Benchmarks and School Status: Mount Vernon
School
for All Students*
*Schools must develop a multi-year plan for continuous improvement.
Accreditation statuses are based on the Standards of Learning (SOL) tests administered during the previous school year.
School Quality Indicators:
Level 1 = Meets or exceeds state standard or sufficient improvement
Level 2 = Near state standard or sufficient improvement
Level 3 = Below state standard
Too Small = Too few students in school or group to evaluate
Source: VDOE's School Accreditation Report.
Passing Across All Grade Levels (Federal)
Detailed SOL results are available on the Virginia Department of Education (VDOE) website.
Key: Yes-3YR = Met objective based on the three year average result.
Yes-R10 = Met objective by reducing failure rate by at least 10 percent.
Yes-MP = Maintain Progress: Current year pass rate equal to prior year’s pass rate, or stayed within 5%.
< = A group below state definition for personally identifiable results.
- = No data for group.
Source: VDOE's SOL Test Pass Rates and Other Results Report.
20192020 20202021 20212022 20222023 20232024 Target
English Lvl 1 & 2 NA NA Lvl 1 & 2 TBD Mathematics Lvl 1 & 2 NA NA Lvl 1 & 2 TBD Accreditation Status Accredited Accreditation Waived Accreditation Waived Accredited TBD
Quality Indicators
Student
20182019 20192020 20202021 20212022 20222023
of Students
English All Students 57 NA 46 53 TBD Asian Students - NA 40 < TBD White Students 95 NA 87 93 TBD Students with Disabilities 36 NA 35 54 TBD Economically Disadvantaged Students 34 NA 20 25 TBD Limited English Proficient Students 21 NA 8 19 TBD Gap Group 1 - Students with Disabilities, English Learners, Economically Disadvantaged Students (unduplicated) NA NA NA NA TBD Gap Group 2 - Black Students 57 NA 27 44 TBD Gap Group 3 - Hispanic Students 34 NA 24 31 TBD Mathematics All Students 64 NA 33 46 TBD Asian Students - NA 40 < TBD White Students 96 NA 69 85 TBD Students with Disabilities 38 NA 31 22 TBD Economically Disadvantaged Students 46 NA 12 20 TBD Limited English Proficient Students 39 NA 6 15 TBD Gap Group 1 - Students with Disabilities, English Learners, Economically Disadvantaged Students (unduplicated) NA NA NA NA TBD Gap Group 2 - Black Students 43 NA 27 20 TBD Gap Group 3 - Hispanic Students 46 NA 15 25 TBD PALS: Percent of Students Passing Kindergarten: Fall 86 87 74 59 TBD Kindergarten: Spring 86 NA 53 61 TBD Grade 1: Fall 75 80 69 47 TBD Grade 1: Spring 74 NA 58 68 TBD Grade 2: Fall 65 66 58 56 TBD Grade 2: Spring 68 NA 53 36 TBD
Performance Data: Mount Vernon
SOL: Percent
Page 238 ACPS FY 2024 Proposed Budget Elementary Schools
Page 239 ACPS FY 2024 Proposed Budget Elementary Schools
This page intentionally left blank.
Naomi L. Brooks
Naomi L. Brooks Elementary School (Grades K-5)
Suzanne Hess, Principal
600 Russell Road
Alexandria, Virginia 22301
Tel: 703-706-4440 | Fax: 703-683-5146
suzanne.hess@acps.k12.va.us
https://nlb.acps.k12.va.us/
Naomi L. Brooks Elementary School is a kindergarten through fifth grade school in the Rosemont area of Alexandria. The school’s mission is based on the knowledge and belief that all students can learn at high levels. Naomi L. Brooks is committed to a safe and orderly school environment, high expectations, and time-on-task for all students. We are dedicated to fostering the love of learning by encouraging each child to think critically and creatively, work cooperatively and communicate effectively, thus promoting social, physical, and cognitive growth. Our overarching school goal is closing the equity and achievement gap for our Students with Disabilities, Black, Economically Disadvantaged and EL students by increasing the number of students who attain proficiency within all content areas.
Exemplary Program:
The Habits of Mind are a repertoire of behaviors that help students and teachers successfully navigate the various challenges and problems they encounter in the classroom and in everyday life. The 16 habits were derived from studies of what successful, intelligent people do when they are confronted with problems to solve, decisions to make, creative ideas to generate, and ambiguities to clarify. They promote strategic reasoning, insightfulness, perseverance, creativity, and craftsmanship and are relevant to support student mastery of unit and course/grade-level desired results. Non-compensation support totals $5,000 for instructional supplies.
Page 240 ACPS FY 2024 Proposed Budget Elementary Schools
School Contact
Elementary Schools
Section Title Program Roll-Up Group Title Position Title FY 2020 Final FTE FY 2021 Final FTE FY 2022 Final FTE FY 2023 Final FTE FY 2024 Proposed FTE Change FY 2023 to FY2024 Naomi L. Brooks ES Communications and Information Services ENCORE - MEDIA SPEC 1.00 1.00 1.00 1.00 - (1.00) LIBRARY MEDIA ASSIST 0.60 0.60 0.60 0.60 0.60LIBRARY/MEDIA SPECIALIST - - - - 1.00 1.00 Communications and Information Services Total 1.60 1.60 1.60 1.60 1.60EL EL TCHR 1.00 1.00 1.00 1.00 1.00EL Total 1.00 1.00 1.00 1.00 1.00Enrichment and Electives ENCORE - ART TCHR 1.00 1.00 1.00 1.00 1.00ENCORE - MUSIC TCHR 1.00 1.00 1.00 1.00 1.00ENCORE - PE TCHR 2.00 2.00 2.00 2.00 2.00MUSIC TCHR-INSTR 0.50 0.50 0.50 0.50 0.50TAG TCHR 2.00 2.00 2.00 2.00 2.00Enrichment and Electives Total 6.50 6.50 6.50 6.50 6.50Improvement of Instruction INSTRUCTIONAL COACH - 1.00 1.00 - -INSTRUCTIONAL COACH - STD IMPV - - - 1.00 1.00S.I. - INSTRCL COACH - DATA 1.00 - - - -Improvement of Instruction Total 1.00 1.00 1.00 1.00 1.00Instructional Core 1ST GRADE TCHR 3.00 3.00 3.00 3.00 3.002ND GRADE TCHR 3.00 3.00 3.00 3.00 3.003RD GRADE TCHR 3.00 3.00 2.00 2.00 2.004TH GRADE TCHR 2.00 3.00 3.00 2.00 3.00 1.00 5TH GRADE TCHR 3.00 3.00 3.00 2.00 2.00ACAD INTERVENTIONIST - - 0.50 - -ACAD INTERVENTIONIST - STD IMPV - - - 0.50 0.50ACAD INTERVENTIONIST (MATH) - 0.50 - - -ACAD INTERVENTIONIST (READING) - 1.00 - - -INSTRUCTIONAL COACH - READING - - 2.00 - -INSTRUCTIONAL COACH - READING - STD IMPV - - - 2.00 2.00INSTRUCTIONAL COACH (READING) - 1.00 - - -S.I. - ACDMC INTRVNST MATH 0.50 - - - -S.I. - ACDMC INTRVNST RDNG 2.00 - - - -Instructional Core Total 16.50 17.50 16.50 14.50 15.50 1.00 Kindergarten and Pre-Kindergarten INST ASST I - 3.00 - - -INSTRUCTIONAL ASST - KINDERGARTEN - - 3.00 3.00 3.00KINDERGARTEN TCHR 3.00 3.00 3.00 3.00 3.00PARAPROFESSIONAL I 3.00 - - - -Kindergarten and Pre-Kindergarten Total 6.00 6.00 6.00 6.00 6.00Operations and Maintenance BUILDING ENGINEER I 1.00 1.00 1.00 1.00 1.00Operations and Maintenance Total 1.00 1.00 1.00 1.00 1.00School Administration ADMIN ASSISTANT I 1.00 1.00 1.00 1.00 1.00ASST PRINCIPAL 1.00 1.00 1.00 1.00 1.00PRINCIPAL-ELEMENTARY 1.00 1.00 1.00 1.00 1.00School Administration Total 3.00 3.00 3.00 3.00 3.00School Food Services CAFETERIA AIDE 0.69 0.69 0.69 0.69 0.69School Food Services Total 0.69 0.69 0.69 0.69 0.69Special Education INST ASST II - 2.00 - - -INSTRUCTIONAL ASSISTANT II - - 2.00 2.00 2.00PARA II 2.00 - - - -SPECIAL EDUCATION TCHR - - - - 3.00 3.00 SPED TCHR 3.00 3.00 3.00 3.00 - (3.00) Special Education Total 5.00 5.00 5.00 5.00 5.00Student Services PSYCHOLOGIST 0.60 0.60 0.60 0.60 0.80 0.20 REGISTRAR I 1.00 1.00 1.00 1.00 1.00SCHOOL COUNSELOR 1.00 1.00 1.00 1.00 1.00SCHOOL NURSE 1.00 1.00 1.00 1.00 1.00SOCIAL WORKER 1.00 1.00 1.00 1.00 1.00Student Services Total 4.60 4.60 4.60 4.60 4.80 0.20 Naomi L. Brooks ES Total 46.89 47.89 46.89 44.89 46.09 1.20 Grand Total 46.89 47.89 46.89 44.89 46.09 1.20 Page 241 ACPS FY 2024 Proposed Budget Elementary Schools
Naomi L. Brooks ES Staffing
Section Title Page 242 ACPS FY 2024 Proposed Budget Elementary Schools
Elementary Schools
Section Title Page 243 ACPS FY 2024 Proposed Budget Elementary Schools
Elementary Schools
Elementary Schools
Accreditation Benchmarks and School Status: Naomi L. Brooks
Target School Quality Indicators for All Students*
*Schools must develop a multi-year plan for continuous improvement.
Accreditation statuses are based on the Standards of Learning (SOL) tests administered during the previous school year.
School Quality Indicators:
Level 1 = Meets or exceeds state standard or sufficient improvement
Level 2 = Near state standard or sufficient improvement
Level 3 = Below state standard
Too Small = Too few students in school or group to evaluate
Source: VDOE's School Accreditation Report.
Student Performance Data: Naomi L. Brooks
SOL: Percent of Students Passing Across All Grade Levels (Federal)
Detailed SOL results are available on the Virginia Department of Education (VDOE) website.
Key: Yes-3YR = Met objective based on the three year average result.
Yes-R10 = Met objective by reducing failure rate by at least 10 percent.
Yes-MP = Maintain Progress: Current year pass rate equal to prior year’s pass rate, or stayed within 5%.
< = A group below state definition for personally identifiable results.
- = No data for group.
Source: VDOE's SOL Test Pass Rates and Other Results Report.
20192020 20202021 20212022 20222023 20232024
English Lvl 1 & 2 NA NA Lvl 1 & 2 TBD Mathematics Lvl 1 & 2 NA NA Lvl 1 & 2 TBD Accreditation Status Accredited Accreditation Waived Accreditation Waived Accredited TBD
20182019 20192020 20202021 20212022 20222023
English All Students 74 NA 66 73 TBD Asian Students - NA 80 < TBD White Students 94 NA 89 94 TBD Students with Disabilities 24 NA 28 29 TBD Economically Disadvantaged Students 42 NA 16 37 TBD Limited English Proficient Students 36 NA 29 25 TBD Gap Group 1 - Students with Disabilities, English Learners, Economically Disadvantaged Students (unduplicated) NA NA NA NA TBD Gap Group 2 - Black Students 43 NA 21 41 TBD Gap Group 3 - Hispanic Students 63 NA 67 47 TBD Mathematics All Students 72 NA 50 69 TBD Asian Students - NA 80 80 TBD White Students 92 NA 69 90 TBD Students with Disabilities 8 NA 28 29 TBD Economically Disadvantaged Students 39 NA 3 33 TBD Limited English Proficient Students 55 NA 38 46 TBD Gap Group 1 - Students with Disabilities, English Learners, Economically Disadvantaged Students (unduplicated) NA NA NA NA TBD Gap Group 2 - Black Students 39 NA 5 29 TBD Gap Group 3 - Hispanic Students 75 NA 56 60 TBD PALS: Percent of Students Passing Kindergarten: Fall 93 90 96 86 TBD Kindergarten: Spring 93 NA 75 93 TBD Grade 1: Fall 89 93 86 78 TBD Grade 1: Spring 78 NA 65 89 TBD Grade 2: Fall 84 78 84 56 TBD Grade 2: Spring 79 NA 76 68 TBD
Page 244 ACPS FY 2024 Proposed Budget Elementary Schools
Page 245 ACPS FY 2024 Proposed Budget Elementary Schools
This page intentionally left blank.
Patrick Henry
School Contact
Patrick Henry School (Grades K-8)
Dr. Ingrid F. Bynum, Principal 4643 Taney Avenue
Alexandria, Virginia 22304
Tel: 703-461-4170 | Fax: 703-823-3350 ingrid.bynum@acps.k12.va.us https://ph.acps.k12.va.us/
Patrick Henry K-8 School is committed to advancing student growth by providing an environment that is conducive to high levels of academic achievement and that promotes academic rigor, and parental and community engagement.
Exemplary Program:
The Discourse and Rigor program supports higher-order thinking, advanced academic opportunities, alternative assessments, hands-on learning experiences, and the shared inquiry literacy process. This program will primarily support rigorous instructional opportunities for mathematics and literacy. Total support is $15,000.
AVID Elementary and Secondary System is a foundational component of the AVID College Readiness System and supports AVID’s mission and vision to provide a comprehensive model of success for all students, from elementary through higher education. The AVID System focuses on the four necessary areas that ensure all students are poised for academic success: Instruction, Culture, Leadership, and Systems. This model supports students as they become independent learners and is designed to promote WICOR (writing, inquiry, collaboration, organization, and reading) throughout the academic day. It also supports students as independent thinkers— thinking and learning, and about their own learning. Student success skills, organizational skills, and partnership development are all facets of the AVID School-wide model. Additionally, the AVID Elective component afforded in the middle grades targets students who have a determination to enroll in post-secondary education and the desire to learn about college access, financial aid, and post-secondary college options. In addition, the AVID System encourages college campus visits, career learning and leadership opportunities for all students throughout the school setting.
Page 246 ACPS FY 2024 Proposed Budget Elementary Schools
Patrick Henry ES Staffing
Elementary Schools
Section Title Program Roll-Up Group Title Position Title FY 2020 Final FTE FY 2021 Final FTE FY 2022 Final FTE FY 2023 Final FTE FY 2024 Proposed FTE Change FY 2023 to FY2024 Patrick Henry ES Career and Technical Education BUSINESS TCHR 1.00 1.00 1.00 1.00 1.00CTE/TECH TCHR 0.60 - - - -Career and Technical Education Total 1.60 1.00 1.00 1.00 1.00Communications and Information Services ENCORE - MEDIA SPEC 1.00 1.00 1.00 1.00 - (1.00) LIBRARY MEDIA ASSIST 0.60 0.60 0.60 0.60 0.60LIBRARY/MEDIA SPECIALIST - - - - 1.00 1.00 Communications and Information Services Total 1.60 1.60 1.60 1.60 1.60EL EL TCHR 7.00 8.00 8.00 8.00 10.00 2.00 EL TCHR - - - - -EL Total 7.00 8.00 8.00 8.00 10.00 2.00 Enrichment and Electives ART TCHR - 0.50 - - -ENCORE - ART TCHR 1.50 1.00 2.00 2.00 2.00ENCORE - DANCE TCHR 1.00 1.00 1.00 1.00 1.00ENCORE - MUSIC TCHR 1.50 1.80 1.50 1.50 1.90 0.40 ENCORE - PE TCHR 2.60 3.00 2.30 3.00 3.00MUSIC TCHR-INSTR 0.50 0.50 0.50 0.50 0.50TAG TCHR 1.00 1.00 1.00 1.00 1.00WORLD LANG TCHR-SPAN 1.00 1.50 1.00 1.00 1.00Enrichment and Electives Total 9.10 10.30 9.30 10.00 10.40 0.40 Exemplary Programs AVID TCHR - - - - 1.00 1.00 AVID TEACHER - - 1.00 1.00 - (1.00) Exemplary Programs Total - - 1.00 1.00 1.00Improvement of Instruction INSTRUCTIONAL COACH - 2.00 2.00 - -INSTRUCTIONAL COACH - STD IMPV - - - 2.00 2.00INTERVENTIONIST 1.00 1.00 - - -READING SPECIALIST 0.50 1.00 1.00 1.00 1.00S.I. - ACDMC INTRVNST 1.50 - - - -S.I. - INSTR COACH - SFA 1.00 - - - -S.I. - INSTRCL COACH - MATH 1.00 - - - -S.I. - READING SPECIALIST 0.50 - - - -TITLE I - INSTRUCTIONAL COACH: LITERACY - - 1.00 1.00 1.00TITLE I - INTERVENTIONIST - - - - -Improvement of Instruction Total 5.50 4.00 4.00 4.00 4.00Instructional Core 1ST GRADE TCHR 6.00 5.00 5.00 5.00 5.002ND GRADE TCHR 5.00 6.00 5.00 5.00 6.00 1.00 3RD GRADE TCHR 5.00 4.00 5.00 4.00 5.00 1.00 4TH GRADE TCHR 4.00 5.00 4.00 5.00 4.00 (1.00) 5TH GRADE TCHR 4.00 4.00 4.00 4.00 5.00 1.00 ACAD INTERVENTIONIST - 2.50 2.50 - -ACAD INTERVENTIONIST - STD IMPV - - - 2.50 2.50ENCORE - 0.00 - - -ENGLISH TCHR 2.00 3.00 3.00 3.00 3.00MATH INTERVENTIONIST 0.50 0.50 - - -MATH TCHR - 1.00 - - -MATHEMATICS TCHR 2.00 2.00 3.00 3.00 3.00S.I. - ACDMC INTRVNST MATH 0.50 - - - -SCIENCE TCHR 1.00 3.00 3.00 3.00 3.00SOCIAL STUDIES TCHR 1.00 3.00 3.00 3.00 3.00TITLE I - INTERVENTIONIST: MATH - - 0.50 0.50 0.50Instructional Core Total 31.00 39.00 38.00 38.00 40.00 2.00 Kindergarten and PreKindergarten INST ASST I - 5.00 - - -INSTRUCTIONAL ASST - KINDERGARTEN - - 5.00 6.00 4.00 (2.00) KINDERGARTEN TCHR 7.00 5.00 5.00 6.00 4.00 (2.00) PARAPROFESSIONAL I 7.00 - - - -Kindergarten and Pre-Kindergarten Total 14.00 10.00 10.00 12.00 8.00 (4.00) Operations and Maintenance BUILDING ENGINEER I 1.00 1.00 - - -BUILDING ENGINEER II - - 1.00 1.00 1.00Operations and Maintenance Total 1.00 1.00 1.00 1.00 1.00Partnerships, Family and Community Engagement FAMILY LIAISON - BILINGUAL - - - - 1.00 1.00 PARENT LIAISON-BILIN 1.00 1.00 1.00 1.00 - (1.00) Partnerships, Family and Community Engagement Total 1.00 1.00 1.00 1.00 1.00School Administration ACADEMIC PRINCIPAL - 1.00 1.00 1.00 1.00ADMIN ASSISTANT I 1.00 1.00 1.00 1.00 1.00ASST PRINCIPAL 2.00 1.00 1.00 1.00 1.00DEAN OF STUDENTS - 1.00 1.00 1.00 1.00Page 247 ACPS FY 2024 Proposed Budget Elementary Schools
Section Title Program Roll-Up Group Title Position Title FY 2020 Final FTE FY 2021 Final FTE FY 2022 Final FTE FY 2023 Final FTE FY 2024 Proposed FTE Change FY 2023 to FY2024 PRINCIPAL - PK-8 - - 1.00 1.00 1.00PRINCIPAL-ELEMENTARY 1.00 1.00 - - -SCH SECURITY OFFICER - 1.00 - - -SCHOOL SECURITY OFFICER - - 1.00 1.00 1.00SUPPORT SPECIALIST I 1.00 1.00 1.00 1.00 1.00School Administration Total 5.00 7.00 7.00 7.00 7.00School Food Services CAFETERIA AIDE 1.38 1.38 1.38 1.38 1.38 (0.00) School Food Services Total 1.38 1.38 1.38 1.38 1.38 (0.00) Special Education INST ASST II - 2.00 - - -INST ASST II AUT - 2.00 - - -INSTRUCTIONAL ASSISTANT II - - 2.00 2.00 2.00INSTRUCTIONAL ASST II - - - - -INSTRUCTIONAL ASST II - AUTISM - - 2.00 2.00 2.00PARA II 2.00 - - - -PARA II AUT 2.00 - - - -SPECIAL EDUCATION TCHR - - - - 7.00 7.00 SPED TCHR 4.00 6.00 6.00 7.00 - (7.00) SPED TCHR - - - - -SPED TCHR - AUTISM - - - 1.00 1.00SPED TCHR AUT 1.00 1.00 1.00 - -TITLE I - ACCOUNTABILITY SPECIALIST: SPED - - - 1.00 1.00Special Education Total 9.00 11.00 11.00 13.00 13.00Student Services PSYCHOLOGIST 1.00 1.00 1.00 1.00 1.60 0.60 REGISTRAR I 1.00 1.00 1.00 1.00 1.00SCHOOL COUNSELOR 1.40 2.00 2.00 2.00 2.40 0.40 SCHOOL NURSE 1.00 1.00 1.00 1.00 1.00SOCIAL WORKER 1.00 1.00 1.00 1.00 1.00Student Services Total 5.40 6.00 6.00 6.00 7.00 1.00 Patrick Henry ES Total 92.58 101.28 100.28 104.98 106.38 1.40 Grand Total 92.58 101.28 100.28 104.98 106.38 1.40 Page 248 ACPS FY 2024 Proposed Budget Elementary Schools
Elementary Schools
Section Title Page 249 ACPS FY 2024 Proposed Budget Elementary Schools
Elementary Schools
Section Title Page 250 ACPS FY 2024 Proposed Budget Elementary Schools
Elementary Schools
Section Title Page 251 ACPS FY 2024 Proposed Budget Elementary Schools
Elementary Schools
Elementary Schools
Accreditation Benchmarks and School Status: Patrick Henry
*Schools must develop a multi-year plan for continuous improvement.
Accreditation statuses are based on the Standards of Learning (SOL) tests administered during the previous school year.
School Quality Indicators:
Level 1 = Meets or exceeds state standard or sufficient improvement
Level 2 = Near state standard or sufficient improvement
Level 3 = Below state standard
Too Small = Too few students in school or group to evaluate
Source: VDOE's School Accreditation Report.
Patrick Henry
All
Detailed SOL results are available on the Virginia Department of Education (VDOE) website.
Key: Yes-3YR = Met objective based on the three year average result.
Yes-R10 = Met objective by reducing failure rate by at least 10 percent.
Yes-MP = Maintain Progress: Current year pass rate equal to prior year’s pass rate, or stayed within 5%.
< = A group below state definition for personally identifiable results.
- = No data for group.
Source: VDOE's SOL Test Pass Rates and Other Results Report.
20192020 20202021 20212022 20222023 20232024 Target School Quality Indicators
English Lvl 1 & 2 NA NA Lvl 1 & 2 TBD Mathematics Lvl 1 & 2 NA NA Lvl 1 & 2 TBD Accreditation Status Accredited Accreditation Waived Accreditation Waived Accredited TBD
for All Students*
20182019 20192020 20202021 20212022 20222023 SOL: Percent of Students Passing
English All Students 74 NA 57 68 TBD Asian Students 62 NA 48 71 TBD White Students 82 NA 54 71 TBD Students with Disabilities 41 NA 15 16 TBD Economically Disadvantaged Students 72 NA 54 65 TBD Limited English Proficient Students 57 NA 20 48 TBD Gap Group 1 - Students with Disabilities, English Learners, Economically Disadvantaged Students (unduplicated) NA NA NA NA TBD Gap Group 2 - Black Students 72 NA 63 68 TBD Gap Group 3 - Hispanic Students 76 NA 50 64 TBD Mathematics All Students 77 NA 37 53 TBD Asian Students 75 NA 41 57 TBD White Students 88 NA 28 57 TBD Students with Disabilities 37 NA 12 6 TBD Economically Disadvantaged Students 75 NA 34 51 TBD Limited English Proficient Students 69 NA 15 35 TBD Gap Group 1 - Students with Disabilities, English Learners, Economically Disadvantaged Students (unduplicated) NA NA NA NA TBD Gap Group 2 - Black Students 73 NA 40 52 TBD Gap Group 3 - Hispanic Students 81 NA 33 46 TBD PALS: Percent of Students Passing Kindergarten: Fall 86 84 79 77 TBD Kindergarten: Spring 89 NA 69 82 TBD Grade 1: Fall 82 81 81 66 TBD Grade 1: Spring 87 NA 72 76 TBD Grade 2: Fall 71 75 67 72 TBD Grade 2: Spring 78 NA 66 72 TBD
Student Performance Data:
Across
Grade Levels (Federal)
Page 252 ACPS FY 2024 Proposed Budget Elementary Schools
Samuel W. Tucker
Samuel W. Tucker Elementary School (Grades K-5)
Adaarema Kelly, Principal 435 Ferdinand Day Drive
Alexandria, Virginia 22304
Tel: 703-933-6300 | Fax: 703-212-8465
adaarema.kelly@acps.k12.va.us
https://swt.acps.k12.va.us/
Samuel W. Tucker Elementary School is committed to educating every student to his/her highest potential and maintaining its full accreditation status. The community takes great pride in Tucker’s rich cultural diversity, unique calendar, and strong focus on academic achievement.
Exemplary Programs:
Samuel W. Tucker Elementary operates on a modified calendar with a shortened summer and the opportunity for students to participate in two optional intersessions providing remediation and enrichment courses that support the ACPS curriculum’s connection to the real world. Total support is $0.36 million including participation fees contributed by families.

School Contact Page 253 ACPS FY 2024 Proposed Budget Elementary Schools
Elementary Schools
Section TitleProgram Roll-Up Group TitlePosition Title FY 2020 Final FTE FY 2021 Final FTE FY 2022 Final FTE FY 2023 Final FTE FY 2024 Proposed FTE Change FY 2023 to FY2024 Samuel W. Tucker ES Communications and Information Services ENCORE - MEDIA SPEC1.00 1.00 1.00 1.00 - (1.00) LIBRARY MEDIA ASSIST1.00 1.00 1.00 1.00 1.00LIBRARY/MEDIA SPECIALIST- - - - 1.00 1.00 Communications and Information Services Total2.00 2.00 2.00 2.00 2.00EL EL TCHR9.00 8.00 8.00 8.00 8.00EL Total 9.00 8.00 8.00 8.00 8.00Enrichment and Electives ENCORE - ART TCHR1.60 1.20 1.20 1.20 1.00 (0.20) ENCORE - MUSIC TCHR1.40 1.40 1.40 1.40 1.40ENCORE - PE TCHR3.00 3.00 2.60 2.60 2.60ESSER II - PE TCHR (VIRTUAL VIRGINIA) - - - - 0.40 0.40 MUSIC TCHR-INSTR1.10 1.10 1.10 1.10 1.10TAG TCHR1.20 1.20 1.20 1.00 1.00Enrichment and Electives Total8.30 7.90 7.50 7.30 7.50 0.20 Improvement of Instruction INSTRUCTIONAL COACH1.00 - 2.00 - -INSTRUCTIONAL COACH - STD IMPV- - - 1.00 1.00INSTRUCTIONAL COACH (LITERACY)- 1.00 - - -INSTRUCTIONAL COACH (MATH)- 1.00 - - -S.I. - INSTRCL COACH - DATA1.00 - - - -Improvement of Instruction Total2.00 2.00 2.00 1.00 1.00Instructional Core 1ST GRADE TCHR6.00 6.00 5.00 6.00 6.002ND GRADE TCHR7.00 6.00 5.00 5.00 6.00 1.00 3RD GRADE TCHR6.00 5.00 4.00 5.00 4.00 (1.00) 4TH GRADE TCHR5.00 6.00 5.00 4.00 5.00 1.00 5TH GRADE TCHR4.00 4.00 5.00 5.00 4.00 (1.00) ACAD INTERVENTIONIST- - 2.50 - -ACAD INTERVENTIONIST - STD IMPV- - - 2.50 2.50ACAD INTERVENTIONIST (READING)- 2.00 - - -ACAD INTERVENTIONIST (SCIENCE)- 0.50 - - -ENCORE- 0.00 - - -ENCORE - INTERVENTIONIST: MATH- - - - 0.20 0.20 LITERACY INTERVENTIONIST - STD IMP - - - 1.00 1.00MATHEMATICS TEACHER1.00 - - - -S.I. - ACDMC INTRVNST SCNC0.50 - - - -S.I. - ACDMC INTRVST - RDNG2.00 - - - -S.I. - INSTRCL COACH - DATA1.00 - - - -SCIENCE TCHR- 0.20 0.20 0.20 0.20Instructional Core Total32.50 29.70 26.70 28.70 28.90 0.20 Kindergarten and PreKindergarten INST ASST I- 6.00 - - -INSTRUCTIONAL ASST - KINDERGARTE - - 7.00 6.00 6.00KINDERGARTEN TCHR7.00 6.00 7.00 6.00 6.00PARAPROFESSIONAL I7.00 - - - -Kindergarten and Pre-Kindergarten Total14.00 12.00 14.00 12.00 12.00Operations and Maintenance BUILDING ENGINEER I1.00 1.00 1.00 1.00 1.00CUSTODIAN3.00 3.00 3.00 3.00 3.00HEAD CUST I1.00 1.00 1.00 1.00 1.00Operations and Maintenance Total5.00 5.00 5.00 5.00 5.00School Administration ADMIN ASSISTANT I1.00 1.00 1.00 1.00 1.00ASST PRINCIPAL2.00 2.00 2.00 2.00 2.00PRINCIPAL-ELEMENTARY1.00 1.00 1.00 1.00 1.00SUPPORT SPECIALIST I1.00 1.00 1.00 1.00 1.00School Administration Total5.00 5.00 5.00 5.00 5.00School Food Services CAFETERIA AIDE1.44 1.44 1.44 1.44 1.44 (0.00) School Food Services Total1.44 1.44 1.44 1.44 1.44 (0.00) Special Education INST ASST II- 3.00 - - -INSTRUCTIONAL ASSISTANT II- - 3.00 3.00 3.00PARA II3.00 - - - -SPECIAL EDUCATION TCHR- - - - 6.00 6.00 SPED TCHR6.00 6.00 6.00 6.00 - (6.00) Special Education Total9.00 9.00 9.00 9.00 9.00Student Services CLINIC ASSISTANT0.40 0.40 - - -COUNSELOR- (0.60) - - -PSYCHOLOGIST1.00 1.00 1.00 1.00 1.20 0.20 Page 254 ACPS FY 2024 Proposed Budget Elementary Schools
Samuel W. Tucker ES Staffing
Elementary Schools
Section TitleProgram Roll-Up Group TitlePosition Title FY 2020 Final FTE FY 2021 Final FTE FY 2022 Final FTE FY 2023 Final FTE FY 2024 Proposed FTE Change FY 2023 to FY2024 REGISTRAR I1.00 1.00 1.00 1.00 1.00SCHOOL COUNSELOR1.60 2.20 1.60 1.60 2.00 0.40 SCHOOL NURSE1.00 1.00 1.00 1.00 1.00SOCIAL WORKER1.00 1.00 1.00 1.00 1.00Student Services Total6.00 6.00 5.60 5.60 6.20 0.60 Samuel W. Tucker ES Total 94.24 88.04 86.24 85.04 86.04 1.00 Grand Total 94.24 88.04 86.24 85.04 86.04 1.00 Page 255 ACPS FY 2024 Proposed Budget Elementary Schools
Section Title Page 256 ACPS FY 2024 Proposed Budget Elementary Schools
Elementary Schools
Section Title Page 257 ACPS FY 2024 Proposed Budget Elementary Schools
Elementary Schools
Section Title Page 258 ACPS FY 2024 Proposed Budget Elementary Schools
Elementary Schools
Elementary Schools
Accreditation Benchmarks and School Status: Samuel W. Tucker
Target School Quality Indicators for All Students* EnglishLvl 1 & 2NANALvl 1 & 2TBD
1 & 2NANALvl 1 & 2TBD
*Schools must develop a multi-year plan for continuous improvement.
Accreditation statuses are based on the Standards of Learning (SOL) tests administered during the previous school year.
School Quality Indicators:
Level 1 = Meets or exceeds state standard or sufficient improvement
Level 2 = Near state standard or sufficient improvement
Level 3 = Below state standard
Too Small = Too few students in school or group to evaluate
Source: VDOE's School Accreditation Report.
Student Performance Data: Samuel W. Tucker
SOL: Percent of Students Passing Across All Grade Levels (Federal)
English Learners,
Detailed SOL results are available on the Virginia Department of Education (VDOE) website.
Key: Yes-3YR = Met objective based on the three year average result.
Yes-R10 = Met objective by reducing failure rate by at least 10 percent.
Yes-MP = Maintain Progress: Current year pass rate equal to prior year’s pass rate, or stayed within 5%.
< = A group below state definition for personally identifiable results.
- = No data for group.
Source: VDOE's SOL Test Pass Rates and Other Results Report.
20192020 20202021 20212022 20222023 20232024
MathematicsLvl
Accreditation Status Accredited Accreditation Waived Accreditation Waived AccreditedTBD
20182019 20192020 20202021 20212022 20222023
English All Students 74NA6162TBD Asian Students 74NA5356TBD White Students 78NA7072TBD Students with Disabilities 27NA2129TBD Economically Disadvantaged Students 65NA4851TBD Limited English Proficient Students 50NA3537TBD Gap Group 1 - Students with Disabilities,
Economically Disadvantaged Students (unduplicated) NANANANATBD Gap Group 2 - Black Students 75NA6058TBD Gap Group 3 - Hispanic Students 70NA6160TBD Mathematics All Students 78NA3447TBD Asian Students 87NA2637TBD White Students 86NA4665TBD Students with Disabilities 27NA1714TBD Economically Disadvantaged Students 72NA2036TBD Limited English Proficient Students 68NA1028TBD Gap Group 1 - Students with Disabilities,
Economically Disadvantaged Students (unduplicated) NANANANATBD Gap Group 2 - Black Students 75NA2838TBD Gap Group 3 - Hispanic Students 76NA3146TBD
Percent of Students Passing Kindergarten: Fall 84898575TBD Kindergarten: Spring 85NA5873TBD Grade 1: Fall 88898871TBD Grade 1: Spring 76NA6858TBD Grade 2: Fall 73757466TBD Grade 2: Spring 70NA7264TBD
English Learners,
PALS:
Page 259 ACPS FY 2024 Proposed Budget Elementary Schools
William Ramsay
School Contact
William Ramsay Elementary School (Grades Pre-K-5)
Michael J. Routhouska, Principal 5700 Sanger Avenue
Alexandria, Virginia 22311
Tel: 703-824-6950 | Fax: 703-379-7824
michael.routhouska@acps.k12.va.us https://wr.acps.k12.va.us/
The team at William Ramsay Elementary School is committed to growing all students’ academic literacies and social-emotional awareness. We ensure success by building strong relationships with students, families, and each other. We have high expectations for students’ continuous academic growth, and students are required to think critically. The school’s academic curriculum includes reading, writing, math, social studies, and science. William Ramsay will continue to offer and seek to expand our talented and gifted programs to students in all grade levels. William Ramsay also provides specialized instruction to eligible students and English learners.
Exemplary Programs:
The Project GLAD® (Guided Language Acquisition Design) is an instructional model dedicated to building academic language and literacy for all students, especially English Learner/emergent bilingual students. The model enhances teachers’ design and delivery of standards-based instruction through an integrated approach with the intent of building language proficiency, academic comprehension, and promotes an environment that respects and honors each child’s voice, personal life experience, beliefs and values their culture. Total support for this program is $30,000.
Page 260 ACPS FY 2024 Proposed Budget Elementary Schools
Elementary Schools
Section TitleProgram Roll-Up Group TitlePosition Title FY 2020 Final FTE FY 2021 Final FTE FY 2022 Final FTE FY 2023 Final FTE FY 2024 Proposed FTE Change FY 2023 to FY2024 William Ramsay ES Communications and Information Services ENCORE - MEDIA SPEC1.00 1.00 1.00 1.00 - (1.00) LIBRARY MEDIA ASSIST1.00 1.00 1.00 1.00 1.00LIBRARY/MEDIA SPECIALIST- - - - 1.00 1.00 Communications and Information Services Total2.00 2.00 2.00 2.00 2.00EL EL TCHR10.00 11.00 11.00 11.00 11.00EL Total 10.00 11.00 11.00 11.00 11.00Enrichment and Electives ENCORE - ART TCHR1.00 1.00 1.00 1.00 1.00ENCORE - MUSIC TCHR0.80 1.40 1.40 0.80 0.80ENCORE - PE TCHR2.40 3.00 2.40 3.00 3.00MUSIC TCHR-INSTR1.00 0.70 0.70 0.70 0.50 (0.20) MUSIC TCHR-VOCAL- - - - 0.20 0.20 TAG TCHR1.20 1.20 1.20 1.00 1.00Enrichment and Electives Total6.40 7.30 6.70 6.50 6.50Improvement of Instruction INSTRCOACH - MATH- 0.50 - - -INSTRCOACH-MATH0.50 - - - -INSTRUCTIONAL COACH- 1.00 - - -S.I. - ACDMC INTRVNST 1.00 - - - -TITLE I - INSTRUCTIONAL COACH- - 1.00 1.00 1.00TITLE I - INSTRUCTIONAL SPECIALIST: MATH - - 0.50 0.50 0.50Improvement of Instruction Total1.50 1.50 1.50 1.50 1.50Instructional Core 1ST GRADE TCHR5.00 5.00 4.00 5.00 5.002ND GRADE TCHR4.00 5.00 5.00 4.00 5.00 1.00 3RD GRADE TCHR4.00 4.00 4.00 5.00 4.00 (1.00) 4TH GRADE TCHR3.00 5.00 3.00 4.00 4.005TH GRADE TCHR4.00 4.00 4.00 3.00 4.00 1.00 ACAD INTERVENTIONIST- 3.00 3.00 - -ACAD INTERVENTIONIST - STD IMPV- - - 3.00 3.00ENCORE- (0.00) - - -INSTRCL COACH - MATH - STD IMPV- - - 0.50 0.50INSTRCOACH - MATH- - 0.50 - -INSTRUCTIONAL COACH- 1.00 - - -LITERACY COACH1.00 - - - -S.I. - ACDMC INTRVNST MATH0.50 - - - -S.I. - ACDMC INTRVNST RDNG2.00 - - - -S.I. - INSTRCL COACH1.00 - - - -SCIENCE SPECIALIST1.00 - - - -SCIENCE TCHR- 1.00 - - -SCIENCE TCHR - STD IMPV- - - 1.00 - (1.00) SPECIALIST - MATH- 0.50 - - -STD IMPV - SCIENCE TCHR- - - - 1.00 1.00 STDNT IMPRV SCIENCE- - 1.00 - -TITLE I - INSTRUCTIONAL COACH- - 1.00 1.00 1.00Instructional Core Total25.50 28.50 25.50 26.50 27.50 1.00 Kindergarten and PreKindergarten INST ASST I- 6.00 - - -INST ASST I - VPI- 1.00 - - -INSTRUCTIONAL ASST - KINDERGARTEN- - 6.00 5.00 6.00 1.00 INSTRUCTIONAL ASST - VPI- - 2.00 2.00 2.00INSTRUCTIONAL ASST I- - - - -KINDERGARTEN TCHR5.00 6.00 6.00 5.00 6.00 1.00 PARA II AUT2.00 - - - -PARAPROFESSIONAL I5.00 - - - -PRE-SCHOOL TCHR2.00 2.00 2.00 2.00 2.00Kindergarten and Pre-Kindergarten Total14.00 15.00 16.00 14.00 16.00 2.00 Operations and Maintenance BUILDING ENGINEER I1.00 1.00 1.00 1.00 1.00Operations and Maintenance Total1.00 1.00 1.00 1.00 1.00Partnerships, Family and Community Engagement FAMILY LIAISON - BILINGUAL- - - - 1.00 1.00 PARENT LIAISON-BILIN1.00 1.00 1.00 1.00 - (1.00) Partnerships, Family and Community Engagement Total1.00 1.00 1.00 1.00 1.00School Administration ADMIN ASSISTANT I1.00 1.00 1.00 1.00 1.00ASST PRINCIPAL2.00 2.00 2.00 2.00 2.00PRINCIPAL-ELEMENTARY1.00 1.00 1.00 1.00 1.00SUPPORT SPECIALIST I1.00 1.00 1.00 1.00 1.00School Administration Total5.00 5.00 5.00 5.00 5.00School Food Services CAFETERIA AIDE1.94 1.94 1.94 1.94 1.94Page 261 ACPS FY 2024 Proposed Budget Elementary Schools
William Ramsay ES Staffing
Elementary Schools
Section TitleProgram Roll-Up Group TitlePosition Title FY 2020 Final FTE FY 2021 Final FTE FY 2022 Final FTE FY 2023 Final FTE FY 2024 Proposed FTE Change FY 2023 to FY2024 School Food Services Total1.94 1.94 1.94 1.94 1.94Special Education ECSE AUT TCHR- 1.00 1.00 1.00 1.00INST ASST II- 2.00 - - -INST ASST II AUT- 6.00 - - -INSTRUCTIONAL ASSISTANT II- - 2.00 2.00 2.00INSTRUCTIONAL ASST II - AUTISM- - 6.00 6.00 6.00PARA II2.00 - - - -PARA II AUT2.00 - - - -SPECIAL EDUCATION TCHR- - - - 4.00 4.00 SPED TCHR4.00 4.00 4.00 4.00 - (4.00) SPED TCHR - AUTISM- - - 2.00 2.00SPED TCHR AUT1.00 2.00 2.00 - -Special Education Total9.00 15.00 15.00 15.00 15.00Student Services CLINIC ASSISTANT0.60 0.60 1.00 1.00 1.00PSYCHOLOGIST1.00 1.00 1.00 1.00 1.00REGISTRAR I1.00 1.00 1.00 1.00 1.00SCHOOL COUNSELOR2.00 2.00 2.00 2.00 2.00SCHOOL NURSE1.00 1.00 1.00 1.00 1.00SOCIAL WORKER1.00 1.00 1.00 1.00 1.00Student Services Total6.60 6.60 7.00 7.00 7.00William Ramsay ES Total 83.94 95.84 93.64 92.44 95.44 3.00 Grand Total 83.94 95.84 93.64 92.44 95.44 3.00 Page 262 ACPS FY 2024 Proposed Budget Elementary Schools
Section Title Page 263 ACPS FY 2024 Proposed Budget Elementary Schools
Elementary Schools
Section Title Page 264 ACPS FY 2024 Proposed Budget Elementary Schools
Elementary Schools
Section Title Page 265 ACPS FY 2024 Proposed Budget Elementary Schools
Elementary Schools
Elementary Schools
Accreditation Benchmarks and School Status: William Ramsay
Target School Quality Indicators for All Students* EnglishLvl 1 & 2NANALvl 1 &
*Schools must develop a multi-year plan for continuous improvement.
Accreditation statuses are based on the Standards of Learning (SOL) tests administered during the previous school year.
School Quality Indicators:
Level 1 = Meets or exceeds state standard or sufficient improvement
Level 2 = Near state standard or sufficient improvement
Level 3 = Below state standard
Too Small = Too few students in school or group to evaluate
Source: VDOE's School Accreditation Report.
Student Performance Data: William Ramsay
SOL: Percent of Students Passing Across All Grade Levels (Federal)
Detailed SOL results are available on the Virginia Department of Education (VDOE) website.
Key: Yes-3YR = Met objective based on the three year average result.
Yes-R10 = Met objective by reducing failure rate by at least 10 percent.
Yes-MP = Maintain Progress: Current year pass rate equal to prior year’s pass rate, or stayed within 5%.
< = A group below state definition for personally identifiable results.
- = No data for group.
Source: VDOE's SOL Test Pass Rates and Other Results Report.
20192020 20202021 20212022 20222023 20232024
MathematicsLvl
Accreditation Status Accredited Accreditation Waived Accreditation Waived Accredited with Conditions TBD
2TBD
1 & 2NANALvl 1 & 2TBD
20182019 20192020 20202021 20212022 20222023
English All Students 43NA2536TBD Asian Students 67NA3357TBD White Students 42NA5063TBD Students with Disabilities 27NA1016TBD Economically Disadvantaged Students 40NA2635TBD Limited English Proficient Students 22NA1427TBD Gap Group 1 - Students with Disabilities,
Learners, Economically Disadvantaged Students (unduplicated) NANANANATBD Gap Group 2 - Black Students 51NA3242TBD Gap Group 3 - Hispanic Students 37NA1727TBD Mathematics All Students 57NA1627TBD Asian Students 67NA3336TBD White Students 65NA4442TBD Students with Disabilities 32NA58TBD Economically Disadvantaged Students 54NA1729TBD Limited English Proficient Students 42NA1021TBD Gap Group 1 - Students with Disabilities, English Learners, Economically Disadvantaged Students (unduplicated) NANANANATBD Gap Group 2 - Black Students 70NA2331TBD Gap Group 3 - Hispanic Students 49NA722TBD
Percent of Students Passing Kindergarten: Fall 57634148TBD Kindergarten: Spring 74NA2668TBD Grade 1: Fall 67616244TBD Grade 1: Spring 37NA4053TBD Grade 2: Fall 57444038TBD Grade 2: Spring 57NA2844TBD
English
PALS:
Page 266 ACPS FY 2024 Proposed Budget Elementary Schools
This
Page 267 ACPS FY 2024 Proposed Budget Elementary Schools
page intentionally left blank.
Middle Schools Summary
Middle Schools Overview
ACPS has two middle schools (grades 6-8), Francis C. Hammond and George Washington. Jefferson-Houston houses grades PreK-8 and Patrick Henry houses K-8; however, the information for these locations is presented in
the elementary school summary section. Other major programs can be seen in the table below.
School Name Principal Address and Contact

Francis C. Hammond Middle School
George Washington Middle School
Anika BusterSingleton, Acting 4646 Seminary Road Alexandria, VA 22304
Tel: 703-461-4100
Fax: 703-461-4111
https://fchs.acps.k12.va.us/
Jeanette Vinson, Acting 1005 Mount Vernon Avenue Alexandria, VA 22301
Tel: 703-706-4500
Fax: 703-299-7597
https://gw.acps.k12.va.us/
Grades Served
Gr 6-8
Major Programs
Advancement Via Individual Determination
International Academy
Title I School - City-Wide Special Education

Spanish Dual Language
Gr 6-8
Advancement Via Individual Determination
City-Wide Special Education Head Start (Auxiliary Building)
Spanish Dual Language
Page 268 Middle Schools ACPS FY 2024 Proposed Budget
Middle Schools
Enrollment and Demographics:
The Middle School enrollment, for sixth through eighth grades, was 2,833 as of September 30, 2022. Enrollment is projected to decrease by 2.9 percent to a total of 2,751. Both middle schools have experienced steady enrollment growth in recent years; however, enrollments are leveling off, as displayed in the chart below.
For reporting purposes, both Jefferson-Houston and Patrick Henry student enrollments, staffing, and budget reports are presented in the Elementary School section.
With the increasing enrollment, the number of students with additional needs continue to grow as well. Significant numbers of English learner (EL) students attend ACPS schools, as displayed in the chart below.
In total, the number of EL students at the middle school level is projected to decrease by 1.7percent to a total of 918 students. Additional information describing the EL program is located within the Information and Department sections of this budget book.
Page 269 ACPS FY 2024 Proposed Budget Middle Schools
100 200 300 400 500 600 700
Francis C. Hammond
FY 2020 FY 2021 FY 2022 FY 2023 FY 2024 Projected250 500 750 1,000 1,250 1,500 1,750
George
Washington
English Learner Enrollment Middle Schools by Fiscal Year
Francis C. Hammond
Total Enrollment Middle
FY 2020 FY 2021 FY 2022 FY 2023 FY 2024 Projected
George Washington
Schools by Fiscal Year
Middle Schools
The trends of numbers of students requiring special education (SPED) services are shown by school in the table above.
The number of students receiving special education services at the middle school level is projected to decrease by 2.8 percent, to a total of 341. For more information on the special education program, please refer to the Information and Department sections of this budget book.
Many of the students in ACPS middle schools come from families that are economically disadvantaged; this is reflected in the number of students qualifying for free and reduced-price meals, shown in the table below.
Assuming that the proportion of students qualifying for free and reduced-price meals stays constant, the FY 2024 projected number of students meeting this criteria will decrease to 1,533 students.
Page 270 Middle Schools ACPS FY 2024 Proposed Budget
50 100 150 200
Francis C. Hammond
Special Education Enrollment Middle Schools by Fiscal Year FY 2020 FY 2021 FY 2022 FY 2023 FY 2024 Projected200 400 600 800 1,000 1,200
George Washington
Francis C. Hammond
Free and Reduced-Price Meal Enrollment Middle Schools by Fiscal Year FY 2020 FY 2021 FY 2022 FY 2023 FY 2024 Projected
George Washington
Staffing:
Middle Schools
Operating funded staffing at middle schools will be a total of 344.20 FTE in FY 2024 for Francis C. Hammond and George Washington middle schools.
Middle core and elective classes are staffed based on class enrollment. Changes in secondary staffing include a increase of 1.00 FTE EL teacher.
Specialized Instruction: The allocation of special education staffing is determined by two factors: disability category and level of service. Beginning in FY 2017,to further support inclusion and co-teaching across content areas, the staffing formula was revised by adjusting the service intensity point values which determine staff ratios. For FY 2024, the formula will result in no change for special education positions at Francis C. Hammond or George Washington.
There are a total of 41 Special Education positions at Francis C. Hammond and George Washingtonin FY 2024. Special education Instructional Support II and III positions are a central pool in the School-wide resources section. Speech language pathologist (SLP) positions are housed in a central pool in the Specialized Instruction Department. Positions will be allocated from these two pools based on individual student need.
English Learners: At the middle school level, Francis C. Hammond has both a traditional model and an International Academy (IA) model of services. Through the traditional model, Francis C. Hammond receives 11.00 FTE positions. Staffing for the IA model provides cohorts with 4.00 FTE core content teachers.
The service minutes formula is applied at George Washington Middle School. The school receives 12.00 FTE under the traditional model based on service minutes.
Budget:
Compensation and Benefits: Compensation for middle schools will increase by $1.44 million and benefits are projected to increase by $0.64 million.
Non Compensation: Non compensation for middle schools is budgeted at $0.43 million for FY 2024. The budget will remain the same as the previous year.
As noted in the Financials section of the budget book, the FY 2024 Final Budget includes a step increase for all eligilble employees and a Market Rate Adjustment.
Further information about these changes can be found in the Salary and Employee Benefits pages of the Financials section.
Grant Support of Middle Schools:
Secondary schools also receive funding through grants that supplement the operating funds. In addition to the grant listed below, schools may apply for competitive grants to support specific programs.
Title I, Part A of the Elementary and Secondary Education Act (ESEA), as amended, provides financial assistance to local educational agencies (LEAs) and schools with high numbers or high percentages of children from low-income families to help ensure that all children meet challenging state academic standards. For FY 2024, Francis C. Hammond will receive Title I funding. These funds will be used for school-based personnel, staff development, translation, technology equipment and software, instructional supplies, and parental involvement activities. All items must supplement what is provided to all schools in the operating budget.
Page 271 ACPS FY 2024 Proposed Budget Middle Schools
Page 272 Middle Schools ACPS FY 2024 Proposed Budget
This page intentionally left blank.
Francis C. Hammond
School Contact
Anika Buster-Singleton, Acting Principal
4646 Seminary Road
Alexandria, Virginia 22304
Tel: 703-461-4100 | Fax: 703-461-4111
anika.buster-singleton@acps.k12.va.us
https://fchs.acps.k12.va.us/
Francis C. Hammond Middle School faculty and staff are committed to creating a nurturing academic learning environment that allows students to master the knowledge and skills needed to prepare them for success in high school and a variety of post-secondary and career opportunities. Francis C. Hammond Middle School’s vision is to be a model instructional environment for diverse adolescent learners. The mission of Francis C. Hammond Middle School through a partnership of students, families, staff, and community will ensure that every student has the skills to build a strong social and academic foundation in order to transition into a successful, responsible member of society. Francis C. Hammond’s mission and vision are grounded in the ACPS 2025 vision of “Empowering all students to thrive in a diverse and everchanging world.”
Exemplary Program:
AVID Secondary Schoolwide Model is a foundational component of the AVID College Readiness System and supports AVID’s mission and vision to provide a comprehensive model of success for all students, from elementary through higher education. The AVID Secondary model, which spans grades 6-12, includes a two-prong approach that supports students through the promotion of WICOR (writing, inquiry, collaboration, organization, and reading) across the entire campus. It also includes a selective elective course for interested students who have a desire to enroll in higher education. This course supports students’ rigorous course schedules by providing a tutorial component (supported by college-age tutors), college knowledge curriculum, and college visits. AVID Secondary is a schoolwide model that changes the trajectory of the entire school campus by focusing on the four areas necessary to ensure all students are poised for academic success: Instruction, Culture, Leadership, and Systems. Funding for this program is found in the AVID/ College Readiness budget.
Francis C. Hammond Middle School was the first school in the state of Virginia to offer AVID Excel. The goal of AVID Excel is to interrupt the path and change the trajectory of long-term English language learners by accelerating language acquisition, developing literacy, and placing AVID Excel Scholars on the path to high school AVID and college preparatory coursework. The mainstay of AVID Excel is the Elective class, which is designed to prepare middle school ELLs to enter AVID in the 9th grade. The program is supported by a 1.00 FTE AVID teacher and provides funding for instructional supplies. Support totals $0.14 million.
Page 273 ACPS FY 2024 Proposed Budget Middle Schools
Francis C. Hammond Middle School (Grades 6-8)
Page 274 Middle Schools ACPS FY 2024 Proposed Budget
Middle Schools
Section Title Program Roll-Up Group Title Position Title FY 2020 Final FTE FY 2021 Final FTE FY 2022 Final FTE FY 2023 Final FTE FY 2024 Proposed FTE Change FY 2023 to FY2024 Francis C. Hammond MS Alternative and At-Promise Education ALT EDUCATION TCHR 1.00 1.00 1.00 1.00 1.00Alternative and At-Promise Education Total 1.00 1.00 1.00 1.00 1.00Career and Technical Education BUSINESS TCHR 2.00 2.00 2.00 2.00 2.00CTE TECHNOLOGY TCHR - - - - 2.00 2.00 FAM&CONSMR TCHR 2.00 2.00 2.00 2.00 - (2.00) FAMILY & CONSUMER TCHR - - - - 2.00 2.00 TECHNOLOGY TCHR 2.00 2.00 2.00 2.00 - (2.00) Career and Technical Education Total 6.00 6.00 6.00 6.00 6.00Communications and Information Services LIBRARY MEDIA SPEC 2.00 2.00 2.00 2.00 2.00Communications and Information Services Total 2.00 2.00 2.00 2.00 2.00EL ACADEMIC PRINCIPAL - 1.00 1.00 1.00 1.00COACH - DUAL LANG - 0.50 - - -EL CORE CONTENT 1.00 1.00 - - -EL TCHR 17.00 16.00 12.00 12.00 11.00 (1.00) EL TCHR - - - - -EL TCHR - INTERNATIONAL ACADEMY - - 4.00 4.00 4.00PHYSICAL ED TCHR 1.00 1.00 - - -TITLE I - EL CORE CONTENT TCHR - - - 1.00 1.00TITLE I - INSTRUCTIONAL ASST II (EL) - - 1.00 - -TITLE I - TEACHER: EL CORE - ELA - - - 1.00 1.00TITLE I TEACHER: EL CORE - ELA - - 1.00 - -EL Total 19.00 19.50 19.00 19.00 18.00 (1.00) Enrichment and Electives ART TCHR 2.00 2.00 2.00 2.00 2.00DL INSTRUCTIONAL COACH - - 0.50 - -DL Spanish Language Arts Tchr - - - 1.00 1.00DRAMA TCHR 1.00 1.00 1.00 1.00 1.00INSTRUCTIONAL COACH - DL - - - - 1.00 1.00 MUSIC TCHR-INSTR 3.00 3.00 3.00 3.00 3.00MUSIC TCHR-VOCAL 1.00 1.00 1.00 1.00 1.00PHYSICAL ED TCHR 10.00 10.00 11.00 11.00 11.00TAG TCHR 1.00 1.00 1.00 1.00 1.00WORLD LANG TCHR - DL SPAN - - 1.00 - -WORLD LANG TCHR-CHIN 1.00 1.00 1.00 1.00 1.00WORLD LANG TCHR-FREN 2.00 2.00 2.00 2.00 2.00WORLD LANG TCHR-GERM 1.00 1.00 1.00 1.00 1.00WORLD LANG TCHR-LATN 1.00 1.00 1.00 1.00 1.00WORLD LANG TCHR-SPAN 5.00 5.00 4.00 4.00 4.00Enrichment and Electives Total 28.00 28.00 29.50 29.00 30.00 1.00 Exemplary Programs ALT EDUCATION TCHR - - - - -AVID TCHR 1.00 1.00 1.00 1.00 1.00SCHOOL IMPRVMT COACH - - - - -Exemplary Programs Total 1.00 1.00 1.00 1.00 1.00Improvement of Instruction INSTRCOACH-LITERACY 1.00 1.00 1.00 1.00 1.00INSTRCOACH-MATH 1.00 1.00 1.00 1.00 1.00MATH INTERVENT TCHR 1.00 - - - -SCHOOL IMPROVE COORD 1.00 1.00 - - -SPED ACCTABILITY SPC 1.00 1.00 - - -TITLE I - ACCOUNTABILITY SPECIALIST: SPED - - 1.00 1.00 - (1.00) TITLE I - COORDINATOR: SCHOOL IMPROVEMENT - - 1.00 1.00 1.00Improvement of Instruction Total 5.00 4.00 4.00 4.00 3.00 (1.00) Instructional Core DL SOCIAL STUDIES - - 1.00 - -DL SOCIAL STUDIES TCHR - - - 1.00 1.00EL CORE - CIVICS - - - - 1.00 1.00 EL CORE - ELA - - - - 2.00 2.00 EL CORE - MATH - - - - 3.00 3.00 EL CORE - READING SPECIALIST - - 1.00 1.00 1.00EL CORE - SCIENCE - - - - 2.00 2.00 EL CORE - SCIENCE & SOCIAL STUDIES - - - - 1.00 1.00 EL CORE - SOCIAL STUDIES - - - - 1.00 1.00 EL CORE CONTENT 9.00 9.00 - - -EL CORE CONTENT - CIVICS - - 1.00 1.00 - (1.00) EL CORE CONTENT - ELA - - 2.00 2.00 - (2.00) EL CORE CONTENT - MATH - - 3.00 3.00 - (3.00) EL CORE CONTENT - SCIENCE - - 2.00 2.00 - (2.00) EL CORE CONTENT - SCIENCE & SOCIAL STUDIES - - 1.00 1.00 - (1.00) EL CORE CONTENT - SOCIAL STUDIES - - 1.00 1.00 - (1.00) ENGLISH TCHR 12.00 12.00 12.00 12.00 12.00INTERVENTIONIST-MATH 2.00 2.00 - - -MATHEMATICS TCHR 13.00 13.00 13.00 13.00 13.00READING SPECIALIST - - - - 2.00 2.00 READING SPECIALIST - MIDDLE SCHOOL - - - 1.00 - (1.00) READING SPEC-MS 3.00 3.00 2.00 1.00 - (1.00) SCIENCE TCHR 12.00 12.00 12.00 12.00 12.00SOCIAL STUDIES TCHR 12.00 12.50 12.00 12.00 12.00 -
Francis C. Hammond MS Staffing
Middle Schools
Page 275 ACPS FY 2024 Proposed Budget Middle Schools
Section Title Program Roll-Up Group Title Position Title FY 2020 Final FTE FY 2021 Final FTE FY 2022 Final FTE FY 2023 Final FTE FY 2024 Proposed FTE Change FY 2023 to FY2024 TITLE I - INTERVENTIONIST: MATH - - 2.00 2.00 2.00Instructional Core Total 63.00 63.50 65.00 65.00 65.00Operations and Maintenance BUILDING ENGINEER II 1.00 1.00 1.00 1.00 1.00CUSTODIAN 8.00 8.00 7.00 6.00 6.00HEAD CUST I 1.00 1.00 - - -HEAD CUST II 1.00 1.00 2.00 1.00 2.00 1.00 HEAD CUSTODIAN II - - - 1.00 - (1.00) Operations and Maintenance Total 11.00 11.00 10.00 9.00 9.00Partnerships, Family and Community Engagement FAMILY LIAISON - BILINGUAL - - - - 1.00 1.00 PARENT LIAISON-BILIN 1.00 1.00 1.00 1.00 - (1.00) Partnerships, Family and Community Engagement Total 1.00 1.00 1.00 1.00 1.00School Administration ACADEMIC PRINCIPAL 3.00 3.00 3.00 3.00 3.00ADMIN ASSISTANT I 3.00 3.00 3.00 3.00 3.00CAMPUS MANAGER 1.00 1.00 1.00 1.00 1.00DEAN OF STUDENTS 2.00 2.00 2.00 2.00 2.00PRINCIPAL-MIDDLE 1.00 1.00 1.00 1.00 1.00SCH SECURITY OFFICER 6.00 6.00 - - -SCHOOL SECURITY OFFICER - - 6.00 6.00 5.00 (1.00) SUPPORT SPECIALIST I 1.00 1.00 1.00 1.00 1.00SUPPORT SPECIALISTII 1.00 1.00 1.00 1.00 1.00School Administration Total 18.00 18.00 18.00 18.00 17.00 (1.00) Special Education INST ASST II - 4.00 - - -INST ASST II AUT - 1.00 - - -INST ASST II ID - 3.00 - - -INSTRUCTIONAL ASSISTANT II - - 3.00 3.00 3.00INSTRUCTIONAL ASST II - - - - -INSTRUCTIONAL ASST II - AUTISM - - 1.00 1.00 1.00INSTRUCTIONAL ASST II - ID - - 3.00 3.00 3.00PARA II 4.00 - - - -PARA II AUT - - - - -PARA II ID 3.00 - - - -SPECIAL EDUCATION TCHR - - - - 8.00 8.00 SPED TCHR 8.00 8.00 8.00 8.00 - (8.00) SPED TCHR - AUTISM - - - 1.00 1.00SPED TCHR AUT 1.00 1.00 1.00 - -SPED TCHR ID 2.00 2.00 2.00 2.00 2.00TITLE I - ACCOUNTABILITY SPECIALIST: SPED - - - - 1.00 1.00 Special Education Total 18.00 19.00 18.00 18.00 19.00 1.00 Student Services DIRECTOR - MIDDLE SCHOOL GUIDANCE - - 1.00 1.00 1.00DIRECTOR MS-GUID 1.00 1.00 - - -PSYCHOLOGIST 1.00 1.00 1.00 1.00 1.00REGISTRAR I - - - - 1.00 1.00 REGISTRAR I-SEC 1.00 1.00 1.00 1.00 - (1.00) SCHOOL COUNSELOR 9.00 9.00 9.00 9.00 9.00SCHOOL NURSE 1.00 1.00 1.00 1.00 1.00SOCIAL WORKER 2.00 2.00 2.00 2.00 2.00TITLE I - SCHOOL COUNSELOR - - 0.50 1.00 0.50 (0.50) Student Services Total 15.00 15.00 15.50 16.00 15.50 (0.50) Francis C. Hammond MS Total 188.00 189.00 190.00 189.00 187.50 (1.50) Grand Total 188.00 189.00 190.00 189.00 187.50 (1.50)
Page 276 Middle Schools ACPS FY 2024 Proposed Budget
Section Title
Middle Schools
Page 277 ACPS FY 2024 Proposed Budget Middle Schools
Section Title
Middle Schools
Page 278 Middle Schools ACPS FY 2024 Proposed Budget Middle
Section Title
Schools
Middle Schools
Accreditation Benchmarks and School Status: Francis C. Hammond
Target School Quality Indicators for All Students*
*Schools must develop a multi-year plan for continuous improvement.
Accreditation statuses are based on the Standards of Learning (SOL) tests administered during the previous school year.
School Quality Indicators:
Level 1 = Meets or exceeds state standard or sufficient improvement
Level 2 = Near state standard or sufficient improvement
Level 3 = Below state standard
Too Small = Too few students in school or group to evaluate
Source: VDOE's School Accreditation Report.
Student Performance Data: Francis C. Hammond
Detailed SOL results are available on the Virginia Department of Education (VDOE) website.
Key: Yes-3YR = Met objective based on the three year average result.
Yes-R10 = Met objective by reducing failure rate by at least 10 percent.
Yes-MP = Maintain Progress: Current year pass rate equal to prior year’s pass rate, or stayed within 5%.
< = A group below state definition for personally identifiable results.
- = No data for group.
Source: VDOE's SOL Test Pass Rates and Other Results Report.
Page 279 ACPS FY 2024 Proposed Budget Middle Schools
20192020 20202021 20212022 20222023 20232024
English Lvl 1 & 2 NA NA Lvl 1 & 2 TBD Mathematics Lvl 1 & 2 NA NA Lvl 1 & 2 TBD Accreditation Status Accredited Accreditation Waived Accreditation Waived Accredited TBD
20182019 20192020 20202021 20212022 20222023 SOL: Percent of Students Passing Across All Grade Levels (Federal) English All Students 61 NA 45 54 TBD Asian Students 60 NA 51 60 TBD White Students 68 NA 70 70 TBD Students with Disabilities 29 NA 35 28 TBD Economically Disadvantaged Students 55 NA 38 48 TBD Limited English Proficient Students 17 NA 7 18 TBD Gap Group 1 - Students with Disabilities, English Learners, Economically Disadvantaged Students (unduplicated) NA NA NA NA TBD Gap Group 2 - Black Students 68 NA 52 59 TBD Gap Group 3 - Hispanic Students 51 NA 33 43 TBD Mathematics All Students 68 NA 32 42 TBD Asian Students 76 NA 40 45 TBD White Students 77 NA 55 56 TBD Students with Disabilities 38 NA 25 19 TBD Economically Disadvantaged Students 64 NA 25 39 TBD Limited English Proficient Students 42 NA 6 18 TBD Gap Group 1 - Students with Disabilities, English Learners, Economically Disadvantaged Students (unduplicated) NA NA NA NA TBD Gap Group 2 - Black Students 74 NA 37 46 TBD Gap Group 3 - Hispanic Students 58 NA 17 34 TBD
Page 280 Middle Schools ACPS FY 2024 Proposed Budget
This page intentionally left blank.
George Washington
Jeanette Vinson, Acting Principal
1005 Mount Vernon Avenue
Alexandria, Virginia 22301
Tel: 703-706-4500 | Fax: 703-299-7597
jeanette.vinson@acps.k12.va.us
https://gw.acps.k12.va.us/
George Washington is committed to providing a safe and nurturing environment where educating the whole child comes first. In partnership with parents and the community, George Washington will guide students to uphold the high standards of integrity, independence, and responsibility, while demonstrating civic virtues that enhance our shared community beliefs. Each student is engaged so that he or she can develop and become a caring individual, a lifelong learner, a steward of the community in today’s multicultural and technological world.
Exemplary Program:
Advancement Via Individual Determination (AVID) and AVID Excel is a system to prepare students in the academic middle years for rigorous classes in high school and four-year college eligibility. Both AVID and AVID Excel share a proven track record in bringing out the best in students, while also closing access, opportunity, and achievement gaps among students. The program is supported by a 2.00 FTE AVID teacher. Support totals $0.13 million. George Washington Middle School also offers a Dual Language Program, providing instruction in Social Studies and Spanish Language Arts.
Page 281 ACPS FY 2024 Proposed Budget Middle Schools
George Washington Middle School (Grades 6-8)
School Contact
Page 282 Middle Schools ACPS FY 2024 Proposed Budget
George Washington MS Staffing Section Title Program Roll-Up Group Title Position Title FY 2020 Final FTE FY 2021 Final FTE FY 2022 Final FTE FY 2023 Final FTE FY 2024 Proposed FTE Change FY 2023 to FY2024 George Washington MS Alternative and At-Promise Education ALT EDUCATION TCHR 1.00 1.00 1.00 1.00 1.00Alternative and At-Promise Education Total 1.00 1.00 1.00 1.00 1.00Career and Technical Education BUSINESS TCHR 1.00 1.00 1.00 1.00 1.00CTE TECHNOLOGY TCHR - - - - 2.00 2.00 CTE/TECH TCHR 1.00 1.00 1.00 1.00 - (1.00) FAM&CONSMR TCHR 1.00 1.00 1.00 1.00 - (1.00) FAMILY & CONSUMER TCHR - - - - 1.00 1.00 TECHNOLOGY TCHR 1.00 1.00 1.00 1.00 - (1.00) Career and Technical Education Total 4.00 4.00 4.00 4.00 4.00 - Communications and Information Services LIBRARY MEDIA SPEC 2.00 2.00 2.00 2.00 2.00Communications and Information Services Total 2.00 2.00 2.00 2.00 2.00EL EL TCHR 12.00 12.00 12.00 12.00 12.00PHYSICAL ED TCHR 1.00 - 1.00 1.00 1.00EL Total 13.00 12.00 13.00 13.00 13.00Enrichment and Electives ART TCHR 2.00 2.00 1.00 1.00 1.00DL INSTRUCTIONAL COACH - - 0.50 - -DL Spanish Language Arts Tchr - - 1.00 2.00 2.00DL SPANISH TCHR - - - - 1.00 1.00 DRAMA TCHR 1.00 1.00 1.00 1.00 1.00MUSIC TCHR-INSTR 3.00 3.00 3.00 3.00 3.00MUSIC TCHR-VOCAL 1.00 1.00 1.00 1.00 1.00PHYSICAL ED TCHR 8.00 10.00 9.00 9.00 9.00TAG TCHR 1.00 1.00 1.00 1.00 1.00WORLD LANG TCHR - 0.50 - - -WORLD LANG TCHR - DL SPAN - - 1.00 - -WORLD LANG TCHR-CHIN 1.00 1.00 1.00 1.00 1.00WORLD LANG TCHR-FREN 2.00 2.00 2.00 2.00 2.00WORLD LANG TCHR-GERM 1.00 1.00 1.00 1.00 1.00WORLD LANG TCHR-LATN 1.00 1.00 1.00 1.00 1.00WORLD LANG TCHR-SPAN 5.00 6.00 5.00 5.00 4.00 (1.00) Enrichment and Electives Total 26.00 29.50 28.50 28.00 28.00Exemplary Programs ALT EDUCATION TCHR - - - - -AVID TCHR 1.00 1.00 1.00 2.00 2.00AVID TCHR (ART TCHR #1765) - - 1.00 - -Exemplary Programs Total 1.00 1.00 2.00 2.00 2.00Improvement of Instruction INSTRCOACH-LITERACY 1.00 1.00 1.00 1.00 1.00INSTRCOACH-MATH 2.00 2.00 2.00 2.00 2.00Improvement of Instruction Total 3.00 3.00 3.00 3.00 3.00Instructional Core DL CIVICS & ECON TCHR - - - - 1.00 1.00 DL SOCIAL STUDIES - - 1.00 - -DL SOCIAL STUDIES TCHR - - - 2.00 2.00ENGLISH TCHR 13.00 12.00 12.00 12.00 12.00MATHEMATICS TCHR 12.00 13.00 13.00 13.00 13.00MATHEMATICS TEACHER 1.00 - - - -READING SPECIALIST - - - - 2.00 2.00 READING SPECIALIST - MIDDLE SCHOOL - - - 2.00 - (2.00) READING SPEC-MS 2.00 2.00 2.00 - -SCIENCE TCHR 11.00 12.00 12.00 12.00 12.00SOCIAL STUDIES TCHR 12.00 12.50 12.00 12.00 12.00Instructional Core Total 51.00 51.50 52.00 53.00 54.00 1.00 Operations and Maintenance BUILDING ENGINEER II 1.00 1.00 1.00 1.00 1.00CUSTODIAN 2.00 - - - -HEAD CUST I 1.00 - - - -Operations and Maintenance Total 4.00 1.00 1.00 1.00 1.00Partnerships, Family and Community Engagement FAMILY LIAISON - BILINGUAL - - - - 1.00 1.00 PARENT LIAISON-BILIN 1.00 1.00 1.00 1.00 - (1.00) Partnerships, Family and Community Engagement Total 1.00 1.00 1.00 1.00 1.00School Administration ACADEMIC PRINCIPAL 3.00 3.00 3.00 3.00 3.00ADMIN ASSISTANT I 3.00 3.00 3.00 3.00 3.00CAMPUS MANAGER 1.00 1.00 1.00 1.00 1.00DEAN OF STUDENTS 2.00 2.00 2.00 2.00 2.00PRINCIPAL-MIDDLE 1.00 1.00 1.00 1.00 1.00SCH SECURITY OFFICER 6.00 5.00 - - -SCHOOL SECURITY OFFICER - - 5.00 5.00 6.00 1.00 SUPPORT SPECIALIST I 1.00 1.00 1.00 1.00 1.00SUPPORT SPECIALISTII 1.00 1.00 1.00 1.00 1.00School Administration Total 18.00 17.00 17.00 17.00 18.00 1.00
Middle Schools
Middle Schools
Page 283 ACPS FY 2024 Proposed Budget Middle Schools
Section Title Program Roll-Up Group Title Position Title FY 2020 Final FTE FY 2021 Final FTE FY 2022 Final FTE FY 2023 Final FTE FY 2024 Proposed FTE Change FY 2023 to FY2024 Special Education ACCOUNTABILITY SPECIALIST - - - 1.00 - (1.00) INST ASST II - 3.00 - - -INST ASST II AUT - 3.00 - - -INST ASST II ED - 2.00 - - -INSTRUCTIONAL ASSISTANT II - - 3.00 3.00 3.00INSTRUCTIONAL ASST II - - - - -INSTRUCTIONAL ASST II - AUTISM - - 3.00 3.00 3.00INSTRUCTIONAL ASST II - ED - - 2.00 2.00 2.00PARA II 3.00 - - - -PARA II AUT 4.00 - - - -PARA II ED 3.00 - - - -SPECIAL EDUCATION TCHR - - - - 9.00 9.00 SPED ACCOUNTABILITY SPECIALIST - - - - 1.00 1.00 SPED TCHR 11.00 10.00 10.00 9.00 - (9.00) SPED TCHR - AUTISM - - - 2.00 2.00SPED TCHR AUT 2.00 2.00 2.00 - -SPED TCHR ED 3.00 3.00 2.00 2.00 3.00 1.00 Special Education Total 26.00 23.00 22.00 22.00 23.00 1.00 Student Services CLINIC ASSISTANT 1.00 1.00 1.00 1.00 1.00COUNSELOR - (1.00) - - -DIRECTOR - MIDDLE SCHOOL GUIDANCE - - 1.00 1.00 1.00DIRECTOR MS-GUID 1.00 1.00 - - -PSYCHOLOGIST 1.20 1.20 1.20 1.20 1.20REGISTRAR I - - - - 1.00 1.00 REGISTRAR I-SEC 1.00 1.00 1.00 1.00 - (1.00) SCHOOL COUNSELOR 6.00 7.00 6.00 6.00 6.00SCHOOL NURSE 1.00 1.00 1.00 1.00 1.00SOCIAL WORKER 2.00 2.00 2.00 2.00 2.00Student Services Total 13.20 13.20 13.20 13.20 13.20George Washington MS Total 163.20 159.20 159.70 160.20 163.20 3.00 Grand Total 163.20 159.20 159.70 160.20 163.20 3.00
Page 284 Middle Schools ACPS FY 2024 Proposed Budget
Section Title
Middle Schools
Page 285 ACPS FY 2024 Proposed Budget Middle Schools
Section Title
Middle Schools
Page 286 Middle Schools ACPS FY 2024 Proposed Budget Middle
Section Title
Schools
Middle Schools
Accreditation Benchmarks and School Status: George Washington
Target School Quality Indicators for All Students*
*Schools must develop a multi-year plan for continuous improvement.
Accreditation statuses are based on the Standards of Learning (SOL) tests administered during the previous school year.
School Quality Indicators:
Level 1 = Meets or exceeds state standard or sufficient improvement
Level 2 = Near state standard or sufficient improvement
Level 3 = Below state standard
Too Small = Too few students in school or group to evaluate
Source: VDOE's School Accreditation Report.
Student Performance Data: George Washington
Detailed SOL results are available on the Virginia Department of Education (VDOE) website.
Key: Yes-3YR = Met objective based on the three year average result.
Yes-R10 = Met objective by reducing failure rate by at least 10 percent.
Yes-MP = Maintain Progress: Current year pass rate equal to prior year’s pass rate, or stayed within 5%.
< = A group below state definition for personally identifiable results.
- = No data for group.
Source: VDOE's SOL Test Pass Rates and Other Results Report.
Page 287 ACPS FY 2024 Proposed Budget Middle Schools
20192020 20202021 20212022 20222023 20232024
English Lvl 1 & 2 NA NA Lvl 1 & 2 TBD Mathematics Lvl 1 & 2 NA NA Lvl 1 & 2 TBD Accreditation Status Accredited Accreditation Waived Accreditation Waived Accredited TBD
20182019 20192020 20202021 20212022 20222023 SOL: Percent of Students Passing Across All Grade Levels (Federal) English All Students 73 NA 70 67 TBD Asian Students 96 NA 92 82 TBD White Students 94 NA 93 94 TBD Students with Disabilities 41 NA 30 19 TBD Economically Disadvantaged Students 52 NA 39 41 TBD Limited English Proficient Students 15 NA 7 12 TBD Gap Group 1 - Students with Disabilities, English Learners, Economically Disadvantaged Students (unduplicated) NA NA NA NA TBD Gap Group 2 - Black Students 64 NA 50 50 TBD Gap Group 3 - Hispanic Students 51 NA 38 44 TBD Mathematics All Students 75 NA 54 57 TBD Asian Students 96 NA 86 74 TBD White Students 94 NA 79 88 TBD Students with Disabilities 43 NA 20 20 TBD Economically Disadvantaged Students 56 NA 23 32 TBD Limited English Proficient Students 30 NA 5 13 TBD Gap Group 1 - Students with Disabilities, English Learners, Economically Disadvantaged Students (unduplicated) NA NA NA NA TBD Gap Group 2 - Black Students 62 NA 28 37 TBD Gap Group 3 - Hispanic Students 57 NA 24 35 TBD
Page 288 Middle Schools ACPS FY 2024 Proposed Budget
This page intentionally left blank.
High School Summary
Secondary Schools Overview
Alexandria City High School is the only high school within the ACPS system. Alexandria City High School is comprised of three campuses: King Street campus, Minnie Howard campus, and the Satellite campus. The school also
oversees the Chance for Change Program, the division-wide Athletics Program and the Financial Aid Program. Other major programs can be seen in the table below.
Gr 9 Advancement Via Individual Determination IB Middle Years Programme Science, Tech, Eng, Math
Alexandria City High School, King Street Campus
Peter Balas, Executive Principal Christopher Speich, Acting Campus Administrator
https://achs.acps.k12.va.us/campus es/minnie-howard-campus
3330 King Street Alexandria, VA 22302 Tel: 703-824-6800
Fax: 703-824-6826
https://achs.acps.k12.va.us/campus es/king-street-campus
Gr 10-12 Advancement Via Individual Determination IB Middle Years Programme Advanced Placement City-Wide Special Education Head Start
Alexandria City High School, Satellite Campus
Peter Balas, Executive Principal Fredericka Smith, Campus Administrator
1340 Braddock Place (2nd Floor) Alexandria, VA 22314
Tel: 703-619-8400
Fax: 703-824-6826
https://achs.acps.k12.va.us/campus es/satellite-campus
Gr 9-12 Edgenuity and Florida Virtual Courseware Partnership with the Urban Alliance and Teen Parent Program
Page 289 ACPS FY 2024 Proposed Budget High School
/ Campus AdministratorAddress and Contact Grades Served Major Programs
Campus
School NamePrincipal
Alexandria City High School, Minnie Howard
Campus Administrator 3801 West Braddock Road Alexandria, VA 22302 Tel:
Peter Balas, Executive Principal Alexander Duncan,
703-824-6750 Fax: 703-824-6781
Enrollment and Demographics:
High School enrollment, for ninth through twelfth grades, was 4,506 as of September 30, 2022. Next year, enrollment is projected to increase by 0.3 percent to a total of 4,521. Alexandria City H.S. has experienced steady growth in enrollment over the past few years, as displayed in the chart below.
With the increasing enrollment, number of students with additional needs continues to
grow as well. Significant numbers of English learner (EL) students attend ACPS schools, as displayed in the chart below.
In total, the number of EL students at the high school level is projected to increase slightly by 3.3% percent, to a total of 1,345 students. Additional information describing the EL program is located within the Information and Department sections of the budget book.
Page 290 High School ACPS FY 2024 Proposed Budget
High School
500 1,000 1,500 2,000 2,500 3,000 3,500 4,000 ACHS, Minnie Howard CampusAlexandria City High School Total Enrollment High School by Fiscal Year FY 2020 FY 2021 FY 2022 FY 2023 FY 2024 Projected200 400 600 800 1,000 1,200 1,400 ACHS, Minnie Howard CampusAlexandria City High School English Learner Enrollment High School by Fiscal Year FY 2020 FY 2021 FY 2022 FY 2023 FY 2024 Projected
The trends of numbers of students requiring special education (SPED) services are shown by campus in the table above.
The number of students receiving special education services at the high school level is projected to increase by 0.2 percent, to a total of 461. For more information on specialized instruction, please refer to the Information and Department sections of the budget book.
Many of the students at Alexandria City H.S. come from families that are economically disadvantaged; this is reflected in the number of students qualifying for free and reduced-price meals, shown in the table below.
Assuming that the proportion of students qualifying for free and reduced-price meals stays constant, the FY 2024 projected number of students meeting this criteria will increase to 2,602 students.
Page 291 ACPS FY 2024 Proposed Budget High School
High School
50 100 150 200 250 300 350 400 ACHS,
Special
FY 2020 FY 2021 FY 2022 FY 2023 FY 2024 Projected500 1,000 1,500 2,000 2,500 ACHS, Minnie Howard CampusAlexandria City High School Free and Reduced-Price Meal Enrollment High School by Fiscal Year FY 2020 FY 2021 FY 2022 FY 2023 FY 2024 Projected
Minnie Howard CampusAlexandria City High School
Education Enrollment High School by Fiscal Year
Staffing:
Staffing at high school will increase by 5.20 FTEs to 437.33 FTEs.
Secondary core and elective classes are staffed based on class enrollment. As a result of staffing adjustments associated with the leadership reorganization, increased enrollment, and major changes in staff scheduling.
Specialized Instruction: The allocation of special education staffing is determined by two factors: disability category and level of service. Beginning in FY 2017, to further support inclusion and co-teaching across content areas, the staffing formula was revised by adjusting the service intensity point values which determine staff ratios. For FY 2024, special education staffing levels will remain at 61.00 FTEs. Special education Instructional Support I and III positions are a central pool in the Schoolwide resources section. Speech language pathologist (SLP) positions are housed in a central pool in the Specialized Instruction Department. Positions will be allocated from these two pools based on the needs of individual students.
English Learners: An International Academy (IA) was created in 2011 to support and empower English learners with content mastery and language proficiency through rigorous, experiential, and projectbased curricula for college and workforce readiness and to prepare them to become both contributing members of our community and conscientious global citizens of the future.
Staffing for the IA at the King Street campus provides each of six cohorts with core content teachers and EL support teachers. In addition, both campuses are allocated additional EL teacher FTE to provide services to students who do not participate in the International Academy. For FY 2024, EL staffing levels will be 46, an increase of 4.00 FTEs.
Budget:
Compensation and Benefits: Compensation and benefits for the Alexandria City High School (ACHS) will increase by $2.46 million.
As noted in the Financials section of the budget book, the FY 2024 Proposed Budget includes a step increase for all eligilble employees and a Market Rate Adjustment.
Further information about these changes can be found in the Salary and Employee Benefits pages of the Financials section.
Non Compensation: Non compensation for the high school is budgeted at $1.45 million for FY 2024.
The Alexandria City Chance for Change Campus is an alternative placement for sudents in grade 9-12 wishing to have a smaller learning environmen as well as an interim placement for students who have been suspended and the results of a hearing determined a change of placement in grades 6-12. The staffing and budget for the Alexandria City Chance for Change Campus can be found under Alternative Program Section.
Page 292 High School ACPS FY 2024 Proposed Budget
High School
Page 293 ACPS FY 2024 Proposed Budget High School
This page intentionally left blank.
Alexandria City High School
Alexandria City High School (Grades 9-12)
Peter Balas, Executive Principal
3330 King Street
Alexandria, Virginia 22302
Tel: 703-824-6800 | Fax: 703-824-6826
peter.balas@acps.k12.va.us
https://achs.acps.k12.va.us/
• Minnie Howard Campus
3801 W. Braddock Road
Alexandria, VA 22302
Tel: 703-824-6750 | Fax: 703-824-6781
https://achs.acps.k12.va.us/campuses/ minnie-howard-campus
• King Street Campus
3330 King Street
Alexandria, Virginia 22302
Tel: 703-824-6800 | Fax: 703-824-6826
https://achs.acps.k12.va.us/campuses/ king-street-campus
• Satellite Campus
1340 Braddock Place
Alexandria, Virginia 22314
Tel: 703-619-8400
acsatellite@acps.k12.va.us
https://achs.acps.k12.va.us/campuses/ satellite-campus
• Chance for Change Campus
216 S. Peyton Street
Alexandria, VA 22314
Tel: 703-888-1204
https://achs.acps.k12.va.us/campuses/ chance-for-change
• Athletics and Student Activities
3330 King Street
Alexandria, Virginia 22302
Tel: 703-824-6800 | Fax: 703-824-6826
• Scholarship Fund of Alexandria
3330 King Street
Alexandria, Virginia 22302
Tel: 703-824-6800 | Fax: 703-824-6826
Alexandria City High School
Alexandria City High School is committed to the effective and efficient utilization of funding and resources to meet the goals and objectives of our school and the division. Through the execution of our comprehensive school improvement plans, we prepare students with the requisite skills necessary to compete and succeed in the global marketplace by providing a rigorous and challenging academic curriculum; a diverse selection of extracurricular opportunities and experiences; access to the most current technologies; College and Career preparatory and transition programs; and a spectrum of services focusing on individualized care, goal setting, and planning. Alexandria City High School is comprised of four school campuses: King Street, Minnie Howard, Chance for Change and Satellite, with a total of more than 4,500 students in grades 9-12. Alexandria City High School is committed to its overarching school improvement goal of increasing levels of student engagement that will result in gains in academics, attendance, conduct, and
Page 294 High School ACPS FY 2024 Proposed Budget
School Contact
school involvement. The commitment to student engagement, through project-based learning (PBL) and Kagan structures, is evident through staff professional learning and coaching models, which will then positively impact graduation and completion index rates. Alexandria City High School enjoys many partnerships that benefit our student population, including Communities in Schools, DASH Transit and local colleges and universities, such as Northern Virginia Community College, Virginia Tech and the George Washington University. All students are able to choose from a number of extracurricular activities and athletics. Our many sports teams, athletic clubs, and afterschool clubs offer students many opportunities for participation.
The Alexandria City King Street Campus is a fully comprehensive high school with thriving Career and Technical Education offerings, Advanced Placement (AP) and Dual Enrollment offerings, and a wide array of electives. The student body is divided into academies, each including an administrator, school counselors, and social worker supports. The King Street Campus is also home to the International Academy, which supports students who are new immigrants to the country. The International Academy is fully supported by administrators, school counselors, and social workers. The International Academy partners with the Internationals Network of Public Schools, which provides staff with high levels of training for this population around language acquisition and social/emotional support. Students at Alexandria City High School also have opportunities to take online course offerings under the guidance and support of an online learning mentor.
The Alexandria City Minnie Howard Campus currently houses ninth grade students. Students are divided into academies that have the necessary support from teachers, administrators, school counselors, and social workers. Minnie Howard’s setting assists students in managing the crucial transition year from middle school to high school. Ninth grade students are able to take AP courses and the beginning courses of the STEM Academy. In addition, students at the Minnie Howard Campus have the flexibility to take electives or more advanced offerings at the King Street Campus and are transported by bus throughout the day. Students have the option to begin coursework in the GW Health Sciences field while at Minnie Howard.
The Alexandria City Chance for Change Campus is an alternative placement for students wishing to have a smaller learning environment or who have been placed based on student need and behavior. Students in grades 9-12 can apply to be transferred to this campus should they feel a traditional high school setting is too overwhelming. The Chance for Change Campus is fully equipped with teaching staff and a School Support Team to support our students. This campus also serves as an interim placement for students who have been suspended and the results of a hearing determined a change of placement in grades 6-12.
The Alexandria City Satellite Campus is designed to offer a flexible schedule for students within a non-traditional school setting. Students apply for admission to Satellite and may do so for a variety of reasons, such as having an aspiration to graduate early, a need to recover credit, a desire for a smaller setting, student health conditions that require flexible scheduling options, a competitive athletic schedule that also requires instructional flexibility, or a responsibility for helping to support their family that may conflict with traditional school schedules. Many Satellite students are considered “hybrid”, and attend one to two classes at Alexandria City King Street Campus and Alexandria City Satellite Campus simultaneously. Satellite provides every student with an academic adviser who monitors the student’s academic progress, supports their academic development, takes daily attendance, and engages their advisory caseload in a
Page 295 ACPS FY 2024 Proposed Budget High School
High School
variety of team and relationship building activities that encourage student success. Additionally, Satellite offers socioemotional supports for students, and student groups, as well as opportunities for hands-on, experiential learning activities such as blended learning sessions, field trips to museums, colleges, universities, historical landmarks, and Alexandria sustainability facilities (these activities are conducted virtually during Virtual Plus+ schedule), immersive science labs, a Satellite student government, and student-led extracurricular activities. Courses are offered online and supplemented on site with face-to-face instruction. This blend of online and face-to-face instruction is termed as “blended learning.” Current Alexandria City students in grades 9-12 may apply via their school counselors for admission to Satellite.
Exemplary Programs
Advancement Via Individual Determination (AVID) is a system to prepare students in the academic middle for four-year college eligibility. It has a proven track record in bringing out the best in students and in closing the access, opportunity, and achievement gap with students. The program at Alexandria City King Street Campus is supported by 2.00 FTE AVID teachers. The program at Alexandria City Minnie Howard Campus is supported by 1.00 FTE AVID teacher.
The STEM Academy is a small learning community that was developed to reach students who have a deep interest in STEM topics. The mission is to create a student-centered, inquiry-based environment that is both challenging and supportive so that students are excited to come to school and can become successful life-long learners. The Alexandria City King Street and Minnie Howard Campuses support this program. Non-compensation support totals $0.04 million for instructional supplies, public carriers, and course and event fees.
The Governor’s Health Sciences Academy at Alexandria City High School is a school-within-aschool. The academy has been designed through a collaborative effort between ACPS and The George Washington University. Through this collaboration, students have the ability to receive up to 18 college credits from The GW School of Medicine and Health Sciences. Students also have the opportunity to start a career pathway that leads to an associates and/or bachelor’s degree and career-related industry certifications. Students who successfully complete an academy pathway are offered guaranteed admissions to the GW School of Medicine and Health Sciences.
The Academy of Finance (AOF) is part of the Business & Information Technology program. It prepares students for post-secondary education and careers through academic learning within a theme-based curriculum centered around the financial services industry. AOF courses include AOF Introduction to Financial Services, AOF Economics and Personal Finance, and AOF Introduction to Business & International Finance (dual enrollment). On completion, students will receive a National Academy Foundation Certificate of Financial Studies. Alexandria City is one of only two high schools in Virginia that offers this program.
Page 296 High School ACPS FY 2024 Proposed Budget
High School
High School
Page 297 ACPS FY 2024 Proposed Budget High School
Alexandria City High School Staffing Section TitleProgram Roll-Up Group TitlePosition Title FY 2020 Final FTE FY 2021 Final FTE FY 2022 Final FTE FY 2023 Final FTE FY 2024 Proposed FTE Change FY 2023 to FY2024 Alexandria City HS King St Alternative and At-Promise Education COORD - STUDENT SPPT- - 1.00 1.00 - (1.00) COORD - STUDENT SUPPORT- - - - 1.00 1.00 COORD STDT SUP1.00 2.00 - - -INTERVENTION SPECLST1.00 - - - -ONLINE TCHR- 1.00 1.00 1.00 1.00SPECIALIST - CRISIS INTERVENTION/RESTORATIVE PRACTICES - - - 1.00 1.00Alternative and At-Promise Education Total2.00 3.00 2.00 3.00 3.00Career and Technical Education BUSINESS & INFORMATION TECH TCHR- - - 1.00 0.80 (0.20) BUSINESS TCHR10.00 10.00 10.00 10.00 9.00 (1.00) CTE SPECIALIST1.00 1.00 - - -CTE TECHNOLOGY TCHR- - - - 6.00 6.00 CTE/DUAL ENRL SPEC- - - - -DUAL ENRL/ACDMY COOR1.00 1.00 1.00 - -ECONOMICS & PERSONAL FINANCE TCHR- - - 1.00 1.00FAM&CONSMR SCI TCHR2.00 - - - -FAM&CONSMR TCHR- 3.00 3.00 3.00 - (3.00) FAMILY & CONSUMER TCHR- - - - 3.00 3.00 GRAPHIC DESIGN TCHR- - - - 1.00 1.00 HEALTH OCCUP TCHR3.60 3.60 - - -HEALTH OCCUPATIONS TCHR- - 5.60 4.60 5.00 0.40 HLTH SCIENCE TCHR- 2.00 - - -MARKETING ED TCHR3.00 3.00 3.00 3.00 3.00TECHNOLOGY TCHR6.00 6.00 6.00 6.00 - (6.00) TRADES & INDUSTRY TCHR- - - - 8.00 8.00 TRADES&INDUSTRY TCHR8.00 8.00 8.00 8.00 - (8.00) Career and Technical Education Total34.60 37.60 36.60 36.60 36.80 0.20 Communications and Information Services LIBRARY MEDIA ASSIST1.50 1.50 1.00 1.00 1.00LIBRARY MEDIA SPEC3.00 3.00 3.00 3.00 2.00 (1.00) Communications and Information Services Total4.50 4.50 4.00 4.00 3.00 (1.00) EL CAMPUS ADMINISTRATOR- 1.00 - - -CORDT PROG EVAL&DATA2.00 - - - -EL SCHOOL COUNSELOR4.00 - - - -EL TCHR26.00 5.00 5.00 5.00 8.00 3.00 ESSER II - EL TEACHER (ACHS)- - - - 1.00 1.00 FAMILY ENGMENT SPCL- 1.00 - - -PARENT LIAISON1.00 - - - -SPECIALIST - FAMILY ENGAGEMENT- - 1.00 1.00 1.00EL Total 33.00 7.00 6.00 6.00 10.00 4.00 Enrichment and Electives ART TCHR4.00 4.00 5.00 5.50 6.00 0.50 ASST DIR-STDT ACTIV1.00 1.00 - - -DRAMA TCHR2.00 3.00 2.00 2.00 2.00FAMILY LIFE TCHR1.00 - - - -MUSIC TCHR-INSTR3.00 3.00 3.00 3.00 3.00MUSIC TCHR-VOCAL1.00 1.00 1.00 1.00 1.00PHYSICAL ED TCHR8.00 8.00 8.00 8.00 8.00ROTC INSTRUCTOR3.00 3.00 3.00 3.00 3.00SPECIALIST - TRUANCY OUTREACH- - 1.00 1.00 1.00TRUANCY OUTREACH SPC1.00 1.00 - - -WORLD LANG TCHR-CHIN1.00 1.00 1.00 1.00 1.00WORLD LANG TCHR-FREN2.00 2.00 2.00 2.00 2.00WORLD LANG TCHR-GERM1.00 1.00 1.00 1.00 1.00WORLD LANG TCHR-LATN1.00 1.00 1.00 1.00 1.00WORLD LANG TCHR-SPAN8.00 7.00 7.00 6.00 6.00Enrichment and Electives Total37.00 36.00 35.00 34.50 35.00 0.50 Exemplary Programs AVID TCHR2.00 2.00 2.00 2.00 2.00Exemplary Programs Total3.00 2.00 2.00 2.00 2.00Financial Aid ADMIN,SCHOLSHIP FUND1.00 1.00 1.00 - -SCHOLARSHIP FUND ADMINISTRATOR- - - 1.00 1.00Financial Aid Total 1.00 1.00 1.00 1.00 1.00Instructional Core COORD - TESTING- - 1.00 1.00 - (1.00) COORD-TESTING1.00 1.00 - - -EL CORE CONTENT10.00 - - - -ENGLISH TCHR20.00 20.00 20.00 20.00 20.00MATHEMATICS TCHR23.00 20.00 20.00 18.50 19.50 1.00 PARAPROFESSIONAL I1.00 - - - -SCIENCE TCHR22.00 21.00 22.00 22.00 22.00SOCIAL STUDIES TCHR25.00 21.00 21.00 21.00 21.00Instructional Core Total102.00 83.00 84.00 82.50 82.50Operations and Maintenance BLDG SERVICES SUPR1.00 1.00 1.00 1.00 - (1.00) BLDG USE COORD0.60 0.60 - - -BUILDING ENGINEER II2.00 2.00 2.00 2.00 2.00BUILDING SERVICES SUPERVISOR- - - - 1.00 1.00 COORD - BLDG USE- - 0.60 0.60 0.60Operations and Maintenance Total3.60 3.60 3.60 3.60 3.60School Administration ADMIN ASSISTANT I8.00 7.00 6.00 6.00 7.00 1.00
Page 298 High School ACPS FY 2024 Proposed Budget
Section TitleProgram Roll-Up Group TitlePosition Title FY 2020 Final FTE FY 2021 Final FTE FY 2022 Final FTE FY 2023 Final FTE FY 2024 Proposed FTE Change FY 2023 to FY2024 ADMIN ASSISTANT II2.00 2.00 2.00 1.00 1.00ADMIN INSTR&STDT SUP8.00 6.00 6.00 - -ADMINISTRATIVE ASSISTANT I- - 1.00 1.00 - (1.00) ASST PRINCIPAL - HIGH SCHOOL- - - 6.00 6.00CAMPUS ADMINISTRATOR- - 1.00 1.00 1.00DIRECTOR STDACTIV1.00 1.00 - - -EXECUTIVE PRINCIPAL - HIGH SCHOOL- - - 1.00 1.00FINANCIAL SUPPORT SPECIALIST - HIGH SCHOOL TREASURER - - - 1.00 1.00LEAD ADMIN, SCH IMPR1.00 1.00 1.00 - -LEAD ADMINISTRATOR - SCHOOL IMPROVEMENT- - - 1.00 1.00LEAD ADMN FOR OPERTN1.00 1.00 - - -LEAD ADMN-CURR,INSTR1.00 - - - -PRINCIPAL-HIGHSCHL1.00 1.00 1.00 - -SCH SECURITY OFFICER7.00 3.00 - - -SCHOOL SECURITY OFFICER- - 3.00 3.00 4.00 1.00 SUPPORT SPECIALISTII2.00 1.00 1.00 1.00 1.00School Administration Total32.00 23.00 22.00 22.00 23.00 1.00 Special Education ADMIN ASSISTANT I1.00 - - - -INST ASST II- 3.00 - - -INST ASST II AUT- 2.00 - - -INST ASST II ED- 3.00 - - -INST ASST II ID- 8.00 - - -INST ASST II MD- 2.00 - - -INSTRUCTIONAL ASSISTANT II- - 3.00 3.00 3.00INSTRUCTIONAL ASST II - AUTISM- - 1.00 1.00 2.00 1.00 INSTRUCTIONAL ASST II - ED- - 3.00 3.00 3.00INSTRUCTIONAL ASST II - ID- - 7.00 7.00 8.00 1.00 INSTRUCTIONAL ASST II - MD- - 2.00 2.00 2.00LEAD ADMINISTRATOR - SPECIALIZED INSTRUCTIO - - - 1.00 1.00LEAD ADMN FOR SPECIALIZED INSTRUCTION- - 1.00 - -LEAD TCHR SPEC EDUC1.00 1.00 1.00 1.00 1.00PARA II4.00 - - - -PARA II AUT1.00 - - 1.00 - (1.00) PARA II ED2.00 - - - -PARA II ID5.00 - - 1.00 - (1.00) PARA II MD2.00 - - - -SPECIAL EDUCATION TCHR- - - - 17.00 17.00 SPED ACCOUNTABILITY SPECIALIST- - - - 1.00 1.00 SPED ACCTABILITY SPC1.00 1.00 1.00 1.00 - (1.00) SPED TCHR16.00 16.00 17.00 17.00 - (17.00) SPED TCHR - AUTISM- - - 2.00 2.00SPED TCHR AUT1.00 2.00 2.00 - -SPED TCHR ED4.00 3.00 4.00 4.00 4.00SPED TCHR ID6.00 6.00 6.00 6.00 6.00SPED TCHR MD1.00 1.00 1.00 1.00 1.00Special Education Total 45.00 48.00 49.00 51.00 51.00Student Services ADMIN ASSISTANT I1.00 1.00 1.00 1.00 1.00ATTENDANCE TECH SEC1.00 1.00 1.00 1.00 1.00CLINIC ASSISTANT1.28 0.13 0.13 0.13 0.13COLLEGE & CAREER CENTER SUPPORT SPECIALIS - - - 1.00 1.00COLLEGE/CAREER COUNS0.50 1.00 - - -COORD - TESTING- - 1.00 1.00 - (1.00) COORD TESTING2.00 2.00 - - -COORDINATOR - TESTING- - 1.00 - -DIRECTOR - SECONDARY GUIDANCE- - 1.00 1.00 1.00DIRECTOR HS-GUID1.00 1.00 - - -PSYCHOLOGIST1.50 1.50 1.50 1.50 2.00 0.50 REGISTRAR I1.00 1.00 1.00 1.00 1.00REGISTRAR II1.00 - - - -SCHOOL COUNSELOR12.50 12.00 13.00 14.00 13.00 (1.00) SCHOOL NURSE2.50 2.50 2.50 2.00 2.00SENIOR CLINIC ASSISTANT- - 1.00 1.00 1.00SENIOR REGISTRAR- - 1.00 1.00 1.00SOCIAL WORKER4.00 3.00 3.00 3.00 3.00SR CLINIC ASSISTANT- 1.00 - - -SR REGISTRAR - 1.00 - - -SUPPORT SPECIALISTII1.00 1.00 1.00 1.00 1.00TESTING COORDINATOR- - - - 2.00 2.00 Student Services Total 30.28 29.13 29.13 29.63 30.13 0.50 Alexandria City HS King St Total 327.98 277.83 274.33 275.83 281.03 5.20 Alexandria City HS Athletics Enrichment and Electives ADMIN ASSISTANT I- - - - -ADMIN ASSISTANT II1.00 1.00 1.00 1.00 1.00ASST DIRECTOR - STUDENT ACTIVITIES- - 1.00 1.00 1.00ATHLETIC TRAINER1.00 1.00 1.00 1.00 1.00DIRECTOR - ATHLETICS- - 1.00 1.00 1.00DIRECTOR - STUDENT ACTIVITIES- - 1.00 1.00 - (1.00) EXEC DIRECTOR - ATHLETICS & STUDENT ACTIVIT - - - - 1.00 1.00
High School
High School
Page 299 ACPS FY 2024 Proposed Budget High School
Section TitleProgram Roll-Up Group TitlePosition Title FY 2020 Final FTE FY 2021 Final FTE FY 2022 Final FTE FY 2023 Final FTE FY 2024 Proposed FTE Change FY 2023 to FY2024 RESOURCE TCHR/ATH- - - - -Enrichment and Electives Total2.00 2.00 5.00 5.00 5.00School Administration ASST DIR-ATHL&STDACT1.00 1.00 - - -School Administration Total1.00 1.00 - - -Alexandria City HS Athletics Total 3.00 3.00 5.00 5.00 5.00Alexandria City HS Minnie Hwrd Alternative and At-Promise Education COORD - STUDENT SPPT- - 1.00 1.00 - (1.00) COORD - STUDENT SUPPORT- - - - 1.00 1.00 Alternative and At-Promise Education Total- - 1.00 1.00 1.00Career and Technical Education COMPTR INFO SYS TCHR- 1.00 1.00 1.00 1.00CTE TECHNOLOGY TCHR- - - - 1.00 1.00 HEALTH OCCUP TCHR1.00 1.00 - - -HEALTH OCCUPATIONS TCHR- - 1.00 1.00 - (1.00) TECHNOLOGY TCHR1.00 1.00 1.00 1.00 - (1.00) Career and Technical Education Total2.00 3.00 3.00 3.00 2.00 (1.00) Communications and Information Services LIBRARY MEDIA ASSIST0.50 0.50 1.00 1.00 1.00LIBRARY MEDIA SPEC1.00 1.00 1.00 1.00 1.00Communications and Information Services Total1.50 1.50 2.00 2.00 2.00EL EL TCHR5.00 5.00 5.00 5.00 5.00EL Total 5.00 5.00 5.00 5.00 5.00Enrichment and Electives ART TCHR1.00 1.00 1.00 1.00 1.00FAMILY LIFE TCHR1.00 - - - -PHYSICAL ED TCHR6.00 6.00 6.00 6.00 6.00WORLD LANG TCHR-FREN1.50 1.50 1.50 1.50 1.50WORLD LANG TCHR-GERM1.00 1.00 1.00 1.00 1.00WORLD LANG TCHR-SPAN5.00 4.00 4.00 5.00 5.00Enrichment and Electives Total15.50 13.50 13.50 14.50 14.50Exemplary Programs AVID TCHR1.00 1.00 1.00 1.00 1.00IN-SCHOOL SUSP TCHR1.00 - - - -Exemplary Programs Total2.00 1.00 1.00 1.00 1.00Instructional Core EL CORE CONTENT1.00 - - - -ENGLISH TCHR8.00 8.00 8.00 8.00 8.00HISTORY TCHR- - - - -MATHEMATICS TCHR8.00 8.00 8.00 8.00 8.00READING SPECIALIST- - - - 1.00 1.00 READING TCHR1.50 1.00 1.00 1.00 - (1.00) SCIENCE TCHR8.00 8.00 8.00 8.00 8.00SOCIAL STUDIES TCHR8.00 8.00 8.00 8.00 8.00Instructional Core Total 34.50 33.00 33.00 33.00 33.00Operations and Maintenance BUILDING ENGINEER II1.00 1.00 1.00 1.00 1.00Operations and Maintenance Total1.00 1.00 1.00 1.00 1.00School Administration ADMIN ASSISTANT I3.00 3.00 3.00 3.00 3.00ADMIN INSTR&STDT SUP2.00 2.00 2.00 - -ASST PRINCIPAL - HIGH SCHOOL- - - 2.00 2.00CAMPUS ADMINISTRATOR- 1.00 1.00 1.00 1.00COORDINATOR - DATA & PROGRAM EVALUATION- - 1.00 1.00 - (1.00) CORDT PRG EVAL&DATA1.00 1.00 - - -LEAD ADMINISTRATOR- - - - 1.00 1.00 LEAD ADMINISTRATOR - OPERATIONS- - - 1.00 - (1.00) LEAD ADMN FOR OPERTN1.00 1.00 1.00 - -SCH SECURITY OFFICER1.00 2.00 - - -SCHOOL SECURITY OFFICER- - 2.00 2.00 2.00SUPPORT SPECIALISTII1.00 1.00 1.00 1.00 1.00School Administration Total9.00 11.00 11.00 11.00 10.00 (1.00) Special Education INST ASST II- 2.00 - - -INSTRUCTIONAL ASSISTANT II- - 2.00 2.00 2.00PARA II2.00 - - - -SPECIAL EDUCATION TCHR- - - - 8.00 8.00 SPED TCHR8.00 8.00 8.00 8.00 - (8.00) Special Education Total 10.00 10.00 10.00 10.00 10.00Student Services ASST DIRECTOR - SECONDARY GUIDANCE- - - - 1.00 1.00 COORD - TESTING- - 1.00 1.00 - (1.00) COORD TESTING- - - - -COORDINATOR - DUAL ENROLLMENT- - - 1.00 - (1.00) LEAD COORDINATOR - TESTING & GRADUATION R - - - - 1.00 1.00 PSYCHOLOGIST0.80 0.80 0.80 0.80 0.80REGISTRAR I1.00 1.00 1.00 1.00 1.00SCHOOL COUNSELOR4.00 4.00 4.00 4.00 4.00SCHOOL NURSE1.00 1.00 1.00 1.00 1.00SOCIAL WORKER2.00 2.00 2.00 2.00 2.00TESTING COORDINATOR1.00 1.00 - - 1.00 1.00 Student Services Total 9.80 9.80 9.80 10.80 11.80 1.00 Alexandria City HS Minnie Hwrd Total 90.30 88.80 90.30 92.30 91.30 (1.00) Alexandria City HS Intl Acadmy EL ADMIN ASSISTANT I- - 2.00 2.00 2.00ADMIN INSTR&STDT SUP- - 2.00 - -ASST PRINCIPAL - HIGH SCHOOL- - - 2.00 2.00 -
Page 300 High School ACPS FY 2024 Proposed Budget
Section TitleProgram Roll-Up Group TitlePosition Title FY 2020 Final FTE FY 2021 Final FTE FY 2022 Final FTE FY 2023 Final FTE FY 2024 Proposed FTE Change FY 2023 to FY2024 COORD - DATA & PROGRAM EVALUATION- - - - 1.00 1.00 COORDINATOR - DATA & PROGRAM EVALUATION- - 1.00 1.00 - (1.00) CORDT PROG EVAL&DATA- 1.00 - - -EL SCHOOL COUNSELOR- - 4.00 3.00 3.00EL TCHR- 21.00 21.00 21.00 21.00INTERVENTION SPECLST- 1.00 1.00 1.00 1.00SOCIAL WORKER- - 1.00 1.00 1.00EL Total - 23.00 32.00 31.00 31.00Enrichment and Electives FAMILY LIFE TCHR- 1.00 1.00 1.00 1.00Enrichment and Electives Total- 1.00 1.00 1.00 1.00Instructional Core EL CORE - ENGLISH- 4.00 5.00 5.00 4.00 (1.00) EL CORE - MATH- 3.00 7.00 7.00 7.00EL CORE - SCIENCE- - 2.00 2.00 2.00EL CORE - SOCIAL STUDIES- - - - 6.00 6.00 EL CORE SOCIAL STUDY- 2.00 6.00 6.00 - (6.00) ENGLISH TCHR- 1.00 - - -MATHEMATICS TCHR- 4.00 - - -SCIENCE TCHR- 2.00 - - -SOCIAL STUDIES TCHR- 4.00 - - -Instructional Core Total - 20.00 20.00 20.00 19.00 (1.00) School Administration ADMIN ASSISTANT I- 2.00 - - -ADMIN INSTR&STDT SUP- 2.00 - - -School Administration Total- 4.00 - - -Student Services EL SCHOOL COUNSELOR- 4.00 - - -ESSER II - EL SCHOOL COUNSELOR- - - - 1.00 1.00 SOCIAL WORKER- 1.00 - - -Student Services Total - 5.00 - - 1.00 1.00 Alexandria City HS Intl Acadmy Total - 53.00 53.00 52.00 52.00Alexandria City HS Satellite Alternative and At-Promise Education SHELTER CARE TCHR- 0.50 - - -SHELTER CARE TCHR - (0.50) - - -Alternative and At-Promise Education Total- - - - -Instructional Core ENGLISH TCHR- 1.00 1.00 1.00 1.00MATHEMATICS TCHR- 1.00 1.00 1.00 1.00PSYCHOLOGIST- 1.00 - - -PSYCHOLOGIST - (1.00) - - -SCHOOL COUNSELOR- 1.00 - - -SCHOOL COUNSELOR - (1.00) - - -SCHOOL NURSE- 0.50 - - -SCHOOL NURSE - (0.50) - - -SCIENCE TCHR- 1.00 1.00 1.00 1.00SOCIAL STUDIES TCHR- 1.00 1.00 1.00 1.00SOCIAL WORKER- 0.70 - - -SOCIAL WORKER - (0.70) - - -Instructional Core Total - 4.00 4.00 4.00 4.00School Administration ADMIN ASSISTANT I- 1.00 1.00 1.00 1.00CAMPUS ADMINISTRATOR - SATELLITE- - - 1.00 1.00School Administration Total- 1.00 1.00 2.00 2.00Special Education SPED TCHR- 1.00 - - -Special Education Total - 1.00 - - -Student Services SCHOOL COUNSELOR- - - - 1.00 1.00 Student Services Total - - - - 1.00 1.00 Summer and Extended Learning ELECTIVES TEACHER- - 1.00 1.00 1.00ONLINE LRNG MNTR TCH- 1.00 - - -Summer and Extended Learning Total- 1.00 1.00 1.00 1.00Alexandria City HS Satellite Total - 7.00 6.00 7.00 8.00 1.00 Grand Total 421.28 429.63 428.63 432.13 437.33 5.20
High School
Page 301 ACPS FY 2024 Proposed Budget High School High School Section Title
Page 302 High School ACPS FY 2024 Proposed Budget High School Section Title
Page 303 ACPS FY 2024 Proposed Budget High School High School Section Title
Page 304 High School ACPS FY 2024 Proposed Budget High School Section Title
Page 305 ACPS FY 2024 Proposed Budget High School High School Section Title
High School
Accreditation Benchmarks and School Status: Alexandria City HS
Target School Quality Indicators for All Students*
*Schools must develop a multi-year plan for continuous improvement.
Accreditation statuses are based on the Standards of Learning (SOL) tests administered during the previous school year.
School Quality Indicators:
Level 1 = Meets or exceeds state standard or sufficient improvement
Level 2 = Near state standard or sufficient improvement
Level 3 = Below state standard
Too Small = Too few students in school or group to evaluate
Source: VDOE's School Accreditation Report.
Student Performance Data: Alexandria City HS
SOL: Percent of Students Passing Across All Grade Levels (Federal)
with Disabilities, English Learners, Economically Disadvantaged Students (unduplicated)
with Disabilities, English Learners, Economically Disadvantaged Students (unduplicated)
Detailed SOL results are available on the Virginia Department of Education (VDOE) website.
Key: Yes-3YR = Met objective based on the three year average result.
Yes-R10 = Met objective by reducing failure rate by at least 10 percent.
Yes-MP = Maintain Progress: Current year pass rate equal to prior year’s pass rate, or stayed within 5%.
No-W = Did not meet benchmark or criteria for narrow margin or improvement.
< = A group below state definition for personally identifiable results.
- = No data for group.
Source: VDOE's SOL Test Pass Rates and Other Results Report.
Page 306 High School ACPS FY 2024 Proposed Budget
20192020 20202021 20212022 20222023 20232024
Accreditation Status Accredited Accreditation Waived Accreditation Waived Accredited with Conditions TBD
EnglishLvl 1 & 2NANALvl 1 & 2TBD MathematicsLvl 1 & 2NANALvl 1 & 2TBD
20182019 20192020 20202021 20212022 20222023
English All Students77NA75 68TBD Asian Students81NA70 60TBD White Students97NA88 90TBD Students with Disabilities54NA53 46TBD Economically Disadvantaged Students66NA63 57TBD Limited English Proficient Students19NA18 17TBD Gap Group 1 -
NANANANATBD Gap Group 2 - Black Students 82NA7573TBD Gap Group 3 - Hispanic Students 60NA6252TBD Mathematics All Students65NA42 46TBD Asian Students80NA50 46TBD White Students86NA74 75TBD Students with Disabilities38NA15 30TBD Economically Disadvantaged Students58NA28 36TBD Limited English Proficient Students43NA14 26TBD Gap Group 1 -
NANANANATBD Gap Group 2 - Black Students65NA42 41TBD Gap Group 3 - Hispanic Students52NA21 35TBD
Students
Students
Alternative Programs Summary
School NamePrincipalAddress and Contact
200
Alexandria, VA 22304
Phone: 703-461-4086
Fax: 703-461-6821
https://www.acps.k12.va.us/program s-services/alternativeprograms/northern-virginia-juveniledetention-center


Alexandria,
Tel: 703-888-1204
https://achs.acps.k12.va.us/campus es/chance-for-change
Alternative Programs Overview:
ACPS has three alternative education programs consisting of the Northern Virginia Juvenile Detention Center School (NVJDCS), the Chance for Change (CFC) Academy, and Sheltercare Program.
CFC reports to the Department of Student Services and Equity. CFC is located at 216 Peyton Street. The program receives student enrollments through the Department of Student Services, Alternative Programs, and Equity as well as through student, parent, and school counselor referrals.
The NVJDCS and Sheltercare Programs are located on S. Whiting St. and receive placements through the Alexandria City court system. In addition, ACPS provides funding for limited placement at the Fairfax County Bryant Center.
In FY 2024, these Alternative education programs have prepared their budgets using the modified zero-based budgeting (MZBB) methodology.
Grades Served
Major Programs
Staffing:
Staffing for the Chance for Change Academy will reduce to 15.70 FTEs in FY 2024. This is a 1.00 FTE decrease under the previous year.
Specialized Instruction:
The allocation of special education staffing is determined by two factors: disability category and level of service. Beginning in FY 2017, to further support inclusion and co-teaching across content areas, the staffing formula was revised by adjusting the service intensity point values which determine staff ratios. In FY 2024, Chance for Change Academy will continue to be supported by 1.00 FTE special education teacher, which is unchanged from the previouse year.
English Learners:
A 1.00 FTE EL teacher will continue to be shared between the Alexandria City High School Satellite program and the Chance for Change Academy.
Page 307 ACPS FY 2024 Proposed BudgetAlternative Education Summary
Northern Virginia Juvenile Detention Center School
Dr. Jamila Mannie, Principal
S. Whiting Street
Gr 6-12 Content Co-Teaching Transition Services Post-Disposition Program
Chance for Change Academy Cheryl Mills, Academic Principal
216 S. Peyton Street
VA 22314
Gr 6-12 CFC focuses on academics and the social emotional needs of students.
Alternative Programs Summary
Compensation and Benefits:
Compensation and Benefits: Compensation for the Chance for Change (CFC) Academy will decrease by $0.20 million to $1.50 million and benefits are projected to decrease by $0.06 million to $0.59 million.
As noted in the Financials section of this budget book, the FY 2024 budget includes a step increase for eligible employees, along with a Market Rate Adjustment.
Further information about these changes can be found in the Salary and Employee Benefits pages of the Financials section.
Non Compensation: Non compensation for the Chance for Change (CFC) Academy is budgeted at $0.03 million for FY 2024. The budget will remain the same as previous year.
Grant Support of Alternative Schools:
The NVJDCS will receive funding through the VDOE State Operating Programs to staff a total of 10.00 FTE. This is a reduction of 1.00 FTE under the previous year.
Page 308 Alternative Education SummaryACPS FY 2024 Proposed Budget
This page intentionally left blank.
Northern Virginia Juvenile Detention Center School
Northern Virginia Juvenile Detention Center School
Dr. Jamila M. Mannie, Principal 200 South Whiting Street
Alexandria, Virginia 22304
Tel: 703-461-4086 | Fax: 703-461-6821
jamila.mannie@acps.k12.va.us https://www.jdcnv.org/
The Northern Virginia Juvenile Detention Center School (NVJDCS) is a regional, state-operated program whose local educational agency is ACPS. NVJDCS provides full-day educational services for school-aged students who are residing at the detention center. The school is a secure facility with a capacity for 70 students who are of pre- and post-judicial disposition. NVJDCS’ students are enrolled for short periods of time, ranging from one day up to 180 days for students in the post-disposition program. The school receives funding for school staff and instructional needs from the Virginia Department of Education State Operating Programs.
Page 310 Alternative Education SummaryACPS FY 2024 Proposed Budget
School Contact
Alternative Programs Summary
Page 311 ACPS FY 2024 Proposed BudgetAlternative Education Summary
NVJDC Juvenile Detention Staffing Section TitleProgram Roll-Up Group TitlePosition Title FY 2020 Final FTE FY 2021 Final FTE FY 2022 Final FTE FY 2023 Final FTE FY 2024 Proposed FTE Change FY 2023 to FY2024 NVJDC Juvenile Detention Instructional Core COORD - TRANSITION- - 1.00 1.00 1.00COORD TRANSITION1.00 1.00 - - -PRINCIPAL - NVJDC- - - - 1.00 1.00 PRINCIPAL-ALT ED1.00 1.00 1.00 1.00 - (1.00) Instructional Core Total2.00 2.00 2.00 2.00 2.00State Hospitals, Clinics, and Detention ADMIN ASSISTANT I1.00 1.00 1.00 1.00 1.00ART TCHR- - - - -ART THERAPIST1.00 1.00 - - -EL TCHR1.00 1.00 1.00 1.00 1.00ENGLISH TCHR1.00 1.00 1.00 1.00 1.00INSTRCOACH-LITERACY- - - - -MATHEMATICS TCHR1.00 1.00 1.00 1.00 1.00PHYSICAL ED TCHR1.00 1.00 1.00 1.00 1.00SCIENCE TCHR1.00 1.00 1.00 1.00 1.00SOCIAL STUDIES TCHR1.00 1.00 1.00 1.00 1.00SPECIAL ED TCHR- - - - -SPECIAL EDUCATION TCHR - - - - 1.00 1.00 SPECIALIST - TRANSITION - - 1.00 1.00 - (1.00) SPED TCHR2.00 2.00 1.00 1.00 - (1.00) State Hospitals, Clinics, and Detention Total10.00 10.00 9.00 9.00 8.00 (1.00) NVJDC Juvenile Detention Total12.00 12.00 11.00 11.00 10.00 (1.00) Grand Total 12.00 12.00 11.00 11.00 10.00 (1.00) Section Title
Chance for Change Academy
Chance for Change Academy
Cheryl Mills, Campus Administrator
216 S. Peyton St.
Alexandria, Virginia 22314
Tel: 703-888-1204
cheryl.mills@acps.k12.va.us
https://achs.acps.k12.va.us/campuses/chance-for-change
The Chance for Change (CFC) Academy serves as an alternative school program for students in grades 6-12 who have violated the student code of conduct, are transitioning from a disciplinary placement, or students have the opportunity to attend CFC through an application process. This program is designed to equip students with tools to enhance their academic progress and address behavioral challenges with which they are dealing with at school. Each student who participates in this program is supported by a team of dedicated teachers and the student support team, in addition to having access to organizations that help in regards to mental health, wellness, and academics. Parents or guardians will play a major role in their child’s success at Chance for Change Academy.
Page 312 Alternative Education SummaryACPS FY 2024 Proposed Budget
School Contact
Alternative Programs Summary
Page 313 ACPS FY 2024 Proposed BudgetAlternative Education Summary
Alternative Education Staffing Section TitleProgram Roll-Up Group TitlePosition Title FY 2020 Final FTE FY 2021 Final FTE FY 2022 Final FTE FY 2023 Final FTE FY 2024 Proposed FTE Change FY 2023 to FY2024 Alternative Education Alternative and At-Promise Education ACADEMIC PRINCIPAL- 1.00 1.00 - -ALTERNATIVE EDUCATION TCHR - - - - 1.00 1.00 CAMPUS ADMINISTRATOR - CFC- - - 1.00 1.00ENGLISH TCHR1.00 - - - -INST ASST I- 1.00 - - -INSTRUCTIONAL ASSISTANT I- - 1.00 1.00 1.00INSTRUCTIONAL ASST I- - - - -MATHEMATICS TCHR1.00 1.00 1.00 1.00 1.00MIDDLE SCH TCHR1.00 1.00 1.00 1.00 - (1.00) PARAPROFESSIONAL I1.00 - - - -SCIENCE TCHR1.00 1.00 1.00 1.00 1.00SHELTER CARE TCHR1.00 0.50 1.00 1.00 1.00SHELTER CARE TCHR - 0.50 - - -SOCIAL STUDIES TCHR1.00 1.00 1.00 1.00 1.00SUPPORT SPECIALIST II- - - 1.00 1.00SUPPORT SPECIALISTII1.00 1.00 1.00 - -Alternative and At-Promise Education Total8.00 8.00 8.00 8.00 8.00EL EL TCHR1.00 1.00 1.00 1.00 1.00EL Total1.00 1.00 1.00 1.00 1.00Exemplary Programs ACADEMIC PRINCIPAL1.00 - - - -ENGLISH TCHR- - - - -MATHEMATICS TCHR- - - - -MIDDLE SCH TCHR- - - - -PARAPROFESSIONAL I- - - - -SCIENCE TCHR- - - - -SHELTER CARE TCHR- - - - -SOCIAL STUDIES TCHR- - - - -SUPPORT SPECIALISTII- - - - -Exemplary Programs Total1.00 - - - -Improvement of Instruction READING SPECIALIST1.00 1.00 1.00 1.00 1.00Improvement of Instruction Total1.00 1.00 1.00 1.00 1.00Instructional Core ADMIN ASSISTANT I1.00 - - - -ENGLISH TCHR1.00 1.00 1.00 1.00 1.00MATHEMATICS TCHR1.00 - - - -ONLINE LRNG MNTR TCH1.00 - - - -PSYCHOLOGIST1.00 - 1.00 1.00 1.00PSYCHOLOGIST - 1.00 - - -SCHOOL COUNSELOR1.00 - 1.00 1.00 1.00SCHOOL COUNSELOR - 1.00 - - -SCHOOL NURSE0.50 - 0.50 1.00 1.00SCHOOL NURSE - 0.50 - - -SCIENCE TCHR1.00 - - - -SOCIAL STUDIES TCHR1.00 - - - -SOCIAL WORKER0.50 - 0.70 0.70 0.70SOCIAL WORKER - 0.70 - - -Instructional Core Total9.00 4.20 4.20 4.70 4.70School Administration SCH SECURITY OFFICER- 1.00 - - -SCHOOL SECURITY OFFICER- - 1.00 1.00 - (1.00) School Administration Total- 1.00 1.00 1.00 - (1.00) Special Education SPECIAL ED TCHR- - - - -SPECIAL EDUCATION TCHR- - - - 1.00 1.00 SPED TCHR2.00 1.00 1.00 1.00 - (1.00) Special Education Total2.00 1.00 1.00 1.00 1.00Alternative Education Total22.00 16.20 16.20 16.70 15.70 (1.00) Grand Total 22.00 16.20 16.20 16.70 15.70 (1.00)
Page 314 Alternative Education SummaryACPS FY 2024 Proposed Budget Alternative
Summary Section Title
Programs
School-Wide Resources Summary
Department and Office Contact
Chief of Teaching, Learning, and Leadership
Dr. Wendy Gonzalez, Chief of Teaching, Learning, and Leadership
1340 Braddock Place
Alexandria, Virginia 22314
Tel: 703-619-8020 | Fax: 703-619-8984
wendy.gonzalez@acps.k12.va.us
Responsibilities:
The School-Wide resources budget is comprised entirely of contract salaries and benefits. The posi-tions in this section will remain in this budget but be deployed to schools as needed, e.g. special edu-cation Instructional Assistant I positions.
Budget Summary
The School-Wide Resources Office budget includes funding for 43.00 FTE Special Education positions, comprised of 31.00 FTE Instructional Assistant I positions, 1.00 FTE Instructional Assistant III, 7.00 FTE Instructional Assistant IV positions, 2.00 FTE Instructional Assistant II - ECSE positions; 2.00 SPED Teacher - ECSE positions. Staffing these positions in this department allows flexibility for the Instructional Assistants to transfer with the student instead of being allocated to a specific school site.
The budget totals $2.53 million, an increase of $0.140 million, and is comprised entirely of salary and benefits.
Page 315 ACPS FY 2024 Proposed BudgetSchool-wide Resources
School-Wide Resources Staffing
School-Wide Resources
Section TitleProgram Roll-Up Group TitlePosition Title FY 2020 Final FTE FY 2021 Final FTE FY 2022 Final FTE FY 2023 Final FTE FY 2024 Proposed FTE Change FY 2023 to FY2024 School-Wide Resources Special Education ESSER III - SPED TCHR ECSE- - - - 1.00 1.00 INST ASST I- 31.00 - - -INSTRUCTIONAL ASSISTANT I- - 31.00 32.00 26.00 (6.00) INSTRUCTIONAL ASSISTANT III- - 1.00 - -INSTRUCTIONAL ASSISTANT IV- - 7.00 7.00 7.00INSTRUCTIONAL ASST I- - - - -INSTRUCTIONAL ASST II - ECSE - - 2.00 2.00 2.00INSTRUCTIONAL ASST III- 1.00 - - -INSTRUCTIONAL ASST IV- 7.00 - - -PARAPROFESSIONAL I28.00 - - - -PARAPROFESSIONAL III1.00 - - - -PARAPROFESSIONAL IV7.00 - - - -SPED TCHR ECSE- - 2.00 2.00 2.00Special Education Total36.00 39.00 43.00 43.00 38.00 (5.00) School-Wide Resources Total36.00 39.00 43.00 43.00 38.00 (5.00) Grand Total 36.00 39.00 43.00 43.00 38.00 (5.00) Section Title Page 316 ACPS FY 2024 Proposed Budget
Resources
School-wide
Overview, Schools, Departments


Section IV: Information Departments
✓ Department Summary
✓ Instructional Support Departments
✓ School and Community Relations

✓ School, Business and Community Partnerships

✓ Accountability and Research
✓ Teaching, Learning & Leadership
✓ Technology Services

✓ Support Services Departments

Page 317 ACPS FY 2024 Proposed Budget Instructional Support Departments
This page left blank intentionally.
Department Summary
Department: Overview
This section of the book provides detailed information about ACPS departments including a list of responsibilities, budget summary narratives and detailed staffing and budget reports for each department or office.
Central office departments prepared department goals and strategies in support of meeting division objectives. Department’s individual Department Improvement Plans (DIP) can be found on the Accountability & Research web page https://www.acps.k12.va.us/departments/ accountability-research.
The FY 2024 Budget includes an increase in salaries and benefits driven primarily by enrollment related staffing, compensation improvements for current ACPS staff, and increases in both retirement and health insurance premiums.
Employee benefits are increased this year as expected each year to include changes to the Kaiser and United Healthcare participation while VRS rates will remain unchanged from FY 2023 levels.
Further information about these changes can be found in the Salary and Employee Benefits pages of the Financials section.
The Office of School, Business and Community Partnerships was established in FY 2017 to support ACPS partners, Family and Community Engagement (FACE), Business Advisory Council (BAC), grants development, volunteer services and community-funded facilities projects. As part of the FY 2022 organization structural change, the office of School, Business, and Community Partnerships was re-titled to Community Partnerships and Engagement and staffed with Chief of School
and Community Relations position to provide for increased collaboration amongst the Offices of Communications and of School, Business, Community Partnerships.
The Department of Accountability & Research supports evaluation and research, technical support, data analysis and reporting and test administration.
The FY 2024 budget continues to focus on student achievement and targeted intervention. The Department of Teaching, Learning and Leadership includes funding for professional development for staff, the Teacher Mentor Program, instructional supplies for students, and continued support of the Advancement Via Individual Determination (AVID) program. The Teaching, Learning and Leadership budget will see a change in the FY 2024 Budget attributed to efforts to continue replacing, replenishing, and bringing current all textbooks on a seven year cycle, as this was shifted to the Capital Improvement Program budget.
Fundiing within the Office of EL will support student registration and assessment, professional development (Project GLAD training) and textbook adoption for elementary dual language.
The office of AVID/College Readiness will receive funding to continue support of the existing AVID program at Cora Kelly, as well as expand the program to Patrick Henry. This includes membership dues, stipend, transportation and travel costs.
The Technology Services Department will receive funding to renew and maintain annual licenses for instructional and operational software and subscriptions due to the projected increase in enrollment and content agreement.
Page 318 ACPS FY 2024 Proposed Budget Instructional Support Departments
Department Summary
The Department of Student Services and Equity supports the Alternative Educational Programs, school counseling services, cultural competency, school health services, Family Education Rights and Privacy Act (FERPA), school psychologist services, homelessness, school social work services, home schooling, student hearings, title IX compliance and residency verification. Funding will provide for two additional staff employees and staff development in cultural competency, a increase in intermittent pay for homebound instructional services, updated software and travel cost to attend the ASCA National Conference for staff
The Facilities and Operations Department, underwent a staffing and structural reorganization in FY 2021. The Facilities and Operations Department will continue to require increased financial support in FY 2024. The incremental resource needs are largely precipitated by the increased square footage of the ACPS building portfolio, increased cost of pupil transportation services, provisioning of security services, rising costs of utilities, building leases, additional costs of sanitization/ cleaning services; increasing insurance costs, HVAC service contracts as well as continuing efforts to improving ACPS service delivery and to address audit/study recommendations.
Page 319 ACPS FY 2024 Proposed Budget Instructional Support Departments
School Board
School Board
Susan Neilson Clerk of the Board
1340 Braddock Place
Alexandria, Virginia 22314
Tel: 703-619-8316 | Fax: 703-619-8091
boardclerk@acps.k12.va.us https://www.acps.k12.va.us/school-board
Responsibilities
The ACPS School Board directs and supports all aspects of the operational elements of the school system in accordance with the goals and objectives of the ACPS strategic plan. The School Board’s budget reflects its role as the governing body of the school division. The School Board:
• Ensures policies, regulations, recommendations, budgets and decisions consider that every student succeeds in ACPS.
• Ensures requisite consideration and incorporation of community views in the vision and mission statements of the school division.
• Provides opportunities for public access, review, comment, and input.
• Ensures application of accountability measures and provides a mechanism to receive performance reviews of the school division.
• Provides input, finalizes, and approves the budgets that are presented to the community and City Council.
• Advocates for all educational legislative issues at the local, state, and federal level that would directly affect the school division.
• Ensures public school operations are conducted in an efficient manner and in accordance with established law and Division policies.
• Creates, updates, and ensures the enforcement of school division policies, bylaws, and regulations including those that pertain to Board governance, the management of official Division business, and for the supervision of schools.
• Ensures proper care, management, operation, and control of all school division properties including school facilities, Division headquarters, garages, and warehouses.
• Adjusts school boundaries and pupil assignment policies as required to ensure efficient and equitable operation of the school division.
• Provides input and approves the program of studies annually, consistent with state statutes and regulations.
Page 320 ACPS FY 2024 Proposed Budget Instructional Support Departments
and Office Contact
Department
School Board
• Approves the yearly school division calendar including identifying the number of school days, holidays, etc., consistent with state statutes and regulations.
• Performs such other duties as prescribed by the Virginia Department of Education (VDOE) or imposed by law.
Budget Summary
The School Board budget funds all of the School Board’s efforts, with a focus on governance and community outreach and engagement. The School Board Services FY 2024 Proposed Budget totals $1.73 million, the increased
budget includes consulting services for anticipated employee collective bargaining. Positions will increase by 1.0 FTE positions to add a full-time attorney to address Board interests. The budget increase is due to salary and benefit adjustments, as well as the addtional FTE. Other non-labor expenditures such as materials and supplies and other charges will remain unchanged from prior fiscal year.
Page 321 ACPS FY 2024 Proposed Budget Instructional Support Departments
Section TitleProgram Roll-Up Group TitlePosition Title FY 2020 Final FTE FY 2021 Final FTE FY 2022 Final FTE FY 2023 Final FTE FY 2024 Proposed FTE Change FY 2023 to FY2024 School Board Board Services ADMIN ASSISTANT I- - - - 1.00 1.00 CLERKOFBOARD-POLICY1.00 1.00 - - -COORD STRAT PLAN/POLICY- - - - -DEP CLERK OF BOARD1.00 1.00 1.00 1.00 - (1.00) DIR, POLICY&BD INIT1.00 1.00 1.00 1.00 - (1.00) DIRECTOR I - POLICY & BOARD INITIATIVES - - - - -SCHOOL BOARD ATTORNEY- - - - 1.00 1.00 SCHOOL BOARD CLERK- - 1.00 1.00 1.00SCHOOL BOARD DEPUTY CLERK- - - - 1.00 1.00 Board Services Total3.00 3.00 3.00 3.00 4.00 1.00 School Board Total 3.00 3.00 3.00 3.00 4.00 1.00 Grand Total 3.00 3.00 3.00 3.00 4.00 1.00 Section Title
School Board Staffing
Office of the Superintendent
Dr. Melanie Kay-Wyatt, Interim Superintendent of Schools
1340 Braddock Place
Alexandria, Virginia 22314
Tel: 703-619-8001 | Fax: 703-619-8091
superintendent@acps.k12.va.us http://www.acps.k12.va.us/superintendent/
Responsibilities
The ACPS Office of the Superintendent represents the leadership role of the Superintendent. All budget lines in this office are directly related to the role of the educational leader and chief executive officer for the school division.
The Superintendent duties are:
Serves as Chief Executive Officer of the School Board.
• Attends School Board meetings.
• Implements policies of the School Board.
• Reports to the School Board about the status of programs, personnel, and operations of the schools. Recommends actions to the School Board.
• Works collaboratively with the School Board to establish budget priorities and Areas of Focus.
• Communicates as liaison between the School Board and school personnel.
• Assists the Chair in developing and distributing notices and agendas of meetings of the School Board.
Act as the educational leader of the schools.
• Supervise the Chiefs.
• Oversee planning and evaluation of curriculum and instruction in collaboration
with the Chief of Teaching, Learning and Leadership.
• Develops for approval by the School Board procedures for adopting textbooks and other instructional materials in collaboration with the Chief of Teaching, Learning and Leadership.
• Oversee operations of all departments within ACPS in collaboration with the Senior Leadership team.
• Visits schools on a regular basis.
• Maintains a current knowledge of developments in teaching, learning and leadership.
Enforce school laws and regulations.
• Observes such directions and regulations as the Superintendent of Public Instruction or the Virginia Board of Education may prescribe.
• Makes reports to the Superintendent of Public Instruction whenever required.
• Distributes promptly all reports, forms, laws, and regulations which may be received from the Superintendent of Public Instruction.
• Enforces school laws, regulations, and decisions of the Superintendent of Public Instruction and of the Virginia Board of Education.
• Prepares and maintains administrative procedures, guidelines, and regulations to be used to implement School Board policy.
Page 322 ACPS FY 2024 Proposed Budget Instructional Support Departments Office of the Superintendent
Office Contact
Department and
If Board action is required by law or the Board has specifically asked that certain types of regulations be given prior Board approval, these regulations and guidelines shall be placed in the School Board manual. The administrative procedures, guidelines, and regulations shall be discussed with staff members and made available for their information.
Oversees staff personnel management.
• Organizes recruitment of personnel through collaboration with the Chief of Human Resources.
• Conducts an annual review and evaluation of the staff organization of the school division. Reassigns personnel to schools and offices.
• Reassigns personnel to schools and offices through collaboration with the Chief of Human Resources.
• Ensures administration of personnel policies and programs through collaboration with the Chief of Human Resources.
• Supervises evaluation of personnel in collaboration with the chiefs who report directly to the Superintendent.
• Provides guidance for maintenance of upto-date job descriptions for all personnel in collaboration with the Chief of Human Resources and Director of Recruitment and Retention.
The authority of the School Board is transmitted through the Superintendent along specific channels as shown in the Senior Leadership Team organizational chart. The Board approves the chart annually through the budget adoption process, and upon amendment by the Superintendent. Although departmental organizational charts do not require Board approval, the Superintendent will share any organizational changes with the Board for informational purposes.
Oversees facility management.
• Prepares long and short-range plans for
facilities and sites in collaboration with the Chief of Facilities and Operations.
• Ensures the maintenance of school property and safety of personnel and property in collaboration with the Chief of Facilities and Operations.
• Inspects school property on a regular basis in collaboration with the Chief of Facilities and Operations.
• Approves the utilization of school property.
• Monitors any construction, renovation, and demolition of school facilities in collaboration with the Chief of Facilities and Operations.
• Represents the school division before local or state agencies which control building requirements or provide financing for buildings.
• Closes school buildings which appear to her/him to be unfit for occupancy in collaboration with the Chief of Facilities and Operations.
Oversees financial management.
• Prepares budgets for School Board approval in collaboration with the Chief Financial Officer.
• Ensures that expenditures are within the limits approved by the School Board in collaboration with the Chief Financial Officer.
• Reports to the School Board on the financial condition of the school division.
• Establishes procedures for the procurement of equipment and supplies in collaboration with the Chief Financial Officer.
Ensures that an accurate record of all receipts and disbursements of school funds is kept. Directs community relations activities.
• Articulates educational programs and needs to the community in collaboration with the Chief of School and Community Relations.
• Responds to concerns expressed in the community in collaboration with the Chief
Page 323 ACPS FY 2024 Proposed Budget Instructional Support Departments Office of the Superintendent
Office of the Superintendent
of School and Community Relations.
• Maintains contact with the news media in collaboration with the Chief of School and Community Relations.
• Participates in community affairs in collaboration with the Chief of School and Community Relations.
• Involves the community in planning and problem solving for the schools.
Oversees student services.
• Monitors student services in collaboration with the Chief of Student Services and Equity.
• Ensures that an accurate student record system is maintained in collaboration with the Chief of Student Services and Equity.
• Implements policies and programs relating to the behavior and discipline of students in collaboration with the Chief of Student Services and Equity.
• Maintains programs for the health and safety of students in collaboration with
the Chief of Student Services and Equity.
• Communicates as the liaison between schools and community social services agencies in collaboration with the Chief of Student Services and Equity.
Budget Summary
The budget for the Office of the Superintendent supports all of the duties of the Superintendent with a continued focus on student, parent and community outreach. The FY 2024 Proposed Budget totals $0.55 million, a $0.01 million increase from prior fiscal year. Positions remain unchanged at 2.00 FTEs. The budget increase is due primarily to employee salaries and benefits associated with the full-year step increase for eligible employees.
Additionally, other expenses in other charges and materials and supplies will remain at the same levels as in prior fiscal year.
Page 324 ACPS FY 2024 Proposed Budget Instructional Support Departments
Office of the Superintendent Staffing Section TitleProgram Roll-Up Group TitlePosition Title FY 2020 Final FTE FY 2021 Final FTE FY 2022 Final FTE FY 2023 Final FTE FY 2024 Proposed FTE Change FY 2023 to FY2024 Office of the Superintendent Executive Administration EXEC ASST-SUPT1.00 1.00 1.00 1.00 - (1.00) EXECUTIVE ASSISTANT - SUPERINTENDENT - - - - 1.00 1.00 SUPERINTENDENT1.00 1.00 1.00 1.00 1.00Executive Administration Total2.00 2.00 2.00 2.00 2.00Office of the Superintendent Total 2.00 2.00 2.00 2.00 2.00Grand Total 2.00 2.00 2.00 2.00 2.00Section Title
School and Community Relations
Department and Office Contact
Department ofSchool and Community Relations
Julia A. Burgos
Chief of School and Community Relations
1340 Braddock Place
Alexandria, Virginia 22314
Tel: 703-619-8050 | Fax: 703-619-8091
julia.burgos@acps.k12.va.us
https://www.acps.k12.va.us/departments/school-community-relations
Responsibilities
The Department of School and Community Relations encompasses the Office of Communications and the Office of Community Partnerships and Engagement.
Office of Community Partnerships and Engagement
Through building broad-based partnerships, the Office of Community Partnerships and Engagement supports the School and Community Relationship Department in the strengthening of the education and equal opportunities for all students. The Office of Community Partnerships and Engagement helps build the school division’s capacity to respond and coordinate partnerships, collaborate with families to provide meaningful opportunities, inspire civic engagement and encourage lifelong learners.
The office supports the division in alignment with the ACPS 2025 Strategic Plan: Equity for All as referenced below:
Systematic Alignment
• Creates a culture in which the specific office areas (Partnerships, Grants, Volunteers, Out of School Time, Family and Community
Engagement and Community Outreach) can align work and collaborate with internal and external stakeholders collaboratively, including the engagement of families to support the education delivered to students.
Instructional Excellence
• Ensures that an aligned, viable curriculum is delivered to all students by providing resources, grant support, programming and partner program integration.
Student Accessibility and Support
• Engages students and families in identifying needed supports and services in schools while monitoring utilization of existing and new resources.
• Improves students’ and families’ experiences during key transitions in their educational journey.
• Expands families’ access and provides guidance for pre-K programs.
• Expands and enhances capacity to support the academic, social, physical, creative and emotional needs of students during out of school time hours.
• Coordinates effective outreach strategies designed to increase communication with our most difficult to reach families.
• Enhances digital/web presence to increase community access to important information
Page 325 ACPS FY 2024 Proposed Budget Instructional Support Departments
School and Community Relations
and resources.
Strategic Resource Allocation
• Allocates resources and access to programs to the highest-need schools in a transparent way.
• Engages and expands capacity of ACPS staff, schools and departments through in-kind partnership agreements, resources and donations from community members and partners.
• Builds and maintains positive relationships with stakeholders and partner organizations to foster a sense of community ownership in our schools.
• Works with city and nonprofit partners to address the health, social services and academic needs of students and their families.
• Investigates, develops and implements systems designed to increase external organizations’ support of ACPS.
Family and Community Engagement
• Engages families with a particular focus on immigrants and families of color to support children’s academic success and healthy social/emotional development.
• Connects ACPS families to tools, information and services that support educational achievement and overall quality of life.
• Helps eliminate barriers to family engagement for ACPS families who are low-income, limited English proficient and/ or historically-marginalized families.
• Offers family and community activities/ events within targeted high-need communities to enhance equity in the delivery of engagement opportunities.
• Connects ACPS families, community organizations and businesses with meaningful opportunities to volunteer within schools.
• Builds the capacity of ACPS schools to develop two-way trusted relationships with families.
• Implements effective and high-impact
family engagement activities to improve student academic achievement.
• Provides opportunities for ACPS families and community members to provide feedback on issues of importance.
Office of Communications
The Office of Communications seeks to inform all audiences and share stories about the good work being done within ACPS through targeted strategies to communicate and engage with internal and external stakeholders including students, staff, families and the community.
It provides a variety of services integral to the dissemination of information to ensure clear, timely and accurate delivery of communications to a wide range of audiences.
The office supports the division in alignment with the ACPS 2025 Strategic Plan: Equity for All as referenced below:
Systemic Alignment
• Provides counsel, training and support to administration and schools on best practices in communication and assists in their implementation.
• Responds to media inquiries related to schools and the school division from local and national newspapers, television and radio stations.
• Shares ACPS stories that demonstrate its mission and vision via a multitude of intuitive and user-friendly digital communication channels including email, weekly newsletters (ACPS Express, Insider), website, social media, webinars and professionally produced photos and videos.
Instructional Excellence
• Creates and develops effective communications plans and strategies to support student achievement and community and family engagement, in alignment with school board priorities and
Page 326 ACPS FY 2024 Proposed Budget Instructional Support Departments
School and Community Relations
the ACPS 2025 Strategic Plan: Equity for All.
• Seeks, pitches and develops materials for interesting stories that highlight ACPS students, staff, families and community partners at work exemplifying ACPS core values of a welcoming, equity-focused and empowering school system.
Student Accessibility and Support
• Oversees that all content shared across social media platforms is presented in an appropriate, ap-pealing and informative manner.
• Provides audio/visual support to schools, departments, School Board meetings and work sessions, as well as supports live streaming functions.
Strategic Resource Allocation
• Trains staff on best practices for being spokespersons during interviews and live public events.
• Responds and manages the flow of information communicated on a daily basis and during crisis situations, in collaboration with departments and safety and security personnel when necessary.
• Facilitates and manages the implementation and logistics of various division-wide events, community meetings, VIP visits, and budget forums throughout the year.
Family and Community Engagement
• Builds upon existing communication channels with English and non-English speaking families and community members to enhance engagement with ACPS and promote the growth of trusted relationships which instill confidence and credibility in the information shared.
• Seeks opportunities to continually improve communication strategies that will encourage interactive and engaging interactions with all members of the diverse ACPS community.
• Manages and ensures all major
communications are available in multiple languages, reflective of the ACPS community demographics, for the division and individual school websites in compliance with Federal Accessibility Guidelines and in accordance with ACPS’ commitment to equity for all.
Page 327 ACPS FY 2024 Proposed Budget Instructional Support Departments
School and Community Relations
School & Community Relations
Chief of School & Community Relations
Julia
A. Burgos
Communications
Executive Director
Kathy Mimberg
Community
Partnerships
and Engagement
Executive Director
Anthony Kurt Huffman
Strategic Communication Services
Develops and implements strategic communications to maintain and enhance the image of the school division.
Emergency Communications
Provides clear, accurate and timely information in a crisis.
Communications Counsel
Advises and supports division leaders and school administrators to ensure consistent best practices in communications.
Internal Communications
Partners with Central Office departments to share timely division information with staff.
Website Management
Oversees division and school websites and provides training to school and department web liaisons to ensure online information is accurate, complete and up to date.
Multimedia Services
Creates and shares information from our division and schools via social media, video, photography, live streaming and more. Facilitates some audio visual services.
Media Relations
Manages relationships with news media on behalf of the division, responds to reporter inquiries and pitches stories to highlight the good work of our schools in the news.
Community Outreach and Engagement
Creates and ensures effective communication for all ACPS stakeholders.
Grants
Ensures effective grant management and execution
Partnerships
Builds and maintains positive relationships with partner organizations and manages donations to foster a strong sense of community in our schools.
Family and Community Engagement
Coordinates with families in providing high quality services.
Out of School Time Programming
Ensures alignment and development of out of school time programs to increase additional learning opportunities for ACPS’ most vulnerable students.
Volunteers
Management and outreach in order to strengthen the ACPS volunteer program to ensure high levels of community engagement and support schools.
Page 328 ACPS FY 2024 Proposed Budget Instructional Support Departments
School and Community Relations
Budget Summary
The 1.00 FTE Chief School and Community Relations Officer position and budget are included in the Office of Communications.
Office of School, Business, and Community Partnerships
This office’s budget totals $0.43 million and funds 2.00 FTEs. Changes in compensation due to a step increase, MRA, and hold step/ top of scale for eligible employees are the drivers for the budget increase. The total noncompensation budget is unchanged compared to the prior fiscal year.
The Purchase Services category comprise of the largest non-personnel budget for this office. This includes funding for other printing and binding and other professional services.
Office of Community Partnerships and Engagement
The Community Partnerships and Engagement budget supports interactions among the families, community and ACPS, as well as the Family and Community Engagement (FACE) Center. The FY 2024 Operating Funded Budget totals $1.40 million, a slight increase compared to the prior fiscal year. Positions total 10.50 FTEs, 9.50 FTEs funded through Operating Fund and 1.00 FTE funded through Grant and Special Projects Fund.
Support in the Materials and Supplles category will continue to fund instructional supplies, office supplies, paper supplies, refreshments, promotional items, software/online charges, and other operating supplies.
Communications
The budget for the Office of Communications supports all division-wide communication, focusing on the roll-out of the strategic plan by bringing the message to the community and telling the ACPS story. The FY 2024 Operating Funded Budget is $1.90 million, a slight increase compared to the prior fiscal year.
Positions will remain unchanged at 9.50 FTEs.
Salary and benefits will increase due to the step increase, MRA, and hold step/top of scale for eligibilie employees.
Purchased services category will increase to $0.15 million to fund equipment maintenance, printing and binding, professional services, and clerical temp.
Page 329 ACPS FY 2024 Proposed Budget Instructional Support Departments
School and Community Relations
Page 330 ACPS FY 2024 Proposed Budget Instructional Support Departments
Communications Staffing Section TitleProgram Roll-Up Group TitlePosition Title FY 2020 Final FTE FY 2021 Final FTE FY 2022 Final FTE FY 2023 Final FTE FY 2024 Proposed FTE Change FY 2023 to FY2024 Communications Communications and Information Services ADMIN ASSISTANT II 1.00 - - - -ADMIN SPECIALIST II - 1.00 1.00 1.00 1.00ASST DIRECTOR - COMMUNICATIONS - - - 1.00 1.00CHIEF - SCHOOL & COMMUNITY RELATIONS - - 1.00 1.00 1.00CHIEF SCH & COMM RLT - 1.00 - - -COMMNTY OUTREACH SPE 1.00 1.00 - - -COMMUNICATIONS SPEC 3.00 4.00 - - -COMMUNICATIONS SPECIALIST - WRITER - - - 0.50 0.50DIRECTOR II-S-COMM 1.00 - - - -ESSER III - MANAGER: PUBLIC INFORMATION - - - - 1.00 1.00 ESSER III - SPECIALIST: INTERNAL COMMUNICATIONS - - - - 1.00 1.00 ESSER III - SPECIALIST: VIDEO PRODUCTION - - - - 1.00 1.00 EXEC DIRECTOR-COMM - 1.00 - - -EXECUTIVE DIRECTOR - COMMUNICATIONS - - 1.00 1.00 1.00MEDIA RELATIONS SPCL 1.00 1.00 - - -MEDIA TECH SPEC - - - - -PROGRAM MANAGER - TV/VIDEO - - 1.00 - -SPECIALIST - COMMUNICATIONS - - 2.50 - -SPECIALIST - COMMUNICATIONS (WRITER/MEDIA) - - 1.00 - -SPECIALIST - COMMUNITY OUTREACH - - 1.00 1.00 1.00SPECIALIST - CUSTOMER RELATIONS - - - - -SPECIALIST - DIGITAL COMMUNICATIONS - - - 1.00 1.00SPECIALIST - MEDIA RELATIONS - - 1.00 1.00 1.00SPECIALIST - MULTIMEDIA - - - 1.00 1.00SPECIALIST - WEB COMMUNICATIONS - - - 1.00 1.00TV/VIDEO PROG MGR 1.00 1.00 - - -VIDEO/PHOTO SPEC - - - - -Communications and Information Services Total8.00 10.00 9.50 9.50 12.50 3.00 Communications Total 8.00 10.00 9.50 9.50 12.50 3.00 Community Partnerships & Engag Business Development ESSER III - RECOVERY & RELIEF GRANTS PROJECT ASSISTANT - - - - 1.00 1.00 Business Development Total- - - - 1.00 1.00 Executive Administration ADMIN ASSISTANT II 1.00 1.00 1.00 1.00 1.00ASST DIR - STRG INIT - 1.00 1.00 1.00 - (1.00) ASST DIRECTOR - STRATEGIC INITIATIVES - - - - 1.00 1.00 Executive Administration Total1.00 2.00 2.00 2.00 2.00Partnerships, Family and Community Engagement BILINGUAL SPEC-FACE - 2.00 2.00 1.00 - (1.00) BILINGUAL SPECIALIST - FACE - - - 2.00 3.00 1.00 COMMNTY OUTREACH MGR 1.00 1.00 1.00 - -COORD - FAMILY ENGAGEMENT - - - - 1.00 1.00 COORD - VOLUNTEERS - - 0.50 0.50 0.50COORD PARENT LIAISON - - 1.00 - -COORDINATOR - FAMILY ENGAGEMENT - - - 1.00 - (1.00) EARLY CHILDHOOD SPECIALIST: BILINGUAL FAMILY & COMMUNITY ENGAGEMENT - - - - 1.00 1.00 ESSER - Out of School Program Coordinator - - 1.00 - -ESSER - OUT-OF-SCHOOL PROGRAM COORDINATOR - - - - -ESSER II - COORD: OUT-OF-SCHOOL PROGRAMS - - - - 1.00 1.00 ESSER III - EL BILINGUAL FAMILY LIAISON - - - - 1.00 1.00 FACE MANAGER - 1.00 1.00 1.00 - (1.00) MANAGER - COMMUNITY OUTREACH/SCHOOL ENGAGEMENT - - - - 1.00 1.00 MANAGER - FACE PROGRAM - - - - 1.00 1.00 MANAGER: COMMUNITY OUTREACH/SCHOOL ENGAGEMENT - - - 1.00 - (1.00) PARENT LIAISON - AMHARIC - - 0.50 - -PARENT LIAISON - ARABIC - - 0.50 - -PARENT LIAISON COORD 1.00 1.00 - - -PARENT LIAISON-BILIN 2.00 - - - -SPECIALIST - CUSTOMER RELATIONS - - 1.00 - -SPECIALIST - EXTERNAL RELATIONS - - - 1.00 1.00VOLUNTEER COORD 0.50 0.50 - - -Partnerships, Family and Community Engagement Total4.50 5.50 8.50 7.50 10.50 3.00 Summer and Extended Learning COORD - GRANT & DATA - - 1.00 1.00 1.00 -
School and Community Relations
Page 331 ACPS FY 2024 Proposed Budget Instructional Support Departments
Section TitleProgram Roll-Up Group TitlePosition Title FY 2020 Final FTE FY 2021 Final FTE FY 2022 Final FTE FY 2023 Final FTE FY 2024 Proposed FTE Change FY 2023 to FY2024 COORD - LINK CLUB - 1.00 - - -COORD PARTNERSHIP - (0.00) - - -COORDINATOR - LINK CLUB - - 1.00 - -ESSER III - ADMIN SPECIALIST: WELCOME CENTER - - - - 1.00 1.00 ESSER III - DATA ANALYST: OUT-OF-SCHOOL PROGRAM - - - - 1.00 1.00 ESSER III - MANAGER: OUT-OF-SCHOOL TIME PROGRAMS - - - - 1.00 1.00 GRANT & DATA COORD - 1.00 - - -Summer and Extended Learning Total- 2.00 2.00 1.00 4.00 3.00 Community Partnerships & Engag Total 5.50 9.50 12.50 10.50 17.50 7.00 Ofc. of Schl, Bus. & Com Partn Business Development ESSER - GRANT COORDINATOR - - - - -ESSER - Grant Specialist/Coordinator - - 1.00 - -ESSER II - GRANT COORDINATOR - - - - 1.00 1.00 GRANTS OFFICER - - - - -MANAGER - PARTNERSHIP GRANTS - - 1.00 1.00 1.00PARTNERSHP GRNTS MGR 1.00 1.00 - - -Business Development Total1.00 1.00 2.00 1.00 2.00 1.00 Partnerships, Family and Community Engagement DIR OF SBC PARTNERSH 1.00 - - - -EXEC DIR-COMM PRTNSP ENG - 1.00 - - -EXECUTIVE DIRECTOR - SCHOOL, BUSINESS, & COMMUNITY PARTNERSHIPS - - 1.00 1.00 1.00Partnerships, Family and Community Engagement Total1.00 1.00 1.00 1.00 1.00Ofc. of Schl, Bus. & Com Partn Total 2.00 2.00 3.00 2.00 3.00 1.00 Partnerships & Community Engag Executive Administration ADMIN ASSISTANT II - - - - -ASST DIR - STRG INIT 1.00 - - - -COORD VOLUNTEERS - - - - -Executive Administration Total1.00 - - - -Partnerships, Family and Community Engagement BILIN SPEC - FACE - - - - -COMMNTY OUTREACH MGR - - - - -FACE CTR MANAGER - - - - -FACE MANAGER 1.00 - - - -PARENT LIAISON COORD - - - - -PARENT LIAISON-BILIN - - - - -SPECIALIST - - - - -VOLUNTEER COORD - - - - -Partnerships, Family and Community Engagement Total1.00 - - - -Summer and Extended Learning COORD - LINK CLUB 1.00 - - - -Summer and Extended Learning Total1.00 - - - -Partnerships & Community Engag Total 3.00 - - - -Grand Total 18.50 21.50 25.00 22.00 33.00 11.00
Page 332 ACPS FY 2024 Proposed Budget Instructional Support Departments
Communications Budget and Actuals Section Title
School and Community Relations
School and Community Relations
Page 333 ACPS FY 2024 Proposed Budget Instructional Support Departments
Section Title Miscellaneous 158 - 600 200 300 Travel 278 - 1,100 1,100 1,100 Materials and Supplies Educational and Recreational Supplies 1,200 572 900 1,400 1,300 Technology - 7,822 500 800 800 Improvement of Instruction Salaries28,650 19,275 - -Employee Benefits FICA/Medicare 2,192 1,475 - -Partnerships, Family and Community Engagement Salaries133,836 139,834 145,287 154,877 161,927 Employee Benefits FICA/Medicare 9,871 10,389 11,115 11,360 12,389 Hospital/Medical Plans 20,444 17,172 15,880 16,034 16,435 Other Benefits 300 - - -Other Insurance 527 537 611 628 626 Retirement/Group Life 23,220 25,053 26,233 28,468 29,165 Purchased Services Professional Services - Other - - 3,700 3,700 500 Partnerships & Community Engag Executive Administration Salaries206,050 - - -Employee Benefits FICA/Medicare 15,477 - - -Hospital/Medical Plans 23,230 - - -Other Insurance 792 - - -Retirement/Group Life 34,966 - - -Partnerships, Family and Community Engagement Salaries400,105 - - -Employee Benefits FICA/Medicare 29,130 - - -Hospital/Medical Plans 67,308 - - -Other Insurance 1,465 - - -Retirement/Group Life 52,015 - - -Purchased Services Printing and Binding 5,147 - - -Professional Services - Instructional Support 28,437 - - -Professional Services - Other 17,749 - - -Transportation Services 340 - - -Internal Services Print Shop 6,412 - - -Transportation 211 - - -Other Charges Communications 6,139 - - -Course/ Event Fees and Dues - - - -Travel 9,047 - - -Materials and Supplies Educational and Recreational Supplies 16,425 - - -Food Supplies and Food Service Supplies 18,780 - - -Other Supplies 75 - - -Technology 51,136 - - - -
Accountability and Research
Department and Office Contact
Department of Accountability & Research
Dr. Clinton Page, Chief of Accountability & Research
1340 Braddock Place
Alexandria, Virginia 22314
Tel: 703-619-8032 | Fax: 703-619-8989
clinton.page@acps.k12.va.us
https://www.acps.k12.va.us/departments/accountability-research
Responsibilities
The vision statement of Accountability and Research is: “Anyone can measure; Together we Illuminate, Innovate, and Improve.”
The mission of Accountability and Research in ACPS is to provide decision-makers with valid, reliable, and timely data to enhance the quality of education offered to students.
The Department of Accountability and Research leads the division strategic planning efforts, program evaluations and surveys, division standardized assessments administration, data analysis and reporting, organizational continuous improvement efforts, and external research review and approval processes.
The Department of Accountability and Research leads the creation, implementation, monitoring, and refinement processes of the ACPS strategic plan. This includes leading and facilitating groups of internal and external stakeholders across all phases of the division’s strategic plan ensuring appropriate organizational alignment, prioritization, and monitoring. The department works collaboratively with internal stakeholders to
identify, collect, analyze, publicly report, and make necessary improvements from key data indicators throughout the implementation of the strategic plan.
The department also manages all aspects of a wide-ranging assessment system. The department implements the division’s standardized testing program and reports on students’ results for a variety of tests. The Virginia Department of Education requires some of the tests; others are required by ACPS; and others, such as the SAT or Advanced Placement (AP), are selected by students. Typically, these tests are administered to all students at a specific grade level, through course enrollment, or to a certain subgroup (e.g., EL).
Tests administered or overseen by the Department of Accountability include:
• Virginia’s Standards of Learning (SOL) tests (six main administrations and six expedited administrations per year)
• Virginia Growth Assessments (two times each year)
• Virginia Alternate Assessment Program (VAAP)
• The Phonological Awareness Literacy Screening (PALS) (two to three times each
Page 334 ACPS FY 2024 Proposed Budget Instructional Support Departments
Accountability and Research
year)
• Assessing Comprehension and Communication in English State to State (ACCESS) for EL
• The Naglieri Nonverbal Ability Test (NNAT3)
• The Cognitive Abilities Test (CogAT)
• Virginia Kindergarten Readiness Program
The Department of Accountability and Research coordinates or produces a wide array of reports and presentations to provide decision-makers with valid, reliable, and timely data to enhance the quality of education offered to students. The department provides these services to a wide array of stakeholders including the Superintendent, School Board, senior leadership, school administration, instructional staff, support staff, parents, students, and community members.
Along with analyzing and reporting test and survey data, the department evaluates the efficacy of various programs and services offered by the school division. The department engages in monitoring and evaluation activities to drive decisions that encourage the use of best practices. Programs are evaluated at the request of the Superintendent, School Board and ACPS departments.
The department works collaboratively with other Central Office departments on implementing continuous improvement structures, processes, and beliefs within the organization. This includes the school and department improvement planning processes as well as individual improvement efforts identified throughout the division.
Additionally, all external research requests and all survey requests that include ACPS schools, students, or staff, are reviewed by the department for practicality and methodology.
Tertiary responsibilities include providing
ACPS staff and departments with training and/or other educative utilities related to the department’s specialized expertise in assessment, research, statistics, and evaluation.
Transitioning to the Department of Accountability is the Office of School Improvement which focuses on facilitating the division’s school improvement planning process for more than 18 schools as well as the achievement of continuous academic improvement, especially in the area of Tier I teaching and learning, as articulated in the division’s Multi-Tiered System of Support (MTSS). This office’s primary goal is to ensure that ACPS leaders and educators are equipped with the tools and skills to Instructional Support Departments engage in continuous improvement practices necessary to successfully implement School Improvement Plans (SIPs) and the respective processes to achieve specific performance targets and outcomes Additionally, this office is responsible for establishing and implementing a systematic and cyclical management system to analyze and prioritize divisionwide formative assessments plans, collect data, and subsequently develop action and tools for monitoring as well as reporting outcomes. The integration of the Office of School Improvement into the Department of Accountability will allow for a more cohesive approach to improvement efforts within the division.
Page 335 ACPS FY 2024 Proposed Budget Instructional Support Departments
Accountability and Research
Accountability & Research
Chief of AccouDrntability and Research
Dr. Clinton Page
Evaluation and Research
Efficacy of ACPS programs and services
External research requests Survey requests
Data Analysis and Reporting
Reports and presentations to provide valid, reliable and timely data to:
Superintendent
School Board
Division Administration
Instructional and Support Staff
Parents
Students
Community
Strategic Planning
Leads the creation, implementation, monitoring, and refinement of the ACPS strategic plan
Office of School Improvement
Dr. Anthony Sims, Executive Director
Technical Support
Offer training in the areas of:
Assessment
Evaluation
Surveys
Research Statistics
Test Administration
Administer or Oversee:
Virginia’s Standards of Learning (SOL) tests
Virginia Alternate Assessment Program (VAAP)
The Phonological Awareness Literacy Screening (PALS)
Assessing Comprehension and Communication in English State to State (ACCESS) for EL
The Naglieri Nonverbal Ability Test (NNAT3)
The Cognitive Abilities Test (CogAT)
Virginia Kindergarten Readiness Program
Virginia Growth Assessments
Continuous Improvement
Implements continuous improvement structures, processes, and beliefs within the organization
Page 336 ACPS FY 2024 Proposed Budget Instructional Support Departments
Accountability and Research
Budget Summary
The Department of Accountability and Research budget supports the testing administration program, division-wide program evaluations, and data analysis and reporting. The FY 2024 Operating Funded Budget totals $1.52 million, a slight increase compared to the prior fiscal year. Positions remain unchanged at 6.00 FTEs.
The purchased services category will budgeted at $0.21 million to fund testing and evaluation, printing and binding, professional temp,
software maintenance, and other professional services.
The other charges category is budgeted at $0.10 million and will continue to fund dues/ association membership, staff development, mileage reimbursements, and postal services.
Page 337 ACPS FY 2024 Proposed Budget Instructional Support Departments
Accountability and Research Staffing Section TitleProgram Roll-Up Group TitlePosition Title FY 2020 Final FTE FY 2021 Final FTE FY 2022 Final FTE FY 2023 Final FTE FY 2024 Proposed FTE Change FY 2023 to FY2024 Accountability and Research Evaluation and Planning ADMIN ASSISTANT I- - - - -ADMIN ASSISTANT II1.00 1.00 1.00 1.00 1.00ANALYST - EVALUATION & ASSESSMENT - - 3.00 3.00 3.00ANALYST - TESTING & IMPROVEMENT- - - - 1.00 1.00 CHIEF ACCOUNTABILITY- 1.00 - - -CHIEF OFFICER - ACCOUNTABILITY- - 1.00 1.00 1.00EVAL ASSESS ANLYST2.00 3.00 - - -TEST & IMPRV ANALYST1.00 1.00 1.00 1.00 - (1.00) Evaluation and Planning Total4.00 6.00 6.00 6.00 6.00Accountability and Research Total 4.00 6.00 6.00 6.00 6.00Accountability Evaluation and Planning CHIEF ACCOUNTABILITY1.00 - - - -EVAL ASSESS ANLYST1.00 - - - -TEST & IMPRV ANALYST- - - - -TESTING DATA ANALYST- - - - -Evaluation and Planning Total2.00 - - - -Accountability Total 2.00 - - - -Grand Total 6.00 6.00 6.00 6.00 6.00 -
Page 338 ACPS FY 2024 Proposed Budget Instructional Support Departments Accountability
Research Section Title
and
Teaching, Learning and Leadership
Department and Office Contacts
Department of Teaching, Learning, and Leadership
Dr. Wendy Gonzalez, Chief of Teaching, Learning, and Leadership
1340 Braddock Place
Alexandria, Virginia 22314
Tel: 703-619-8020 | Fax: 703-619-8986
wendy.gonzalez@acps.k12.va.us
https://www.acps.k12.va.us/departments/teaching-learning-leadership
Department Overview
The Chief of Teaching, Learning, and Leadership (TLL) leads this department, which supports the implementation of high-quality instructional programs. These programs include student access to an engaging and rigorous curriculum, exemplary and effective teaching, highly effective instructional leaders, ongoing professional development, and academic enhancement and intervention programs. TLL provides leadership to the following offices: English Learner (EL) Services, Instructional Support, School Improvement, School Leadership, and Specialized Instruction.
The organizational manner of the staff supports the division in achieving the ACPS 2025 Strategic Plan: Equity for All. More specifically, the department commits to working collaboratively and providing services as well as support to ensure the empowerment of all students to thrive in a diverse and everchanging world. At the core of TLL’s work is a commitment to removing barriers that prevent all students from achieving their goals and aspirations. TLL’s collective commitment is to align programs, initiatives, strategies, systems, and resources, so that staff and students thrive
and achieve at high levels.
The priority work in TLL does not occur in a silo. TLL will continue to work with other departments within the school division to achieve the five ACPS 2025 Strategic Plan goals: 1) systemic alignment, 2) instructional excellence, 3) student accessibility and support, 4) strategic resource allocation, and 5) family and community engagement. As the division builds a culture of continuous improvement and designs equitable systems for school and instructional improvement, TLL is integral to successfully implementing key measures, strategies, and actions associated with each strategic plan goal.
In addition, TLL supports all aspects of teaching and learning in one early childhood center, 12 elementary schools, one K–8 school, one PreK–8 International Baccalaureate (IB) school, two middle schools, and one high school (located on multiple campuses). The department works collaboratively with principals, assistant principals, teachers, paraprofessionals, and others to create exemplary educational experiences for all ACPS students. Ultimately, the department’s primary goal is to keep equity at the core of our work and ensure that all ACPS students are engaged in classroom
Page 339 ACPS FY 2024 Proposed Budget Instructional Support Departments
Teaching, Learning and Leadership
instruction and have the educational resources and opportunities to graduate ready for college, careers, and life.
Configuration of Offices Within the Department
The Office of English Learner (EL) Services provides a variety of services to students and families who have a primary language other than English. This office is responsible for registering students in families who have a primary language other than English, assessing students for English language proficiency to determine eligibility for program services, and evaluating transcripts from countries outside the United States. The Parent Coordinator in this office also provides orientation materials and connects families with community resources.
Additionally, this office provides guidance and support to schools to promote language acquisition and academic achievement for ELs, ensures compliance with federal and state regulations for serving ELs, supports the Dual Language Education Programs, and coordinates translation and interpretation services to enhance communication with families who have a primary language other than English. This office also integrates best practices and resources into the ACPS curriculum to address ELs’ needs.
The Office of Instructional Support focuses on ensuring a guaranteed and viable curriculum for all ACPS students, Pre-K–12. This office’s responsibilities include all core and encore subjects as well as career and college preparation programs and services. It also includes a fully articulated set of career and college preparation programs and services for all ACPS learners, grades Pre-K–12. To ensure that ACPS students are prepared for as many opportunities as possible while in school and beyond their completion of high school, this team supports the continued expansion of dual enrollment, opportunities for industry certifications, and avenues for students to
earn an associate’s degree while completing high school credits for an Advanced Studies Diploma. Specific offices and teams within this office include:
The Office of Adult Education manages the federal Adult Education and Family Literacy Act (AEFLA) Grant as well as the following state grants: the Race to GED Grant, the Adult General Education (AGE) Grant, and the Individual Student Alternative Education Program (ISAEP) General Educational Development (GED) Grant. These grants support basic programs and literacy education programs for adults who need a high school diploma or are not proficient in English. This office also manages programs utilizing ACPS’s operating and grant funds that support the Adult High School Diploma Program, the GED Program, and English Language Learner (ELL) adult education and workforce development.
The Advancement Via Individual Determination (AVID) school-wide system, which includes the AVID Elementary and AVID Secondary Model, is a college-readiness system designed to advance the trajectory and long-term outcomes for all students. The AVID school-wide system at both the elementary and secondary levels focuses on targeting and expanding school-wide instruction and leadership capacity by creating a college-going culture that increases the number of students who enroll and succeed in courses of rigor and eventually higher education and who are workplace ready upon graduation. Additionally, the AVID Secondary Model supports approximately 600 students who enroll in the AVID elective over a series of years to take part in advanced courses and receive proper support for academic success. Overall, AVID addresses college readiness through rigorous course preparation, opportunity knowledge, and student agency by advocating for students and breaking down barriers to higher education.
The Office of Career and Technical Education (CTE) manages and oversees
Page 340 ACPS FY 2024 Proposed Budget Instructional Support Departments
Teaching, Learning and Leadership
the Carl Perkins Grant. This federal grant provides an increased focus on the academic achievement of CTE students, strengthens the connections between secondary and post-secondary education, and improves state and local accountability. This office also manages state grants supporting workplace development, equipment purchases, and certification testing and oversees state and federal compliance of all Business, Marketing, Health and Medical Science, Junior Reserve Officers’ Training Camp (JROTC), Family and Consumer Sciences, Technology Education, and Trade and Industrial Education Programs, including the Governor’s Health Sciences Academy, the Academy of Finance, and the STEM Academy.
The Office of Early Childhood Programs (Pre-Kindergarten) provides leadership and coordination of the division-wide implementation of early childhood education and collaborates with other City of Alexandria providers to ensure consistent delivery of services focused on kindergarten readiness. Focus areas for this office include high-quality professional learning, equitable access to resources, curriculum development, and effective teacher-child interactions. This office consistently monitors data to support informed decision-making, child development, and continuous program improvement. This office also prioritizes family and community engagement to support social, emotional, academic, and developmental readiness for Alexandria’s youngest learners.
The Humanities Team focuses on the improvement of student achievement in the areas of fine arts, health and physical education, social studies (including history, economics, political science, and servicelearning), and world languages. Team members include Instructional Specialists for fine arts, health and physical education, social studies, and world languages. Additionally, this team includes a dedicated specialist from the Offices of English Learner (EL) Services and
Specialized Instruction. This team collaborates to ensure appropriate content alignment within these disciplines; supports problem-based/ service-learning opportunities for students; engages teachers in implementing crosscontent activities; and supports students’ social, emotional, and academic needs.
The Library and Curricular Resources supports all offices across the TLL Department. Moreover, ACPS school libraries serve all students, staff, and school communities, providing over 250,000 library books and rigorous, relevant instructional programming. Our curricular resources are coordinated to quickly and efficiently serve the needs of TLL and all school staff in order to support guaranteed and viable curriculums to students. Our curricular adoption processes ensure that ACPS procures the optimal curriculum resources to increase student learning, is aligned with state standards, and maximizes return on curricular investments.
The Literacy Team is a Pre-K–12 team committed to ACPS students’ achievement in reading, writing, speaking, listening, research, and media presentation skills. This team includes elementary and secondary English Language Arts specialists and representatives from the Offices of Early Childhood Programs (Pre-Kindergarten), English Learner (EL) Services, Specialized Instruction, and Talented and Gifted (TAG) Programs. This team strategically and deliberately focuses on ways to ensure that more students are reading at their grade level and have language skills that enable them to access the curriculum and other literacy-related resources effectively.
The Science, Technology, Engineering, and Mathematics (STEM) Team focuses on the improvement of K–12 students’ achievement in the STEM areas of learning. This team comprises elementary and secondary science instructional specialists as well as a representative from the Offices of English
Page 341 ACPS FY 2024 Proposed Budget Instructional Support Departments
Teaching, Learning and Leadership
Learner (EL) Services, Specialized Instruction, and Talented and Gifted (TAG) Programs. A major priority for this team is to provide direct services and support resources to schools in order to improve student achievement in the areas of science and mathematics. Additionally, the team is responsible for helping schools implement an integrated and blended learning approach to engage students in mathematical problem-solving and scientific inquiry processes. The STEM Team also helps educators to integrate STEM concepts and problem-solving into a more interdisciplinary and holistic approach to STEM education within the division.
The Office of Talent Development supports all offices in providing professional development opportunities for teachers, administrators, and support staff. This office ensures that procedures for providing professional learning align with the characteristics of high-performing school districts. Additionally, this office works to ensure that professional development and growth opportunities carefully align with the ACPS 2025 Strategic Plan: Equity for ALL. This office also coordinates new teacher orientation, induction activities, and comprehensive professional learning opportunities for all staff.
The Office of Talented and Gifted (TAG) Programs ensures effective identification and delivery of services for K–12 students who perform or show the potential to perform significantly above grade level. These services and programs address the General Intellectual Aptitude (GIA), the Specific Academic Aptitude (SAA), and Young Scholars (YS). This office coordinates and conducts professional development for school-based personnel who coordinate the identification process and services to TAG students and families. TAG teachers use supplemental curriculum materials and resources to enhance and extend differentiation. There is a minimum of one TAG teacher on each elementary campus and one TAG resource teacher at each middle school program. In addition, this office coordinates
opportunities for gifted and high-achieving students, such as the Governor’s School and Odyssey of the Mind competitions, and supports the Talented and Gifted Advisory Committee (TAGAC), which is a School Board Advisory Committee (SBAC).
The Office of School Leadership is a newly formed office within TLL. Currently, this office consists of the Executive Director with support from an Executive Assistant who also supports other offices. The Executive Director is responsible for providing exemplary and innovative leadership as well as executive coaching for 18 school principals in developing the essential instructional leadership skills and practices to support teaching and learning within their schools. The focus of this office is to specifically support and grow school leaders through coaching, professional learning, data analysis, and implementation of best educational practices through the lens of leadership.
The Office of Title I Programs and School Improvement provides leadership in the coordination of division offices and programs to implement school support structures. The purpose of the Title I grant is to ensure that all children are afforded the opportunity to receive a fair, equitable, and high-quality education as part of the division’s commitment to closing educational equity and opportunity gaps. This office ensures meaningful compliance and integration of state and federal expectations for academic achievement and school improvement under various federal and state programs, including federal school improvement programs.
The Office of Specialized Instruction ensures that a continuum of Special Education (SPED) services are provided to students with disabilities (SWD), as required by the Individuals with Disabilities Education Act (IDEA). The staff supports schools by coaching and modeling effective instructional practices and behavioral interventions related SWD. In
Page 342 ACPS FY 2024 Proposed Budget Instructional Support Departments
Teaching, Learning and Leadership
addition, this office provides support to families through outreach and technical support from the Anne R. Lipnick Special Education Parent Resource Center. These resources enable families to become engaged partners in their child’s educational success. This office is responsible for providing resources within the ACPS curriculum to address the needs of students with Individualized Education Programs (IEPs).
Departmental Budget and Grant-Funded Services
The operating budget is the key funding source for the department; however, several grants supplement the funding for specific purposes:
The Office of Early Childhood Programs (Pre-Kindergarten) manages the Virginia Preschool Initiative (VPI) Grant for ACPS and acts as the fiscal agent for private providers throughout the city. Furthermore, this office coordinates the Unified Virginia Quality Birth to Five System (VQ B5) Grant for Alexandria City and serves as the liaison for Early Head Start and Head Start Programs.
The Office of English Learner (EL) Services manages the federal Title III Grant, including subprograms. The Title III Grant specifically targets the promotion of language instruction for ELs and immigrant youth.
The Office of Specialized Instruction oversees the Title IV IDEA and IDEA Preschool Grants. These grants provide funds for personnel and the materials directly supporting SWD.
The Office of Talent Development manages the Title II, Part A Grant. The purpose of the Title II, Part A Grant is to increase academic achievement by improving teacher and principal quality. Title II funds focus on improving teacher and leader quality and increasing student success by providing evidencebased, sustainable, intensive, collaborative, jobembedded, data-driven, and classroom-focused
professional development activities. This office also oversees the state’s teacher-mentor grants while facilitating and coordinating the mentoring program for both new and novice teachers, managing the tuition reimbursement program, creating K–12 interactive professional learning videos focused on researchproven instructional practices and overseeing the professional learning management software system to support professional development across the division.
The Office of Title I Programs and School Improvement operationalizes division requirements for the expenditure of federal funds under Title I programs and subprograms. Title I funds provide supplemental assistance to schools with high concentrations of students living under low-income circumstances.
Page 343 ACPS FY 2024 Proposed Budget Instructional Support Departments
Teaching, Learning and Leadership
Teaching, Learning, & Leadership Chief of Teaching, Learning & Leadership
Dr.
Wendy Gonzalez
English Learner Services
Instructional Support
Carmen Sanders, Executive Director
Adult Education Program
Teri Barnett, Director
Adult Basic Education
ELL Adult Education
General Education Diploma (GED)
High School Diploma
Individual Student Alternative Education Plan (ISAEP)
State Grant Administration
Workforce Development
Advancement Via Individual
Determination (AVID) Secondary and Elementary Systems
Jodie Peters, Coordinator
Advancement Via Individual Determination (AVID)
Early Identification Program (EIP)
Career and Technical Education
Dr. Tricia Jacobs, Director
Business and Information Technology
Family and Consumer Sciences
Grant Administration
Governor’s Health Science Academy
Health and Medical Sciences
JROTC Marketing
State and Federal Regulatory Oversight Technology Education
Trade and Industrial Education
Dr. Izora Everson, ACPS Virtual Learning Administrator
Library and Curricular Resources
Kaycie Hoffman‐Blaylock, Coordinator
Early Childhood
(Pre‐Kindergarten Programs)
Jane Richardson, Coordinator
Preschool Programs
Virginia Preschool Initiative (VPI)
Grant Administration
Virginia Quality (VQ) Grant Administration
VQ Fiscal Agent and Local Coordinator For Preschool Programs In The City of Alexandria
VPI Grant Fiscal Agent For Preschools In The City of Alexandria
Humanities
Tanja Mayer‐Harding, Coordinator
Fine Arts
Health, Family Life Education, and Physical Education
Social Studies and Humanities
World Languages
Literacy
Kimberly Schell, Coordinator
Early Childhood/Pre‐K Programs
Literacy
K‐3 Talented and Gifted (TAG)
Science, Technology, Engineering, and Mathematics (STEM)
Julia Neufer, Coordinator Mathematics Science
Talented and Gifted Program
Megan Tempel‐Milner, Director
Talented and Gifted (TAG) Programs Young Scholars Program
Dr. Bethany Nickerson, Executive Director
English Learner (EL) Programs
Dual Language Programs
Student Registration and Assessment
Title III Grant Administration
Translation and Interpretation
School Leadership
Dr. Pierrette Finney, Executive Director
School Principals
Title I Programs
Natalie Mitchell, Director
Title I Programs Administration
Federal School Improvement Programs Administration
State Accreditation
Title I Summer Learning‐ NWEA MAP‐ MTSS
Specialized Instruction
Theresa Werner, Executive Director
Adaptive Communications & Assistive Technology
Autism
Early Childhood Special Education Emotional Disabilities
Extended School Year (ESY)
Hearing Impaired
Homebased Services
IDEA Grant Administration
Intellectual Disabilities
Multiple Disabilities
Occupational & Physical Therapy
Parent Resource Center
Private Day Placement
Secondary Transition
Special Education Preschool
Speech & Language Impaired
Page 344 ACPS FY 2024 Proposed Budget Instructional Support Departments
Teaching, Learning and Leadership
Budget Summary
The Department of Teaching, Learning and Leadership’s FY 2024 Operating Funded Budget totals $22.86 million, an increase of $1.33 million over the prior fiscal year. There is an decrease of 0.50 FTE across all Teaching, Learning, and Leadership offices for a total of 101.95 FTE positions.
Office of Chief Teaching, Learning, & Leadership
The Office of Teaching, Learning, and Leadership’s budget provides funds to support all of the offices in Teaching, Learning, and Leadership through leadership and professional development. The FY 2024 budget totals $0.77 million, an increase of $0.06 million compared to the prior fiscal year. Staffing will remain the same at 4.00 FTE for FY 2024.
Instructional Support
The office oversees Curriculum Design and Instructional Services, Career and Technical Education, Humanities, Literacy, STEM, Talent Development, Early Childhood, Adult Education, Talented and Gifted, and AVID/ College Readiness. For FY 2024, the Operating Funded Budget totals $1.73 million. This includes shifted resources from Elementary School Instructions and Secondary School Instructions to support the summer program. The office will staff 2.50 FTE positions, which includes an additional 1.00 FTE Grant Funded position.
The purchase services category will continue to provide funds for other printing & binding, staff development, and to support the Concurrent Enrollment with NOVA/Early College Program.
Elementary School Instruction
As part of the FY 2021 reorganization, the Office of Elementary School Instruction budget was reallocated to support the new Instructional Support Office and School Improvement Office.
Secondary School Instruction
As part of the FY 2021 reorganization, the Office of Secondary School Instruction budget was reallocated to support the new Instructional Support Office.
Adult Education
The Adult Education budget supports the day program and the midday ELL program offered at central office and the night program offered at Alexandria City High School. Courses include Adult Basic Education, ELL adult education, General Education Diploma (GED), high school diploma and Individual Student Alternative Education Plan (ISAEP). The FY 2024 operating funded budget is $0.76 million, an increase of $0.02 million compared to the FY 2023 Final Budget. The operating fund continues to fund 3.00 FTE positions. In addition, the Adult Detention Center and Division of Criminal Justice Services (DCJS)Detention grants fund a 1.00 FTE teacher at the Adult Detention Center.
The intermittent salary accounts will increase in FY 2024 to a total $0.24 million. This is $1,659 over FY 2023. Purchased services encompasses funding for testing materials and other professional services. Funding will slightly decrease to $0.02 million.
Advancement Via Individual Determination (AVID) / College Readiness
The AVID/College Readiness budget funds the AVID program and George Mason University Early Identification Program (GMU-EIP). Both support college readiness for select students and for all secondary and elementary sites that are part of the AVID System. The FY 2024 budget totals $0.60 million, a slight increase compared to the prior fiscal year. Staffing remains at 1.00 FTE.
In the purchased services category, funding provides for staff development, and other printing and binding. Funding in internal
Page 345 ACPS FY 2024 Proposed Budget Instructional Support Departments
Teaching, Learning and Leadership
services continues to provide transportation for AVID students to participate in college visits and other events and GMU-EIP students to attend the Saturday Power Aid program.
Career and Technical Education
The Career and Technical Education (CTE) budget supports the program in middle and high schools. The office remains relatively steady in operating funding at $0.48 million. The operating fund will remain at a total of 2.00 FTE positions.
In the materials and supplies category, funding will be used to provide CTE textbooks to address replacement and growth in areas such as economics and personal finance.
The CTE office will also receive $0.31 million funded by the Carl Perkins Vocational Education fund and as well $56,297 in funding from the Virginia Department of Education.
Curriculum Design and Instructional Services
The Curriculum Design and Instructional Services budget supports curriculum areas with textbooks, curriculum writing, and instructional materials. The FY 2024 budget is $2.27 million, a decrease of $0.27 million compared to the prior fiscal year. Positions will reduce to a total of 13.00 FTEs compared to the prior fiscal year.
The materials and supplies category funded at $0.20 million will support the purchase of textbooks, library books & supplies, and software & online charges.
Early Childhood (Pre-Kindergarten Programs)
The main funding sources for the prekindergarten program are the Virginia Preschool Initiative (VPI) and the transfer from the operating fund. The total VPI budget for FY 2024 is $3.81 million, including the funding designated for the private preschool providers in the City of Alexandria. There are 34.00 FTEs
funded through VPI; 16.00 FTE teachers and 16.00 FTE instructional assistants at JeffersonHouston, Early Childhood Center, and William Ramsay; 2.00 FTE positions at Pre K program office.
This office will also receive an additional $30,000 funded from the operating budget to assist with the implementation of the Early Care and Education System Building initiative.
Humanities
The office supports programs such as foreign languages, music, physical education and health, drama, social studies, and world language. The FY 2024 Operating Funded Budget totals $0.44 million for the office of humanities.
Literacy
The office will have an operating funded budget of $0.38 million to support english language arts. The budget within the materials and supplies category will provide software and online charges, audiovisual supplies, instructional supplies, textbooks, and refreshments.
Science, Technology, Engineering and Math (STEM)
The operating funded budget will total $0.64 million for FY 2024. This includes funding in the materials and supplies category for consumable texts, software and online charges, instructional supplies, and other operating supplies to support the STEM program.
Talent Development
The Talent Development budget supports the division-wide professional development program, content academies and the teacher mentor program. Funding for the FY 2024 Operating Funded Budget is $1.30 million, a slight increase compared to the prior fiscal year. Positions will increase to 3.00 FTE positions.
The materials and supplies category
Page 346 ACPS FY 2024 Proposed Budget Instructional Support Departments
Teaching, Learning and Leadership
will increase to $0.15 million to fund refreshments, office supplies, library books and supplies, instructional supplies, and more.
The Talent Development Office is also funded through Title II. The purpose of the program is to increase academic achievement by improving teacher and principal quality. This program is carried out by increasing the number of highly qualified teachers in classrooms; increasing the number of highly qualified principals and assistant principals in schools; and increasing the effectiveness of teachers and principals by holding local education agencies (LEAs) and schools accountable for improvements in student academic achievement. While schools do not receive these funds directly, these funds support division-wide staff development, including the summer content academies.
Talented and Gifted Programs
The Talented and Gifted (TAG) Programs budget supports both the TAG and Young Scholars programs. The FY 2024 Operating Funded Budget totals $0.79 million, a slight increase compared to the prior fiscal year. Staffing will increase to 3.70 FTEs. This includes an additional 1.00 FTE TAG teacher position.
The purchased services category will continue to fund transportation through public carriers, testing and evaluation, staff development, instructional services, and other printing and binding.
The materials and supplies category will continue to receive funds for refreshments, instructional supplies, other technology equipment, office supplies, paper supplies, and promotional items.
English Learner (EL) Services
The EL budget supports all EL activities division-wide, dual language programs, and translation and interpretations services. The operating funded budget is $3.62 million for FY
2024, an increase of $0.12 million. There are 19.00 FTE positions in this office; 3.00 FTEs funded thorugh Title III grant and 16.00 FTEs funded through operating fund for FY 2023.
Funding for intermittent and supplemental salaries increased by $4,932. The operating budget for FY 2024 will continue to support student registration and assessment. The budget allocated for this in FY 2024 is 0.39 million.
The purchased services category includes continued funding for ACCESS for ELLs testing material, management services, translation services, testing and evaluation, staff development, and other printing and binding. The budget allocated for this in FY 2024 is 0.79 million.
The EL Services Office also receives funds through Title III. Federal funds awarded under Title III support programs to improve the education of limited English proficient (LEP) children and youths by helping them learn English and meet challenging state content and achievement standards. Title III programs also provide enhanced instructional opportunities for immigrant children and youths. Schools do not receive these funds directly, but are supported through staff development, and instructional materials.
Specialized Instruction
The Office of Specialized Instruction budget supports all special education services divisionwide, including the Extended School Year (ESY) program and private placements. The FY 2024 operating funded budget is $8.00 million, an increase of $0.34 million over FY 2023. Additionally, the office will increase in staffing by 1.00 FTE position to a total of 85.00 FTE positions. The FY 2024 operating fund will support 52.5 FTEs and grants will fund 32.5 FTEs.
The purchased services category will be budgeted at $0.45 million for FY 2024. This
Page 347 ACPS FY 2024 Proposed Budget Instructional Support Departments
Teaching, Learning and Leadership
will remain unchanged compared to FY 2023. The budget for transportation of students with disabilities whose individualized education plan (IEP) requires this accommodation and is now reflected in the Transporation Department budget.
The Office of Specialized Instruction receives funds through the Individuals with Disabilities Education Act (IDEA). The IDEA is a law ensuring services to children with disabilities throughout the nation. IDEA governs how states and public agencies provide early intervention, special education and related services to children and youth with disabilities. This grant funds an early childhood special education teacher, a special education teacher, a speech language pathologist, and several specialists and coordinators. In addition, technology equipment and instructional supplies are funded through the IDEA grant.
School Improvement
The office will supervise the Office of Title I Programs. For FY 2024 the Operating Funded Budget totals $0.54 million.
This includes operating funded staffing of a 0.50 FTE Administrative Assistant II and a 1.00 FTE Executive Director position.
Title I Programs
The operating budget for Title I Programs funds a portion of both the director and coordinator salaries, association membership dues, travel and refreshments for parental engagement activities that are not covered through Title I. The FY 2024 operating funded budget totals $0.33 million, an increase of $4,053 compared to the FY 2023 Final Budget.
This includes operating funded staffing of a 0.25 FTE Director position and 0.50 FTE School Improvement Coordinator position split funded with the Title I Part A grant. A total of 4.25 FTE positions are funded through Title I grant.
The majority of the office budget is funded through Title I. Title I, Part A of the Elementary and Secondary Education Act (ESEA), as amended, provides financial assistance to local educational agencies (LEAs) and schools with high numbers or high percentages of children from low-income families to help ensure that all children meet challenging state academic standards. For FY 2024, Cora Kelly, Francis C. Hammond, Jefferson-Houston, John Adams, Patrick Henry, Ferdinand T. Day, James K. Polk, and William Ramsay will receive Title I funding. These funds will be used for school-based personnel, staff development, translation, technology equipment and software, instructional supplies, and parent and family engagement activities. All items must supplement what is provided to all schools, by formula, in the operating budget.
School Leadership
The office will supervise all school principals. For FY 2024, the Operating Funded Budget totals $0.06 million. This includes only funding for non compensation budget.
Page 348 ACPS FY 2024 Proposed Budget Instructional Support Departments
Teaching, Learning and Leadership
Page 349 ACPS FY 2024 Proposed Budget Instructional Support Departments
Teaching, Learning, Leadership Staffing Section Title Program Roll-Up Group Title Position Title FY 2020 Final FTE FY 2021 Final FTE FY 2022 Final FTE FY 2023 Final FTE FY 2024 Proposed FTE Change FY 2023 to FY2024 Teaching, Learning, Leadership Executive Administration CHIEF ACADEMIC OFFCR - 1.00 - - -CHIEF OF TEACHING, LEARNING, & LEADERSHIP - - - - 1.00 1.00 CHIEF OF TEACHING, LEARNING, & LEADERSHIP (TLL) - - 1.00 1.00 - (1.00) FINAN SUPPT SPEC-C&I 1.00 1.00 - - -FINAN SUPPT SPEC-TLL - - 1.00 - -FINANCIAL SUPPORT SPECIALIST - TLL - - - 1.00 1.00Executive Administration Total 1.00 2.00 2.00 2.00 2.00Improvement of Instruction EXEC ADMIN ASST - TLL - - - 1.00 1.00EXEC ADMIN ASST-CAO 1.00 1.00 - - -EXEC ADMIN ASST-TLL - - 1.00 - -Improvement of Instruction Total 1.00 1.00 1.00 1.00 1.00Technology Services ADMINISTRATOR - VIRTUAL LEARNING - - - 1.00 1.00Technology Services Total - - - 1.00 1.00Teaching, Learning, Leadership Total 2.00 3.00 3.00 4.00 4.00Chief Academic Officer Executive Administration CHIEF ACADEMIC OFFCR 1.00 - - - -Executive Administration Total 1.00 - - - -Chief Academic Officer Total 1.00 - - - -School Leadership Improvement of Instruction EXECUTIVE DIRECTOR - SCHOOL LEADERSHIP - - - 1.00 - (1.00) Improvement of Instruction Total - - - 1.00 - (1.00) School Leadership Total - - - 1.00 - (1.00) Curriculum Design & Inst Srvcs Improvement of Instruction ADMIN SPECIALIST 1.00 1.00 1.00 1.00 1.00COORD - PLANETARIUM - - 1.00 1.00 1.00COORD TEXT,MEDIA,LIB 1.00 1.00 - - -COORD/TEAM LEADER 1.00 3.00 3.00 3.00 3.00ESSER III - SUPPORT SPECIALIST II: PEDESTRIAN & BIKE EDUCATION - - - - 0.50 0.50 INSTR FINE ART SPLST 1.00 1.00 1.00 1.00 - (1.00) INSTR HLT PE SPCLST 1.00 1.00 1.00 1.00 - (1.00) INSTR LIT SPECIALIST 2.00 1.00 1.00 1.00 - (1.00) INSTR MATH SPECIALIS 1.00 1.00 1.00 - -INSTR MATH SPECIALIST - - - 1.00 - (1.00) INSTR SCI SPCL-ELEM 1.00 1.00 1.00 1.00 - (1.00) INSTR SCI SPCL-SEC 1.00 1.00 1.00 1.00 - (1.00) INSTR SCI SPECIALIST - - - - -INSTR SPEC-SOC STUD 1.00 1.00 1.00 1.00 - (1.00) INSTRUCTIONAL SPECIALIST - ENGLISH/LITERACY - - - - 1.00 1.00 INSTRUCTIONAL SPECIALIST - FINE ARTS - - - - 1.00 1.00 INSTRUCTIONAL SPECIALIST - HEALTH & PE - - - - 1.00 1.00 INSTRUCTIONAL SPECIALIST - MATH - - - - 1.00 1.00 INSTRUCTIONAL SPECIALIST - SCIENCE - - - - 1.00 1.00 INSTRUCTIONAL SPECIALIST - SOCIAL STUDIES - - - - 1.00 1.00 PLANETARIUM COORD 1.00 1.00 - - -SPCST TEXT,MEDIA,LIB - - 1.00 1.00 1.00TEAM LEADER/COORN 1.00 - - - -TEXTBOOK WHS ASST 1.00 1.00 1.00 1.00 1.00Improvement of Instruction Total 14.00 14.00 14.00 14.00 13.50 (0.50) Curriculum Design & Inst Srvcs Total 14.00 14.00 14.00 14.00 13.50 (0.50) Career and Technical Education Career and Technical Education COORD - CTE - - 1.00 1.00 - (1.00) COORD CTE 1.00 1.00 - - -DIRECTOR - CTE - - - - 1.00 1.00 ESSER - Work-Based Learning Specialist - - 1.00 - -ESSER II - WORK-BASED LEARNING SPECIALIST - - - - 1.00 1.00 LEAD HEALTH SVC TCHR - - 1.00 1.00 1.00Career and Technical Education Total 1.00 1.00 3.00 2.00 3.00 1.00 Career and Technical Education Total 1.00 1.00 3.00 2.00 3.00 1.00 Talent Development Improvement of Instruction ADMIN ASSISTANT I 1.00 1.00 1.00 1.00 1.00DIRECTOR TALENT DEVE 1.00 - - - -EXEC DIR-SCH LDRSHP - 1.00 - - -EXECUTIVE DIRECTOR - SCHOOL LEADERSHIP - - 1.00 - 1.00 1.00 SPECIALIST - TALENT DEVELOPMENT - - 1.00 1.00 1.00TALENT DEVEL SPECLST 1.00 1.00 - - -Improvement of Instruction Total 3.00 3.00 3.00 2.00 3.00 1.00 Talent Development Total 3.00 3.00 3.00 2.00 3.00 1.00 Adult Education Adult Education ADMIN ASSISTANT 1.00 1.00 1.00 1.00 - (1.00) ADMIN ASSISTANT I - - - - 1.00 1.00 DIRECTOR - ADULT EDUCATION - - 1.00 1.00 1.00DIRECTOR ADULT EDUC 1.00 1.00 - - -PRGRM SPECIALIST 1.00 1.00 - - -PROGRAM SPECIALIST - - 1.00 - -SPECIALIST - ASSESSMENT & DATA - - - 1.00 1.00TCHR-INCRCERTATD 1.00 1.00 1.00 1.00 1.00Adult Education Total 4.00 4.00 4.00 4.00 4.00Adult Education Total 4.00 4.00 4.00 4.00 4.00Pre-Kindergarten Programs Kindergarten and PreKindergarten ADMIN ASSISTANT I 1.00 1.00 1.00 1.00 1.00COORD - EARLY CHLDHD - - 1.00 1.00 1.00COORD EARLY CHLDHD 1.00 1.00 - - -ESSER III - PRE-K INSTRUCTIONAL SPECIALIST - - - - 1.00 1.00 INST ASST I - VPI - 1.00 - - -Kindergarten and Pre-Kindergarten Total 2.00 3.00 2.00 2.00 3.00 1.00 Pre-Kindergarten Programs Total 2.00 3.00 2.00 2.00 3.00 1.00 Talented and Gifted Programs Enrichment and Electives COORD TAG 1.00 1.00 - - -DIRECTOR - GIFTED PROGRAMS & ADVANCED ACADEMICS - - - 1.00 1.00 -
Teaching, Learning and Leadership
Page 350 ACPS FY 2024 Proposed Budget
Instructional Support Departments
Section Title Program Roll-Up Group Title Position Title FY 2020 Final FTE FY 2021 Final FTE FY 2022 Final FTE FY 2023 Final FTE FY 2024 Proposed FTE Change FY 2023 to FY2024 DIRECTOR: TALENTED & GIFTED PROGRAMS - - 1.00 - -INSTR SPCLST- ELEMENTARY GIFTED & ADVANCED ACADEMIC SERVICES - - - - 1.00 1.00 TAG TCHR 1.00 1.00 1.00 1.70 1.70Enrichment and Electives Total 2.00 2.00 2.00 2.70 3.70 1.00 Talented and Gifted Programs Total 2.00 2.00 2.00 2.70 3.70 1.00 AVID/College Readiness Exemplary Programs COORD - COLLEGE PREP & SUPPORT - - - - 1.00 1.00 COORD COL PREP&SUPP 1.00 1.00 1.00 1.00 - (1.00) Exemplary Programs Total 1.00 1.00 1.00 1.00 1.00AVID/College Readiness Total 1.00 1.00 1.00 1.00 1.00Specialized Instruction Special Education ADMIN ASSISTANT I 2.00 2.00 2.00 2.00 2.00ADMIN SPECIALIST - MEDICAID - - - - 1.00 1.00 ADMIN SPECIALIST II 1.00 1.00 1.00 1.00 1.00ADMIN SPEC-MEDICAID 1.00 1.00 1.00 1.00 - (1.00) ADPTIVE PHYS ED TCHR 1.00 1.00 1.00 1.00 1.00ASST DIRECTOR SPED 1.00 1.00 1.00 - -ASST DIR-RELSVC&SPEC 1.00 1.00 - - -AUDIOLOGIST 1.00 1.00 1.00 1.00 1.00AUGMNTIVE COMM SPEC 1.00 1.00 - - -AUTISM BEHAV SPPT SP 1.00 - - - -BRD CERT BEHAVIORSPC 2.00 2.00 - - -CLINICAL SPEC - SPED 1.00 1.00 - - -COMPLNC & DATA SPCL - 1.00 - - -COORD - ELIGIBILITY & COMPLIANCE - - - - 1.00 1.00 COORD AUT BEHAV SVCS 1.00 1.00 - - -COORD/TEAM LEADER 2.00 - - - -COORDINATOR - ELIGIBILITY & COMPLIANCE - - - 1.00 - (1.00) DIRECTOR - SPECIALIZED INSTRUCTIONAL PROGRAMS - - - - 1.00 1.00 DIRECTOR: SPECIALIZED INSTRUCTIONAL PROGRAMS - - - 1.00 - (1.00) EARLY CHILDHOOD SPED 1.00 1.00 - - -ECSE SPEC-CHILDFIND 1.00 1.00 1.00 - -ED SPECIALIST - 1.00 1.00 1.00 1.00ELIG & DATA ANALYST 1.00 - - - -EMPLOYMNT SUP SPEC 3.00 3.00 - - -ESSER III - HEARING IMPAIRED TCHR - - - - 1.00 1.00 EXEC DIRECTOR-SPED 1.00 1.00 1.00 1.00 - (1.00) EXECUTIVE DIRECTOR - SPECIAL EDUCATION - - - - 1.00 1.00 HEARING IMP TCHR 3.00 2.00 2.00 2.00 - (2.00) HEARING IMPAIRED TCHR - - - - 2.00 2.00 IDEA 611 - ACCOUNTABILITY SPECIALIST - - 1.00 - -IDEA 611 - ASSISTIVE TECHNOLOGY SPECIALIST - - 1.00 1.00 1.00IDEA 611 - ASST DIRECTOR : CITYWIDE PROGRAMS & BEHAVIORAL SERVICES - - - 1.00 1.00IDEA 611 - ASST DIRECTOR: RELATED SERVICES - - 1.00 - -IDEA 611 - AUGMENTIVE COMMUNICATIONS SPECIALIST - - 1.00 1.00 1.00IDEA 611 - CHILDFIND SPECIALIST - - - 1.00 1.00IDEA 611 - CLINICAL SPECIALIST - - 1.00 1.00 1.00IDEA 611 - COORDINATOR: CAREER & TRANSITION SERVICES - - - 1.00 1.00IDEA 611 - COORDINATOR: CITYWIDE PROGRAMS - - 1.00 - -IDEA 611 - COORDINATOR: EARLY CHILDHOOD - - 1.00 1.00 1.00IDEA 611 - COORDINATOR: PARENT SUPPORT - - 1.00 1.00 1.00IDEA 611 - DATA & COMPLIANCE SPECIALIST - - 1.00 1.00 1.00IDEA 611 - DIRECTOR: RELATED SERVICES & SPECIAL PROGRAMS - - - 1.00 1.00IDEA 611 - INSTRUCTIONAL ASST: CAREER PREP - - 1.00 1.00 1.00IDEA 611 - INSTRUCTIONAL SPECIALIST - - 5.00 5.00 5.00IDEA 611 - LEAD INSTRUCTIONAL SPECIALIST - - 1.00 1.00 1.00IDEA 611 - OCCUPATIONAL THERAPIST - - 0.50 0.50 0.50IDEA 611 - PRIVATE PLACEMENT SPECIALIST - - 1.00 1.00 1.00IDEA 611 - SPEECH LANGUAGE PATHOLOGIST - - 1.00 1.00 1.00IDEA 611 - TRANSITION SPECIALIST - - - - 3.00 3.00 IDEA 611 - TRANSITION SPECIALIST: COLLEGE & CAREER - - - - 1.00 1.00 IDEA 611 - TRANSITIONAL SPECIALIST - - 3.00 3.00 - (3.00) IDEA 619 - SPED TCHR - - 1.00 1.00 1.00IDEA CEIS - BEHAVIORAL SPECIALIST - - 1.00 - -IDEA CEIS - CLINICAL PSYCHOLOGIST - - - 1.00 1.00IDEA CEIS - CLINICAL SPECIALIST - - 1.00 1.00 1.00IDEA CEIS - EDUCATIONAL DIAGNOSTICIAN - - 1.00 1.00 1.00INSTRCNL SPCLST - 1.00 1.00 1.00 - (1.00) INSTRSPEC-ASSTTECH 1.00 1.00 - - -INSTRSPEC-CROSSCURR 2.00 2.00 - - -INSTRSPEC-LITERACY 1.00 1.00 - - -INSTRSPEC-MATHEMATIC 2.00 2.00 - - -INSTRUCTIONAL SPECIALIST - - - - 1.00 1.00 JOB COACH 3.00 3.00 3.00 3.00 3.00LEAD INSTRCNL SPCLST - 1.00 - - -LIAIS-HMLESS/FSTR CR 1.00 - - - -MTSS & ELIGBLTY SPCL - 1.00 - - -OCCUPATIONAL THERAPIST - - 4.50 4.50 4.50OCCUPATNL THERPST 4.50 4.50 - - -PARENT RES COORD 1.00 1.00 - - -PARENT SUP SPEC 1.00 1.00 - - -PARENT SUPPORT SPECIALIST - - 1.00 1.00 1.00PHYSICAL THERAPIST 2.00 2.00 2.00 2.00 2.00PRIV PLACEMNT SPEC 1.00 1.00 - - -SPEC-AUT BEHAV SVCS 2.00 3.00 - - -SPECIALIST 1.00 - - - -SPECIALIST - MTSS & ELIGIBILITY - - 1.00 - - -
Teaching, Learning and Leadership
Page 351 ACPS FY 2024 Proposed Budget Instructional Support Departments
Section Title Program Roll-Up Group Title Position Title FY 2020 Final FTE FY 2021 Final FTE FY 2022 Final FTE FY 2023 Final FTE FY 2024 Proposed FTE Change FY 2023 to FY2024 SPED TCHR - 5.00 - - -SPED TCHR ECSE 3.60 3.60 2.60 2.00 2.00SPEECH LANGUAGE PATH 27.00 27.00 26.00 26.00 26.00STATE REGIONAL GRANT - BEHAVIOR SPECIALIST - - 4.00 4.00 4.00STATE REGIONAL GRANT - LEAD BEHAVIOR SPECIALIST 11M - - 1.00 1.00 1.00VISUAL IMPRD TCHR 1.00 1.00 1.00 1.00 1.00Special Education Total 80.10 84.10 84.60 84.00 86.00 2.00 Specialized Instruction Total 80.10 84.10 84.60 84.00 86.00 2.00 English Learner Services EL ACADEMIC PRINCIPAL - - - - -ADMIN ASSISTANT I 1.00 1.00 1.00 1.00 1.00COORD - LANGUAGE ACCESS - - - - 1.00 1.00 COORD INTL ACDMY MS 1.00 - - - -COORDINATOR - LANGUAGE ACCESS - - 1.00 1.00 - (1.00) EL ASSESSMNT SPEC - - - - -EL BILINGUAL SPEC 2.00 2.00 1.00 1.00 - (1.00) EL BILINGUAL SPECIALIST - - 1.00 1.00 2.00 1.00 EL DATA SPECIALIST 1.00 1.00 - - -EL GLAD PRG SPEC 1.00 1.00 - - -EL INCLUSN SPEC 1.00 1.00 - - -EL INSTRUCTIONAL SPECIALIST - - 1.00 1.00 1.00EL PROF TESTING SPEC 1.00 1.00 1.00 1.00 1.00EL SPECIALIST 1.50 1.00 1.00 1.50 1.00 (0.50) EL TEACHER/SPECIALIST - - 0.50 - -ESSER II - EL BILINGUAL REGISTRAR - - - - 1.00 1.00 ESSER III - TRANSLATOR (DARI) - - - - 1.00 1.00 EXEC DIRECTOR-EL 1.00 1.00 1.00 1.00 - (1.00) EXECUTIVE DIRECTOR - MULTILINGUAL LEARNING - - - - 1.00 1.00 LANG ACCESS COORD 1.00 - - - -LANG ACCESS MANAGER - 1.00 - - -LIT LANG ACQ SPEC 1.00 1.00 1.00 1.00 1.00PARENT RES COORD 1.00 1.00 - - -PARENT RES SPEC - 1.00 - - -REGISTRAR I 2.00 2.00 2.00 2.00 2.00SENIOR TRANSLATOR - - 1.00 1.00 1.00SPECIALIST - EL DATA - - 1.00 1.00 1.00SR TRANSLATOR - 1.00 - - -TITLE III - PARENT RESOURCE SPECIALIST - - 1.00 1.00 1.00TITLE III - PARENT RESOURCES COORDINATOR - - 1.00 1.00 1.00TITLE III - SPECIALIST: EL GLAD PROGRAM - - 1.00 1.00 1.00TRANSLATOR 2.00 1.50 1.00 1.00 1.00TRANSLATOR - AMHARIC - - 0.50 1.00 1.00TRANSLATOR - ARABIC - - 0.50 - -EL Total 17.50 17.50 18.50 18.50 20.00 1.50 Enrichment and Electives COORD - DUAL LANGUAGE - - - 1.00 1.00Enrichment and Electives Total - - - 1.00 1.00English Learner Services Total 17.50 17.50 18.50 19.50 21.00 1.50 Title I Programs Alternative and At-Promise Education ADMIN ASSISTANT I 1.00 1.00 - - -TITLE I - ADMIN ASSISTANT I - - 1.00 1.00 1.00Alternative and At-Promise Education Total 1.00 1.00 1.00 1.00 1.00Improvement of Instruction COORD - SCHOOL IMPRV - - 0.50 0.50 0.50DIRECTOR - TITLE I PROGRAMS - - 0.25 0.25 - (0.25) DIRECTOR II - TITLE I PROGRAMS - - - - 0.25 0.25 DIRECTOR TITLEI PROG 1.00 1.00 - - -INSTRCOACH-SCIENCE - 1.00 - - -INSTRU SCIENCE SPEC 1.00 - - - -LIAIS-HMLESS/FSTR CR - 1.00 - - -SCHOOL IMPROVE COORD 2.00 1.00 - - -TITLE I - COORDINATOR: SCHOOL IMPROVEMENT - - 0.50 0.50 0.50TITLE I - INSTRUCTIONAL SPECIALIST: SCIENCE - - 1.00 1.00 1.00TITLE I - LIAISON: HOMELESS/FOSTER CARE - - 1.00 1.00 1.00TITLE I - PROGRAM DIRECTOR - - 0.75 0.75 0.75Improvement of Instruction Total 4.00 4.00 4.00 4.00 4.00Title I Programs Total 5.00 5.00 5.00 5.00 5.00School Improvement Evaluation and Planning ESSER II - ANALYST: EVALUATION & ASSESSMENT - - - - 1.00 1.00 ESSER III - ANALYST: EVALUATION & ASSESSMENT - - - - 1.00 1.00 Evaluation and Planning Total - - - - 2.00 2.00 Improvement of Instruction ADMIN ASSISTANT II - - 0.50 0.50 0.50ESSER III - SPECIALIST: MTSS - - - - 1.00 1.00 EXECUTIVE DIRECTOR - SCHOOL IMPROVEMENT - - 1.00 1.00 1.00Improvement of Instruction Total - - 1.50 1.50 2.50 1.00 School Improvement Total - - 1.50 1.50 4.50 3.00 Instructional Support Improvement of Instruction ADMIN ASSISTANT II - - 0.50 0.50 0.50EXECUTIVE DIRECTOR - INSTRUCTIONAL SUPPORT - - 1.00 1.00 1.00TITLE II - INSTRUCTIONAL SPECIALIST - - - 1.00 1.00Improvement of Instruction Total - - 1.50 2.50 2.50Instructional Support Total - - 1.50 2.50 2.50Elementary Instruction Improvement of Instruction ADMIN ASSISTANT II - 0.50 - - -EXEC DIRECTOR-SCH IMPR - 1.00 - - -Improvement of Instruction Total - 1.50 - - -Elementary Instruction Total - 1.50 - - -Secondary Instruction Improvement of Instruction ADMIN ASSISTANT II - 0.50 - - -EXEC DIR-INSTRL SUPP - 1.00 - - -Improvement of Instruction Total - 1.50 - - -Secondary Instruction Total - 1.50 - - -Grand Total 132.60 140.60 143.10 145.20 154.20 9.00
Teaching, Learning and Leadership
Page 352 ACPS FY 2024 Proposed Budget Instructional Support Departments
Change, FY2022 to FY2023 Dollar Section Title
Teaching, Learning and Leadership
Page 353 ACPS FY 2024 Proposed Budget Instructional Support Departments
Change, FY2022 to FY2023 Dollar Section Title
Teaching, Learning and Leadership
Page 354 ACPS FY 2024 Proposed Budget Instructional Support Departments
Change, FY2022 to FY2023 Dollar Section Title
Teaching, Learning and Leadership
Page 355 ACPS FY 2024 Proposed Budget Instructional Support Departments
Change, FY2022 to FY2023 Dollar Section Title
Teaching, Learning and Leadership
Page 356 ACPS FY 2024 Proposed Budget Instructional Support Departments
Change, FY2022 to FY2023 Dollar Section Title
Teaching, Learning and Leadership
Page 357 ACPS FY 2024 Proposed Budget Instructional Support Departments
Change, FY2022 to FY2023 Dollar Section Title
Teaching, Learning and Leadership
Page 358 ACPS FY 2024 Proposed Budget Instructional Support Departments
Change, FY2022 to FY2023 Dollar Section Title
Teaching, Learning and Leadership
Page 359 ACPS FY 2024 Proposed Budget Instructional Support Departments
Change, FY2022 to FY2023 Dollar Section Title Change, FY2022 to FY2023 Dollar Section Title
Technology Services
Department of Technology Services
Dr. Elizabeth Hoover, Chief Technology Officer
1340 Braddock Place
Alexandria, Virginia 22314
Tel: 703-619-8005
elizabeth.hoover@acps.k12.va.us
https://www.acps.k12.va.us/departments/technology-services
Responsibilities
The Technology Services Department leads and manages the implementation of the ACPS Technology Plan. There are four major technology goal areas in this plan: Learning Environment, Professional Learning, Infrastructure, and Data.
Learning Environment - To create studentcentered, technology-rich learning environments that provide for academic excellence and educational equity by encouraging creativity, critical thinking, and collaboration.
• Provide equitable opportunities and resources that allow for meaningful and relevant learning opportunities for students. Define and model instructional strategies that implement a 21st century curriculum that supports student-centered, technologyrich learning environments.
• Evaluate how technology is used to support creation, collaboration, and critical thinking.
• Proactively support community understanding of technology resources, blended learning, and their impact on student learning.
Professional Development - Provide effective professional development for all staff that mirrors best practices and supports learner-centered, technology-rich learning environments.
• Provide job-embedded, differentiated professional learning options that encourage learner choice, meaningful participation, and risk-taking for professional growth.
• Maintain a program of instructional leadership development that fosters effective identification and implementation of technology in support of academic achievement.
Infrastructure - Provide a reliable infrastructure that facilitates the operation of the school division and is transparent to the end user.
• Build and maintain a technical architecture that provides a strong and scalable foundation in support of the goals of the division.
• Provide efficient and effective support for all instructional and administrative technology resources for students and staff.
• Monitor policies, procedures, and technologies to ensure that computing resources are secure and recoverable.
ACPS FY 2024 Proposed Budget Page 360 Student Support Departments
Department and Office Contact
Technology Services
• Maintain office productivity software and systems for communication and collaboration throughout the division.
• Develop sound policies and procedures for the acquisition and management of technologies.
Data - Provide access to high-quality data to support data-driven decision making.
• Implement governance structure to manage and monitor IT investments.
• Increase data accessibility and data quality.
• Enhance and implement systems and analysis tools.
• Collaborate to procure, update, and maintain assessment tools and systems that provide authentic and blended assessment opportunities
In addition to implementing the Technology Plan, Technology Services is also responsible for complying with a variety of state mandates. These are listed below.
• The Virginia Department of Education requires state-mandated assessments, including annual assessments and end-ofcourse (EOC) exams (some required for high school graduation) to be administered online on a computer unless a student has a documented need for a paper/pencil test. Test are administered during fall, spring, and summer.
• Virginia Code 22.1-253.13:2 SOQs: Virginia’s standards of quality (SOQ) require two full-time equivalent positions per 1,000 students in kindergarten through grade 12, one to provide technology support and one to serve as an instructional technology resource teacher (Technology Integration Specialist).
• Technology Plan: The state currently operates under the Educational Technology Plan for Virginia: 2010–2017, which serves as a blueprint for school divisions to enhance students’ academic achievement through technology. Each division must devise its own technology plan, which
defines a strategic direction for both the short and long term and is aligned with the state technology plan.
• Virginia Code 22.1-70.2 Acceptable Use/Responsible Use Policy: Schools and divisions are required to establish guidelines for appropriate technology use. These guidelines generally are called acceptable use policies (AUP). By definition, an AUP is a written agreement signed by students, their parents/ caregivers, and their teachers. It outlines the terms and conditions for using technology-based devices maintained by schools and personal technology-based devices used during school hours on school property. During the 2011-2012 school year, ACPS transitioned its AUP to a Responsible Use Policy (RUP). In February 2016, the RUP, Employee Use of Social Media Policy and Student Use of Social Media Policy and Regulations were updated.
• Reports: As a result of local, state and federal requirements, (ESSA Every Student Succeeds, Title I, Family Educational Rights and Privacy Act, Individuals with Disabilities Education Improvement Act, student records collections, etc.) ACPS submits numerous reports throughout the calendar year. These reports are all coordinated and collected through Technology Services.
• Filtering: Various laws mandate Internet filtering on school and library computers. Legislation passed by the Virginia General Assembly required state schools to implement filtering in public schools by July 1, 2001. The Children’s Internet Protection Act (CIPA), passed by Congress in December 2000, applies to all schools and libraries that receive E-rate discounts for Internet access and internal connections. On Apr. 5, 2001, the Federal Communications Commission (FCC) issued regulations for schools and libraries receiving non-telecommunications E-Rate discounts.
ACPS FY 2024 Proposed Budget Student Support Departments Page 361
Technology Services
Budget Summary
The Technology Services funds services provided to ACPS in the areas of connectivity, business applications, educational applications, backup services, and security. The FY 2024 Operating Funded Budget is $12.61 million, a slight decrease compared to the prior fiscal year. Staffing will remain at 60.00 FTEs.
The budget for the purchased services category is $1.08 million. This category funds professional services, maintenance services, other printing and binding, computer equipment repair, software maintenance, and computer network services.
The materials and supplies category continues to provide support for the division through online subscriptions and software such as Electronic School Board, Microsoft licensing fees, web development application, Kaltura, PowerSchool, Blackboard, Atomic Learning, BrainPop, VoiceThread, Discovery, Naviance, DimensionsU and Respondus.
The capital outlay category continues to fund additions and replacement of capital technology hardware for upgrades to the network and replacement of computers, laptops, and devices including hardware for data center and network storage. The budget will remain at $1.34 million within this category.
ACPS FY 2024 Proposed Budget Page 362 Student Support Departments
Technology Services
Technology Services
Chief Technology Officer
Division FOIA Officer
Dr. Elizabeth Hoover
Infrastructure and Support Services
John Crites, Director
Support for all technology resources Ensure effective operations
Monitor policies, procedures and technologies
Provide direct support to staff and students via helpdesk Management of network infrastructure
Administration of web services
Education and Business Applications
Dr. Marya Runkle, Director
Coordinate state and federal reports
Management and support of operational applications
Coordinate school registrars and student data
Management and support of instructional applications
Instructional Technology
Emily Dillard, Director
Support teachers and students in their use of technology
Technology Instructional Specialists (TIS)
Leads alignment of technology resources to curriculum
Coordinates division professional development related to instructional technology
ACPS FY 2024 Proposed Budget Student Support Departments Page 363
Vacant, Assistant Director
Technology Services
ACPS FY 2024 Proposed Budget Page 364 Student Support Departments
Technology Services Staffing Section TitleProgram Roll-Up Group TitlePosition Title FY 2020 Final FTE FY 2021 Final FTE FY 2022 Final FTE FY 2023 Final FTE FY 2024 Proposed FTE Change FY 2023 to FY2024 Technology Services Technology Services COORD TECHSVS1.00 1.00 - - -DIRECTOR - ONLINE LEARNING- - 1.00 - -DIRECTOR - TECHNOLOGY INTEGRATION SERVICE - - 1.00 1.00 1.00DIRECTOR ONLINE LRNG1.00 1.00 - - -SPECIALIST - TECHNOLOGY INTEGRATION- - 19.00 19.00 19.00TECH INTEG SPECIALST19.50 19.50 - - -Technology Services Total21.50 21.50 21.00 20.00 20.00Technology Services Management ADMIN SPECIALIST II1.00 1.00 1.00 1.00 1.00ADMINISTRATOR - WEB SERVICES- - 1.00 1.00 1.00APP SUPP SPEC HR/PAY1.00 1.00 1.00 1.00 1.00APP SUPP SPECIALIST3.00 3.00 3.00 3.00 3.00ASST DIRECTOR- 1.00 - - -CHIEF OFFICER - TECHNOLOGY- - 1.00 1.00 1.00CHIEF TECH OFFCR1.00 1.00 - - -COMPUTER PROGMR II1.00 1.00 1.00 1.00 1.00COORD - DATA/REGSTRN- - 1.00 1.00 1.00COORD - SERVICE DESK- - - - 1.00 1.00 COORD - SERVICE DSK- - 1.00 1.00 - (1.00) COORD - ST/FED RPTG- - 1.00 1.00 - (1.00) COORD - STATE & FEDERAL REPORTING- - - - 1.00 1.00 COORD - STUDENT HELP DESK- - - - 1.00 1.00 COORD DATA-REGSTR1.00 1.00 - - -COORD SERVICE DSK1.00 1.00 - - -COORD ST/FED RPTG1.00 1.00 - - -COORD STDNT HELPDESK- - 1.00 1.00 - (1.00) DIR I,IT INFRA&SUPP1.00 1.00 1.00 1.00 - (1.00) DIRECTOR I - IT INFRASTRUCTURE & SUPPORT- - - - 1.00 1.00 DIRECTOR I - TECHNOLOGY SERVICES- - 1.00 1.00 1.00DIRECTOR I TECHSVS1.00 1.00 - - -EMAIL SPEC- - - - -INVENTORY QUAL SPC1.00 1.00 1.00 1.00 1.00NETWORK ACCOUNT MANAGER- - - - 1.00 1.00 NETWORK ACCOUNT MGR1.00 1.00 1.00 1.00 - (1.00) NETWORK INFRA SPEC1.00 1.00 - - -NETWORK SUP SPEC2.00 2.00 2.00 2.00 - (2.00) NETWORK SUPPORT SPECIALIST- - - - 2.00 2.00 RECORDS MGT SPEC1.00 1.00 - - -SENIOR ANALYST - TECHNOLOGY SERVICES- - - - 1.00 1.00 SOFTWARE SUP SPEC1.00 1.00 1.00 1.00 - (1.00) SOFTWARE SUPPORT SPECIALIST- - - - 1.00 1.00 SPECIALIST - NETWORK INFRASTRUCTURE- - 1.00 1.00 1.00SPECIALIST - RECORDS MANAGEMENT- - 1.00 1.00 1.00SR ANALYST-TECHSVS1.00 1.00 1.00 1.00 - (1.00) STUDENT HLPDSK COORD1.00 1.00 - - -SUPPORT SPECIALIST I1.00 1.00 1.00 1.00 1.00TECHNICIAN I5.00 4.00 4.00 4.00 4.00TECHNICIAN II4.00 5.00 5.00 5.00 5.00TECHNICIAN II - HELP DESK- - - - 3.00 3.00 TECHNICIAN II HLPDSK3.00 3.00 2.00 2.00 - (2.00) TECHNICIAN II-HLPDSK- - 1.00 1.00 - (1.00) TECHNICIAN IV4.00 3.00 4.00 4.00 4.00TECHNICIAN IV - SPECIAL PROJECTS- - - - 1.00 1.00 TECHNICIAN IV-SP PRJ1.00 1.00 1.00 1.00 - (1.00) WEB SERVICES ADMNSTR1.00 1.00 - - -Technology Services Management Total40.00 40.00 40.00 40.00 40.00Technology Services Total 61.50 61.50 61.00 60.00 60.00Grand Total 61.50 61.50 61.00 60.00 60.00 -
ACPS FY 2024 Proposed Budget Student Support Departments Page 365
Section Title
Technology Services
Student Services and Equity
Department and Office Contacts
Department of Student Services & Equity
Dr. Marcia Jackson, Chief of Student Services & Equity
1340 Braddock Place, 5th Floor
Alexandria, Virginia 22314
Tel: 703-619-8034 | Fax: 703-619-8988
marcia.jackson@acps.k12.va.us
http://www.acps.k12.va.us/student-services/
Responsibilities
The Chief of Student Services and Equity leads the work of three offices within the Department of Student Services and Equity. This work includes aligning the efforts of each office with the ACPS Equity for All strategic plan including development, implementation and monitoring of the department improvement plan for continuous improvement and innovation, review and updates of policies that govern department work, serving on the executive cabinet, strategically executing the vision of the superintendent and School Board to support increased student achievement and remove barriers to student learning.
The Executive Director of the Office of Equity and Alternative Programs provides direct oversight to division-level alternative programs including the Northern Virginia Juvenile Detention Center School and the ShelterCare educational program. The office also works to provide monthly division-wide professional learning focused on racial equity to all ACPS leaders to support equitable practices in every school and classroom. Sustained professional learning on equity and cultural competency is
offered for staff, students, and the community to assist schools in monitoring issues of disproportionality and diversity. Instructional programs for students such as the Minority Student Achievement Network (MSAN) at Alexandria City High School and George Washington Middle School are coordinated through this office. This office also supports school-wide implementation of the social emotional academic learning (SEAL). SEAL is implemented utilizing the multi-tiered system of support (MTSS). Tier 1 support for school-wide social emotional programs include Positive Behavioral Interventions and Supports (PBIS), restorative practices (RP) and the RULER curriculum are supported through this office.
The Executive Director of the Office of Student Support Teams works in collaboration with Directors and the school-based Student Support Team (SST) which includes school counselors, school psychologists, school nurses and school social workers. The office also serves as the division liaison to many community agencies that support student physical, emotional, mental health and wellness. Staff work to ensure success for every child, every day. Using a cross-
ACPS FY 2024 Proposed Budget Page 366 Student Support Departments
Student Services and Equity
disciplinary approach, these professionals are dedicated to executing the commitment to the academic, social, physical, and emotional well-being and development of ACPS students. The staff delivers essential services using the MTSS framework with expertise, compassion, and a commitment to positive results for every student.
The Executive Director that leads the Office of Student Services works in consultation with school administrators and safety and security services to help ensure ACPS schools are safe and equitable learning environments for all students. The office reviews, recommends and implements policies, regulations and procedures that address issues of disproportionality in disciplinary practices that results in overrepresentation of students of color in school and division outcome data. The office works with the Department of Technology Services on the submission of required data for the Student Behavior and Administrator Response (SBAR) state report. The student code of conduct annual updates and the disciplinary hearings are the responsibility of this office and are designed to support appropriate student behavior and provide effective strategies to support student achievement. In addition, this office supports students experiencing homelessness, truancy prevention, substance abuse, homeschool and residency verification.
Budget Summary
The Student Services and Equity budget supports equity and student Services. The FY 2024 Operating Funded Budget totals $4.61 million, an increase of $0.39 million. Positions will increase to 22.88 FTEs.
Student Services
The Student Services budget supports school health, psychology, counseling and social work services, homebound instruction, Minority
Student Achievement Network (MSAN), Positive Behavioral Interventions and Supports (PBIS), truancy and homelessness support. The total FY 2024 Operating Funded Budget is $3.44 million, an increase of $0.53 million compared to the prior fiscal year.
Combined Funds staffing will increase to 17.88 FTEs as ESSER Grant Funded positions are shown in FY 2023.
Funding in materials and supplies will continue to fund instructional materials, office and paper supplies, refreshments, software/online charges, and medical supplies.
The Student Services grant budget will continue to receive funds from the McKinney Vento grant to support the homeless resource and social work programs. This includes funding in salaries, benefits, materials and supplies, other charges, and purchased services.
Equity (Alternative Programs and Equity)
The Equity budget supports the direct oversight of the alternative education programs and activities to ensure ACPS schools provide safe, equitable learning environments for all students and supports professional development on cultural competence. The FY 2024 Operating Funded budget is $1.20 million, a decrease of $0.14 million over the prior fiscal year. Combined Funds staffing will reduce to 5.00 FTEs for FY 2024.
The purchased services category will continue to fund medical/legal services, instructional services, other professional services, staff development, other printing and binding, and tuition for services provided by other divisions.
ACPS FY 2024 Proposed Budget Student Support Departments Page 367
Student Services and Equity
Student Services and Equity
Chief of Student Services and Equity
Dr. Marcia Jackson
Administrative Assistant Nora Garcia
Student Services
Vacant, Executive Director
Office of Student Services
Substance Abuse Counselors Homeless Education Student Transfers Residency Verification
Truancy Outreach
Multi tier system of supports (MTSS)
Disciplinary Hearings/Homeschool
Equity and Alternative Programs
Kennetra Wood, Executive Director
Alexandria City Change for Change Academy
Northern VA Juvenile Detention Center School ShelterCare
Alexandria City Satellite Campus
Office of Equity and Alternative Programs
Brielle Welch, Director
Positive Behavioral Interventions and Supports (PBIS)
Restorative Practices (RP)
Social emotional learning
Student Support Departments
Student Support Teams
Dr. Victor Martin, Jr. Executive Director
Academic and career development
Consultation and collaboration School counselors
Office of Student Support Teams
Denee Scott Ellis, Director of K 12 School Counseling
Faiza Jackson, Director of Social Work
Dr. Robin Wallin, Director of School Health
Dr. John Baker, Director of Psychological Services
School Health staff
Student wellness
Wellness on Wheels (WOW) Bus
Child development
School psychologists
School social workers
Student and family services
ACPS FY 2024 Proposed Budget Page 368
Student Services and Equity
ACPS FY 2024 Proposed Budget Student Support Departments Page 369
Student Services Staffing Section TitleProgram Roll-Up Group TitlePosition Title FY 2020 Final FTE FY 2021 Final FTE FY 2022 Final FTE FY 2023 Final FTE FY 2024 Proposed FTE Change FY 2023 to FY2024 Student ServicesSpecial Education COORD - PBIS- - 1.00 1.00 1.00PBIS COORDINATOR1.00 1.00 - - -Special Education Total 1.00 1.00 1.00 1.00 1.00Student Services ADMIN ASSISTANT I1.00 1.00 1.00 1.00 1.00ADMIN ASSISTANT II1.00 1.00 1.00 1.00 1.00DIRECTOR - SCHOOL HEALTH SERVICES- - 1.00 1.00 1.00DIRECTOR - SCHOOL PSYCHOLOGY- - 1.00 1.00 1.00DIRECTOR - SOCIAL WORK- - 1.00 1.00 1.00DIRECTOR K12-GUID1.00 - - - -DIRECTOR SCH HLTH- 1.00 - - -DIRECTOR SCH PSYC- 1.00 - - -DIRECTOR SOC WORK- 1.00 - - -ESSER - Attendance Specialist - - 1.00 - -ESSER - Mental Health Specialist - - 2.00 - -ESSER - School Health Specialist- - 1.00 - -ESSER II - ATTENDANCE SPECIALIST- - - - 1.00 1.00 ESSER II - MENTAL HEALTH SPECIALIST- - - - 2.00 2.00 ESSER II - SCHOOL HEALTH SPECIALIST- - - - 1.00 1.00 ESSER III - GUIDANCE DIRECTOR- - - - 1.00 1.00 ESSER III - PSYCHOLOGIST- - - - 1.20 1.20 ESSER III - SCHOOL COUNSELOR- - - - 2.00 2.00 ESSER III - SCHOOL NURSE- - - - 0.40 0.40 ESSER III - SOCIAL WORKER- - - - 0.70 0.70 EXEC DIRECTOR-SST- 1.00 - - -EXEC DIRECTOR-ST SVC1.00 1.00 1.00 1.00 - (1.00) EXECUTIVE DIRECTOR - STUDENT SERVICES- - - - 1.00 1.00 EXECUTIVE DIRECTOR - STUDENT SUPPORT- - 1.00 1.00 1.00GENERAL CLERK0.88 0.88 0.88 0.88 0.88HEALTH SVS COORD1.00 - - - -LEAD PSYCHOLOGIST1.00 - - - -LEAD SOCIAL WORKER1.00 - - - -MENTAL HEALTH SPECL1.00 1.00 1.00 1.00 1.00MTSS SPECIALIST- - - - 1.00 1.00 PSYCHOLOGIST1.40 1.40 1.40 1.40 1.40REGISTRAT SUPP SPEC1.00 1.00 - - -SOCIAL WORKER - ECSE- - - 0.60 0.60SPECIALIST - RESIDENCY VERIFICATION- - 1.00 1.00 1.00SPECIALIST - TRUANCY OUTREACH- - 1.00 1.00 1.00SUBST ABUSE COUNSEL1.00 1.00 1.00 1.00 3.00 2.00 TRUANCY OUTREACH SPC1.00 1.00 - - -Student Services Total 13.28 13.28 17.28 13.88 26.18 12.30 Student Services Total 14.28 14.28 18.28 14.88 27.18 12.30 Alternative Programs &Improvement of Instruction ADMIN ASSISTANT I1.00 1.00 1.00 1.00 1.00CHF OFCR ST SVS,ALT1.00 1.00 - - -CHIEF OFFICER - STUDENT SERVICES- - 1.00 1.00 1.00COORD - RESTORATIVE PRACTICES- - - - 1.00 1.00 COORDINATOR - EQUITY- - - 1.00 - (1.00) COORDINATOR - RESTORATIVE PRACTICES- - - 1.00 - (1.00) CULT COMPETENCE SPEC1.00 1.00 1.00 - -DIR ALT PROG AND EQU1.00 - - - -DIRECTOR - EQUITABLE PRACTICES- - - - 1.00 1.00 ESSER II - SPECIALIST: EQUITY & INCLUSION- - - - 1.00 1.00 EXEC DIRECTOR-EQU- 1.00 - - -EXECUTIVE DIRECTOR - EQUITY & ALTERNATIVE PROGRAM - - 1.00 1.00 1.00SCHOOL CULTURE SPCLS1.00 1.00 - - -SPECIALIST - SCHOOL CULTURE- - 1.00 - -SUBST ABUSE COUNSEL1.00 1.00 1.00 1.00 - (1.00) Improvement of Instruction Total6.00 6.00 6.00 6.00 6.00Alternative Programs & Equity Total 6.00 6.00 6.00 6.00 6.00Grand Total 20.28 20.28 24.28 20.88 33.18 12.30
ACPS FY 2024 Proposed Budget Page 370 Student Support Departments Student
Section Title
Services and Equity
ACPS FY 2024 Proposed Budget Student Support Departments Page 371 Student
and Equity Section Title
Services
Human Resources
Department and Office Contact
Department of Human Resources
Vacant, Chief of Human Resources
1340 Braddock Place
Alexandria, Virginia 22314
Tel: 703-619-8010 | Toll Free: 866-676-5481 Fax: 703-619-8983
https://www.acps.k12.va.us/departments/human-resources
Responsibilities
Office of the Acting Chief of Human Resources
• Aligns Human Resources programs, policies and procedures to support the Division Strategic Plan: Equity for All 2025.
• Ensures daily HR staff work supports the five core values and five strategic goals.
• Publish and updates information on the ACPS-Human Resource webpages.
• Conducts general office administration requirements.
• Promotes positive organizational relationships.
• Encourages professional behaviors, attitudes and feelings to foster a climate for team success.
• Develop division organizational culture with an equity focus for high morale, optimum staff performance and employee satisfaction.
Office of Compensation and Benefits
• Develops and sets compensation and salary that is market competitive to the NOVA region.
• Publishes salary scales and adjusts annually per approved-budget guidance.
• Administers a comprehensive benefits
programs (includes health, dental, vision, VRS retirement, supplemental retirement, workers compensation, etc.).
• Uses the HR Information system (HRISMUNIS) for data management and continuous improvement.
Office of Employee Engagement and Retention
• Tracks annual performance evaluations and performance improvement plans.
• Offers professional development for the non-instructional staff and/or common classes for all.
• Conducts annual new teacher/staff orientation and onboarding activities.
• Conducts workplace investigations to resolve complaints or grievances at lowest level possible.
• Maintains personnel records (via electronic files and less paper files).
Office of Recruitment and Retention
• Recruits for diversity, equity and inclusion (DEI) to create a multi-cultural workforce that supports and reflects the residents of the Alexandria City community and vision.
• Protect student and staff safety with consistent due diligence and background
ACPS FY 2024 Proposed Budget Support Services Departments Page 372
Human Resources
checks.
• Use talent management techniques to maximize individual potential and organizational capacity.
• Support succession planning to prepare junior staff for future leadership roles.
• Sustain high-quality teachers-in-theclassroom by maintaining license and certifications for over 1,500 instructional staff.
Each HR office follows extensive legal requirements of employment law at the federal, state and local level which require detailed compliance and quality control. Examples of these requirements include:
• 2018 HR Audit corrective action plan
• ACPS Board of Education Policies with focus on Section G: Personnel
• Age Discrimination in Employment Act (ADEA)
• ADA Amendments Act (ADAAA)
• Civil Rights Act of 1964
• Code of Virginia
• Department of Homeland Security US Immigration Law
• Equal Employment Opportunity Act (EEOA)
• Family and Medical Leave Act (FMLA)
• Fair Labor Standards Act (FLSA)
• Health Insurance Portability and Accountability Act (HIPAA)
• IRS section 125 (benefits cafeteria plans)
• Occupational Health and Safety Act (OSHA)
• Patient Protection and Affordable Care Act (PPACA)
• Virginia Workers’ Compensation Act
Budget Summary
The Human Resources budget consists of two parts: the Human Resources Department and the Division-Wide Human Resources accounts. The Human Resources Department budget manages the daily operations of the department, while the Division-Wide Human Resources budget supports system-wide activities. The FY 2024 Budget totals $11.28 million, an increase of $0.52 million difference from the previous year. FY 2024 staffing plan remains at the same level as prior year.
Human Resources
The budget for the Human Resources Department supports recruitment and retention of staff, new teacher and substitute orientation, compensation and benefits, employee relations, service awards, and the retirement ceremony. The FY 2024 Proposed Budget is $2.81 million, an increase of $0.41 million over the FY 2023 Final Budget. In FY2024, Human Resources will be preparing to enter collective bargaining negotiations and includes funding for contracted assistance, in addition to increases due to compensation enhancements.
Division-Wide Human Resources
The Division-Wide Human Resources budget supports division-wide benefits, substitutes and staff tuition reimbursement, as well as a provision for MRA for Intermittent / Adult Education staff. The FY 2024 Division-Wide Human Resources budget totals $8.47 million. There are no additional FTEs budgeted under the Division-Wide Human Resources budget.
ACPS FY 2024 Proposed Budget Page 373 Support Services Departments
Compensation and Benefits
Sheree Harmon, MBA, SPHR, SHRM SCP, Director
Develops and sets market competitive compensation and salary
Provides a comprehensive benefits package and informational classes for employees, retirees, and family members
Offers wellness programs to support employee health and fitness, enhance productivity, and help employees feel good
Human Resources
Human Resources
Chief of Human Resources
Vacant
Human Resources
Acting Executive Director, Rene Paschal
Strategic planning, operational support, and inter departmental collaboration to provide responsive and innovative HR support services
Organizational development, employee communication, HR budget management, human resource information systems (HRIS) support, and legal services Human capital services for District employees, departments, community partners, and the public to promote individual and organizational excellence
Employee Engagement & Relations
Karen Kaldahl, Director
Promotes a high quality workforce and collaborative relationships between employees, management and employee organizations
Provides guidance, training and recommendations on managing employee performance, Conducts records management, investigates conduct issues, provides employment contract interpretations, resolves complaints at the lowest level, and negotiates timely and fiscally responsible agreements
Recruitment and Retention Services
Margaret Browne, Director
Provides innovative, responsive, fair, and consistent recruitment, selection, classification, and compensation services to job applicants
Ensures that the District employs and retains a qualified and diverse workforce that delivers essential services to the public
ACPS FY 2024 Proposed Budget Support Services Departments Page 374
Human Resources
ACPS FY 2024 Proposed Budget Page 375 Support Services Departments
Human Resources Staffing Section TitleProgram Roll-Up Group TitlePosition Title FY 2020 Final FTE FY 2021 Final FTE FY 2022 Final FTE FY 2023 Final FTE FY 2024 Proposed FTE Change FY 2023 to FY2024 Human Resources Human Resources ADMIN SPECIALIST II1.00 1.00 1.00 1.00 1.00BENEFITS ANALYST1.00 1.00 1.00 1.00 1.00CHIEF HR OFFCR1.00 - - - -CHIEF OFFICER - HUMAN RESOURCES- - - 1.00 1.00COMPENSATION SPEC1.00 1.00 1.00 1.00 1.00DIRECTOR II - COMPENSATION & BENEFITS- - 1.00 1.00 1.00DIRECTOR II - EMPLOYEE RELATIONS- - 1.00 1.00 1.00DIRECTOR II - EMPLOYMENT SERVICES- - - - -DIRECTOR II - RECRUITMENT & RETENTION- - 1.00 1.00 1.00DIRECTOR II CMPBEN1.00 1.00 - - -DIRECTOR II-S-EMPLOY1.00 1.00 - - -DIRECTOR II-S-EMPREL1.00 1.00 - - -ESSER III - ADMIN ASSISTANT II- - - - 1.00 1.00 EXEC DIRECTOR-HR- 1.00 - - -EXECUTIVE DIRECTOR - HUMAN RESOURCES- - 1.00 1.00 1.00HR DATA QUALITY SPECIALIST- - 1.00 1.00 1.00HR GENERALIST I1.00 1.00 1.00 1.00 1.00HR GENERALIST I - EMPLOYEE ENGAGEMENT & RELATIONS- - 1.00 - -HR GENERALIST II1.00 1.00 1.00 1.00 1.00HR GENERALIST II - EMPLOYEE ENGAGEMENT & RELATIONS- - - 1.00 - (1.00) HR SPECIALIST1.00 1.00 1.00 1.00 1.00HR SPECIALIST - EMPLOYEE RELATIONS- - - - 1.00 1.00 SR BENEFITS ANALYST1.00 1.00 1.00 1.00 1.00SR EMPLOYMENT SPEC2.00 2.00 2.00 2.00 2.00SUPPORT SPECIALISTII1.00 1.00 - - -Human Resources Total 14.00 14.00 15.00 16.00 17.00 1.00 Human Resources Total 14.00 14.00 15.00 16.00 17.00 1.00 Grand Total 14.00 14.00 15.00 16.00 17.00 1.00
ACPS FY 2024 Proposed Budget Support Services Departments Page 376 Human
Section Title
Resources
Facilities and Operations
Department and Office Contacts
Department of Facilities and Operations
Dr. Alicia Hart, PMP, Chief of Facilities and Operations
1340 Braddock Place
Alexandria, Virginia 22314
Tel: 703-619-8070 | Fax: 703-619-8987
alicia.hart@acps.k12.va.us
https://www.acps.k12.va.us/departments/facilities-operations
Responsibilities
The Facilities and Operations Department is led by the Chief of Facilities and Operations and supports the division in achieving goals 1-5 of the ACPS strategic plan:
• Goal 1: Systemic Alignment: ACPS will build a culture of continuous improvement and design equitable systems for school and instructional improvement.
• Goal 2: Instructional Excellence: ACPS will ensure that all students have access to and engagement with high-quality instruction.
• Goal 3: Student Accessibility and Support: ACPS will ensure students have equitable access to and engagement with programs and supports that reduce barriers to learning.
• Goal 4: Strategic Resource Allocation: ACPS will strategically provide differentiated resources and supports to schools and departments.
• Goal 5: Family and Community Engagement: ACPS will ensure that all families and community members feel welcomed, respected, and valued.
These goals are achieved through the collaborative efforts of the Offices of Educational Facilities, Capital Programs, Planning and Design, Maintenance and Custodial Services,
Pupil Transportation and Fleet Management, Safety and Security Services, and School Nutrition Services with school leadership, parents and staff, and other ACPS stakeholders.
The Chief oversees the operational efficiency and fiscal management of the Department, to include the Capital Improvement Program (CIP) budget. Oversight of the CIP budget includes the planning for capacity modernization and construction of new schools, transportation and technology assets, real estate planning for the division, and developing schedules that integrate academic programs to meet long range portfolio development goals of the School Board and City Council. The Chief also works with City of Alexandria peers and colleagues on crossorganizational efforts.
The Executive Director of Facilities supports the Chief by directly managing the facilitiesrelated offices to include Capital Programs, Planning and Design, Educational Facilities, and Maintenance and Custodial Services.
The Office of Capital Programs, Planning and Design (CPPD) is responsible for capital and long-range planning, in collaboration with the Office of Educational Facilities and other departments, enrollment forecasts, GIS analysis and the planning, design and construction of capacity or new building projects in ACPS’s Capital Improvement Program (CIP) budget. This office has significant interaction with City of Alexandria
ACPS FY 2024 Proposed Budget Support Services Departments Page 377
Facilities and Operations
staff and the community in establishing plans and executing projects. The team consists of planning, design and project management professionals.
The Office of Educational Facilities (EF) administers the non-capacity Capital Improvement Program (CIP) budget and projects, which is comprised of planned minor and major projects of all ACPS-occupied schools and other facilities. The office work program scope includes additions, renovations, abatement, systems replacement projects and smaller-scale design and construction. This effort is planned with facility and systems assessments, coordinated with Maintenance and Custodial Services, Capital Programs, Planning and Design and other offices and directed through the CIP and the City of Alexandria. Educational Facilities consists of planning, engineering, environmental, energy and project management professionals and plays a major role in coordinating with school campuses on environmental and sustainability programs. In addition, this office manages the Community Use of School Facilities program permit process.
The Office of Maintenance and Custodial Services (MCS) manages and cares for facilities and grounds owned and leased by ACPS. The team is comprised of both technical and labored staff to handle smaller-scale repairs and the cleaning of school buildings. In collaboration with Capital Programs, Planning and Design and Educational Facilities, Maintenance and Custodial Services work to sustain the lifecycle of our facilities and grounds. In addition, this office supports the Office of Educational Facilities with the Community Use of School Facilities program permit process.
The Office of Pupil Transportation and Fleet Management (PTFM) maintains a school bus, van and vehicle fleet that provides transportation services to students to and from school (who live outside of an established walk zone from each school). Transportation also supports specialized education students, after-
school activity programs and interscholastic sports in safe, well-maintained vehicles. The office is also responsible for transporting students to and from summer learning programs, private placement facilities and on field trips. The office maintains the Wellness on Wheels (WOW) bus, a mobile dental unit currently serving John Adams, Patrick Henry, Cora Kelly, William Ramsay Elementary school and Alexandria City High School students.
The Office of Safety and Security Services (S&SS) oversees the division’s security and emergency management services programs, health and safety requirements, and risk management areas in accordance with School Board policies and directives. S&SS manages and monitors physical security, secure intervention, visitor compliance and visual surveillance of access control points at all schools. S&SS manages training for compliance with state and local regulations, and manages the ACPS insurance portfolio. The Office also serves as the liaison to city services and school leaders to design, evaluate, comply and monitor safety and security policies, programs, and protocols.
The Office of School Nutrition Services (SNS) supports the educational mission and instructional programs of ACPS by providing nutritious meals to students and staff. School Nutrition Services provides a variety of choices for meals (breakfast, lunch, dinner, snacks, supper and summer feeding) that meet the Dietary Guidelines for Americans.-. Meals are planned using the USDA mandated criteria for menu patterns as a guide that ensures a focus on whole grains, fruits and vegetables, lean proteins, and low-fat dairy. ACPS also strives to diversify its nutritional offerings to support values of equity required by ACPS’ diverse and large international population of students and staff. Nutritious meals give ACPS students the opportunity to make educated, healthy food choices that will have positive physical outcomes and contribute to high academic achievement.the opportunity to make educated, healthy food choices that will have positive
Page 378 ACPS FY 2024 Proposed Budget Support Services Departments
Facilities and Operations
physical outcomes and contribute to high academic achievement.
Budget Summary
Facilities and Operations Department
As part of the FY 2021 ACPS organizational restructuring process, the Support Operations Department was renamed to the Facilities and Operations Department. The existing F&O Offices and Teams were realigned. These structural changes were reflected in the FY 2022 budget information.
The FY 2024 Proposed Operating Fund Budget for the Facilities and Operations Department is $37.05 million, an increase of $2.55 million over the prior year. The FY 2024 School Nutrition Fund Budget increased by $0.56 million to $12.60 million. A total of 318.0 FTE positions is budgeted across all Facilities and Operations Offices for FY 2024. Of these total budgeted positions, the FY 2024 Proposed Operating Fund supports 197.0 FTE positions and the School Nutrition Fund supports 121.0 FTE positions.
Executive Administration
The FY 2024 Proposed Operating Fund Budget for the Chief Operating Office totals $0.96 million and is staffed with 6.0 FTE positions.
Capital Programs, Planning and Design
The FY 2024 Proposed Operating Fund Budget for Capital Programs, Planning and Design totals $1.19 million and 7.0 FTE positions. Of the 7.0 FTE positions, 5.0 FTE will be reimbursed through CIP Fund.
The Operations and Maintenance Program resources are designated for departmental oversight, management and operations of all schools and facilities, provision of maintenance & custodial services, and safety & security services.
Educational Facilities
The FY 2024 Proposed Operating Fund Budget for Educational Facilities is $1.20 million and 7.0 FTE positions. Of the 7.00 FTE positions, 4.00 FTE will be reimbursed through CIP Fund.
Maintenance and Custodial Services
The FY 2024 Proposed Operating Fund Budget for Educational Facilities totals $20.91 million and includes 19.0 FTE positions. Notable budget changes in FY 2024 include:
- An additional 2.0 FTE Building Engineer positions; and,
- $1.10 million increase in HVAC maintenance services.
Safety & Security Services
The FY 2024 Proposed Operating Fund Budget for Safety and Security Services (S&SS) totals $2.37 million and includes 3.00 FTE positions. Notable budget changes in FY 2024 include a $0.50 million increase in Security Services.
Pupil Transportation
The Pupil Transportation program budget supports all pupil transportation systems, including after-school and summer learning programs, the Wellness on Wheels (WOW) bus and maintenance for all ACPS vehicles. The FY 2024 Proposed Budget for Pupil Transportation totals $12.21 million, an increase of $0.20 million. Staffing levels decrease by 5.00 FTE bringing the number of positions to 155.00 FTEs. Contracted staff budget reflects an MRA adjustment to bus driver compensation and a $.05 million decrease in the cost of fuel.
School Nutrition Services
The School Nutrition Services budget is a selfsupporting enterprise fund and supports all meal and snack programs division-wide. The FY 2023 Budget totals $12.60million and the Office is staffed with 121.00 FTE positions.
ACPS FY 2024 Proposed Budget Support Services Departments Page 379
Facilities and Operations
Facilities and Operations
Chief of Facilities & Operations
Dr. Alicia Hart, PMP
Management and Coordination of Educational Facilities, Capital Programs, Planning & Design, Maintenance & Custodial Services, Safety & Security Services, Pupil Transportation & Fleet Management, and School Nutrition Services
Executive Director of Facilities
Erika Gulick
CIP Budget Development and Implementation
Direct Oversight of Facilities Offices
Educational Facilities
John Finnigan, Director II
Building Infrastructure Contract Management
Lease Management
Capital Programs, Planning & Design
Azjargal “Azuka” Bartlett, Director II
Planning, Design and Construction of New Facilities Enrollment Projections
Maintenance & Custodial Services
Amanda Ou, Director II
Custodial Services, Preventative and Corrective Maintenance
School Nutrition Services
Vacant, Director II
Community Eligibility Provision (CEP)
School, Breakfast, Lunch and Dinner Programs
Breakfast in the Classroom
Snack Programs
Summer Learning Programs
Summer Meal Program
Pupil Transportation & Fleet Management
MeChale’ Johnson, Director II
Transportation for: Regular School Day
After School and Student Activities
Field Trips
Special Placement Students
Summer Learning Programs
Maintenance of ACPS Vehicles
Wellness On Wheels (WOW) Bus
School Safety & Security Services
John Contreras, Director II
Emergency Management
Liability Insurance Management
Safety, Environmental, and Risk Management
Security Services
Page 380 ACPS FY 2024 Proposed Budget Support Services Departments
Facilities and Operations
ACPS FY 2024 Proposed Budget Support Services Departments Page 381
Facilities & Operations Staffing Section Title Program Roll-Up Group Title Position Title FY 2020 Final FTE FY 2021 Final FTE FY 2022 Final FTE FY 2023 Final FTE FY 2024 Proposed FTE Change FY 2023 to FY2024 Facilities & OperationsFinancial Services SENIOR CAPITAL PROGRAM BUYER (CIP)- - - - 1.00 1.00 SPECIALIST - PROCUREMENT (CIP)- - - 1.00 - (1.00) Financial Services Total - - - 1.00 1.00Operations and Maintenance ADMIN ASSISTANT II- - 1.00 1.00 1.00ADMIN SPECIALIST- 1.00 2.00 2.00 2.00ANALYST - FINANCE- - 1.00 1.00 1.00ARCHITECT- 1.00 - - -ARCHITECT (CIP)- 1.00 1.00 1.00 ASST DIR II PRJT DLY- 1.00 1.00 - -ASST DIRECTOR - MAINTENANCE & CUSTODIAL SERVICES- - - 1.00 1.00ASST DIRECTOR II - PROJECT DELIVERY- - - 1.00 1.00BLDG SYS MANAGER- 1.00 - - -BUILDING ENGINEER II- - - - 2.00 2.00 BUILDING SVCS COORD- 1.00 - - -BUILDING SYS SUPR- 1.00 1.00 1.00 - (1.00) BUILDING SYSTEMS MANAGER- - 1.00 1.00 - (1.00) BUILDING SYSTEMS SUPERVISOR- - - - 1.00 1.00 CHIEF OFFICER - FACILITIES & OPERATIONS- - - 1.00 1.00CIP COMMUNICATIONS SPECIALIST- - 1.00 - -COMMUNICATIONS SPECIALIST (CIP)- - - 1.00 1.00CONSTRCTN PROG MGR- 1.00 - - -CONSTRUCTION ENGINEER- 1.00 1.00 - -CONSTRUCTION ENGINEER (CIP)- - 1.00 1.00 1.00CONSTRUCTION PROGRAM MANAGER (CIP)- - 2.00 2.00 2.00CONSTRUCTION PROGRAM MANAGER II (CIP)- - - 1.00 1.00CONSTRUCTION PROJECT MANAGER II (CIP)- - 1.00 - -CONTRACT SRVCS MNTR- 1.00 - - -COORD - BLDG SRVCS- - 1.00 1.00 1.00COORD - SAFETY & EMERGENCY OPERATIONS- - - - 1.00 1.00 COORDINATOR - SAFETY & EMERGENCY OPERATIONS- - 1.00 1.00 - (1.00) CUSTODIAN- 1.00 1.00 1.00 1.00DIR II CAP PLN & DSGN- 1.00 - - -DIR II SAFTY SEC SVC- - 1.00 - -DIRECTOR II - CAPITAL PLANNING & DESIGN- - 1.00 - -DIRECTOR II - CAPITAL PROGRAMS, PLANNING & DESIGN- - - 1.00 1.00DIRECTOR II - EDUCATIONAL FACILITIES- - 1.00 1.00 1.00DIRECTOR II - OPERATIONS- - 1.00 1.00 1.00DIRECTOR II - SAFETY & SECURITY SERVICES- - - 1.00 1.00DIRECTOR II-EDFAC- 1.00 - - -DIRECTOR MAINT & CUST- 1.00 - - -DIRECTOR PROJ & PLNNGDM PROJECT MANAGER- 1.00 - - -ENERGY MANAGER- 1.00 1.00 1.00 1.00EXEC DIR-ED FAC & MAINT- 1.00 - - -EXECUTIVE DIRECTOR - FACILITIES & OPERATIONS- - 1.00 1.00 1.00FACILITIES ENGINEER- 1.00 1.00 1.00 - (1.00) FACILITIES ENGINEER (CIP)- - - - 1.00 1.00 FINANCE TECHNICIAN- 1.00 - - -FINANCIAL ANALYST- 1.00 - - -GENERAL MAINT WRKR- 2.00 2.00 2.00 2.00HS PROJ DIRECTOR- 1.00 - - -LEAD SKILLED MAINT- 1.00 - - -MANAGER - BUILDING SYSTEMS- - - - 1.00 1.00 PLANNER II- - 1.00 1.00 1.00PROG MGR- 2.00 1.00 - -PROJECT MANAGER- - - 1.00 - (1.00) PROJECT MANAGER (CIP)- - - - 1.00 1.00 SENIOR CAPITAL PROGRAM MANAGER (CIP)- - 1.00 1.00 1.00SKILLED MAINT WRKR- 7.00 7.00 7.00 7.00SUPERVISOR - SECURITY SERVICES- - 1.00 1.00 1.00SUPPORT SPVR I- 1.00 1.00 1.00 1.00TECHNICIAN - FINANCE- - 1.00 1.00 1.00Operations and Maintenance Total - 33.00 39.00 40.00 42.00 2.00 School Administration SECURITY SVCS SUPERV- - - - -School Administration Total - - - - -Facilities & Operations Total - 33.00 39.00 41.00 43.00 2.00 Pupil TransportationTransportation ADMIN ASSISTANT I1.00 1.00 1.00 1.00 1.00ASST DIRECTOR - TRANSPORTATION- - - - 1.00 1.00 ASST DIRECTOR, TRANS1.00 1.00 1.00 1.00 - (1.00) AUTO/EQUIP MECH II6.00 6.00 6.00 6.00 6.00BUS DRIVER112.00 103.00 104.00 104.00 99.00 (5.00) BUS DRIVER TRAINER4.00 4.00 4.00 4.00 4.00 BUS MONITOR30.00 30.00 30.00 30.00 30.00DIRECTOR II - TRANSPORTATION- 1.00 1.00 1.00 DIRECTOR II-S-TRANS1.00 1.00 - - -DISPATCHER1.00 1.00 1.00 1.00 1.00DRIVER - NON-CDL- - - 6.00 - (6.00) LEAD MECHANIC1.00 1.00 1.00 1.00 1.00PARTS/SUPLY SUPVR1.00 1.00 - - -SPED PRESCHL SPC1.00 1.00 1.00 1.00 1.00SUPERVISOR - PARTS & SUPPLIES- - 1.00 1.00 1.00SUPPORT SPECIALISTII1.00 1.00 1.00 1.00 1.00SUPPORT SPVR I1.00 1.00 1.00 1.00 1.00SUPPORT SPVR II1.00 1.00 1.00 1.00 1.00VAN DRIVER - NON-CDL- - - - 6.00 6.00 Transportation Total 162.00 153.00 154.00 160.00 155.00 (5.00) Pupil Transportation Total 162.00 153.00 154.00 160.00 155.00 (5.00)
Facilities and Operations
SEC & EMRG MGT1.00
DIR II SAFTY SEC SVC1.00
III-OPERTN COORD1.00
Page 382
FY 2024 Proposed Budget
Services
ACPS
Support
Departments
Section Title Program Roll-Up Group Title Position Title FY 2020 Final FTE FY 2021 Final FTE FY 2022 Final FTE FY 2023 Final FTE FY 2024 Proposed FTE Change FY 2023 to FY2024 School Nutrition ServicesSchool Food Services ADMIN SPECIALIST1.00 1.00 1.00 1.00 1.00ANALYST - FINANCE- - - - 1.00 1.00 ASST DIRECTOR - SCHOOL NUTRITION- - - 1.00 1.00COORD - NUTRITION- - 1.00 1.00 1.00DIRECTOR II - SCHOOL NUTRITION- - 1.00 1.00 1.00DIRECTOR II-SCHLNUT1.00 1.00 - - -EQUIPMENT SPECLST1.00 - - - -EXECUTIVE CHEF- 1.00 1.00 1.00 1.00FIELD OPERATION SPEC2.00 2.00 - - -FINANCE TECHNICIAN1.00 1.00 - - -NUTRITION COORD1.00 1.00 - - -NUTRITION FIN ANLST1.00 1.00 1.00 1.00 - (1.00) SCHL NTRTN ASST I52.00 66.00 61.00 61.00 61.00SCHL NTRTN ASST II3.00 3.00 3.00 1.00 1.00SCHL NTRTN ASST III20.00 20.00 20.00 22.00 22.00SCHL NTRTN ASST MGR4.00 4.00 4.00 4.00 4.00SCHL NTRTN DLVRY1.00 1.00 1.00 1.00 1.00SCHL NTRTN MGR I14.00 14.00 14.00 14.00 14.00SCHL NTRTN MGR II3.00 3.00 3.00 3.00 3.00SCHL NTRTN MGR III1.00 1.00 1.00 1.00 1.00 SCHL NTRTN MGR TRN3.00 3.00 3.00 3.00 3.00SCHOOL NUTRITION SUP1.00 1.00 1.00 SOFTWARE SUP SPEC1.00 1.00 1.00 1.00 1.00SPECIALIST - COMMERCIAL EQUIPMENT MAINTENANCE- - - 1.00 1.00SPECIALIST - FIELD OPERATIONS- - 2.00 2.00 2.00TECHNICIAN - FINANCE- - 1.00 1.00 1.00School Food Services Total 111.00 125.00 120.00 121.00 121.00School Nutrition Services Total 111.00 125.00 120.00 121.00 121.00Educational FacilitiesOperations and Maintenance ADMIN SPECIALIST1.00 - - - -BLDG SYS MANAGER1.00 - - - -BUILDING SVCS COORD1.00 - - - -BUILDING SYS SUPR1.00 - - - -CONSTRCTN PROG MGR1.00 - - - -CONTRACT
- - - -COORD
- - - -COORD
- - - -CUSTODIAN1.00 - - - - -
- - - - -
- - - - -
- - - -DIRECTOR I EDFAC1.00 - - - -DIRECTOR II-EDFAC1.00 - - - -ENERGY MANAGER1.00 - - - -FACILITIES ENGINEER1.00 - - - -FINANCE TECHNICIAN1.00 - - - -FINANCIAL ANALYST1.00 - - - -GENERAL MAINT WRKR2.00 - - - -HVAC PROJECT MGR1.00 - - - -LEAD SKILLED MAINT1.00 - - - -PROG MGR3.00 - - - -PROJECT MGR - O&M1.00 - - - -SKILLED MAINT WRKR8.00 - - - -SUPPORT SPVR I1.00 Operations and Maintenance Total 35.00 - - - -School Administration SECURITY SVCS SUPERV1.00 - - - -School Administration Total 1.00 - - - -Educational Facilities Total 36.00 - - - -Safety & Security ServicesOperations and Maintenance COORD ENV HLTH&SFTY- 1.00 - - -COORD SEC & EMRG MGT- 1.00 - - -DIR II SAFTY SEC SVC- 1.00 - - -Operations and Maintenance Total - 3.00 - - -School Administration SECURITY SVCS SUPERV- 1.00 - - -School Administration Total - 1.00 - - -Safety & Security Services Total - 4.00 - - -Chief of StaffExecutive Administration ADMIN ASSISTANT II- 1.00 - - -CHIEF OF STAFF- 1.00 1.00 - -Executive Administration Total - 2.00 1.00 - -Chief of Staff Total - 2.00 1.00 - -Chief Operating OfficerExecutive Administration ADMIN ASSISTANT II1.00 - - - -CHIEF OP OFFCR1.00 - - - -SENIOR PLANNER1.00 - - - -Executive Administration Total 3.00 - - - -Chief Operating Officer Total 3.00 - - - -Grand Total 312.00 317.00 314.00 322.00 319.00 (3.00)
SRVCS MNTR1.00
ENV HLTH&SFTY1.00
DIR
DIRCTR-PLNG,DSGN,CNS1.00
Facilities and Operations
ACPS FY 2024 Proposed Budget Support Services Departments Page 383
Facilities and Operations
Page 384 ACPS FY 2024 Proposed Budget Support Services Departments
Facilities and Operations
ACPS FY 2024 Proposed Budget Support Services Departments Page 385
Facilities and Operations
Page 386 ACPS FY 2024 Proposed Budget Support Services Departments
Financial Services
Department of Financial Services
Dominic B. Turner, Chief Financial Officer
1340 Braddock Place
Alexandria, Virginia 22314
Tel: 703-619-8040 | Fax: 703-619-8090
dominic.turner@acps.k12.va.us
https://www.acps.k12.va.us/departments/financial-services
Responsibilities
The Financial Services Department (FSD) is led by the Chief Financial Officer and supports the division in achieving goal 4 of the ACPS strategic plan:
• Goal 4: Strategic Resource Allocation: ACPS will strategically provide differentiated resources and supports to schools and departments.
This goal is achieved through the collaborative efforts of the Offices of Budget and Financial Planning, Financial Systems and Reporting, Procurement and General Services, Accounting Services, and Payroll Services.
The Financial Services Department serves as a steward for public funds, safeguarding the assets of ACPS while supporting the division to meet annual and long-term performance goals.
Primary responsibilities are to:
• Support and assist schools and departments in budget preparation, financial management, procurement procedures, appropriation control,
expenditures monitoring, position control, chart of accounts, and student activity funds;
• Provide excellent customer service by enhancing the efficiency of financial operations throughout the division through continuous assessment of the department and implementation of technological and process improvements;
• Lead, coordinate, and prepare the divisionwide annual budget for all school funds. This includes establishing budgets in compliance with grant awards and ACPS requirements;
• Prepare and manage the allocation of all positions through the use of staffing formulas and class size analyses. Monitor staffing assignments and compliance with total approved full-time equivalents (FTEs);
• Prepare financial documents, including School Board materials, the Superintendent’s Final budget book, the School Board’s final budget book, internal management reporting, the Virginia Annual School Report (ASRFIN), and the Annual
Page 387 ACPS FY 2024 Proposed Budget Support Services Departments
Department and Office Contact
Financial Services
Comprehensive Financial Report (ACFR);
• Maintain accounting and payroll records in compliance with state and federal regulations;
• Ensure the timely and accurate processing of all financial transactions, including accounts receivable, accounts payable, payroll, Automated Clearing House (ACH) transactions, purchase orders, invoices, and credit or procurement cards;
• Perform detailed financial analyses to ensure division-wide expenditures and positions are in compliance with approved and amended budgets, School Board policies and division regulations;
• Manage the implementation of all new financial and payroll business systems and provide ongoing system administration and security support;
• Increase dollar savings through best business practices, procurement process standardization, and review of all ACPS contracts and partnership agreements with other organizations for greater business efficiency. Train all staff for accurate decentralized procurement processes; and
• Review and enhance internal controls to safeguard division assets and guarantee fiscal accountability. Implement generally accepted accounting principles to ensure compliance and prevent theft and fraud.
Page 388 ACPS FY 2024 Proposed Budget Support Services Departments
Financial Services
Budget Summary
The Financial Services budget consists of two components: the Financial Services Department and the Division-Wide FSD Reserve. The Financial Services Department budget manages the daily operations of the department, while the Division-Wide FSD Reserve houses the funding for the staffing and enrollment adjustment reserves, lapse salary and benefits, as well as contingency for emergencies and/or to cover any other unanticipated costs. The FY 2024 Operating Fund Budget totals $5.02 million, a decrease of $1.03 million. Staffing is projected to increase by .31 FTEs
Financial Services Department
The Financial Services Department budget supports budget and financial planning, financial systems and reporting, procurement and general services, grants management, accounting services, payroll services, and fiscal procedures and compliance. The FY 2024 budget will be $5.12 million with total staffing of 27.00 FTEs. The staffing levels are inclusive of additional Buyer positions converted from the prior year’s Executive Director, Procurement position.
The FY 2024 budget for internal services account has a credit balance of $0.06 million to offset the school and department internal services budget.
Division-Wide FSD Reserve
The FY 2024 Division-Wide Reserve totals a credit of $0.10 million. The reserve includes Teacher and Instructional Assistant reserve positions, as well as anticipated staffing lapse savings.
The Teacher positions reserve accoutns for 6.00 FTE Special Education Teacher positions, 4.00 FTE English Learners Teacher positions and 8.41 FTE General Education Teacher positions along with 4.00 FTE Instructional Assistants - Kindergarten positions.
The non-compensation portion of the FY 2024 Division-Wide Reserve Budget totals $2.90 million and includes a contingency for emergencies and/or to cover any other unanticipated costs.
Page 389 ACPS FY 2024 Proposed Budget Support Services Departments
Accounting Services
Michael Covington, Director
Maintain accounting records
Manage accounts receivable and accounts payable
Timely and accurate processing of financial transactions
Train personnel on K-12 school finance
Support internal and external audits
Federal, state and local grants reimbursements
Payroll
Mandeep Gill, Payroll Manager
Coordinate employee payroll process
File and report all payroll taxes
Maintain payroll records
Procurement and General Services
Dyanna McMullen, Director
Kimberly Young, Asst. Director
Coordinate the procurement of all goods and services
Increase savings through competition and best practices
Review all ACPS contracts
Network copier and Copier Center oversight
Facilitation of annual and targeted training based on the Virginia Public Procurement Act
Administration of the purchasing card program
Financial Services
Financial Services
Chief Financial Officer
Dominic B. Turner
Budget and Financial Planning
Robert Easley, Director
Budget , Asst. Director
Lead the division-wide annual budget process for all school funds
Manage the allocation of all positions
Perform detailed financial analysis
Establish budgets based on grant awards
Monitor expenses for compliance
Financial Systems and Reporting
Vacant, Asst. Director
Manage the implementation of all new financial and payroll business systems
Provide comprehensive and accurate financial reporting Submit official financial documents for peer review
Reserve Positions: General Education Reserve Positions: Special Education
Page 390 ACPS FY 2024 Proposed Budget Support Services Departments
Financial Services
Page 391 ACPS FY 2024 Proposed Budget Support Services Departments
Financial Services Staffing Section TitleProgram Roll-Up Group TitlePosition Title FY 2020 Final FTE FY 2021 Final FTE FY 2022 Final FTE FY 2023 Final FTE FY 2024 Proposed FTE Change FY 2023 to FY2024 Financial ServicesFinancial Services ACCOUNTING MGR- - - - -ACCTS PAYABLE ASSOC1.00 1.00 1.00 1.00 1.00ADMIN ASSISTANT II1.00 1.00 1.00 1.00 1.00ANALYST - BUDGET MANAGEMENT- - - - 1.00 1.00 ANALYST - BUSINESS DATA- - - - 1.00 1.00 ANALYST - CAPITAL PROGRAMS- - - - 1.00 1.00 ASST DIRECTOR - BUDGET- - - - 1.00 1.00 ASST DIRECTOR - FINANCIAL SYSTEMS- - - 1.00 1.00ASST DIRECTOR BUDGET1.00 1.00 1.00 1.00 - (1.00) ASST DIRECTOR FINSYS1.00 1.00 1.00 - -ASST DIRECTOR II - PROCUREMENT- - - 1.00 1.00ASST DIRECTOR PROCMT1.00 1.00 1.00 - -BUDGET MGMT ANALYST1.00 1.00 1.00 1.00 - (1.00) BUSINESS DATA ANLYST1.00 1.00 1.00 1.00 - (1.00) BUSINESS SYS ANLYST1.00 1.00 1.00 1.00 - (1.00) BUSINESS SYSTEMS ANALYST- - - - 1.00 1.00 BUYER1.00 1.00 - - -BUYER II- - 1.00 1.00 2.00 1.00 CAPITAL PROG ANALYST1.00 1.00 1.00 1.00 - (1.00) CHIEF FINANCIAL OFCR1.00 1.00 - - -CHIEF OFFICER - FINANCE- - 1.00 1.00 1.00CONTRACT SPEC1.00 1.00 1.00 1.00 1.00DIRECTOR II - ACCOUNTING- - 1.00 1.00 1.00DIRECTOR II - BUDGET- - 1.00 1.00 1.00DIRECTOR II - PROCUREMENT- - 1.00 1.00 1.00DIRECTOR II-BUDGET1.00 1.00 - - -DIRECTOR II-PROCURE1.00 1.00 - - -DIRECTOR II-S-ACCTG1.00 1.00 - - -ESSER - ACCOUNTING STAFF SUPPORT- - - - -ESSER - Accounting Support Staff- - 0.50 - -ESSER - PROCUREMENT STAFF SUPPORT- - - - -ESSER - Procurement Support Staff - - 0.50 - -ESSER II - ACCOUNTING STAFF SUPPORT- - - - 0.50 0.50 ESSER II - PROCUREMENT STAFF SUPPORT- - - - 0.50 0.50 ESSER III - ACCOUNTANT- - - - 1.00 1.00 EXECUTIVE DIRECTOR - PROCUREMENT- - - 1.00 - (1.00) FINANCE TECHNICIAN2.00 2.00 - - -MANAGER - PAYROLL- - - - 1.00 1.00 MANAGER-PAYROLL1.00 1.00 1.00 1.00 - (1.00) MANAGER-PROCURMNT- - - - -PAYROLL SPECIALIST2.00 2.00 - - -P-CARD ADMINISTRATOR- - 1.00 1.00 1.00PROCUREMENT SPEC- 1.00 - - -SENIOR ACCOUNTANT- - 2.00 2.00 2.00SENIOR ANALYST - PAYROLL- - 1.00 1.00 1.00SENIOR BUYER1.00 1.00 1.00 1.00 2.00 1.00 SPECIALIST - PAYROLL- - 2.00 2.00 2.00SPECIALIST - PROCUREMENT (CIP)- - 1.00 - -SR ACCOUNTANT2.00 2.00 - - -SR PAYROLL ANALYST1.00 1.00 - - -TECHNICIAN - FINANCE- - 2.00 2.00 2.00Financial Services Total24.00 25.00 27.00 26.00 29.00 3.00 Financial Services Total 24.00 25.00 27.00 26.00 29.00 3.00 Division-Wide FSD RDivision-Wide EL TCHR- - - - -FSD RESERVE5.00 9.00 - - -FSD RESERVE - EL TCHR- - 4.00 4.00 4.00FSD RESERVE - INSTRUCTIONAL AIDE- - - - 4.00 4.00 FSD RESERVE - SPED TCHR- - 1.00 - -FSD RESERVE - TEACHER- - 8.00 5.00 8.41 3.41 FSD RESERVE - TEACHER (FROM PH 4TH GRADE)- - - 1.00 - (1.00) FSD RESERVE TEACHER- - - 3.10 - (3.10) Division-Wide Total 5.00 9.00 13.00 13.10 16.41 3.31 EL RESERVE - EL TCHR- 2.00 - - -EL Total - 2.00 - - -Kindergarten and Pre-Kinderg INSTRUCTIONAL ASST - KINDERGARTEN- - - 4.00 - (4.00) Kindergarten and Pre-Kindergarten Total- - - 4.00 - (4.00)
Financial Services
Page 392 ACPS FY 2024 Proposed Budget Support Services Departments
Section TitleProgram Roll-Up Group TitlePosition Title FY 2020 Final FTE FY 2021 Final FTE FY 2022 Final FTE FY 2023 Final FTE FY 2024 Proposed FTE Change FY 2023 to FY2024 Special Education FSD RESERVE - SPED TCHR- - 5.00 6.00 - (6.00) FSD RESERVE - SPED TEACHER- - - - 6.00 6.00 RESERVE - SPED PARA2.00 - - - -RESERVE - SPED TCHR4.00 3.00 - - -Special Education Total 6.00 3.00 5.00 6.00 6.00Division-Wide FSD Reserve Total 11.00 14.00 18.00 23.10 22.41 (0.69) Grand Total 35.00 39.00 45.00 49.10 51.41 2.31
Page 393 ACPS FY 2024 Proposed Budget Support Services Departments Financial
Section Title
Services
Page 394 ACPS FY 2024 Proposed Budget Support Services Departments
This page intentionally left blank.
Section V: Appendix
✓ Glossary


✓ Additional Resources

Section V:
Accounts Payable: The amounts owed to private persons or organizations for goods and services received by the school system.
ACPS School Board: A nine-member elected body that adopts policy for the daily operation of Alexandria’s public schools and ensures school laws are properly explained, enforced, and observed.
Administrative Compensation: Salaries paid to administrators for full-time and part-time work. Administrators include principals, assistant principals, directors, supervisors, coordinators, and managers.
Adult Education:
Adult education and English literacy classes assist adults to become literate and obtain the knowledge and skills necessary for employment and self-sufficiency; assist adults who are parents to obtain the educational skills necessary to become full partners in the educational development of their children; and assist adults in the completion of a secondary school education.
Advanced Placement (AP) Program:
An intensive program of college-level courses and examinations that provides high school students with an opportunity to earn advanced placement, college credit, or both, at participating universities and colleges across the country. The AP program bridges the transition from secondary school to college by offering students an opportunity to develop their academic strengths through rigorous curricula, challenging national examinations, and by exposing them to academic experiences usually reserved for college students.
Americans with Disabilities Act (ADA): A federal law that prohibits discrimination against individuals with disabilities and requires employers to provide reasonable accommodations to help those with disabilities in performing their jobs. The ADA defines an
individual with a disability as a person with a serious physical or mental impairment that substantially limits a major life activity.
Annual Measurable Objectives (AMO):
The AMOs represent the percentage of students within each subgroup that must pass Standards of Learning (SOL) tests in reading and mathematics in order to make acceptable progress over six years. Although the AMOs represent yearly goals for lowperforming schools, all schools must meet these objectives. This measurement tool has been eliminated through the Every Student Succeeds Act (ESSA) and will not be reported in the future.
Appropriation:
A legislative act authorizing a designated amount of public funds for a specific purpose. The City of Alexandria appropriates funding to the school division to support operations.
Asset:
The International Accounting Standards Board defines an asset as a “resource controlled by the enterprise as a result of past events and from which future economic benefits are expected to flow to the enterprise.”
At-Promise Student:
Any student who is not presently reaching his or her fullest potential, but has the ability to do so with additional resources, additional time, or different instructional strategies.
Average Daily Membership (ADM):
The sum of total daily student membership of the school system divided by the number of days school was actually in session. ADM is a factor used in the state funding formulas.
Base Allocations:
The dollar amount for materials and supplies for schools, determined by adding per pupil allocations, recurring supplementals, and extended learning allocations, as applicable.
Page 395 ACPS FY 2024 Proposed Budget Appendix
Glossary
Glossary
Beginning Balance:
The dollar amount remaining in a fund at the start of a fiscal year.
Benefits:
Job-related benefits provided to employees as part of their total compensation. Fringe benefits include the employer’s portion of FICA, retirement, insurance (life, health, disability income, etc.), and employee allowances.
Budget:
The Association of School Business Officials (ASBO) defines a budget as “a plan of financial operation embodying an estimate of proposed expenditures for a given period or purpose and the proposed means of financing them.” It is a list of estimates of revenues and expenditures for the organization for a specified period of time. Normally a budget describes a period in the present or future, not the past.
Capital Improvement Program (CIP):
The primary source of funding for school construction, renovation, and maintenance projects. It provides a 10-year prioritized plan for major facility changes. It is submitted in a separate document to city council and is entirely funded by the City.
Capital Outlay:
Includes the purchases of replacement or additional fixed assets valued at more than $5,000 per unit that have a useful life of at least one year.
Carryover:
The process at the end of one fiscal year by which certain funds for previously approved School Board commitments to pay for goods and services are reappropriated in the next fiscal year.
Categorical Accounts:
State revenue funds for special student populations or for fulfilling particular state obligations.
City Appropriation: An expenditure level granted by the City Council to the School Board to make expenditures and to incur obligations for specific purposes. Appropriation authorizations expire at the end of the fiscal year.
Classroom Instruction Compensation: Salaries and wages paid to classroom teachers for full-time and part-time work. Classroom teachers include grades Pre-K to 5, core and elective, specialty, reading, special education, English Learners dual language, Talented and Gifted (TAG), and alternative education teachers.
Combined Funds: Includes the Operating Fund, Grants & Special Projects Fund, and the School Nutrition Fund. These three primary funds include appropriated positions including salaries and benefits for eligible full- and part-time employees, along with other revenues and expenditures, unlike the other funds.
Community Use Fees: Funds collected from outside entities for rental of ACPS facilities during non-school hours.
Cost Center Code: Identifies the revenue or expenditure as an elementary, secondary, instructional support, operational support, or administrative activity.
Department Code: Identifies the major and subsidiary organizational units in ACPS. The schools are included in the department code structure.
Designated Funds: Unencumbered, unexpended funds set aside by the School Board for subsequent use.
Dual Language: Program at Mount Vernon and John Adams elementary schools where Spanish-speaking and English-speaking students have the opportunity to learn Spanish and English
Page 396 ACPS FY 2024 Proposed Budget Appendix
literacy through content-based instruction in selected core subjects. Science, mathematics, and Spanish literacy are taught in Spanish. English language arts and social studies are taught in English. Dual language students continue to develop language and literacy skills in their primary language while learning the same content in their second language.
Employee Benefits:
Job-related benefits provided to employees as part of their total compensation. Fringe benefits include the employer’s portion of FICA, pensions, insurance (life, health, disability income, etc.), and employee allowances.
Encumbrance: A commitment to use funds for a specific purpose.
Encumbered Carryover: Funds set aside at the end of a fiscal year to pay for items encumbered during that fiscal year to be received and paid for in the subsequent fiscal year.
English Learners (EL): The EL program helps limited-English-proficient students learn literacy and content concepts in order to function successfully in the general education program.
Enrollment Adjustment Reserve: An amount established in the budget and used to adjust material and supply allocations if an individual school’s September enrollment exceeds budgeted student projections.
Every Student Succeeds Act (ESSA): The most recent reauthorization of the Elementary and Secondary Education Act (ESEA) is known as the Every Student Succeeds Act (ESSA). ACPS’ Title I funding is designated for the division by this act.
Exempt: A categorization of employees who, because of their positional duties, responsibilities, and level of decision making authority, are exempt
from the overtime provisions of the Fair Labor Standards Act (FSLA).
Expenditures:
Total charges incurred, whether paid or unpaid, for current costs.
Extended Learning:
Extended learning is instruction provided outside of the regular school day. It includes summer learning programs, modified school calendar intersession periods, and afterschool tutoring. Funding is provided through the operating and grants budgets.
Family and Medical Leave Act (FMLA):
FMLA is a U.S. federal law requiring covered employers to provide eligible employees job-protected and unpaid leave for qualified medical and family reasons. Qualified medical and family reasons include: personal or family illness, family military leave, pregnancy, adoption, or the foster care placement of a child.
Federal Funds:
Federal funds are provided through entitlement grants, including Title I, Title II, Title III and IDEA. Funds from entitlement grants may be carried over into future fiscal years, but must be spent within 27 months from inception.
Fiscal Year (FY):
The 12-month period used for budgeting and measuring financial performance. ACPS fiscal year begins July 1st and ends June 30th and corresponds to the fiscal years of the City of Alexandria and the Commonwealth of Virginia.
Fixed Assets:
Long-lived, tangible assets obtained or controlled as a result of past transactions, events, or circumstances. Fixed assets include buildings, equipment, improvements other than buildings, and land. In the private sector, these assets are referred to most often as property, plant, and equipment.
Page 397 ACPS FY 2024 Proposed Budget Appendix
Glossary
Free and Reduced-Price Meals (FARM): A program that provides free or reducedprice meals to children whose families are determined to be eligible for the federally funded school lunch program established by the National School Lunch and Child Nutrition Acts.
Freedom of Information Act (FOIA): The Freedom of Information Act establishes the right of the public to obtain information maintained by the federal or state government and their agencies. The FOIA creates a general mechanism designed to ensure that the process for getting that information will be simple, timely, and inexpensive.
Full-Time Equivalent (FTE): The ratio of the total number of paid hours during a period (part-time, full-time, contracted) by the number of working hours in that period Mondays through Fridays. The ratio units are FTE units or equivalent employees working full-time.
Function Code: Defines what type of activity is occurring with the transaction, such as classroom instruction, social work services and building operations. These codes are used to complete the Annual School Report that is submitted annually to the Commonwealth of Virginia.
Fund: A fund is a grouping of related accounts that are used to maintain financial control of resources segregated for specific activities or objectives.
Fund Balance: The Governmental Accounting Standards Board (GASB) defines fund balance as “the difference between assets and liabilities in a governmental fund.”
Fund Code:
Identifies the source (Operating, School Nutrition, Grants and Special Projects) of funds
for an activity.
Fund Statements: A financial summary indicating sources of funds and payments made during a given time period.
FY 20XX Actual: Terminology used to identify numbers that are actual, audited revenues and expenses for the fiscal year ended June 30, 20XX.
FY 20XX Approved Budget: Terminology used to identify numbers that are the planned revenues and expenditures for the fiscal year ending June 30, 20XX, as approved by the School Board and submitted to the City Council in early March.
FY 20XX Final Budget:
Terminology used to identify numbers that are the planned revenues and expenditures for the fiscal year ending June 30, 20XX, as approved by the School Board in May.
FY 20XX Proposed Budget: Terminology used to identify numbers that are the planned revenue and expenditures for the fiscal year ending June 30, 20XX, as presented to the School Board by the Superintendent in January. This budget serves as the tool for discussions leading to the 20XX approved budget.
Generally Accepted Accounting Principles (GAAP):
Uniform minimum standards and guidelines for financial accounting and reporting. They govern the form and content of the financial statements of an entity. GAAP encompass the conventions, rules, and procedures necessary to define accepted accounting practice at a particular time. They include not only broad guidelines of general application, but also detailed practices and procedures. GAAP provide a standard by which to measure financial presentations. The primary authoritative body on the application of GAAP to state and local governments is the
Page 398 ACPS FY 2024 Proposed Budget Appendix
Glossary
Governmental Accounting Standards Board (GASB).
General Education Program:
The major educational programs that serve students in the core instructional areas, namely elementary, middle, and high school instruction.
General Ledger:
A record containing the accounts needed to reflect the financial position and the results of operations of a government.
Governmental Accounting Standards Board (GASB):
GASB establishes the standards of state and local governmental accounting and financial reporting.
Grants and Special Projects:
A fund grouping of entitlements and competitive grant monies, including federal funds from the Individuals with Disabilities Education Act (IDEA) and the Elementary and Secondary Education Act (ESEA), as well as state and local entitlement monies and competitive grants.
Head Start:
A federal grant that provides a comprehensive child development program to children ages three to five years from income-eligible families. The Head Start program in Alexandria is administered by the Campagna Center.
Incentive Accounts:
Incentive-based payments from the state are not required by law but are intended to target resources for specific student or school needs statewide.
Individualized Education Program (IEP): A written statement indicating the primary special education placement and related services a student with disabilities will receive. The IEP is developed mutually by the child’s parents and a team of ACPS specialists.
Instruction:
The activities dealing directly with the teaching of students or improving the quality of teaching.
Intermittent Pay: Compensation to non-contract employees for hours worked or to contract employees for hours worked outside of their contract period. Hours worked are documented through timesheets or the time clock system.
Internal Services:
Goods or services provided from one ACPS office or school to another for items such as printing, internal transportation, food services, and planning activities.
International Baccalaureate (IB):
An internationally recognized advanced academic program providing college-level course work in six academic areas and offering high school students with an opportunity to earn advanced placement, college credit, or both, at participating universities and colleges.
Lapse (Vacancy) Savings:
An estimate of savings that occurs when budgeted positions are filled for only a portion of the fiscal year or remain unfilled throughout the fiscal year.
Liability:
The International Accounting Standards Board defines a liability as “a present obligation of the enterprise arising from past events, the settlement of which is expected to result in an outflow from the enterprise of resources embodying economic benefits.”
Local Composite Index (LCI):
The state’s measure of local ability to pay. The higher the LCI, the greater the local school division’s ability to pay for educational services with local funds. Alexandria holds the highest LCI available at 0.80.
Page 399 ACPS FY 2024 Proposed Budget Appendix
Glossary
Local Funds:
Included in this category are revenues received for community use of school facilities, tuition from students who reside outside of the City of Alexandria, revenue from summer learning programs and adult education students, and fees from parking permits and lost textbooks. Other types of revenue include refunds, rebates and insurance claims.
Materials and Supplies: Articles and commodities, including textbooks, that are consumed or materially altered when used and minor equipment that is not capitalized.
Membership: Another term for student enrollment.
Modified Calendar Program: Program held at Samuel W. Tucker Elementary School. The calendar consists of four nine-week sessions of instruction and two intersession periods.
Modified Zero-Based Budget: A bottom up review of all planned expenditures for the upcoming fiscal year – from justifying the need for every position to explaining the use of office supplies.
Object Code:
Provides for a detailed classification of expenditures. Codes are based on the Commonwealth of Virginia’s object code structure. The object code is the level of the accounting code structure that defines what is purchased, e.g., textbooks, electrical utilities, salaries, computers.
Open Honors:
Enrollment program at the middle school level which encourages all students to participate in honors-level courses.
Operating Fund:
This fund includes the division’s primary revenue sources from the Commonwealth of Virginia, the City of Alexandria, selected federal
sources and miscellaneous local fees, and the expenditures charged against these revenues.
Other Charges:
Expenditures to support operations (e.g., utilities, travel, insurance, phone charges, postage, leases/rentals).
Other Financing:
Unexpended funds from the fiscal period two years prior that have been approved by the School Board for use in the specified budget year. In previous budget documents, beginning balance has been titled “Fund Balance.”
Other Post-Employment Benefits Trust Fund (OPEB):
This fund was established to implement the Governmental Accounting Standards Board (GASB) Statement No. 45. This standard addresses how state and local governments should account for and report costs related to post-employment health care and other nonpension benefits.
Other Uses of Funds:
This series of codes is used to classify transactions that should not be recorded as expenditures of the school division but require budgetary or accounting control. These include fund transfers and contingency funds. Most federal grants and some state grants allow the school division to charge indirect costs for technical and overhead related to the programs.
Overtime:
Compensation to non-exempt employees for hours worked in excess of 40 hours per week.
Prepaid Items: An accounting recognition of amounts paid in advance for future expenses. An example is insurance where premiums are paid upfront to protect against future risk.
Professional Support Compensation: Salaries and wages paid to support teachers
Page 400 ACPS FY 2024 Proposed Budget Appendix
Glossary
and other teacher-scale positions for full-time and part-time work. Support positions include library media specialists, school counselors, social workers, instructional technology support teachers, instructional coaches, nurses, psychologists, and curriculum developers.
Program Code:
Consists of 10 major areas as defined by the Code of Virginia and the subsidiary program areas.
Purchased Services: Services acquired from outside sources. These include private vendors, public authorities or other governmental entities, including tuition payments to other school divisions for the education of students with disabilities) Purchase of the service is on a fee basis or fixed-time contract basis.
Restorative Justice:
Restorative Justice is a theory of justice that emphasizes repairing the harm caused by negative behavior. It is a cooperative process that can lead to transformation in people, relationships, and communities.
Revenue:
The income of a government agency from taxation and other sources.
Salaries:
All compensation for the direct labor of persons in the employment of the local government. Salaries and wages paid to employees for fulland part-time work, including overtime, shift differential, and similar compensation. Includes payments for time not worked, including sick leave, vacation, holidays, jury duty, military leave, and other paid absences that are earned during the reporting period.
School Nutrition Fund:
A fund grouping of local, state, and federal revenue and related expenditures for the operation of all food services activities.
Site Code:
Each site in ACPS has a unique code identifying the physical location of the activity.
Specialized Instruction Programs: Services provided to eligible students in preschool through grade 12, division wide. Specific programs include autism, hearing impairment, emotional disabilities, intellectual disabilities, learning disabilities, physical and occupational therapy, physical disabilities, speech and language, and visual impairment.
Staffing Reserve:
An amount established in the budget to cover the cost of salaries and benefits for undesignated staff positions. The reserve is managed centrally and used only in cases of unforeseen need.
Standards of Learning (SOL):
The Commonwealth of Virginia’s expectations for student learning and achievement in grades K-12. Standards are established for English, mathematics, science, history and social science, technology, fine arts, world languages, health and physical education, and driver education.
Standards of Quality (SOQ): Board of Education Standards prescribed for all public schools in the Commonwealth. Established in the Code of Virginia, these standards are the basis for the Commonwealth’s funding of local school divisions.
State Category:
The broad expenditure categories for school divisions determined by the State Board of Education. Current state categories are: Instruction, Administration, Attendance and Health, Pupil Transportation, Operation and Maintenance, School Nutrition Services and Other Non-Instructional Operations, Facilities and Technology. The State Category is also called “Function Code”.
Page 401 ACPS FY 2024 Proposed Budget Appendix
Glossary
Glossary
State Revenues: State funding is divided into five tiers: Standards of Quality, School Facilities, Incentive, Categorical Accounts and Lottery Funded. The General Assembly holds budget deliberations during the months of January and February each year and adjustments to state revenues are made as part of the final budget.
Stipends:
Funds awarded for work that is in addition to regular duties and performed outside the scope of the regular work day.
Substitute Pay:
Compensation for non-contract employees who perform the work of regular full- or part-time employees who are absent. Substitutes may also fill full-time positions on a temporary basis.
Superintendent of Schools: Leader responsible for the day-to-day operations of the entire school division. The Superintendent is hired by the School Board.
Supplemental Compensation: Compensation to full and part-time regular employees for work performed outside of the scope of their positions. May include such pay as shift-premiums, incentives, and extra-duty stipends.
Support Compensation: Salaries and wages paid to clerical, technical, custodial, and maintenance staff members for full- and part-time work. Support staff includes paraprofessionals, administrative assistants, hall monitors, bus drivers and monitors, custodians, and building engineers.
Title I (ESEA/ESSA):
Title I, Part A of the Elementary and Secondary Education Act (ESEA), as amended, provides financial assistance to local educational agencies (LEAs) and schools with high numbers or high percentages of children from low-income families to help ensure that all children meet challenging state academic standards.
Title II, Part A (ESEA/ESSA):
Title II, Part A of the Elementary and Secondary Education Act/Every Student Succeeds Act aims to increase student achievement by elevating teacher and principal quality through recruitment, hiring, and retention strategies. The program uses scientifically-based professional development interventions and holds districts and schools accountable for improvements in student academic performance.
Title III (ESEA/ESSA):
Title III of the Elementary and Secondary Education Act/Every Student Succeeds Act provides language instruction assistance for limited English proficient and immigrant students so they may meet the state Standards of Learning required of all students.
Turnover Savings:
Savings from staff retiring or leaving and being replaced by employees coming in at lower steps on the salary scale.
Unexpended Funds:
A positive difference between revenues and expenditures in a specific fiscal year. Unexpended funds may be encumbered (tied to commitments to purchase already made) or unencumbered (available for other uses).
Utilities:
All expenditures for electrical, heating, water, and sewage services provided to school system-operated buildings and facilities.
Vacancy Savings:
Salaries and benefits not paid while positions are vacant. Refer to Lapse Savings for more information.
Washington Area Boards of Education (WABE) Guide:
A statistical report comparing area school districts’ data, such as salaries, budgets, costs per pupil, and class sizes.
Page 402 ACPS FY 2024 Proposed Budget Appendix
Additional Resources
The ACPS Web site
Additional information on the ACPS budget is available on the ACPS website at the following link: https://www.acps.k12.va.us/departments/financial-services/budget
At this site you can view the FY 2024 Budget Calendar and send us your Budget Questions and Comments.
Budget information for the City of Alexandria can be found on the City’s website at: https://www.alexandriava.gov/Budget
FY 2024 Budget Timeline
School Board approves the FY 2024 – FY 2033 CIP Budget
Superintendent presents Proposed Combined Funds Budget
School Board work sessions and add/delete sessions
Public Hearing on FY 2024 Combined Funds Budget
City Manager presents the City’s Proposed Budget
School Board approves Combined Funds Budget
City Council and School Board hold joint work session
Public Hearing on FY 2024 City Budget
City Adopts FY 2024 Budget
Public Hearing on FY 2024 Combined Funds & CIP Budgets
School Board work sessions and add/delete sessions
School Board adopts Final Combined Funds Budget
December 15, 2022
January 5, 2023
January 12 and 19
January 19, 2023
February 28, 2023
February 16, 2023
March 2, 2023
March 13, 2023
April 2023 (estimate)
May 18, 2023
May 4, 18, and 25 2023
June 1, 2023
Page 403 ACPS FY 2024 Proposed Budget Appendix
Additional Resources
URL Link List
Meeting Agenda: http://esbpublic.acps.k12.va.us
School Board Meetings: https://www.acps.k12.va.us/school-board/watch-school-board-meetings
Speak at a School Board Meeting Sign Up: https://www.acps.k12.va.us/school-board/watchschool-board-meetings/speak-at-a-school-board-meeting
Additional information on the ACPS budget is available on the ACPS website at the following link: https://www.acps.k12.va.us/departments/financial-services/budget
Budget information for the City of Alexandria can be found on the City’s website at: https://www. alexandriava.gov/Budget
Fund Type Structure
Segment Fund Fund Type Operating Fund Grant and Special Projects School Nutrition Fund Noncategorical 1100 Fund Group Local 2000-2299 State 2300-2999 Federal 5000s Enterprise Fund 6160
Page 404 ACPS FY 2024 Proposed Budget Appendix


Compiled by the Financial Services Department 1340 Braddock Place Alexandria, VA 22314 703.619.8040 www.acps.k12.va.us
