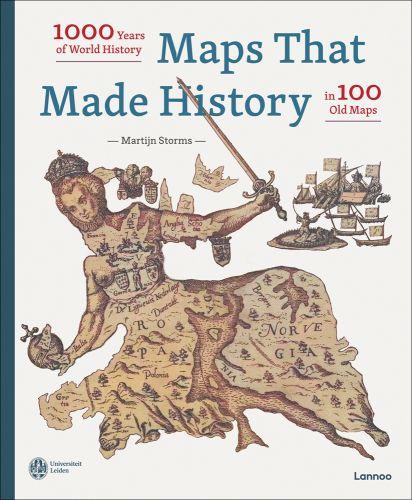


Maps That Made History is the apposite title of the beautiful book you have in your hands. This book is not primarily about the car tographic backdrop to the maps and atlases but more about their historical significance. They are maps that not only make history clearer but have often helped to shape it. Not that it is always a his tory to be proud of. Many of the maps in the collection of the Leid en University Libraries bear traces of the colonial past of the Netherlands and of other European powers, for example. Howev er, that is precisely why such a collection of maps and atlases is a rich source of research into that past today.
With Leiden designated as the European City of Science in 2022, there has never been a better time to showcase this extraor dinary collection, which we are doing through a fine exhibition at the National Museum of Ethnology and through this wonderful publication, which is appearing in both Dutch and English. It does justice both to the richness of the cartographic exhibits and to the intrinsically international character of our collection. The founda tions for that collection were laid in 1872, when the map collector Johannes Tiberius Bodel Nijenhuis bequeathed his vast car tographic treasure trove to Leiden University. Above all, this publi cation is intended to encourage students, teachers, researchers and other aficionados to consult the material, either at our Special Collections Reading Room in Leiden or via the digital collections on our website.
A major project like this can only succeed thanks to the involve ment and enthusiasm of many people. I would first of all like to ex press my huge appreciation for Martijn Storms, Jef Schaeps, Kasper van Ommen and Garrelt Verhoeven, the initiators of this publication from the circle of the Special Collections. As curator, Martijn Storms has been the driving force behind the project for the past two years and is responsible for most of the texts.
Many thanks too to the book’s editorial team, consisting of Michiel van Groesen, Anne-Isabelle Richard and Alicia Schrikker, all three of whom are researchers in Leiden’s Faculty of Humani ties, along with the book historians Kasper van Ommen and Garrelt Verhoeven on behalf of Leiden University Libraries.
Thanks too to the authors who wrote one or more of the essays in this book: Sunil Amrith, Eduard van de Bilt, Peter Bisschop, Jeroen Bos, André Bouwman, Mirjam de Bruijn, Marco Caboara, Koen De Ceuster, Joseph Christensen, Raymond Fagel, Karwan Fa tah-Black, Miko Flohr, Carrie Gibson, Marissa Griffioen, Charles van den Heuvel, Henk den Heijer, Tycho van der Hoog, Rivke Jaffe, Alexander Kent, David Koren, Radu Leca, Fan Lin, Thomas Lind blad, Ariel Lopez, Margot Luyckfasseel, Tsolin Nalbantian, Djoeke van Netten, David Onnekink, Ruud Paesie, Niek Pas, Norbert
Peeters, Nydia Pineda de Ávila, Judith Pollmann, Marianne Ritse ma van Eck, Cyrus Schayegh, Giles Scott-Smith, Carolien Stolte, Limin Teh, Harrie Teunissen, Inge Van Hulle, Bram Vannieuwen huyze, Guy Vanthemsche, Arnoud Vrolijk and Robert-Jan Wille. And we are also extremely honoured that Ilja Leonard Pfeijffer wanted to write a personal foreword to this book.
I would also like to thank all the staff of Leiden University Libraries who have contributed in various ways to the realisation of this book: Anneke Beekhof, Saskia van Bergen, Jos Damen, Carola van der Drift, Marc Gilbert, Kevin Idenburg, Doris Jedamski, Nicolien Karskens, Nadia Mishkovskyi-Kreeft, Ernst-Jan Munnik, Lam Ngo, Joke Pronk, Carlo Verstijlen and Vincent Wintermans. Jaap de Vreugd and Jacqueline Abrahamse were responsible for acquiring the photographs. Eva van ’t Loo and Nico van Rooijen handled the digitisation of all the maps from our collections that have been shown. Thanks also to *Asterisk for the translation of the texts and to John Steegh and Paula van Gestel-van ’t Schip for their help with the content.
Last but not least, I would like to thank our partners at Uitgeverij Lannoo: director Maarten Van Steenbergen, publisher Pieter De Messemaeker, editors Ineke Vander Vekens, Tamsin Shelton and Els Peeters, designer Stef Lantsoght and all the other employees of the publishing house. Right from the very start, they were highly enthusiastic about this project, building on the funda mental concept of De geschiedenis van Nederland in 100 oude kaarten (The History of the Netherlands in 100 Old Maps) by Marieke van Delft and Reinder Storm, and its Belgian counterpart De geschieden is van België in 100 oude kaarten (The History of Belgium in 100 Old Maps). They handled the publication of this extensive book with great professionalism and enthusiasm, for which I thank them.
The result is a beautiful and comprehensive book with a hun dred maps from ten centuries of world history, a hundred maps that wrote history, selected from the many thousands of maps and atlases that we manage in our library and make available daily. I would dare to believe that Bodel Nijenhuis would also have been proud of this publication, which does justice in all respects to the huge importance – both historical and cartographic – of the collec tion of maps and atlases in the Leiden University Libraries.
Kurt De Belder University Librarian Director of Leiden University LibrariesMonastic cartography

18
The world as a bird
22
Streams through time p. 122
The island of California p. 126
Around Africa to Asia p. 26
p. 30
map for a nostalgic bishop in exile
fortification plan for La Goletta
38
From peace-loving virgin to iron lady p. 46
42
From a map to a monument
A combination of scholarship and piety
The fluctuating borders of the Low Countries p. 52

mysterious Dampierre map p. 130



A peaceful image of a harsh city p. 134
aroma worth a fortune
118
Africa on the wall
Farewell to the miserable Southland
confluence of knowledge
150
map leads to salvage operation
p. 49 1600
The Atlantic Ocean on an animal’s back
Animals in a human world p. 158
p. 154
Language maps of the Lord’s Prayer
1631
1640
1663
1621
The world in segments p. 56
p. 62 1625
The siege of Bahia… or was it Sluis?
1632
Enrolling for the Brazilian coast p. 70
1645
The struggle against the Water Wolf p. 78 p. 59 1621
The Atlantic world as prey p. 66 p. 86 1658
p. 74 1633 On forgotten voyages
A voyage around Tierra del Fuego
Dead straight through the dunes p. 94 1666
Theatre of another world p. 82 p. 98 1663
1696
The myth of a clean war p. 114
Enforced stopover on Saint Helena
p. 90 1662 The world atlas race 1756
p. 106 1684
Feeding the thirst for knowledge
From tragedy to anti-English propaganda p. 102 p. 110 1695
Physical nature of the Earth revealed
A flat globe of the celestial vault 1757
An East India Company map of a divided island p. 170

1758 The seductive fiction of orderliness and victory p. 174 1765 The circles of Kandy p. 178
1775
A disastrous project in Bimilipatnam p. 166 p. 182 1771 Hydraulic engineering in Spain p. 162 1752 Philadelphia merges with its surroundings

Visualising a New Dominion p. 186 1784

A route map for the emperor p. 190 p. 194 1784
1786
A bloodbath on Kodiak Island p. 204 p. 197 1785 Straight roads for Irkutsk
Plantations along the Demerara p. 200 1785 In search of Atlantis
1789
The dynamics of the delta p. 208


The oldest atlas in the collection of the Leiden University Libraries is a Persian manuscript from the end of the twelfth century. The work is entitled Kitab al-masalik wa’l mamalik, which means ‘Book of Routes and Realms’ or ‘Book of Roads and Countries’. The first map in this book is a circular, schematic world map in which several blue areas with large red circles stand out. It is not easy for today’s map readers to recognise the locations on the map or to place them. The geographical forms of the coun tries depicted are greatly simplified and represented symbolically. Moreover, the map faces south, which does not facilitate recognition.
Surviving world maps from Arabic and Islamic traditions should not be separated from the writings in which they are usually found. The emphasis on those textual sources makes us wonder if the maps were intended mainly for the literate, urban elite in Muslim society. And of course, until the eighteenth century, maps in the Islamic world were almost exclusively distributed in the form of manuscripts. The earliest geographical sources were lists of places along pilgrim and postal routes in the Middle East. Several authors then elaborated the lists into geographical writings, often entitled Kitab al-masalik wa’l mamalik. This kind of work became the geo graphic standard in the Islamic world.
The Greek geographical tradition, recorded in Claudius Ptolemy’s Geographia or Kosmographia in the second century AD, strongly influenced Arab geography. In some respects, Ptolemy’s work is a set of instructions for how to create maps. It consists of an enumeration of approximately 8,000 place names displaying their geographical longitude and latitude. Geographical tables also appeared in the Arab world and they consisted of lists of place names with their corresponding coordinates. Initially, those data were not recorded on maps, as was the case with Ptolemy. The ear liest known Arab global maps were generally not based on a pro jection method or exact geographical locations. They did, however, share Ptolemy’s idea that the Earth is ‘spherical’ and only one half is habitable. Such a hemisphere can be depicted as a circle. One of
made by Abu Ishaq Ibrahim ibn Muhahammad al-Farisi al-Istakhri (mapmaker) TiTle [World map in a summary of] Kitab al-masalik wa’l mamalik place of issue [Persia] daTe 1193 [Islamic year: 589]
Technique Manuscript atlas dimensions 42 x 62 cm scale c. 1:30,000,000 orienTaTion North down signaTure Oriental Manuscripts Collection, Or. 3101

the earliest world maps in the Arabic-Islamic tradition was a large world map from the ninth century, produced on the initiative of caliph al-Ma’mum. Unfortunately, it did not survive and all we know about it has come from contradictory references in works by later authors.
Most preserved Islamic world maps from the Middle Ages be long to the works of the Balkhi School of geographers, named after the Persian multifaceted scientist Abu Zayd Ahmad ibn Sahl alBalkhi (849/850–934). Later geographers would build on the work of the earliest authors in that tradition. There are 59 known manu scripts worldwide that can be counted among the works of this school of geographers, dating from the eleventh to the nineteenth century. Balkhi’s original manuscripts have not survived, which also applies to the works of Abu Ishaq Ibrahim ibn Muhammad al-Farisi al-Istakhri (?–957). The oldest preserved manuscript dates from 1086 and was written by Abu al-Qasim Muhammad ibn Hawqal (?–fl. 978). Most manuscripts from the Balkhi School are copies or summaries of works by these three geographers. Each of the manuscripts contains twenty-one maps: a world map, three sea maps (of the Mediterranean, the Arabian Sea and the Caspian Sea) and seventeen maps of provinces. Among the province maps, thirteen relate to the Persian-speaking provinces of the Islamic Empire. The other four provinces are the Arabian Peninsula, Syria, Egypt and North Africa (including the Iberian Peninsula), where they spoke Arabic.
The world map shown here is from a summary of the Book of Routes and Realms by al-Istakhri from 1193. Hence the preserved manuscript is a copy of the original and was produced more than two centuries after Istakhri’s death. There are eighteen coloured maps in this manuscript. This world map is a good example of the early model of the Islamic worldview in the Balkhi School and typifies the worldview from a Persian-Islamic perspective. The world known in medieval Persia stretched from southern Europe and northern Africa in the west to China in the east. As mentioned earlier, the map faces south. The geography is greatly simplified and typically shows stylised straight and curved lines. The map was probably designed for mnemonic purposes, in other words for the ease of memorisation, rather than practical use. Such maps would be an important asset to geography education. In this worldview we recognise the shape of a bird, with the Arabian Peninsula as its head, Asia and Africa as its wings and Europe as its tail. It makes it easier to remember the map in broad outlines rather than in detail.
The map has a degree of symmetry owing to the two major seas: the Indian Ocean and the Mediterranean. Each has three islands that are depicted as three big red circles. In the Mediterranean, from left to right, they are Cyprus, Crete and Sicily. Red lines indicate the borders between the various regions of the Islamic Empire. The division is most detailed in the Middle East and in Persia. Persia’s provincial division into rather rectangular areas is notable. Beyond the Arab world, the division is less precise.
In Russia and Asia (India, Tibet, China), countries and regions are represented by concentric circles. Rivers tend to be straight lines, as is clearly seen in the Nile in Africa and the Euphrates and Tigris flowing into the Persian Gulf.
All the world maps in the works produced by the Balkhi School are slightly different, although they all feature a stylised appear ance and a great simplification. The circular world map by the lat er famous geographer Muhammad al-Idrisi (1100–1165/1166) great ly resembles those of the Balkhi School, but the landforms on this map, particularly in Europe and the Arab world, are much more recognisable to Western eyes. Al-Idrisi also added climate zones to his world map.
The highly simplified world map from the Balkhi School largely determined the worldview in the Arab-Islamic world. The surviv ing manuscript atlases are not only very early sources but also unique when studying Islamic cultural history. (Ms)


Timor, the southernmost island in the Indonesian Archipelago, is divided and belongs to two countries. The western part belongs to Indonesia, while the eastern part forms the independent state of East Timor (Timor-Leste). This division has its origins in colonial history, when two superpowers contested the island. The Portuguese had been there since 1515 and had mixed with the local population. A population group emerged called Topasses, but they referred to them selves as Larantuqueiros, inhabitants of Larantuka. After the Dutch East India Company (VOC) had built Fort Concordia in the western bay, the Dutch called them the ‘Black Portuguese’. Forming alliances with the Timorese princes or rajahs was how the Portuguese and the Dutch tried to rein force their positions of power. Eventually, the eastern part of Timor became a Portuguese colony and the west was part of the former Dutch East Indies. After the war of independence, the western territory became part of Indonesia. In 1976, Indonesia even annexed the Portuguese part for a short period. Since 2002, the eastern part has held an independent status as Timor-Leste. This manuscript map from the mid-eighteenth century shows how the border was formed that divides Timor to this day.
Relatively few maps of Timor from the Dutch East India Company era have survived, despite the long Dutch presence on the island. They are mostly sea charts, which covered a larger area, including many other islands and coasts. This unique hand-drawn map of Timor is much more detailed and bears witness to the island’s fraught history.
The Portuguese forts ‘Lifouw’ (Lifau), ‘Tolonican’ and ‘An nematte’ on the northern coast are marked with a fort icon and a Portuguese flag. They are close together. Those forts were located in today’s Oe-Cusse Ambeno, an enclave of Timor-Leste in the In donesian part of the island. Further east lies the Portuguese fort ‘Dillie’ (Dili), now the capital of Timor-Leste, and ‘Naijmoetie’ (Noumuti), which is inland. ‘Casteel Concordia’ on the west coast is marked with a Dutch flag. It was the Dutch East India Compa ny’s trading centre in ‘Coupang’ (Kupang). Inland, there is a drawing of a second Dutch fort called ‘Goede Mossel’, named
made by Anonymous TiTle ’t Groodt Timoor place of issue Not applicable daTe c. 1757–1760 Technique Manuscript on paper dimensions 58 x 90 cm scale c. 1:450,000 (5 Duijtsche Mijlen = 7.1 cm) orienTaTion North on top signaTure Bodel Nijenhuis collection, collbn 047-24-001
after Jacob Mossel (1704–1761) who was governor-general of the Dutch East India Company until his death in 1761. No other indica tion of this fort has been found and its existence has not been documented anywhere. Very likely the fort was only used a short time. Alternatively, maybe it is an imaginary fort that originated from the cartographer’s mind as a tribute to the highest Dutch authority in the East Indies. In addition to Portuguese and Dutch flags, there are some small red flags next to the villages on the island. The artist seems to be referring to the local rulers who commanded those villages.
The pattern of compass lines typifies nautical charts, but this map is more than a nautical chart. The detailed areas inland have made the map more like a hybrid hydrographical and topographi cal map. Although the map covers the whole island, the cartogra pher was mainly interested in the western part, which was under Dutch rule. The eastern part is portrayed smaller than it was and the pointed headland on the east is rounded, which makes the depiction of the island much less elongated than it was in reality. Vegetation is marked at several inland locations: ‘Groodt vlakte met toeacks boomen’, ‘Padie velden en toecke boomen’ and ‘Klapper boomen en rijst velden’. ‘Padievelden’ are paddy fields and ‘toeak’ or ‘klapperbomen’ are palm trees from which palm wine was extracted.
The border between Dutch and Portuguese territories is a dotted line, which is confusing because it is identical to the representation of roads or paths. ‘Scheijding tussen S.E. Comp. Landt en den Portugees’ denotes the demarcation line between the two territories. Later, a second demarcation line more to the east was added without much care. In practice, the Dutch sphere of influence did not extend much further than the immediate surroundings of Fort Concordia. A map from the 1898 Atlas van Nederlandsch Oost-Indië (Atlas of the Dutch East Indies) shows that the situation had not yet changed by the end of the nineteenth century. That map shows that a small ‘governmen tal area’ was demarcated around Kuang. The areas demarcated in green within the Dutch sphere of influence are local principalities with autonomous rule. That situation did not change until the treaty of 1 October 1904, when the borders between the Portuguese and Dutch territories were mapped out precisely. Disputes over several areas meant that the agreement did not come into force until 1917.
The manuscript map which was created in the eighteenth century was commissioned by the Dutch East India Company. The reason for this was probably the treaty that VOC envoy Johan Andreas Paravicini (1710–1771) wanted to conclude with fifteen rajahs, local rulers of Timor and Roti, and with rulers of Solor and Sumba, on behalf of Jacob Mossel. This treaty was signed in Fort Concordia on 9 June 1756 by the parties involved. Two watercol ours in the collection of the Dutch National Museum of World Cultures give a beautiful impression of the subsequent ceremony and sumptuous banquet with music and fireworks. The inscrip tion ‘1757’ next to several villages indicates the relationship be tween the manuscript map and the treaty, sometimes with the ad dition of the Dutch words for ‘Noble Company’ and ‘union’. A year after the treaty was signed, the places indicated on the map seem to match the places where the rajahs ruled.


The Dutch East India Company in Batavia had already sent a mapmaker to Timor to map the island in 1756. In the general mis sives of that year, it was stated: “Having seen that the pencalang [a Malay vessel] De Loper foundered in a severe storm along with the cartographer who was to have completed the map of the island
of Timor, we resolved to send a further mapmaker from here to bring the work that has been started to completion.” In short, the unfortunate cartographer who was commissioned to create the map of Timor had perished in a shipwreck on the way to the is land. Hence, it took a little longer to obtain a map. A new mapmak er was sent to Timor to complete the job. Two years later it is stat ed in the records: “Another map of Timor is on its way, which was received in 1757.” And two years later it said the following: “The map of Timor sent to Batavia by the officials in 1757, the best one so far, is now being sent to the Netherlands.”
It must have been this manuscript map, although the Leiden version might have been a copy or a duplicate. Considering that the map never reached the archives of the Dutch East India Com pany, it was probably the private property of a VOC officer, per haps Paravicini himself. At least the map was well used. Not only was the drawing of the border added without much care, but vil lages were added as well as numerous annotations at a later date, French translations of the original Dutch texts, underlining and additions. From a cartographic point of view, the listing of a series of maps is interesting – “voir Horsburgh, Valentijn, Sluideren [?], ma carte chinoise, Arrowsmith, Le Depôt” – and suggests that the map was compared to other maps. Several owners with local knowledge used the map for a long time. (Ms)

When the Dutch East India Company established a trading post on the artificial island of Deshima in Nagasaki Bay, it was quite something as Japan was virtually closed to foreigners at the time. The Japanese traded with China, Korea and Ryukyu (an independent kingdom at the time) but for a long time the Dutch on Deshima were their only contact with the Western world. That isolationism came to an end in 1854 when the Americans forced Japan to sign a treaty that led to an increase in international shipping traffic but also meant that the Japanese now needed to defend their coasts and bays. Work to improve coastal defences actually started before the treaty of 1854. This of course required maps, such as this one for the defence of Nagasaki Bay in the far southwest of Japan.
The natural harbour of Nagasaki Bay is relatively easy to defend and offers shelter for ships during the many typhoons that pass over every year. The northern inner bay is connected by a narrow passage to the wider, southern outer bay, which in turn is shielded from the East China Sea by a series of islands. Nowadays, some of those islands are connected to the mainland by the ever-expand ing docks and industrial sites. The Japanese have obviously long been aware of the bay’s excellent location. This map is good evidence of that.
The map comes from the archive of the Japanese Hideshima family, which was stored at a location in the Saga prefecture in the southwest of Kyushu island. The family kept it in a kura, a storage house that often stays in the possession of a family or business for generations. The archive documents date from the Bakumatsu pe riod (1853–1867), the final years of the feudal Tokugawa shogunate. Japan’s isolationist policy came to an end after then and it acquired a modern, imperial regime. This transformation marked the start of the Meiji Restoration (1868–1912). The Dutch, with their innova tive military and maritime expertise, helped the Japanese modern ise their coastal defences and skills in the art of warfare.
The Hideshima family were known for being able to speak Dutch and they supplied interpreters and translators for the Dutch on Deshima. The Hideshimas in turn served the Nabeshima family, who were in charge of security and the defence of the ports of
made by Unknown TiTle [Bay of Nagasaki] place of issue [Nagasaki] daTe c. 1863–1867 Technique Manuscript on paper dimensions 146 x 54 cm scale c. 1:20,000 orienTaTion North bottom left signaTure Oriental collections , Or. 27.750: 5
Hirado and Nagasaki. Nabeshima Naomasa (1815–1871) was the daimio, or lord, of the prefecture of Saga from 1830 to 1861. The daimios were from the samurai class. They had considerable autonomy in governing their districts but they had to report to the shogun, the high commander of the Japanese army, on matters such as taxes, infrastructure and defence.
Much of the Hideshima archive is made up of hand-drawn car tographic material relating to Nagasaki Bay. The large chart shown here gives an overview of the whole bay, as far as the headland pointing towards the island of Kabashima south of the city. The map shows the fortification system that was constructed in the mid-nineteenth century. The fortification works are indicated by red symbols: squares, large dots and small dots. The squares are spread along the coast. They show the position of the lookout posts on mountain summits and hilltops. The two large dots on either side of the inner bay mark the checkpoints where government officials monitored the ships sailing in and out and levied tolls. The smaller red dots indicate the location of the cannons, which were spread along the coast of the outer bay and on the islands shielding the bay. Lines have been drawn between the cannons along the bay to show the distances between the individual artillery weapons. The width of the stretch of water was relevant in determining the range of the cannons and the amount of gunpowder they needed.
A second map that has not been coloured in shows the same area; it is an incomplete draft of the overview map. A third sheet in a large format contains a detailed map of the small but strategically important island of Kaminoshima. To prevent ships from taking a shortcut, a dyke was built between that island and the nearby is land of Shirogashima. The dyke, which is shown clearly on the map, forced ships to take a more southerly route in sailing to
Nagasaki. Construction of the dyke cost 60,000 ryō, over half the total budget for modernising the coastal defences. The archive also contains nine smaller maps and topographical drawings of parts of Nagasaki Bay, the islands and this dyke. One of those sheets shows the central section of the bay. The drawing depicts four ships, in cluding one steamship (with French signal flags) and a white flag with a blue St Andrew’s cross, the flag of the Russian navy. Numer ous sailing ships and steamships with various flags are also shown in the bay in the overview map. Dutch, Russian, American and Brit ish flags can be seen in addition to Japanese flags.
It is often assumed that the intimidating expeditions to Japan by the American navy under the command of Admiral Matthew Perry (1794–1858) in 1853 and 1854 prompted the rapid construction of fortifications in the Bay of Edo (now Tokyo). But Abe Masahiro (1819–1857), the chief counsellor to the shogun, had already dis cussed the coastal defences with Nabeshima Naomasa in 1845. The Japanese were on high alert after the British had taken over Hong Kong from the Chinese following their victory in the First Opium War (1839–1842). After the Bay of Edo, the next task was improving the defences of Nagasaki Bay. In 1851, Nabeshima Naomasa was given permission by the shogun to place thirty-four cannons on Kaminoshima and twenty-six on Iōjima, two islands at the mouth of the bay. Ships were required to moor there and request permis sion to enter the harbour.

After Japan opened up to Western countries, ships were able to sail straight into Nagasaki harbour, whereby the cannons lining the outer bay lost their function. The increasing volume of internation al shipping traffic in the more narrow inner bay – and the similarly increasing frequency of violent incidents between the Japanese and foreigners – caused attention to shift to the military defence of the inner bay. A large number of cannons were moved to the inner bay in 1863 and again in 1866. The maps in the family archive are an accurate record of the activities and can be used to date them.
After Japan opened up, Russia, the United States and other great powers approached the Japanese administration to initiate trading relations. The Japanese continued to make use of the Dutch for the modernisation of Nagasaki as the two nations had such a long tra dition of cooperation. For the daimios of Saga, Dutch support was crucial in developing the harbours and in organising and training the navy. The Dutch role during the Meiji period was mainly about passing on their expertise in military engineering, artillery and coastal defence. The unique maps in the Hideshima archive give a wonderful picture of the work carried out in Japanese ports. While the usual maps and bird’s-eye panorama views of Nagasaki Bay are above all an aesthetically pleasing depiction, the maps in the ar chive provide historical information about an important phase in Japanese-Dutch relations. (Ms)
Map of the central section of Nagasaki Bay with four French ships and the flag of the Russian navy (Or. 27.750: 13.8).
Drawing of a military training exercise given by Dutchmen (Or. 27.750: 13.2).
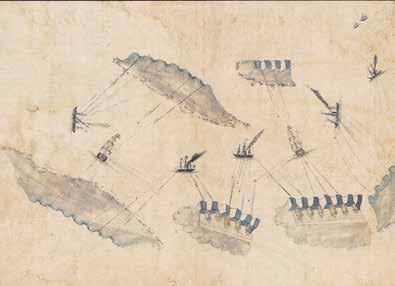
Schematic drawing of the navigation route between the islands showing the range of the cannons that formed the coastal defence (Or. 27.750: 13.7).



www.lannoo.com
Register on our website to receive our regular newsletter with information about new books and exclusive offers.
Edited by Michiel van Groesen, Kasper van Ommen, Anne-Isabelle Richard, Alicia Schrikker, Martijn Storms and Garrelt Verhoeven
copy-ediTing Tamsin Shelton and Martyn Jones TranslaTions Tessera BV, Clare and Mike Wilkinson, Rosemary Mitchell-Schuitevoerder, Angie Sullivan and Martyn Jones, for *Asterisk design Studio Lannoo in collaboration with Keppie & Keppie
cover images front Anonymous, Het Spaens Europa, 1598 (collbn Port 212 n 3). back, top right Maximilien-Henri de Saint-Simon (mapmaker) and Pieter Mol (engraver), Carte Plani-Sphère d’une portion des quatres parties du monde, c. 1785 (collbn Port 144 n 188). back, bottom left Netai Dass Ghose (designer) and Kailasha Pustakalaya (publisher), Map of Gaya, 1960 (collbn 054-19-006).
fronTispiece Print of the Leiden Sphaera, a model of the solar system powered by clockwork, following the ideas of Nicolaus Copernicus, c. 1670. In the eighteenth century, the Leiden Sphaera was installed in the university library. Today, it is exhibited in Museum Boerhaave (collbn Port 315-ii n 31).
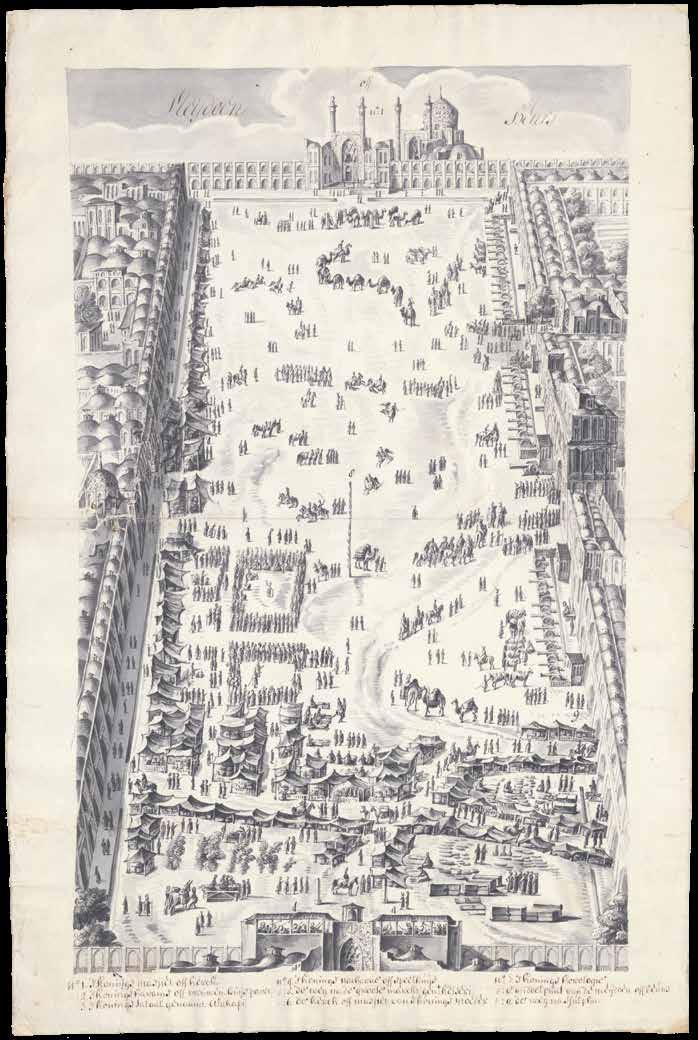
image page 4 Drawing of the Naqsh-e Jahan Square in Isfahan by Gerard Hofsted van Essen, 1703 (collbn 314-i n 58).
endpapers World map with western and eastern hemisphere (front) and northern and southern hemisphere (back) from Cedid Atlas Tercümesi, Istanbul, 1803-04 (collbn Atlas 81).
Digital collections of Leiden University Libraries: digitalcollections.universiteitleiden.nl
Support the Bodel Nijenhuis Fund: www.luf.nl
© Lannoo Publishers nv, Tielt, 2022 and Leiden University Libraries d/2022/45/481
All rights reserved. Nothing