Groundbreakers

Page 1


ART OF SURVEYING FROM LOCAL TO NATIONAL THE MANY FACES OF A CITY

ANTWERP AND THE URBAN CULTURE OF THE SOUTHERN NETHERLANDS

NEWS IN ABUNDANCE

NAVIGATING THE MEDIA LANDSCAPE IN THE SEVENTEENTH CENTURY

FRESH OFF THE PRESS

CARTOGRAPHIC UPDATES FOR THE BATTLE ON THE SCHELDT (1630 s )

UNITY AND DIVISION

THE LEO BELGICUS IN THE NORTHERN AND SOUTHERN NETHERLANDS

THROUGH OTHERS’ EYES

ITALIANS

PILOT GUIDES AND SEA CHARTS ON BOARD AND ASHORE

MAPS
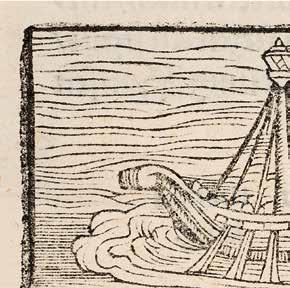
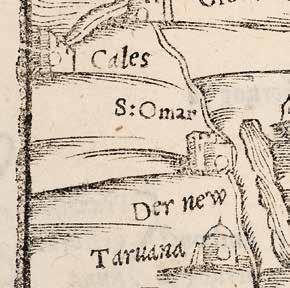
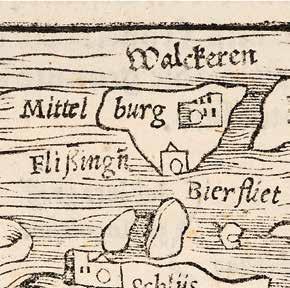
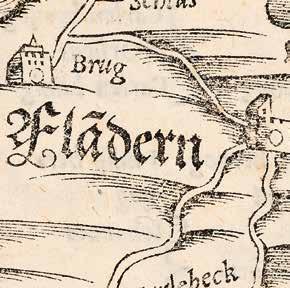
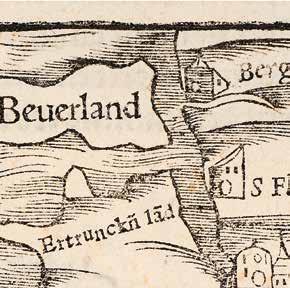
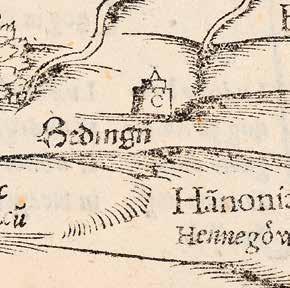
Sebastian Münster Fla[n]dern, 1550 or after Woodcut map of Flanders Woodcut, 125 × 160 mm
ANTWERP, THE PHOEBUS FOUNDATION

ese overseas adventures were, however, anything but altruistic. Both the mariners themselves and their promoters back home had just one thing in mind: to make money and become lords and masters of the new territories. Voyages of ‘discovery’ and colonization were inextricably linked with violence, oppression and enslavement. Cartography too was thoroughly implicated in all this, since maps either arose in the colonial context or were a means of pursuing such practices at sea.

e melting pot of the previously mentioned southern mapmakers (such as Petrus Plancius and Jodocus Hondius), northern ones (such as Johannes Janssonius, Lucas Jansz. Waghenaer and the Blaeu family), together with other visitors from abroad, brought about the apogee of cartography in the Low Countries, in terms of both quantity and quality. Despite all this activity by southerners in the Dutch Republic or on the other side of the world, things had not fallen entirely silent in the Southern Netherlands themselves. ere were some, for instance, who made the reverse migration from the North to the Catholic South, including the Van Langren family, while some Flemings also returned after a few years, Pieter Verbiest I and his son Pieter Verbiest II among them.

In the course of the eighteenth century, the leading centres of cartography shifted to Britain, France and the Holy Roman Empire. Important names in this regard include Johann Baptist Homann, the Sanson family, Guillaume Delisle and the Delamarche rm in Paris, which produced globes. Just as the Low Countries became less leading in European map production, a ood of ‘chorographic’ works in the Guicciardini tradition began to appear, designed to promote and boost patriotic pride in Flanders, Brabant or the Low Countries as a whole. e phenomenon, which lasted far into the eighteenth century, might have been a response to the declining prosperity in the region in the second half of the seventeenth. ese lavishly illustrated books, running to several volumes, were amply furnished with maps and detailed topographical prints of the south’s villages, towns, castles, country houses and monuments. e tone was set by Antonius Sanderus with his Flandria Illustrata (Amsterdam, 1641-1644) and Chorographia sacra Brabantiae (Brussels, 1659-1663), but important imitators followed, such as Jacques Le Roy with his work devoted to Brabant ( D pp. 18-19), Nicolaas Despars with his chronicle of Flanders, and Jean-Baptiste Christyn with his description of the whole of the Low Countries.

e rst truly systematic mapping of the territory corresponding with modern-day Belgium was the gigantic, large-scale map that Joseph Jean François, Count de Ferraris, produced in 1777-1778 for Maria eresa, empress of Austria. e Ferraris Map meticulously charted what were then the Austrian Netherlands. e fashion for large-scale, nationwide topography of this kind continued into the nineteenth century – the era of imperialism and nation states. Orders came down from government for entire territories to be mapped precisely in a uniform and systematic manner. is became a particular imperative when Belgium broke away from the Kingdom of the United Netherlands in 1830. e newly forged nation felt a powerful need – in terms of identity as well as cartography – to set itself down on paper and present itself as a uni ed whole. Philippe Vandermaelen had the opportunity to produce the lion’s share of this o cial cartography.

In addition to formal documents of this kind, there were of course maps for ordinary users too. e middle classes saw their mobility expand in the nineteenth century, with families setting out on their travels –primarily in their own country but also with the occasional trip abroad. Travelogues and guidebooks became more common, and convenient pocket-sized atlases grew in popularity. ere was also an explosion in this period in the publication of city views, portraits, and pictures of favourite spots, attractions and buildings in Belgium and abroad. e invention of lithography meant that these could be printed in very large runs. Topographical and cartographical material – in the form of maps, text and images – became more accessible and a ordable, no longer the preserve of a wealthy, intellectual elite. Maps now became part of everyday life and leisure in several layers of society.

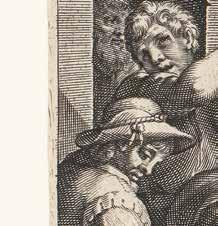
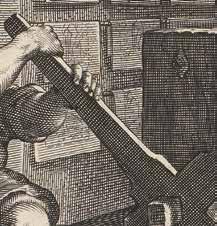
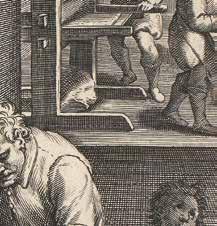
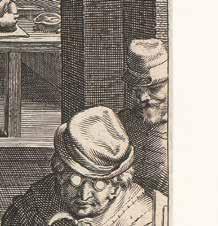
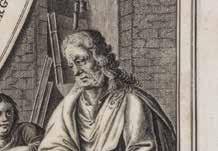
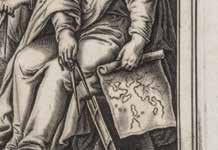
Hans Collaert and Theodoor Galle after Johannes Stradanus
Nova Reperta: Sculptura in aes, c.1590
e invention of copper engraving
Copper engraving, 263 × 340 mm
ANTWERP, THE PHOEBUS FOUNDATION

CONCLUSION

is book invites you to discover for yourself the history of cartography in the (Southern) Netherlands, as brie y summarised above. e rst chapter begins with local cartography and topography, based on surveying and eldwork. We then travel from the countryside to the urban landscape, where a variety of city ‘portraits’ and maps are featured. is is followed by several chapters on the role of cartography in news culture and historiography, with particular reference to the Eighty Years War. Chapter III discusses the di erent news media, after which a speci c case is examined in Chapter IV. Chapter V looks at how the Low Countries re ected on their own history and on the relationship between North and South, while Chapter VI deals with the role played in historiography and mapping by foreigners – Italians in particular. In Chapter VII we take to the water: how are maps used to plot a course and navigate at sea? e next chapter focuses on where vessels from the Low Countries sailed to, which ‘new worlds’ were visited and mapped, and for what reasons. We then zoom out again to consider the di erent world views that held sway through the centuries, before examining world atlases, including Blaeu’s Atlas Maior e book rounds o by bidding farewell to the earth, using astronomical instruments and cosmography to gaze out into the universe and back.

e chapters are structured by scale, steadily zooming out as we go, yet also simultaneously zooming in on the objects from e Phoebus Foundation’s collection and their various creators, each of whom contributed to the story of Netherlandish cartography. e highlighted thematic texts provide extra information about certain subjects, speci c makers or important events. e interspersed texts marked in yellow point out special objects from the collection. e people and works that are examined along the way shed light on glorious moments in cartographic history while not shrinking from the dark side that often lies hidden. ere is more that maps do not show than they do, while at the same time they seek to present us with particular ideas and world views. An early map not only represents a geographical area and a historical situation; it is also not easy to pin down and can prompt an in nite number of new questions, discussions and interpretations. Groundbreakers invites you to explore and expand the horizons of your own world through cartography.

LITERATURE

J. Bossu, Vlaanderen in oude kaarten: drie eeuwen cartografie, Tielt, 1982.

W. Bracke & E. Leenders, Vlaanderen in 100 kaarten, Leuven, 2015.

P. De Maeyer, ‘Cartografie, de zee en de rol van de Vlamingen’, VLIZ, De Grote Rede, 31, 2011: 11-16.

P. De Maeyer, M. Galand, B. Vannieuwenhuyze et al., De geschiedenis van België̈ in 100 oude kaarten, Tielt, 2021.

D. Duncker & H. Weiss, Het hertogdom Brabant in kaart en prent, Tielt, 1983.

C. Koeman, Atlantes Neerlandici. Bibliography of terrestrial, maritime and celestial atlases and pilot books, published in the Netherlands up to 1880, Amsterdam, 1967-1971, 5 vols.

C. Koeman, Geschiedenis van de kartografie van Nederland: zes eeuwen land- en zeekaarten en stadsplattegronden, Alphen aan den Rijn, 1983.

C. Koeman, G. Schilder, M. van Egmond et al., ‘Commercial Cartography and Map Production in the Low Countries, 1500-ca. 1672’, in: D. Woodward (ed.), The History of Cartography, vol. 3. Cartography in the European Renaissance, Chicago / London, 2007, vol. 2: 1296-1383.

C. Koeman & M. van Egmond, ‘Surveying and Official Mapping in the Low Countries, 1500-ca. 1670’, in: D. Woodward (ed.), The History of Cartography, vol. 3. Cartography in the European Renaissance, Chicago / London, 2007, vol. 2: 1246-1295.

P. van der Krogt (ed.), Koeman’s Atlantes Neerlandici. New Edition, Houten, 1997 et seq., 6 vols.

G. Schilder & M. van Egmond, ‘Maritime Cartography in the Low Countries during the Renaissance’, in: D. Woodward (ed.), The History of Cartography, vol. 3. Cartography in the European Renaissance, Chicago / London, 2007, vol. 2: 1384-1432.

H. van der Heijden, Het Hertogdom Brabant in oude kaarten, 1536-1785, Eersel, 1991.

B. Vannieuwenhuyze, M. Griffioen & A. van Schaik, Oude kaarten lezen. Handboek voor historische cartografie, Zwolle, 2023.

K. Zandvliet, De groote waereld in ’t kleen geschildert: Nederlandse kartografie tussen de middeleeuwen en de industriële revolutie, Alphen aan den Rijn, 1985. K. Zandvliet, ‘Mapping the Dutch World Overseas in the Seventeenth Century’, in: D. Woodward (ed.), The History of Cartography, vol. 3. Cartography in the European Renaissance, Chicago / London, 2007, vol. 2: 1433-1462.

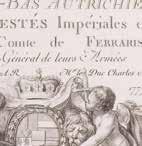
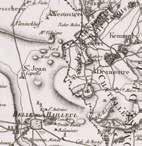
Ferraris’s topographical map

In 1777 and 1778, Holy Roman Empress Maria Theresa commissioned Joseph Jean François, Count de Ferraris (1726-1814), to prepare a huge, large-scale topographical map, running to 275 sheets, of her territory in the Low Countries. The Austrian Netherlands (Belgium Austriacum) is the collective name given to the eleven provinces of the Southern Netherlands during the period of Austrian Habsburg rule between 1715 and 1795 (with a brief hiatus in 1790), when the region became an autonomous part of the Habsburg monarchy. It is sometimes referred to as the ‘Imperial Netherlands’ to distinguish it from the Republic of the Seven United Netherlands (Belgium Foederatum), roughly the modern-day Netherlands.

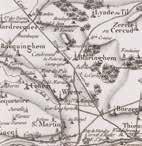
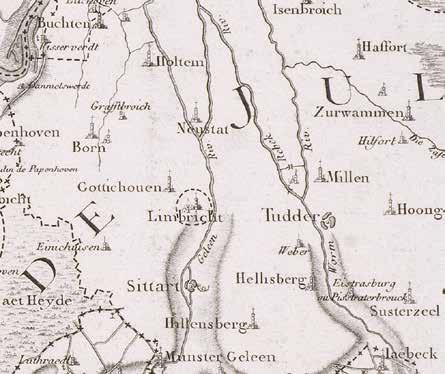
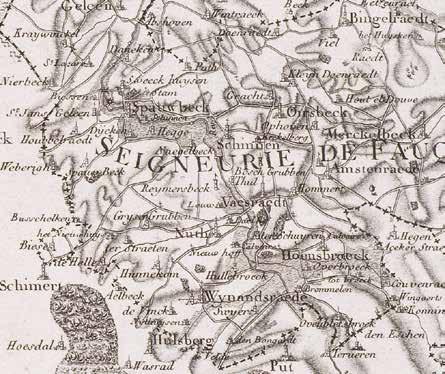
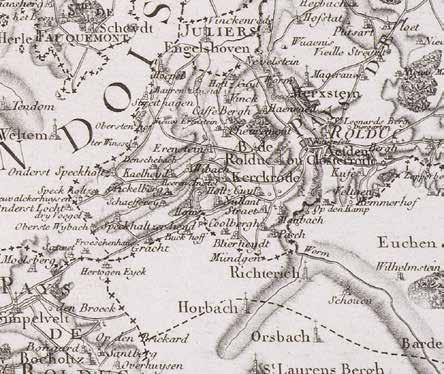
The Ferraris Map is viewed as the first detailed topographical survey of what is now Belgium, drawn at a scale of 1:11,520.

De Ferraris created the maps by hand and in a military context: he was a general of the Austrian artillery and a field marshal of the Austrian Netherlands. Only three original versions still exist, but a commercial printed version was also sold as a limited edition, a copy of which is in The Phoebus Foundation’s collection.

The scale of the printed Ferraris map has been reduced and the 275 map sections brought back to 25 sheets, bound together into a book. The trade edition too was made under the supervision of Count de Ferraris and was engraved by Louis-André Dupuis (active 1769-1787) and Jean-Baptiste Poirson (1761-1831).

Besides these two mapmakers, many other engravers, etchers and draughtsmen contributed to its production.

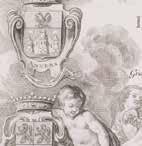
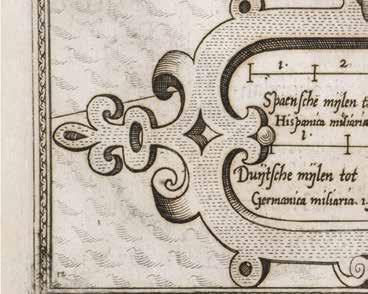
Map sheet 11: title cartouche
From: Joseph Jean François de Ferraris, Carte Chorographique des Pays-Bas Autrichiens
Dédiée à leurs Majestés Impériales et Royales, 1777 and 1797
ANTWERP, THE PHOEBUS FOUNDATION
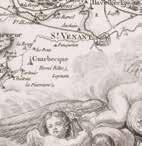
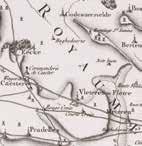
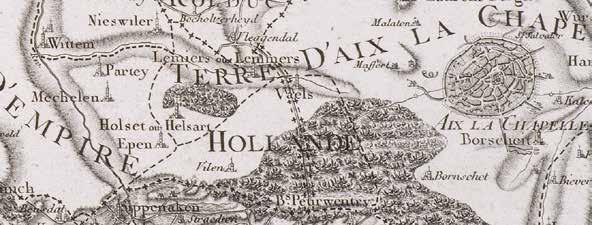
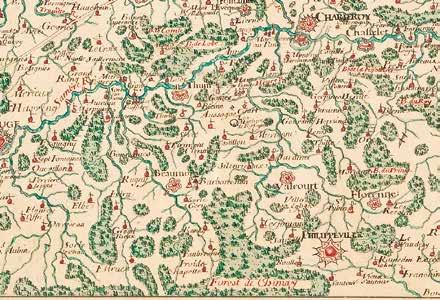
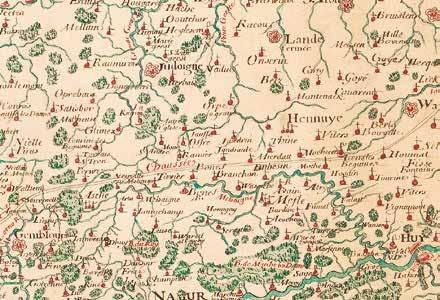
Map sheet 9: Brabant and Limburg
From: Joseph Jean François de Ferraris, Carte Chorographique des Pays-Bas Autrichiens
Dédiée à leurs Majestés Impériales et Royales, 1777 and 1797
ANTWERP, THE PHOEBUS FOUNDATION
Coenraad Lauwers
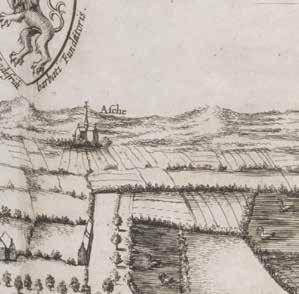
Affligenium vulgo Affligem Primaria ac nobilissima in Ducatu Brabantia Bird’s-eye view of A igem Abbey
From: Antonius Sanderus, Chorographia sacra Brabantiæ, 1659 ANTWERP, THE PHOEBUS FOUNDATION

THE BLOODY SIEGE OF OSTEND

The Eighty Years War was, to a large degree, a campaign of successive sieges. Cities throughout the Low Countries were alternately besieged and relieved. In some cases, the attackers successfully encircled and captured the town, while in others, the defenders, possibly with allied troops coming to their aid, were able to ward off the attack. Numerous maps were created to tell the story of these events, offering a narrative depiction of the course of the siege.

One of the most notorious sieges was that of Ostend (1601-1604), because it lasted so long and cost so many lives. Campaigns of this kind were normally over within a few weeks or months, but this siege lasted as long as several years. The town on the North Sea coast was the only place in Flanders still held by the Republic of the Seven United Netherlands around 1600. When Archduke Albrecht and the Infanta Isabella arrived in the Southern Netherlands, one of the first major tasks facing them was to conquer Ostend too. They were eager to bring the Flemish town back into the Catholic camp, as it provided the Republic with a base from which to attack the area directly. Albert’s ‘Army of Flanders’, consisting mainly of Spanish and Italian troops, surrounded Ostend in July 1601. The Republic had England as an ally, and given the many different interests that were at stake, the eyes of Europe were fixed on the siege.

King Philip III of Spain (1578-1621) began to lose faith in Albert’s military capabilities and dispatched the Italian general and strategist Ambrosio Spinola (1569-1630) to the conflict zone, following which progress began to be made. Spinola successfully captured Ostend, partly by cutting off its supplies and also by assaulting and bombarding the town with greater ferocity. While the siege ended in victory for the Spanish Army of Flanders, it is hard to speak of a winner, given the tens of thousands of casualties on both sides and the damage running to millions of guilders – an astronomical sum for the time. The destruction inflicted on Ostend could not, anyway, be expressed simply in words or numbers: the battle came to be known not only as the bloodiest siege of the Eighty Years War but also as one of the costliest campaigns of attrition. In the aftermath of the event, the immensity of the losses assumed mythical proportions, capturing the imagination of many people in the years that followed. Contemporaries compared the campaign to the siege and fall of Troy in classical antiquity because of its prolonged and gruelling nature.

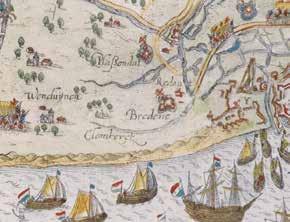
For all their consistency with the text, Van den Keere’s maps were not made specifically for the pamphlet: they were multi-purpose creations that also featured in atlases, for example. The Flandria map is a copy of one that the Antwerp publisher Christophe Plantin (1520-1589) had already published in 1577 as part of his Spieghel der wereld (‘Mirror of the World’) atlas, and the same map of Flanders appears several times in French- and Dutchlanguage editions of Lodovico Guicciardini’s famous description of the Low Countries ( D Chapter VI). The German engraver Georg Keller (1568-1634) was also involved in this evolving chain of maps: in 1605, he engraved one showing the iconic fleet at the bottom making its way to Sluis, but he also expanded the ‘story’ to include the area around Damme and continued the map on the right to Bruges and Ostend.

Portrait of Ambrosio Spinola as a Knight of the Golden Fleece, seventeenth century Oil on canvas, 63.1 × 49.6 cm
THE PHOEBUS FOUNDATION
Georg Keller
Map of the Franc of Bruges from Biervliet to Ostend and the Siege of Sluis, 1605 Hand-coloured etching, 255 × 380 mm ANTWERP, THE PHOEBUS FOUNDATION

CLAES JANSZ. VISSCHER ISSUES UPDATES

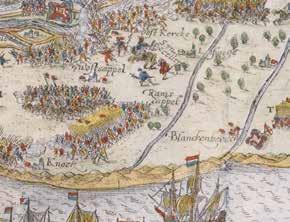
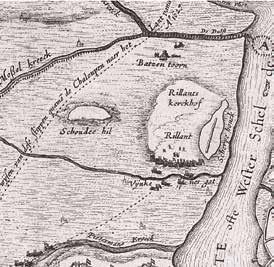
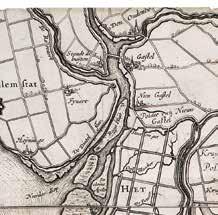
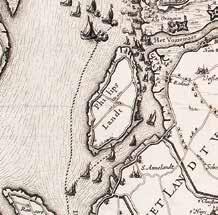
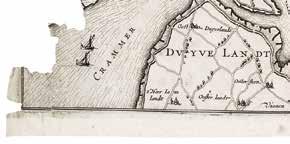
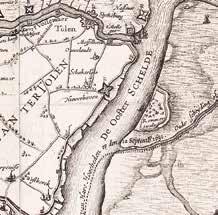
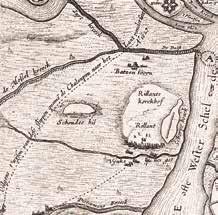
Developments on the Scheldt delta were closely followed by the Amsterdam engraver, printer and publisher Claes Jansz. Visscher, beginning with a map he published in 1627 to illustrate the run-up to the battle. As time went by, Visscher received more and more information, prompting him to scrape out some of the lines engraved in his original copper plate, which he then polished and re-engraved. A total of six di erent states of the map are known: two from 1627 and one each from 1631, 1632, 1638 and 1640 ( D on ‘states’, see p. 20).

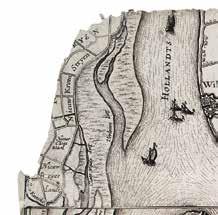
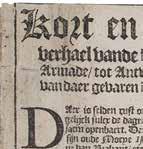
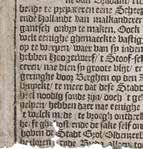
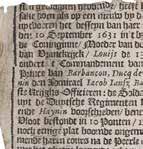
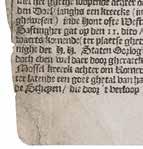
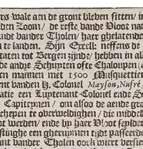
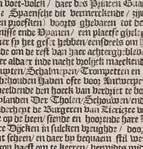
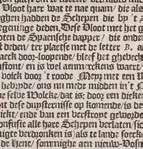
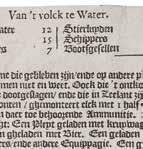
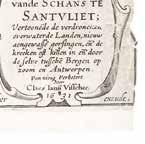
e Phoebus Foundation owns two copies from the series: the third state from 1631 ( D p. 111) and the fourth, dated 1632 ( D pp. 106-107). Visscher not only adjusted his copper plate several times; he also varied the map by adding extra sheets. He did so on the left side of the 1631 copy so that the Slaak would be included, while he placed the battle scene, in which the soldiers can be seen jumping into the water, in the upper right. A separately printed text in both Dutch and French explains the events depicted in the map under the title: ‘Short and concise account of the Spanish armada that sailed from Antwerp on 10 September 1631.’

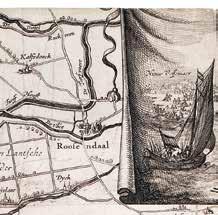
In 1632, a year later, Visscher took a very di erent approach: he removed the sheets on the left and the battle scene, and in their place he added extra sections of map at the top and on the right, which now included Rozendaal and Mechelen. Surprisingly, these do not depict any battles, gures or other events. Visscher might well have wanted to make these developments more visible by bringing them into the centre of the cartographic image. e composition is now symmetrical too, with the latest news events appearing more centrally on the map.

e di erent versions, intermediate forms and states gave Visscher the scope for endless variation, responding to current events and audiences and getting full use of the original 1627 copper plate. Where today we refresh our screens to keep up with the latest news developments, people in the seventeenth century could buy new, updated versions of Visscher’s maps in his shop. A separate map cost ve to ten stuyvers (the price of a large rye loaf at the time was six and a half stuyvers, while a jug of beer cost half a stuyver). But each variant also had its own speci c purpose and audience. e copies in e Phoebus Foundation’s collection were seemingly intended as informative news maps for an international audience, given their large size with added map or text sheets.

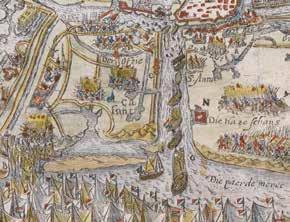
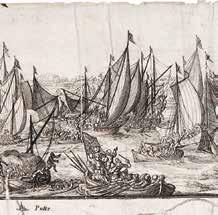
The Spanish ships are cornered in the Slaak. Panicking soldiers leap into the water, but States troops lie in wait for them.
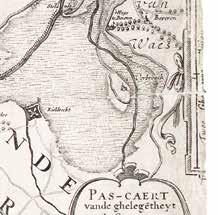
The dotted line shows the route taken by the Spanish fleet towards the Slaak channel. Details from: Claes Jansz. Visscher, Pas-caert van ghelege[n]theyt vande Schans te Santvliet, 1631 (p. 111)
Claes Jansz. Visscher
Pas-caert van ghelege[n]theyt vande Schans te Santvliet, 1631
News map of the Battle of the Slaak Etching, 380 × 640 mm
ANTWERP, THE PHOEBUS FOUNDATION
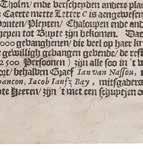
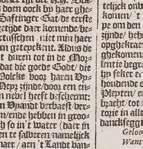
Text sheets Part of: Claes Jansz. Visscher, Pas-caert van ghelege[n]theyt vande Schans te Santvliet, 1631
ANTWERP, THE PHOEBUS FOUNDATION

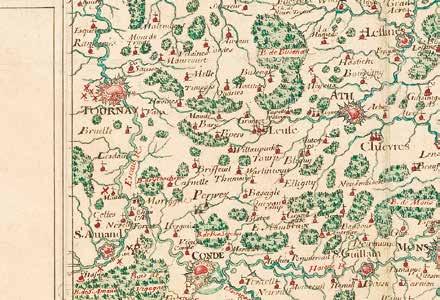
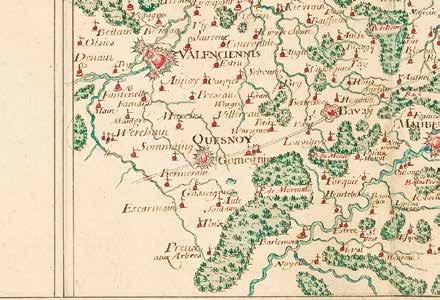
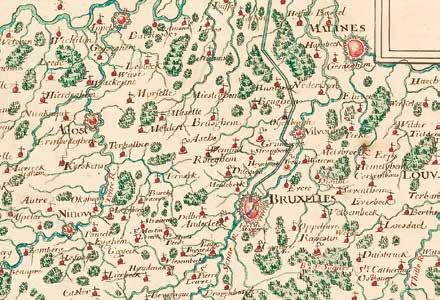
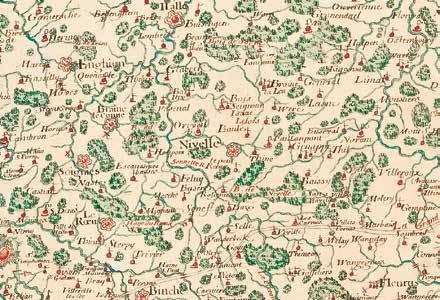
An unfinished military map for Louis XIV

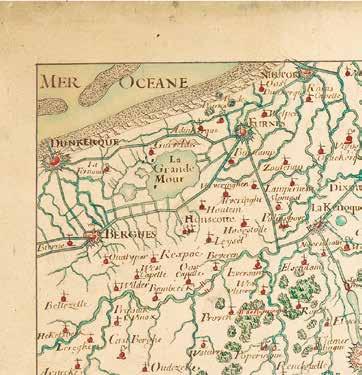
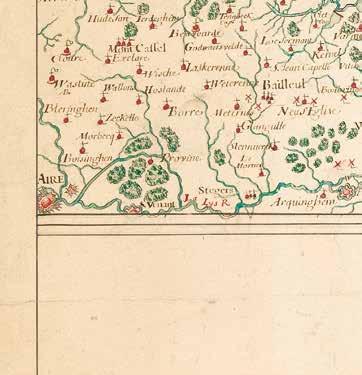
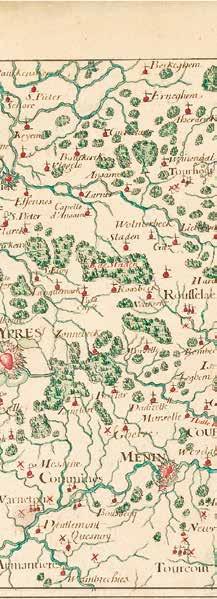
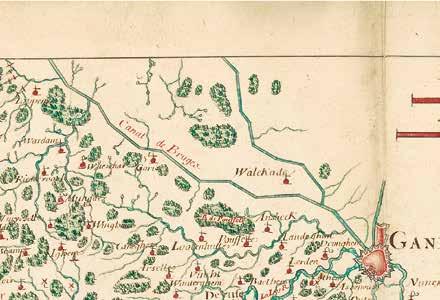
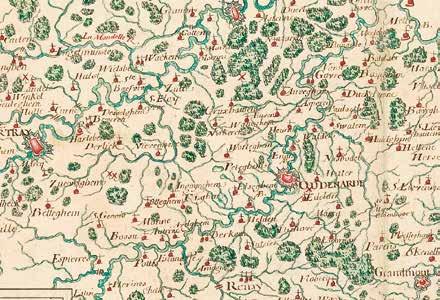
Somewhat puzzlingly, this anonymous manuscript map has not been finished. Two rectangles, in the bottom left and the upper right corner, were left blank to allow a title, legend or similar to be added, but this never happened. Is it a design for a map? Did the cartographer simply not get round to finishing it? Or was there something wrong here? There is little in the handmade map itself to suggest its purpose other than the area it depicts between Dunkirk, Ghent, Dinant, Namur, Leuven and Brussels. Following some detective work, it was found to be an unfinished version of a map included in a series of military atlases from the years 1694-1703 entitled Camps et ordres de marches de l’armée du Roy

The atlases were created by an engineer and cartographer called ‘Pennier’. Employed by King Louis XIV, he followed the French army on its campaign in the Southern Netherlands, surveying and mapping the territory for military ends. The map in question is found in the volume for 1692, where it is titled: ‘Camps and marching orders of the Royal Army in Flanders commanded by my lord Marshal the Duke of Luxembourg in the year 1692. Recorded at the locations and drawn by Mr Pennier, Engineer and Geographer to the King.’ Copies of this series of atlases can be found in the Bibliothèque Nationale in Paris and the Royal Library in Brussels.

The maps offer an account of the course of the campaign. Accompanying texts provide further explanation of the symbols, such as the red crosses representing defensive features. Small plans of the defences have also been added to the larger fortified towns (such as Tournay or Tournai). Camps et ordres de marches is the first map in this volume of the atlas and served as an overview of the military advance. It is unusual for a preparatory design to have survived, and it offers an insight into the process by which the maps were made. This version simply provides the geographical basis, in which we make out the outlines of each town’s defences. In the final, completed version, troop positions and lines of advance were drawn in and coloured. The empty frames are filled there with text describing the course of the campaign, with the dates in chronological order. Military maps like this contained sensitive information and were not intended for wider distribution, which is why they were also done by hand and are so particularly rare. Pennier made just a few copies, for the king himself and certain advisers, but no more. It was important, after all, that they did not fall into enemy hands.

Pennier Manuscript map of Louis XIV’s campaign in Flanders in 1692, c.1694-1703 Pen and ink, 505 × 808 mm
THE PHOEBUS FOUNDATION
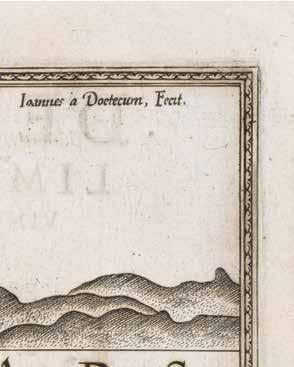
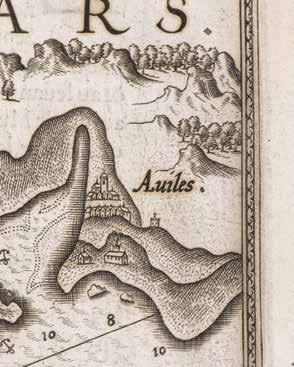
Joannes van Doetecum
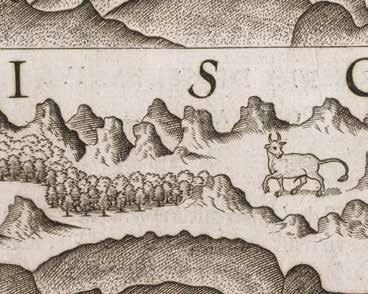
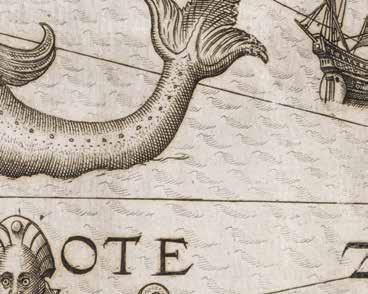
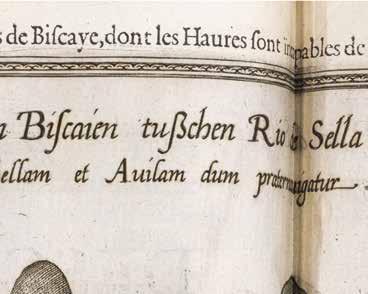
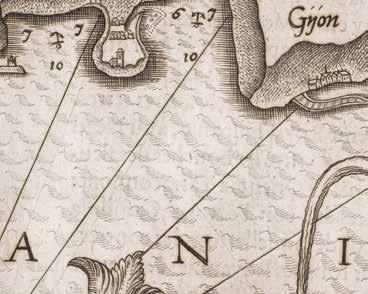
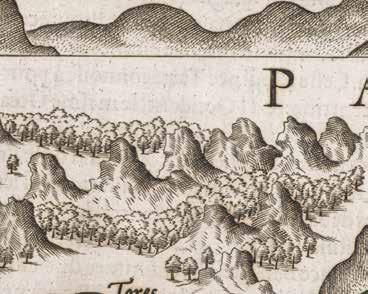
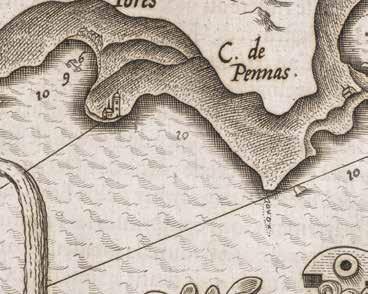
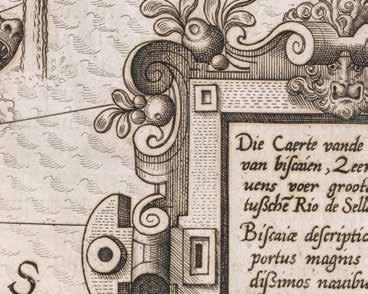
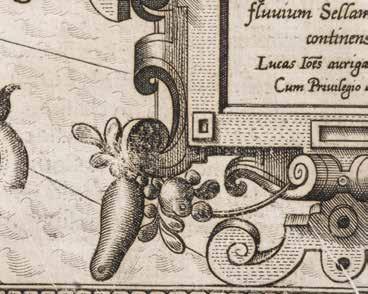
Die Caerte vande Zeekusten van Biscaien, Zeer quade havens voer groote schepen, tussche[n] Rio de Sella e[nde] Aviles
Sea chart of the Spanish coastline between Rio de Sella and Aviles
From: Lucas Jansz. Waghenaer, Miroir de la navigation, 1590
ANTWERP, THE PHOEBUS FOUNDATION
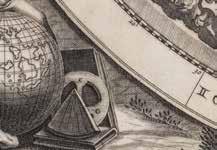
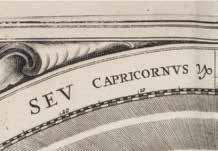
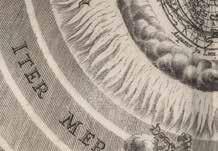
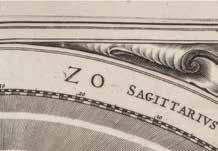
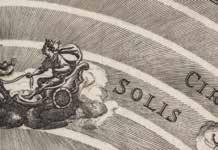
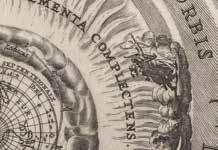
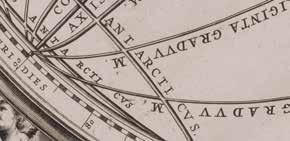
Planisphaerium Ptolemaicum, Sive Machina Orbium Mundi Ex Hypothesi Ptolemaica In Planno Disposita Celestial map of the Ptolemaic system of the universe
From: Andreas Cellarius, Harmonia Macrocosmica, 1708 ANTWERP, THE PHOEBUS FOUNDATION

LITERATURE

G. Crupi, ‘Volvelles of Knowledge. Origin and Development of an Instrument of Scientific Imagination (13th-17th Centuries)’, JLIS.it: Italian journal of library and information science, 10, 2, 2019: 1-27.

S. Schmidt & K. Nichols, Altered and Adorned: Using Renaissance Prints in Daily Life, Chicago, 2011.

K. Van Cleempoel, ‘The Production of Scientific Instruments in Louvain in the 16th Century’. In: Scientific Instruments in the Sixteenth Century: The Spanish Court and the Louvain School, Madrid, 1997-1998: 59-74.

K. Van Cleempoel, A Catalogue Raisonné of Scientific Instruments from the Louvain School: 1530 to 1600, Turnhout, 2002.

R.H. van Gent, ‘De hemelatlas van Andreas Cellarius: Het meesterwerk van een vergeten Hollandse kosmograaf’, Caert-Thresoor, 19, 1, 2000: 9-25.

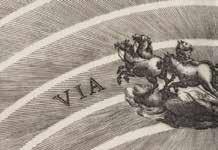
Situs Terrae Circulis Coelestibus Circundatae Celestial map of the Ptolemaic system of the universe on which the earth is visible

From: Andreas Cellarius, Harmonia Macrocosmica, 1708 ANTWERP, THE PHOEBUS FOUNDATION

R.H. van Gent, Andreas Cellarius: Harmonia Macrocosmica, The Finest Atlas of the Heavens / Der prächtigste Himmelsatlas / L’atlas céleste le plus admirable, Cologne, 2006.

S. Vanden Broecke, ‘The Use of Visual Media in Renaissance Cosmography: the Cosmography of Peter Apian and Gemma Frisius’, Paedagogica Historica, 36, 1 (2000): 130-150.

SCIENTIFIC EDITOR

Katharina Van Cauteren

AUTHOR

Anne-Rieke van Schaik

CONTENT EDITING & COORDINATION

Leen Kelchtermans

EDITING

Wannes Wets

IMAGE RESEARCH

Séverine Lacante

Katrijn Van Bragt

TRANSLATION

Ted Alkins

COPY EDITING

Xavier De Jonge

PROJECT MANAGEMENT

Stephanie Van den bosch

GRAPHIC DESIGN

Paul Boudens

PRINTING & PHOTOENGRAVING die Keure, Bruges, Belgium

BINDING

Van Mierlo, Nijmegen, The Netherlands

PUBLISHER

Gautier Platteau

ISBN 978 94 6494 104 3 D/2024/11922/16 NUR 646

© Hannibal Books, 2024 www.hannibalbooks.be

© The Phoebus Foundation Public Benefit Foundation | Stichting van Openbaar Nut, 2024 www.phoebusfoundation.org

All rights reserved for all countries. No part of this publication may be reproduced, stored in a database and/or made public in any form or by any means, electronic, mechanical or otherwise, without the prior written permission of the publisher.

The Phoebus Foundation Public Benefit Foundation and Hannibal Books have made every effort to apply the laws on copyright to all the images that appear in this publication. Whosoever should still wish to assert copyright is requested to contact the publisher.

COVER

Pieter Van den Keere

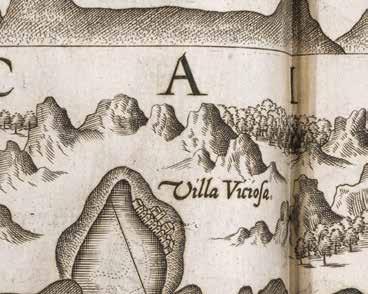
Hydrographica descriptio, in qua Hispaniae orae maritimae à Capite S. Martini usq’ad Caput Dragonis / Beschryvinge vande zeecusten van Spaengen van Cabo S. Martin tot Cabo Dragonis
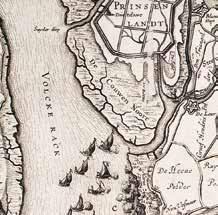
From: Willem Barentsz., Caertboeck Vande Midlandtsche Zee, 1609 & Rumold Mercator after Gerard Mercator Orbis terrae compendiosa descriptio, 1587 ANTWERP, THE PHOEBUS FOUNDATION

PICTURE CREDITS

p. 81 © Museum de Lakenhal, Leiden pp. 98-99 © Rijksmuseum Amsterdam p. 279 © Allard Pierson UvA, Amsterdam

All other images © The Phoebus Foundation

The Foundation would like to thank all the institutions and photographers who have provided visual material, especially Adri Verburg and Michel Wuyts.

WITH THE SUPPORT OF COMPANIES IN THE KATOEN NATIE AND INDAVER GROUP

Turn static files into dynamic content formats.

Create a flipbook
Issuu converts static files into: digital portfolios, online yearbooks, online catalogs, digital photo albums and more. Sign up and create your flipbook.