

Chapter 3 Modeling of Physical Processes
Problem 3.1: Ground Level
Determine the solutions to the following problems.
Solution
All these cases have zero forcing functions, thus they all remain in equilibrium.
a) ���� = 0
b) ���� = 0
c) ���� = 0
d) ���� = 0
Problem 3.2: Mathematical Models
Consider the following systems of equations. In each case identify if the mathematical model is formulated properly in order to allow for the possibility of a unique solution. If the system is not properly formulated, what additions or changes are necessary?
a
b
Solution
a Requires an initial condition ���� = ����0 ,
b Too many initial conditions. Remove ���� = ����1 , ���� = ����1
c Requires a second initial condition �������� �������� = ����0 , ���� = 0
d Remove ���� = ����1 , ���� = ����1
Requires a second initial condition �������� �������� = ����0 , ���� = 0
e Requires a boundary condition at x=L. Requires an initial condition.
f Requires a boundary condition at x=L
Over specified at x+L. Remove one of the conditions.
Problem 3.3: Coupled Mass-Spring-Dampers
Consider the following system with two sets of mass-spring-dampers. A force f1 is applied directly to mass-1 while a force f2 is applied to mass-2. The spring constants are k1 and k2, and the damping coefficients are b1 and b2. The equilibrium positions with f1=f2=0 correspond to x1=x2=0.
Derive the complete mathematical model of this system.
Solution
Draw free body diagrams of the two masses and apply Newton’s 2nd law.

Equation of Motion for Mass-1
Equation of Motion for Mass-2
Problem 3.4: A Series of Spring-Mass-Dampers
A series of coupled mass-spring-dampers consisting of n-masses in series are connected by springs and dampers. The masses m (kg) are identical, the springs are identical with spring constant k (N/m), and the dampers are identical with damping coefficient b (N m/s).
The initial conditions are
Each mass has an individual external force applied, �������� (����). The displacements are measured from static equilibrium with no applied forces. Derive the mathematical model of the system for the displacements xi, for i =1 to n
Solution
Using free body diagrams for mass-1, general mass-i, and mass–n, we get the following coupled set of ODEs.
Problem 3.5: Mathematical Model of a Vibrating String
Consider the motion of an elastic string.
u(x,t) = transverse displacement (m), T = tension (N), ρ = density (kg/m3), Ac = cross-sectional area (m2), F(x,t) = distributed load (N/m)
Assumptions
1. The motion takes place entirely in one plane, and in this plane each particle moves at right angles to the equilibrium position of the string.
2. The deflection of the string during the motion is so small that the resulting change in length of the string has no effect on the tension T
3. The string is perfectly flexible, i.e., can transmit force only in the direction of its length.
4. The slope of the deflection curve is small so that sinθ can be replaced with tanθ , where θ is the inclination angle of the tangent to the deflection curve.
Objectives
a) Derive the equation governing the transverse displacement of the string, u(x,t).
b) State the complete mathematical formulation of the equations necessary to determine the motion of the string.
c) For the special case where the distributed load is zero, F = 0, and the string is initial in equilibrium (the initial displace and velocity is zero), determine the solution u(x,t) for the displacement of the string.
d) What is the relationship between this mathematical model and the series of discrete springmass-dampers in Problem 3.4?
Solution
a) Equation of Motion
Consider a differential length ∆x.

Apply Newton’s law in the transverse direction.
Force due to Tension
Use the small angle approximation
The net force due to tension becomes
Force due to Damping
The force due to friction is proportional to the speed at which the element is moving, and acts in a direction opposite to the motion of the element, thus
where b is the damping coefficient per length.
Applied Force
The applied force is modeled in terms of a force per unit length along the string, thus
The applied force can be spatial and time dependent, as would be the case for the playing of a musical instrument. Substitute these force terms into Newton’s law and cancel ∆����
Divide by ������������ to get the standard form of the wave equation.
b) Mathematical Model
Equation
c) Zero Forcing Functions
A physical response is due to some combination of volumetric forces, surface interactions, and initial disturbances. If all of these are identically zero, the system must to at rest in equilibrium. Thus, the only possible solution is u =0. This intuitive answer can be checked by substituting back into the mathematical formulation (equation of motion, BC’s, and IC’s).
Problem 3.6: 2-D, 1-D, 0-D Mathematical Models
Consider transient heat transfer in a 2-D region (no temperature gradients in the z-direction), initially at temperature T0, with the boundary conditions shown.

a) Formulate the equations governing the temperature distribution, T(x,y,t).
b) Assuming that temperature gradients are negligible in the x-direction, formulate the equations governing the temperature distribution.
c) Assuming that temperature gradients are negligible in the y-direction, formulate the equations governing the temperature distribution.
d) Assuming that temperature gradients are negligible in all directions (lumped capacity approximation), formulate the equations governing the temperature distribution. For this lumped capacity model, determine the steady state temperature if qs” and g are constant.
Solution
(a) 2D Model
(b) 1D Model: y-Direction Only
(c) 1D Model: x-Direction Only
(d) 0-D Model (Lumped Capacity Approximation)
Problem 3.6 Appendices
Appendix (a): 2D Model
Our Control Volume (CV) is a differential section in both x and y of size ∆x-by-∆ y. The zdimension can be taken as unity since no changes occur in z.
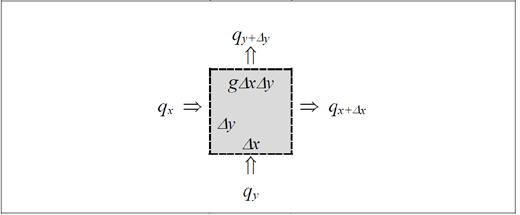
Apply conservation of energy to the control volume shown.
Use Fourier’s Law
Appendix (b): 1D Model, y-Direction Only
Our Control Volume (CV) is a differential section in y, ∆ y-by- Lx. The z-dimension can be taken as unity since no changes occur in z.
Apply conservation of energy to the control volume shown.
Use Fourier’s Law
Divide by ��������
Divide by ��������
Here g must represent the average value of g(x,y,t) over the entire x-direction.
The energy equation can be derived directly from an energy balance on the CV ∆y-by- Lx or by integrating the 2-D energy equation from x = 0 to Lx.
Appendix (c): 1D Model: x-Direction Only
Our Control Volume (CV) is a differential section in x, ∆x-by-Ly. The z-dimension can be taken as unity since no changes occur in z.
Apply conservation of energy to the control volume.
Use Fourier’s Law
Divide by
Divide by ��������
Here g(x,t) must represent the average value of g(x,y,t) over the entire y-direction.
= 1
,
)��������
Similarly, qs”(t) represent the average value of qs”(y,t) over the entire y-direction.
Appendix (d): 0-D Model (Lumped Capacity Approximation)
The energy equation can be derived a number of ways:
• directly from an energy balance on the CV of dimensions Lx-by-Ly
• integrating the 2-D energy equation from x = 0 to Lx and from y = 0 to Ly
• integrating the 1-D energy equation from x = 0 to Lx
Let’s choose a Control Volume (CV) of the entire domain, Lx-by-Ly
Apply conservation of energy to the control volume.
Divide by ��������
Divide by ��������
Here g(t) must represent the average value of g
Similarly, qs”(t) represent the average value of qs”(y,t) over the entire y-direction.
Chapter 4 Calculus
Problem 4.1
Determine and plot the derivative of the step function,
Problem 4.2
Determine and plot the derivative of the ramp function, Ramp(t).
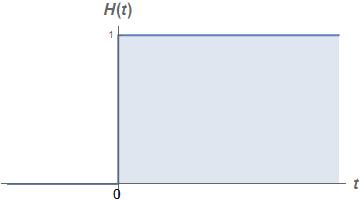
Problem 4.3
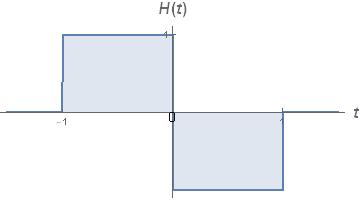
Determine and plot the derivative of the pulse function.
Problem 4.4
Determine and plot the derivative of the triangle function.
Problem 4.5
Consider the function ����(���� ) shown.
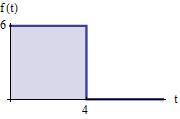
Evaluate and sketch the following integrals, I(t).
a) ���� (����) = ∫ ���� (�������� )������������ 3 �������� =0
Solution
���� (
) = � 6���� , ���� < 4 24 , ���� ≥ 4
The integrand is a two-part function; thus the integral is best evaluated in the corresponding twoparts.
Problem 4.6
Consider the pulse function f(t) shown.

Evaluate and sketch the following integrals. Note that the independent variable t can be less than t1 or greater than t1. Since the integrand ���� (���� ) is a two-part function, the integral I(t) is best evaluated as a two-part function.
a)
Solution
(a) The integrand is defined in two distinct parts, thus think of the integral that way.
(b) Again consider the integral in two parts since ���� (����) is two distinct parts.

Problem 4.7: Pulse Integral
Consider the pulse function S(t).

a) Determine the symbolic solution and plot the function ����1 (����) = ∫ ����(�������� )������������ ���� �������� =0 . Examine the limit as ∆t→ 0.
b) Determine the symbolic solution and sketch the function ����2 (
Examine the limit as ∆t→0.
=
c) Evaluate the function F2 from part (b) using numerical integration. Use t1 = 2, ∆
Plot both the analytical solution and numerical solution on the same graph.
Solution
The integrand is defined in 3 distinct parts, thus evaluate the integral that way. (a)
=1, and τ=1.
.
Here H(t) is the unit step function.

In the limit as
(b)

Note the limit as ∆t becomes small.
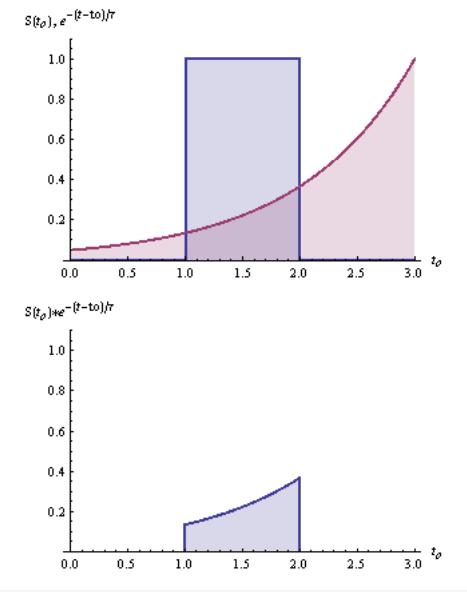
The integrand for part (b) is shown for ���� > ����1 + ∆����.

(c): Numerical Integration
The solution using numerical integration is indistinguishable from the previous analytical solution. The difference between the analytical solution and the numerical solution using “NIntegrate” in Mathematica is shown. The difference is about the round off error using 64 bit arithmetic, as expected.

Problem 4.8
Consider the function f(t) shown.
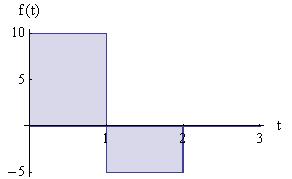
Determine an expression for the integral ���� (����) = ∫ ���� (�������� )������������ ���� �������� =0 over the entire range 0 ≤ t ≤ 3.
Solution
Problem 4.9
What are the units of the following expressions? In all cases, t is in seconds(s) and x is in meters(m).
a) ���� (����)
b) ���� (
)���� (����)
c) H(t) = Step function
d) Ramp(x) = Ramp function
Solution
a) 1 ����
b)
c) Dimensionless
d) x
Problem 4.10
Evaluate the following integrals. H is the step function and ���� (���� ) is the delta function.
a)
b)
c)
Solution a) 2; (b) 0; (c) 1; (d) 0 (e) ����(2) (f) 0
Problem 4.11
Evaluate the following integrals symbolically. Also sketch the function I(x), clearly showing the locations x=a and x=b
a)
b)
d)
Solution
a) Assume a < b
is the function determined in part (d).
Problem 4.12
The
Solution
Using Leibnitz Rule. We can deduce the following
Problem 4.13: Convolution Integral
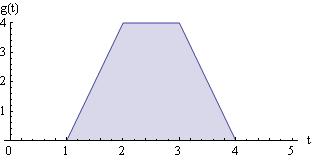
Two functions ���� (���� )and ℎ(���� )are shown in the figure.

A third function ����(���� ) is related to the two functions plotted above using the following integral.
(����) =
)��������
This integral is the well-known convolution integral, used to determine how a signal ���� (����) will be filtered by a system’s impulse response ℎ(����).
a) Determine the function ����(����) for all values of t
b) Plot the function ����(����).
Hint: This integral is best undertaken by breaking the functions up into sections.
Solution
By varying t, one can think of “dragging” the function ���� (���� ����) across the stationary function ℎ(����). As visualized, there are 5 time ranges with different behavior.

Problem 4.14
Why do we even need numerical integration? Why not simply evaluate all integrals in an exact, symbolic form?
Solution
Because many integrals cannot be evaluated analytically.
Problem 4.15: Basics of Numerical Integration
Consider the integral ���� = ∫ (1 ���� 2���� )�������� 4 ����=0 . Evaluate this integral using the methods listed.
Exact 0
Trapezoid, n=1
Trapezoid, n=2
Trapezoid, n=4
Simpson’s 1/3, n=2
Simpson’s 1/3, n=4
Simpson’s 3/8, n=3 Solution
For a = 0 and b = 4, the integral evaluates to ���� = 3.5002
Simp 1/3, n=2 3.284 6.17
Simp 1/3, n=4 3.471 0.84
Simp 3/8, n=3 3.388 3.19
The accuracy of the trapezoid rule is of the order h2 while Simpson’s 1/3 is of the order h4. The accuracy versus n is shown in the following graphics.
Problem 4.16: Erf
a) Use the trapezoid rule to evaluate erf(1) for a sequence of increasing n (decreasing h ): ���� = 2���� for p = 1 to 8.
b) Determine the n required to get an absolute error less than 10-7.
Solution
a)
b)
Iexact = 0.8427007929
Iapprox = 0.8427006930
Required number of panels = 832
Required panel size, h = 0.00120192
Problem 4.17: Distance from Velocity Data
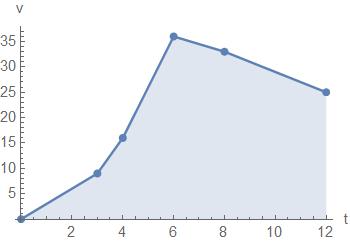
The following velocity versus time data is available:
Estimate the distance traveled using the trapezoid rule with:
a) n = 1 (one trapezoid) b) n = 2 (two trapezoids) c) all the available data Make sketches of the data and the various approximations.
Solution
(a) ���� = (12 0) �0+25 2 � = 150 ����
(b) ���� = (6) �0+36 2 � + (6) �36+25 2 � = 291 ����
(c) ���� = ∑ ℎ���� �������� 1 +�������� 2 ���� ����=1 = 263 ����
The data plot using all the data is shown.
Problem 4.18: Ellipse
The perimeter P of an ellipse is given by ���� = 4����
�������� where a = major axis, b= minor axis, and ���� = √����2 + ���� 2 /���� . Write a function that calculates the perimeter of an ellipse. The input arguments should be a and b and the output argument should be P. Use your function to calculate the perimeter of the following ellipses.
Solution
*** circular limit ***
a = 1.0 , b = 1.0
P = 6.3
*** Case a ***
a = 5.0 , b = 2.0
P = 23.0
*** Case b ***
a = 7.0 , b = 4.0
P = 35.2
*** Case c ***
a =100.0 , b = 2.0
P = 400.4
Note that the circular limit gives the well-known and correct result. Also, the long ellipse limit gives the expected result of P ≅ 4 a.
Problem 4.19
Consider the function F(x) shown.
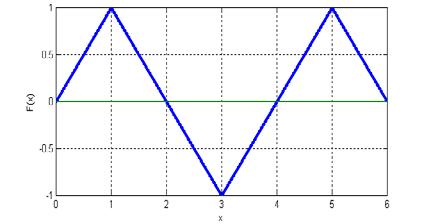
We wish to compute the integral ���� = ∫ ���� (���� )�������� 6 0 .
a) Compute the exact value of the integral.
b) Approximate the integral with the trapezoid rule using 1, 2, 3, 6, and 106 trapezoids.
c) Approximate the integral with the Simpson’s 1/3 rule using 1 and 2 panels (2 and 4 segments).
Solution
a) ���� = 1
b)
Problem 4.20: Football
To estimate the surface area of a football, the diameter of the ball is measured at different points along the ball.


The surface area can be determined from
a) Use the composite trapezoid rule with the given data to estimate the surface area of the ball.
b) Use the composite Simpson’s rule with the given data to estimate the surface area of the ball.
Solution
a) We have n = 5 data points, thus 4 trapezoids. Equation (4.67) gives
b) Equation (4.79) gives
Problem 4.21: Sailboat
A cross section of a racing sailboat is shown.

H is the height of the mast and W is the distance to support cable attachment. Wind forces exerted per length of mast, ���� (����) (lb/ft), vary as a function of distance above the deck, z (ft). A good approximation of the wind force per length of mast is
(����) = 200
Assume that the right support cable is completely slack and the mast joins the deck in a manner that transmits horizontal and vertical forces but no moments. The total force, F (lb), exerted by the wind on the mast is
Write a function that computes the total force, F (lb), and the tension in the left mast support cable, T (lb) as function of H (ft) and W (ft). To compute T, sum the moments about the base of the mast. The moment caused by the variable wind force is ���� = ∫ ���� ���� (����) �������� ���� 0 . Next write a separate file to explore the system parameters. For H =30 ft and W = 3 ft, compute F and T. Also plot F and T versus H in the range 10 ft < H <40 ft while keeping W = 3 ft.
Solution
Height, H = 30.0 ft
Width, W = 3.0 ft
Total force, F = 1480.6 lb
Cable tension, T = 6474.4 lb
The following plots of ���� (����)and �������� (����)show that these numerical results are at least approximately correct. The graph of ����(����)shows an average height of about 45 or 50 lb/ft. Thus the force should be approximately F ≈ (45)(25) = 1250 lb.
Problem 4.22: Force on a Dam
Water exerts pressure on the upstream face of a dam. The pressure increases linearly with depth and can be characterized by ����(����) = ��������(���� ����) where ����(����)is pressure in N/m2 exerted at an elevation z meters above the reservoir bottom; ρ is density of water, which for this problem is assumed to be a constant 103 kg/m3; ���� is acceleration due to gravity (9.81 m/s2); and D is elevation (in m) of the water surface above the reservoir bottom. Omitting atmospheric pressure (because it works against both sides of the dam face and essentially cancels out), the total force �������� can be determined by multiplying pressure times the area of the dam face. Because both pressure and area vary with elevation, the total force is obtained by evaluating
where w(z) is width of the dam face (m) at elevation z. The line of action can also be obtained by evaluating
The following table contains data of stream width at various elevations.
z (m)
Write a function that accepts vectors containing the z locations and the corresponding w values on the dam face. The function should perform numerical integration using the trapezoid rule for discrete data and return the values �������� and d. Test your function using the specific data given.
Solution
Total Force = 2.52706e+009 N
Line of Action = 21.43 m
Problem 4.23: Wind Force
A wind force distributed against the side of a skyscraper is measured as
Compute the net force and line of action due to this distributed wind. The total force F exerted on the mast is:
The line of action can also be determined by integration:
Total force = 526200 N
Line of action = 158.6 m
Comments
By visually estimating the area under the curve from the graphs, it is clear that the numerical results are of the correct order of magnitude.
Problem 4.24: Blackbody Radiation Function and Emissivity
The thermal radiation emitted from an object is a function of its absolute temperature. A blackbody emitter is an ideal surface that emits radiation uniformly in all directions and absorbs all radiation incident on its surface. The variation of the emissive power as a function of wavelength for a blackbody emitter is described by the Planck distribution ��������,���� = ����1
b E ,λ = emissive power (W/m2/µm), λ = wavelength (µm), T = absolute temperature (K)
c1 = 3.7418 × 10⁸ W*µm4/m2, c2 = 1.4388 × 104 µm*K
The fraction of energy emitted in the wavelength band 0 ≤ ���� ≤ ����∗ is
σ =Stefan-Boltzmann constant = 5.6696 × 10⁻⁸ W/m2 K4
The integrand that defines F0→λ *depends on the product λT, not on λ and T separately.
(a) Plot ��������,���� vs λ on both a linear scale and on the classical log-log scale. On each graph, plot various values of T from 50K to 5800K (surface of the sun).
(b) Create a function to evaluate the ����0→����∗ as a function of the product λT. Please use this function throughout the remainder of this problem.
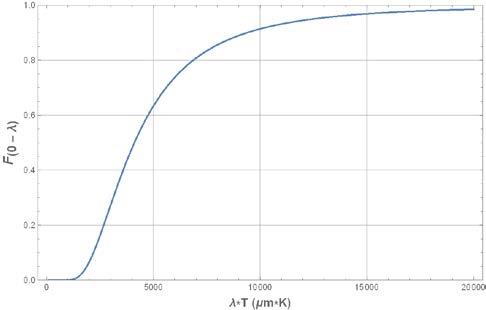
(c) Plot ����0→����∗ in the range λT = 0 to 20000 µm K.
(d) The range of visible light for a typical human is 0.4 to 0.7 µm. Determine the fraction of solar radiation in the visible range assuming the sun as a blackbody at 5800K.
(e) Emissivity is defined as the actual amount of radiation emitted by a real surface divided by the radiation that a blackbody would emit at the same temperature.
emissivity
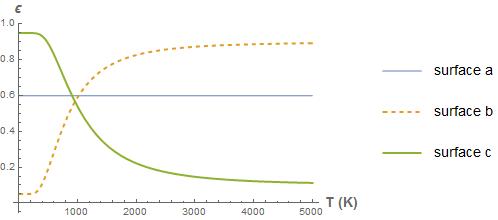
Consider surfaces with the following spectral variations of emissivity. For each case, plot the total emissivity as a function of temperature in the range T = 0 K to 5000 K.
For more details on thermal radiation, refer to Introduction to Heat and Mass Transfer, 7th Ed. by Bergman, Lavine, Incropera and Dewitt, Chapter 12 with particular emphasis on Sections 12.412.6.
(a) Planck Distribution
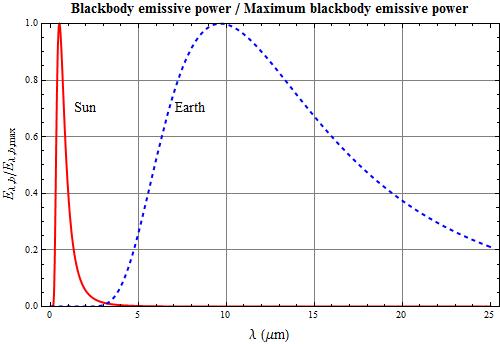
On a linear scale, only the highest temperature curve is visible due to the order of magnitude differences in the values. Thus, the log-log graph is always shown. Another interesting graph is shown. It helps in understanding the greenhouse effect.
(b) Blackbody Radiation Function
This integral cannot be evaluated analytically and thus must be evaluated numerically.
(c) Blackbody Radiation Function
(d) Fraction in the Visible Spectrum
Our function is used to analyze spectral distributions. The fraction of sunlight (T = 5800 K) in the visible spectrum (λ = 0.4 to 0.7) is
(e)TotalEmissivity
Problem 4.25: Pipe Flow
The volume flow rate of a fluid flowing in a round pipe of radius r0 is
The velocity can be approximated by

a) Create a function to compute Q as a function of r0. Evaluate the integral numerically.
b) Use your function to plot Q versus r0 in the range 0 < ����0 < 6 cm.
Chapter 5 Linear Algebra
Problem 5.1: Linear Algebra Basics
Consider the special cases of the systems of equations Ax = b listed. For all cases:
a) Determine the rank of the coefficient matrix, A
b) Determine the rank of the augmented matrix, ���� � = [����, ����]
c) Determine if the system consistent?
d) For each consistent system, give the solution.
For cases (a)-(f), sketch the row and column interpretation. Summarize these sketches in a table.
Problem 5.2: Equation of a Plane
Consider the equation of a plane written as ����1 ���� + ����2 ���� + ����3 = ����.
a) Given three known points (����1 , ����1 , ����1 ), (����2 , ����2 , ����2 ), and (����3 , ����3 , ����3 ), derive the system of equations that determine c1, c2, and c3.
b) Write a function ‘eq_plane’ that determines the vector of coefficients ���� = [����1 , ����2 , ����3 ] given any three points.
c) Test your function by finding the equation passing through the points (1,0,0), (0,1,0), (0,0,1). What are the z values at (x,y) = (0, 0.5), (0.5, 0), (0.25, 0.25), and (0.5, 0.5)? Plot this plane.
Solution
(a) The three points must all satisfy the equation of the plane:
This gives 3 equations for the 3 ci values. In matrix form:
(c) c = -1 -1 1
z1 = 0.5000
z2 = 0.5000
z3 = 0.5000
z4 = 0
Problem 5.3: Pits
A civil engineer involved in a construction process requires a volume Vs of sand, a volume Vfg of fine gravel, and a volume Vcg of course gravel. There are three pits from which these materials can be obtained. The composition of these pits is
Sand Fraction Fine Gravel Fraction Course Gravel Fraction
Pit 1 S1 FG1
Pit 2 S2 FG2
Pit 3 S3 FG3
a) Develop the equations needed to determine the volumes V1, V2, and V3 that must be hauled from pits 1, 2, and 3 to exactly meet the construction needs. Put in matrix form.
b) For the following special case, solve for the volumes V1, V2, and V3.
Sand Fraction Fine Gravel Fraction Course Gravel Fraction
Pit 1 1 0 0.25
Pit 2 0 1 0.25
Pit 3 0 0 0.5
Vs = 5000 m3 , Vfg = 5000 m3 , Vcg = 10000 m3
b) Solving simultaneously gives
Problem 5.4 Heated Rod
Consider a heated rod with convection from the sides.

a) Write a function to solve for the temperature along the rod for n equally spaced nodes. The function should accept n, L, T0, TL, h’, and Ta as inputs and output the vectors of the x locations and the computed temperatures. Here L is the rod length and TL is the temperature at x = L (T5=200 in the example).
b) Write a separate code to compute and plot the following cases:
1. n = 6, L = 1, T0 = 40, TL = 100, h’=0.01, Ta = 20
2. n = 10, L = 1, T0 = 100, TL = 0, h’=0, Ta = 100
3. n = 100, L = 1, T0 = 100, TL = 100, h’=0, 10, and 100, Ta = 10 (single graph with 3 curves for the 3 h’ values)
Solution
Case 1
Case 2: h = 0
Case 3: Effect of h’
Problem 5.5: Stage Extraction Process
A stage extraction process is depicted.

In such systems, a stream containing a weight fraction yin of a chemical enters at a mass flow rate F1. Simultaneously, a solvent carrying a weight fraction xin of the same chemical enters from the other side at a flow rate F2. A mass balance at a typical interior stage can be represented as ����1 �������� 1 + ����2 �������� +1 = ����1 �������� + ����21 �������� , ���� = 2,3, … , ���� 1
This mass balance must be modified at the first and last stage. At each stage equilibrium is assumed to be established between xi and yi as ���� = ��������
where K is a distribution coefficient.
a) Draw a cause-effect diagram
b) Write a function to solve for the concentrations along the stage extractor with n stages.
c) Write a separate function to compute and plot the concentrations and determine yout and xout for the case F1 = 500 kg/h, yin = 0.1, F2=1000 kg/h, xin = 0, and K = 4.
Solution
a) A cause-effect diagram is
Note that yout = yn and xout =K y1. Also, F1 and F2 could be viewed as forcing functions rather than system parameters.
b) After using �������� = Ky ���� , the mass balance at a typical interior stage is
The mass balances at the inlet and exit are
This produces a simultaneous set of n linear algebraic equations for the unknown concentrations.
yout = 2.6703e-006
xout = 0.049999
The weight fractions are plotted on both a linear-linear scale and on a log-linear scale.
Comments
If the purpose of this device is to remove some chemical from fluid stream 1, the device seems to be a great success.
Problem 5.6: Pentadiagonal Solver
A pentadiagonal system of equations is a special system with a bandwidth of 5. An n-by-n pentadiagonal system has the following form:
a) Write a flowchart or pseudocode describing the logic required to solve this special system of equations. Only the diagonals and RHS should be input. Do not form a full matrix or perform a full matrix solution.
b) Write a function to solve this pentadiagonal system.
c) Test your function with the following special cases. Case 1:
Case 2: di’s = -1, ei’s = -3,
Try n = 10000 and 100000. Please plot your solutions rather than print out all these numbers. For comparison, you should try to solve this problem using the standard full matrix solver: x = A\b.
Solution
Pentadiagonal Matrix Algorithm
It might help to visualize this system of equations by using a table with gridlines.
Note that n is the number of equations and i is a dummy index. After the forward elimination of the d and e vectors, we are left with the following.
The vectors e and f have been eliminated and the vectors f, g, h, and r have been changed. We can now back substitute.
The pentadiagonal solver had no problem with 10000 or 100000 equations. The full matrix solver using the left-divide crashed the computer for 10000 equations.
Problem 5.7
Consider the cooling of an integrated circuit package from Section 5.3.1. The purpose of this exercise is to write a function to solve for the unknown heat flows and temperatures and test this function. You are requested to:
a) Write a function called ‘CoolingIC’ that computes the heat flow rates and temperatures in the IC package. The inputs should be: R = vector containing the 5 thermal resistance values, Ta = ambient temperature, and Qc = power dissipated. The function returns two vectors: T = a vector containing the 3 unknown temperatures. Q = a vector containing the 4 unknown heat flow rates
b) Test your ‘CoolingIC’ function. This function assigns the input values, calls on ‘CoolingIC’ to compute the T and Q vectors, and displays the output. Consider the following test cases.
Solution
Case 1
Inputs
Ta = 25.0 degC
Qc = 0.00 W
R1 = 2.00 degC/W
R2 = 2.00 degC/W
R3 = 2.00 degC/W
R4 = 2.00 degC/W
R5 = 2.00 degC/W
Outputs
Tc = 25.0 degC
Tp = 25.0 degC
Tw = 25.0 degC
Q1 = 0.00 W
Q2 = 0.00 W
Q3 = 0.00 W
Q4 = 0.00 W
Observations:
Case 2
Inputs
Ta = 25.0 degC
Qc =10.00 W
R1 = 2.00 degC/W
R2 = 2.00 degC/W
R3 = 2.00 degC/W
R4 = 2.00 degC/W
R5 = 2.00 degC/W
Outputs
Tc = 37.5 degC
Tp = 30.0 degC
Tw = 27.5 degC
Q1 = 3.75 W
Q2 = 1.25 W
Q3 = 6.25 W
Q4 = 2.50 W
Case 3
Inputs
Ta = 25.0 degC
Qc =10.00 W
R1 = 2.00 degC/W
R2 = 0.50 degC/W
R3 =35.00 degC/W
R4 = 0.70 degC/W
R5 = 1.00 degC/W
Outputs
Tc = 48.1 degC
Tp = 29.5 degC
Tw = 28.0 degC
Q1 = 9.34 W
Q2 = 2.97 W
Q3 = 0.66 W
Q4 = 6.37 W
Case 4
Inputs
Ta = 25.0 degC
Qc =10.00 W
R1 =1000. degC/W
R2 = 0.50 degC/W
R3 =35.00 degC/W
R4 = 0.70 degC/W
R5 = 1.00 degC/W
Outputs
Tc =363.2 degC
Tp = 25.2 degC
Tw = 25.1 degC
Q1 = 0.34 W
Q2 = 0.11 W
Q3 = 9.66 W
Q4 = 0.23 W
• Case 1: zero input (Qc = 0) produces zero output (Q’s = 0, T’s = Ta)
• Case 4: when R1 is large (chip not attached well to the plate), the only cooling mechanism is to the air and the chip overheats
Problem 5.8: Cooling of an IC Package, Parameter Study
We will now use the function developed in the previously problem to perform a parameter study on the cooling arrangement of the IC system. The most important engineering result of this analysis is the chip temperature, Tc. This is particularly crucial since electronic chips can fail if overheated. The cooling arrangement must maintain the chip temperature below a critical failure temperature, Tcrit. As electrical circuits become smaller and draw more power, overheating becomes a limiting constraint in their design. The purpose of this exercise is to perform the following parameter studies.
a) Study of chip temperature as a function of power. Create a plot of Tc vs Qc with Qc ranging from 0 to 100 W. On a single graph, put curves for R4 = R5 = 0, 2, 4, 6 °C/W. Take other parameter values from Case 3 in the previous problem. What can you conclude about Tc vs Qc? If Tcrit = 150°C, what is the maximum allowable chip power, Qc, for each case.
b) Study of chip temperature as a function air flow (R4 and R5). The resistances R4 and R5 represent the effect of the air cooling; a high resistance corresponds to low air velocity and low resistance corresponds to high air velocity. Assume R4 = R5 and create a plot of Tc vs R4 with R4 = R5 ranging from 0 (hurricane) to 100 °C/W (stagnant air). On a single graph, put curves for Qc = 0, 5, 10, 15 W. Take other parameter values from Case 3 in the previous problem. If Tcrit = 150°C, what is the allowable range of resistance values for Qc = 10 W.
You should write a function to perform these studies. This function should call on the previously developed function from Problem 5.7.
For Qc = 10 W, the allowable range of R4=R5 is 0 to 34.6 degC/W.
Problem 5.9: Voltage Range
Consider the circuit shown in the figure.
a) If all resistance and voltage values are considered known, derive the equations necessary to determine the 5 unknown currents.
b) Compute the values of the currents given the following values of the resistances and the voltages;
R1 = 5 kΩ, R2 = 100 kΩ , R3 = 200 kΩ , R4 = 150 kΩ , R5 = 250 kΩ v1 = 100 volts, v2 = 100 volts
c) Suppose that each resistor is rated to carry a current of no more than 1 milliampere (=0.001 amperes). Determine the allowable range of positive values for the voltage v2. Use the resistances and v1 values from part b.
d) Suppose we want to investigate how the resistance R3 limits the allowable range for v2. Obtain a plot of the allowable limits on v2 as a function of R3 for 150 < R3 < 250 kΩ.
Solution
a) Using Kirchhoff’s voltage and current laws, the equations describing the circuit shown in the figure are:
In matrix form,
c)
Resistance, R(3) = 200 Ohm
Applied voltage, v1 = 100 V
Maximum Current, imax = 0.0010 A
Minimum required voltage, v2 = 32 V i(amps) imax-abs(i)(amps)
0.00100 0.00000
0.00037 0.00063
0.00013 0.00087
0.00063 0.00037
0.00023 0.00077
Maximum allowable voltage, v2 = 343 V i(amps) imax-abs(i)(amps)
0.00022 0.00078
-0.00043 0.00057
-0.00100 -0.00000
0.00066 0.00034
0.00057 0.00043
The allowable voltage range is 32 to 343 Volts.
Part (d)

Problem 5.10: Equilibrium Position of a System of Linear Springs and Masses
Consider the system of masses and linear springs. The total length of each spring is equal to the unstretched length (Li) plus the stretched length (xi). The width of each block is W and the total length of the system is LT. For a linear spring, the force is directly proportional to elongation, ���������������������������� = �������� .
a) Considering all the ki, Li, and W as known, derive the mathematical model for the stretched lengths xi
b) Write a function to solve the system of equations in part (a).
c) Use the function developed in part (b) to determine the xi’s for the following cases.
Case 1
Case 2 W
m
Solution (a) Mathematical Model
matrix form
(a) Numerical Results
Case 1
Case 2
m
Chapter 6
Non-Linear Algebra: Root Finding
Problem 6.1: Graphical Root Finding
Consider the equation ���� ���� = ���� Estimate the real root of this equation in the following ways.
(a) Graphically by plotting the functions ���� ���� and x.
(b) Graphically by plotting the function ����(���� ) = ���� ���� ���� .
(c) Using three iterations of the bisection method with initial guesses xl = 0 and xu = 2.
(d) Using three iterations of the false-position method with initial guesses xl = 0 and xu = 2.
(e) Using three iterations of the Newton-Raphson method with initial guess x0 = 2.
Summarize your results for parts (c) and (d) with a table
Solution
(a) Graphical by plot of ���� ���� and x

These graphs show that the root is approximately xr ≈ 0.57
(b) Graphical by plot of ���� (���� ) = ���� ���� ����

(c) Bisection
After 3 iterations of the bisection method, our estimate of the root is xr = 0.75.
(d) False Position
After 3 iterations of the false position method, our estimate of the root is xr = 0.5687. This is quite a bit more accurate than the estimate after 3 iterations using the bisection.
(e) Newton-Raphson
Starting from x0 = 2, we get the following iterations.
The iteration is converging on the correct answer very quickly compared to the bisection or false position method.
Problem 6.2: Exploring Root Finding
Determine the positive real root of the equation ln(���� 2 ) = 0.7
(a) Graphically.
(b) Using three iterations of the bisection method, with initial guesses xl = 0.5 and xu = 2.
(c) Using three iterations of the false-position method, with initial guesses xl = 0.5 and xu = 2.
Solution

Bisection Method
False-Position Method
Problem 6.3
Consider a metal plate exposed to the sun with an insulated (no heat flow) bottom surface, as described in Section 6.2.3.
a) Determine the plate temperature, T, on a day when Gs = 900 W/m2 and h = 15 W/m2 K.
b) Compute a table of the plate temperature T for values of Gs ranging from 0 to 1200 W/m2 in increments of 100 for h = 15 W/m2 K. Make a plot of T vs. Gs
c) Compute a table of the plate temperature, T, for values of the heat transfer coefficient, h, ranging from 10 to 200 W/m2 K in increments of 10 when Gs = 900 W/m2. Make a plot of T vs. h. As h becomes extremely large, what is the plate temperature?
Solution
(a) The plate temperature is determined by an energy balance. In steady-state
When Gs = 1200 W/m2, the plate temperature is 314.7 K
(b) Effect of Solar Flux, Gs
(c) Effect of Heat Transfer Coefficient, h
As h becomes extremely large, the plate temperature approached the air temperature.
Problem 6.4
The Redlich-Kwong equation of state is given by
where R = gas constant, T = absolute temperature (K), p = absolute pressure (kPa), and v = specific volume (m3/kg). The parameters a and b are calculated by
= 0.427
= 0.0866���� �������� ��������
For methane, R = 0.518 kJ/(kgK), pc = 4580 kPa, and Tc = 191 K. As a chemical engineer, you are asked to determine the amount of methane fuel that can be held in a 3-m3 tank at a temperature of -50 degrees Celsius with a pressure of 65,000 kPa.
a) Estimate v using the graphical method.
b) Use a root locating method to calculate v and then determine the mass of methane contained in the tank.
c) Compare the Redlich-Kwong equation of state compare to the ideal gas law?
Solution
(a) Graphical Approximation
(b) Numerical Solution
v_RedKw = 0.00187 m^3/kg
v_Ideal = 0.00178 m^3/kg mass = 1602.8 kg
(c) Comparison with Ideal Gas Law
Problem 6.5: Depth of Water in a Tank
You are designing a spherical tank to hold water. The volume of liquid in the tank is
where V = volume (m3), h = depth of water in the tank (m), and R = tank radius (m).
(a) We wish to determine the required height h for given values of R and V. Derive the formula that uses the Newton-Raphson method to determine h.
(b) What is the range of h values that would physically make sense for an initial guess?
(c) Perform one iteration with your formula with parameters R = 3 m, V = 30 m3. Use an initial guess of h0 = 1 m.
Solution
(a) ���� (ℎ) = ���� ℎ2 (3���� ℎ) 3 ���� �������� ����ℎ = ���� (6
(b) 0 < ℎ < 2����
(c) ℎ1 = 2 376
Problem 6.6: Optimal Fin Spacing
Heat sinks are often attached to electronic devices to increase the cooling efficiency and thereby lower the temperature of the device. One common configuration of these heat sinks is an array of pin fins. Given the overall dimensions of a heat sink consisting of pin fins, it is desirable to know the optimal fin spacing, ���������������� . The empirical formula for the optimal spacing is
where D = diameter (m), H = height (m), Ra = Rayleigh number.
a) Write a function to compute the optimal spacing given D, H, and Ra. Include your algorithm in the form of a flowchart or pseudocode.
b) Use your function to plot ���������������� /���� versus Ra over the range 300 < Ra < 10000 for H/D = 5, 10, 15, 20.
Solution
a) Algorithm
BEGIN ‘SoptStudy’
INPUT: H, Ra
Compute Sopt using ‘Sopt’ for all H, Ra values
Plot Sopt vs Ra at each H value END ‘SoptStudy’
BEGIN ‘Sopt’
INPUT: D, H, Ra
SoptGuess = D
Compute Sopt using a ‘fzero’ OUTPUT Sopt END ‘Sopt’
b) Results
H/D = 5 H/D = 10
H/D = 15
H/D = 20
Comments
Since the Rayleigh number represents the strength of the buoyancy, the fins can be packed closer at higher Ra. Also, a larger total height requires fins further apart due to the heating effect between fins.
Rayleigh #, Ra
Problem 6.7: Friction Factor and Moody Diagram
The Moody diagram is a classic found in virtually all books on fluid mechanics and heat transfer. It was originally published by L. F. Moody in the Transactions of the ASME in 1944 and is one of those rare diagrams that has passed the test of time and is still used today. This diagram shows the friction factor f as a function of Reynolds number ������������ for various values of the relative roughness ε/D. Variable definitions are:
/2)
P = pressure (N/m2), x = distance along pipe (m), ε = roughness (m), D = pipe diameter (m), ������������ = �������� ���� /���� , �������� = mean fluid velocity (m/s), ν = viscosity (m2/s). A correlation between f, ������������ and ε/D was developed by Colebrook for fully developed turbulent pipe flow
This equation is valid for ������������ > 3000. For ������������ < 3000, the flow is laminar flow and the friction factor for all ε/D values is ���� = 64/������������ .
a) Write a function to compute the friction factor as a function of ε/D and ������������ . For ������������ >3000, the Colebrook correlation should be used. An initial guess at the root can be obtained from
For ������������ <3000, the laminar flow formula, ���� = 64/������������ , should be used.
b) Use your function to plot the friction factor data on a log-log scale, just like the Moody diagram. Use the ε/D values shown in the figure.
Solution
Problem 6.8: Enzyme Kinetics
The Michaelis-Menten model describes the kinetics of enzyme mediated reactions: �������� �������� = �������� ���� �������� + ����
Where S = substrate concentration (moles/L), vm = maximum uptake rate (moles/L/d), and ks = half saturation constant, which is the substrate level at which uptake level is half of the maximum (moles/L). If the initial substrate level at t = 0 is S0, this differential equation can be solved for ���� = ����0 �������� ���� + �������� ��������(����0 /����)
a) Develop a function to determine S as a function of t, S0, vm, and ks
b) Use your function to plot S versus t for S0 = 0, 10, and 20 moles/L. Use vm = 0.5 moles/L/d and ks = 2 moles/L. Experiment with the maximum time so that a steady state is reached. Put all 3 curves on a single graph.
Solution

Problem 6.9: Basics
a) Determine all the roots of ���� (���� ) = 14 20���� + 19���� 2 3���� 3 graphically.
b) Determine the first root of the function with the bisection method.
c) Determine the first root of the function with the false position method. For parts (b) and (c), use initial guesses of �������� = 1 and �������� = 0, and a stopping criteria of |�������� | ≤ 1%.
Solution
a) Graphical
From the graph, three roots located at xr ≅ -0.5, 2.1, and 4.7 can be seen. Once the roots have been spotted, any one of them can be zoomed in on to get a better look. For instance, the graph on the right zooms in on the root at xr ≅ -0.5 and shows a more accurate estimated of xr ≅ -0.47.
b) Bisection Bisection
c) False Position
1
3
4
Comments
Results show that the bisection method converges to xr = -0.4727 with a tolerance of ea<=0.01after 8 iterations while the false position method converges to xr = -0.4717 after only 5 iterations. Thus, the false position method seems more efficient.
Problem 6.10: Fixed Points of an ODE
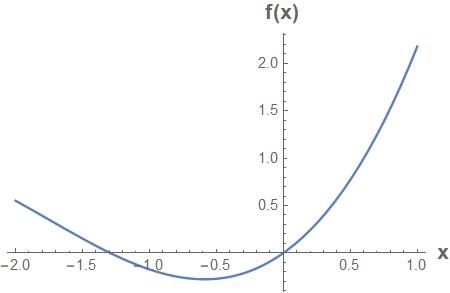
Consider the first order ODE: �������� /�������� = ���� ���� ������������ (���� ).
a) Can you find the fixed points (steady state) explicitly?
b) Show the location of the fixed points graphically.
c) For this problem, what is the iteration formula needed to find the fixed points using the Newton-Raphson method?
d) Starting with an initial guess of ����0 = 10, what result would the Newton-Raphson converge to after many iterations?
Solution
a) No
b) The fixed points appear to be at x=-1.3 and x=0.
c)
���� = 0
Problem 6.11: Projectiles
Aerospace engineers sometimes compute the trajectories of projectiles such as rockets. A related problem deals with the trajectory of a thrown baseball. The trajectory of a ball thrown by a fielder is defined by the (���� , ����) coordinates displayed in the figure.

The trajectory can be derived as
a) Derive the above formula from physical principles.
b) Create an animation of y vs x with controls for the parameters.
c) Create an animation of a parametric plot of ����(����) �������� ���� (���� ) where t is a parameter, along with the other system parameters. This is a “shooting star” animation.
d) Create a function to compute the initial angle ����0 as a function of the other variables.
e) Use your function to study the effect of a baseball thrown by a fielder to home plate. Create a plot of ����0 (in degrees) versus x. Use an x-range of 1m to 130 m (deep outfield). On a single graph, plot curves corresponding to v0 = 25, 35, and 45 m/s. Note that 45 m/s is about 100 mph which is the limit for a top major league baseball player. Also assume the fielder releases the ball at an elevation of 2 m and the catcher receives it at 0 m.
Solution
(a) The stated trajectory equation can be derived from Newton’s Law.
Combine these to get
(d) The solution requires a root finder to solve the following non-linear algebraic equation for θ0. ���� (����0 ) = ���� ����0 + ���� tan(����0 ) ���� 2����02 cos(����0 )2 ���� 2 = 0
(e) Numerical Results
Comments
If the velocity is too low (25 m/s), the fielder is unable to throw more than about 65 m. Mathematically, there is no root if the desired distance is too large and MATLAB returns an answer of ‘NaN’. When solutions are possible there are always two complimentary solutions, corresponding to a low arc and a high rainbow arc. These angles are almost symmetric about the ����0 = 45 deg line. This is explained by examining some trajectories.
Problem 6.12: Simultaneous Equations
Consider the following equations. Sketch solutions to each of these equations in the x-y plane and indicate the x, y points that are solutions to both equations. Apply one step of the NewtonRaphson formula using initial guess (����0 , ����0 ) = (0,0).
a) ����(���� , ����) = 2���� ���� = 0 ����(���� , ����) = ���� + ���� 3 = 0
b) ����(���� , ����) = ���� 2 = 0 ����(���� , ����) = ���� 2 ���� = 0
Solution
Use Equations (6.35) and (6.36)
= Jacobian = 2����
Cannot start using an initial guess of ����0 = 0 since the Jacobian is zero and you get division by zero.
Problem 6.13: Graphical Solutions
Consider the function ���� (���� ) = �������� + ���� sin(���� )
a) Graphically show the roots of ���� (���� ) = 0 when a = b = 0. What are the roots?
b) Graphically show the roots ���� (���� ) = 0 when a = 0 for various values of b. Show the roots by plotting ���� (���� ) vs x. On a separate plot, show the roots by plotting both �������� + ���� ������������ sin(����) vs x. What is the range of b for which roots exist?
c) Graphically show the roots when b = 0 for various values of a. Are roots always possible? Are there any ranges of a for which multiple roots exist?
d) Find the root of ���� (���� ) = 0 for
• a = 0.1 and b = 0 with an initial guess of ����0 = 4.
• a = 0.5 and b = 1 with an initial guess of ����0 = 4.
• a = 0.5 and b = 1 with an initial guess of ����0 = 4
Solution
a) Roots are located at �������� .


b)
c)
d) 2.852, Trouble converging, 2.754
Problem 6.14: Simple Interest
The formula for simple interest is
where P = present worth, A = annual payments, n = number of years, and i = interest rate.
a) Write a function to compute i as a function of A, P, and n
b) For P = $25,000, A = $5,000, and n = 30 years, determine i.
c) With P = $25,000, plot i versus n for A = $1000 to $10000.
Solution
a) Need to solve the following for i.
We will need a root finder.
b) ���� = 0 199 or 19.1%
c) Solution for A = 1000, 5000, and 10000.

Problem 6.15: Non-Linear Springs
Consider the spring and block system shown with non-linear springs
x1+L1
Non-linear springs can be described by ���������������������������� = �������� + ���� ���� 3 where x is the displacement of the spring from its equilibrium length and k and ���� are dependent upon the properties of the spring. For relatively small value of x, the non-linear term is small and the spring behaves as a linear spring, i.e., ���������������������������� = �������� . If ���� > 0, the spring is called a hardening spring because it takes more force to cause the same displacement. If ���� < 0, the spring is called a softening spring meaning that it loses its strength after is stretched or compressed a certain amount.
a) Considering all the ki, �������� , Li, and W as known, derive the mathematical model for the stretched lengths xi
b) Write a function to solve the system of equations in part (a).
c) Use the function developed in part (b) to determine the xi’s the following cases.
Case 1
W=0.2 m
LT=8 m Li=1 m ki=2 N/m �������� = 0 ����/����3
Solution
(a) Mathematical Model
Case 2
W=0.2 m LT=8 m Li=1
Case 3
m k1=1, k2=2, k3=3, k4=4 N/m
0.1
These non-linear algebra equations must be solved numerically.
(c) Results

Chapter 7
Introduction to Ordinary Differential Equations
Problems 7.1 to 7.6
For each of the ordinary differential equations,
a) Sketch the phase portrait (dx/dt vs. x)
b) Find all fixed points and classify their stability (stable or unstable).
c) Sketch the anticipated solution (x(t) vs. t)
Clearly label your sketches.
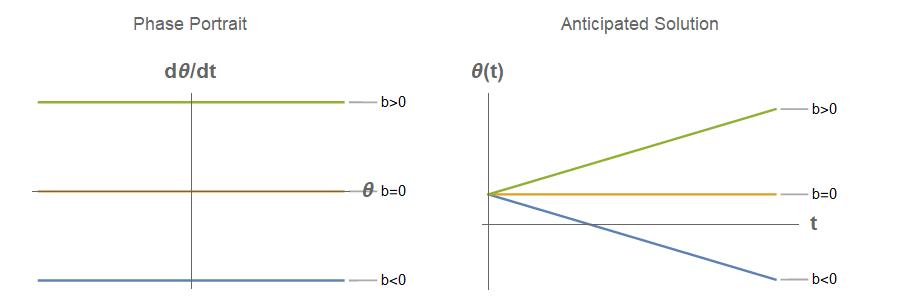
Problem 7.1
�������� �������� = ����
Draw sketches for ���� < 0, ���� = 0, ������������ ���� > 0
Solution
No fixed (or steady state) points unless b = 0.
Problem 7.2
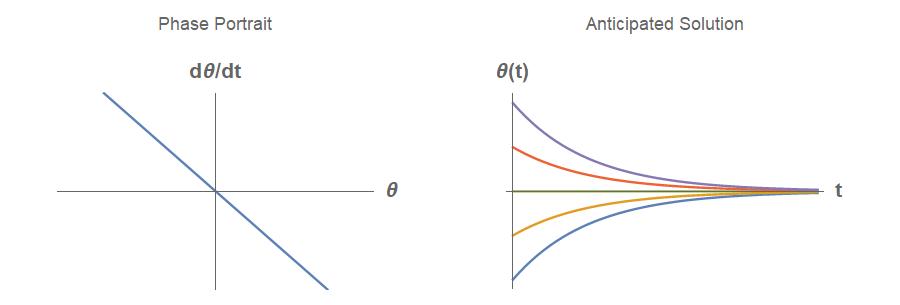
Solution
���� ∗ = 0: stable
Problem 7.3
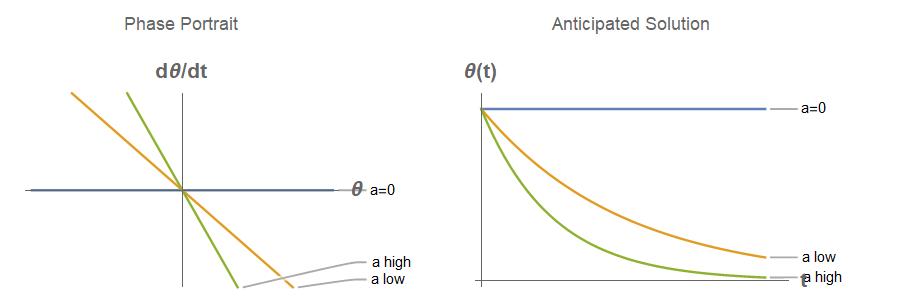
Draw sketches corresponding to a zero, low, and high value of the parameter a
Solution
∗ = 0: stable for a >=0
Problem 7.4
Draw sketches corresponding to zero, low and high values of the parameter b
Solution
= ����/���� : Stable

Problem 7.5 �������� �������� = ���� ���� (1 ���� )
r >0. Draw anticipated solution (θ(t) vs. t) starting from several initial conditions.
Solution
∗ = 0: Unstable
∗ = 1: Stable

Problem 7.6
Consider the ODE
r is a positive constant
a) Find all fixed points and classify their stability (stable or unstable). Are there any critical values of S?
b) Plot the phase portraits (�������� �������� vs. ���� ).
c) Plot the anticipated solution (���� (����) vs. t). Draw sketches starting from different initial positions.
Solution
< ���� 4 No real fixed points
The distinct qualitative change in the solution as S crosses –r/4 is referred to in dynamics as a bifurcation. We study this behavior in detail later.

Problem 7.7
Consider the linear first order ODE
The parameters τ, θ∞ , and Sc are constants. Assume τ >0.
a) Find and classify the stability of the fixed points.
b) Sketch the phase portrait for Sc=0 and Sc>0.
c) Sketch the solution based on the phase portrait for different initial conditions. Consider Sc=0 and Sc>0.
d) Based on the previous findings, sketch the anticipated solution for θ∞ =0 with a pulsed, time dependent source


Fixed Point

This is the only fixed point and it is stable. Solution Sketches


Solution
Phase Portrait
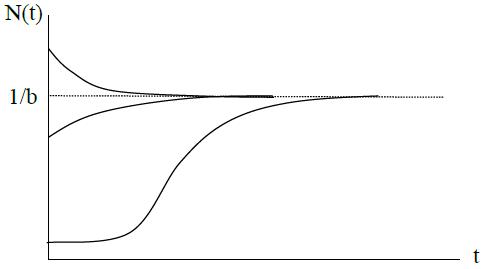
Problem 7.8: Tumor Growth
The growth of cancerous tumors can be modeled by the Gompertz law ��������
��������(��������)
where ���� (����) is proportional to the number of cells in the tumor, and a, b > 0 are parameters.
a) Interpret a and b biologically.
b) Sketch the phase portrait
c) Sketch ���� (����) for various initial values.
Solution
a) Interpretation
a represents a growth rate
1/b represents a carrying capacity
b) Solution Sketches

Fixed Points:
x* = 0 : Unstable
x* = 1/b : Stable
Problem 7.9
Consider the model chemical reaction
in which one molecule of X combines with one molecule of A to form two molecules of X. This means that the chemical X stimulates its own production, a process called autocatalysis. This positive feedback process leads to a chain reaction, which eventually is limited by a “back reaction” in which 2X returns to A + X.
According to the law of mass action of chemical kinetics, the rate of an elementary reaction is proportional to the product of the concentrations of the reactants. We denote the concentrations by lowercase letters x = [X] and a = [A]. Assume that there’s an enormous surplus of chemical A, so that its concentration a can be regarded as constant. Then the equation for the kinetics of x is
where k1 and k-1 are positive parameters called rate constants
a) Sketch the phase portrait.
b) Find all the fixed points and classify their stability.
c) Sketch the solution based on the phase portrait for different initial conditions
Solution
a) Phase Portrait

b) Fixed Points
c) Solution Sketches

Problem 7.10: Chemical Kinetics
Consider the chemical reaction system
This is a generalization of Problem 7-9. The new feature is that X is used up in the production of C.
a) Assuming that both A and B are kept at constant concentrations a and b, show that the law of mass action leads to an equation of the form �������� /�������� = ����1 ���� ����2 ���� 2 , where x is the concentration of X, and c1 and c2 are constants to be determined.
b) Find and classify all the fixed points. Show that x*= 0 is stable when ����2 ���� > ����1 ���� , and explain why this makes sense chemically.
c) Sketch the phase portraits and anticipated solutions for all the qualitatively different possibilities.
Solution
a) Governing Equation
b) Analysis of the Fixed Points c
c1 < 0 x* = 0 x* = c1/ c2
x* =0 is the only stable fixed point when ����1 ���� < ����2 ���� (c1 < 0) because chemical X is being used up faster during its interaction with B than it is being produced through its interaction with A.
c) Phase Portraits and Expected Solutions c1 < 0
Problem 7.11: Allee Effect
For certain species of organisms, the effective growth rate ���� /���� is highest at intermediate N. This the called the Allee effect. For example, imagine that it is too hard to find mates when N is very small, and there is too much competition for food and other resources when N is large.
a) Show that ���� ���� = ���� ����(���� ����)2 provides an example of Allee effect, if r, a, and b satisfy certain constraints, to be determined.
b) Find all the fixed points of the system and classify their stability.
c) Plot the solutions ���� (����) for different initial conditions.
d) Compare the solutions ���� (����) to those found for the logistic equation. What are the qualitative differences, if any?
Solution
b) Fixed Points
c) Numerical Solution

d) Comparison with Logistic Equation

Problem 7.12: Slope Fields
Consider an autonomous first order ODE:
�������� �������� = ���� (���� )
The slope field is shown.
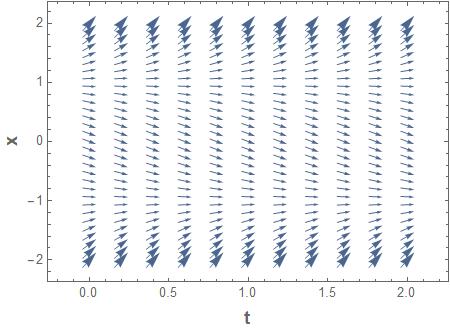
a) Propose a possible function ���� (����) consistent with the slope field.
b) Plot the solution ���� (����) versus t starting from x0 = -2, -1, 0, 1, and 2.
c) Plot the phase portrait, �������� /�������� versus x.
Solution
a) This vector field seems to be generated from a function such as ���� (���� , ����) = (���� + 1)(���� 1)
b) Solution

d) Phase portrait

Chapter 8
Laplace Transforms
Problem 8.1: Linear First Order ODE
Consider the linear first- order ODE where τ is constant. �������� �������� + 1 ����
(����) = ���� (����)
= ����0 , ���� = 0
1. Determine the analytical solution using the Laplace transform method for ���� (����) = 0. Create a meaningful plot of this solution.
2. Determine the transfer function G(s).
3. Apply the results from part (2) to determine the solution for the following forcing functions with ����0 = 0 where fc is a constant and H is the unit step function. Plot each case.
a. Step input ���� (����) = �������� ����(���� ����0 )
b. Pulsed input
(����) = �������� �����(���� ����1 ) ���� (���� ����2 )�
c. Impulse or Delta function
(����) = �������� ���� (���� ����1 )
d. Harmonic forcing
(����) = �������� ������������(��������)
2) Transfer Function
3a) Step Input
3b) Pulse
3c) Impulse or Delta function
3d) Harmonic forcing
Problem 8.2
Consider the linear second order ODE where k is constant.
���� + �������� (����) = ���� (����)
���� (0) = ����0 ���� (0) = ����0
1. Determine the analytical solution using the Laplace transform method when ���� (����) = 0. Create a meaningful plot of this solution.
2. Determine the transfer function ���� (����).
3. Apply the results from part (2) to determine the solution for the following forcing functions with zero initial conditions. Plot each case.
a. Step input, ���� (����) = �������� ����(���� ����0 )
b. Pulsed input, ���� (����) = �������� ����� (���� ����1 ) ���� (���� ����2 )�
c. Impulse or Delta function, ���� (����) = �������� ���� (���� ����1 )
d. Harmonic forcing, ���� (����) = �������� ������������(��������)
Solution
1)
Chapter 9
Numerical Solutions of Ordinary Differential Equations
Problem 9.1: Runge-Kutta Basics
Solve the following initial value problem over the interval from t = 0 to 2 with a = 1.1 and y0=1. Display all your results on a single graph.
a) Analytically.
b) Using Euler’s method with h =0.5 and 0.25.
c) Using Heun’s method with h =0.5.
Solution
(a) Analytical Solution
For this particular case, it is possible to separate the variables.
This equation can now be integrated directly.
The unknown constant is determined by forcing the solution to satisfy the initial condition.
Using the Euler scheme, reducing the step size by a factor of 2 reduces the error by approximately a factor of 2. The Heun method is second order accurate and gives better results at the expense of more computations.
Problem 9.2: Euler’s Method
Consider the differential equation
�������� = ���� + 2
a) Sketch the phase diagram (��������⁄�������� vs. y) and the anticipated solution (y(t) vs. t).
b) Starting with the initial condition y0 = 0, manually perform three steps of the Euler’s method using a step size of h = 0.5.
c) Using the Euler’s method, compute and plot the solution starting from initial conditions: y0 =2, 0, 2, 4, and 6. Put all the curves on a single graph. Use a time range 0 ≤ ���� ≤ 5. Experiment with the required step size in order to get accurate and smooth looking plots. Report the step size you decided upon.
Solution
a) Phase Diagram and Anticipated Solution x* = 2: stable
Draw sketches corresponding to zero, low and high values of the parameter S.


b) Manual Calculations


c) Results
The previous graph shows that there is no noticeable difference in the results using step sizes of 1/64 and 1/128. Thus, a step size of h = 0.01 is plenty small for accurate graphical results and is used to obtain the following results. The results using h = 0.5 match the hand calculations.
Effect of Initial Condition, y0
Problem 9.3: Lumped Thermal Mass
Consider the cooling of a hot object initially at temperature T0 in cold air at T∞ with heat transfer coefficient h. Assume the lumped thermal capacity model, as described in the previous chapter, is valid. The differential equation is ������������ �������� �������� = ℎ�������� (���� ����∞ ) + ��������
a) Draw the cause/effect diagram for this physical problem.
b) Write a function to numerically solve for temperature as a function of time. The system parameters and forcing functions should be inputs and the time and temperature vectors should be outputs.
c) Explore the effect of the heat transfer coefficient. Plot temperature vs. time for h = 10 W/m2 °C (still day), 25 W/m2 °C (typical day) and 75 W/m2 °C (hurricane). Put all curves on a single graph. Carry out time long enough such that the temperature begins to level out at steady state. The other parameters are: V =10-6 m3, As =10-4 m2, ρ = 1000 kg/m3, c = 500 J/kg °C, T∞ = 25°C, T0 = 400°C, g = 0.
d) Explore the effect of the heat source strength. Plot the solution for g = 0, 105, 2x10⁵ and 3x10⁵ W/m3. Put all curves on a single graph. Use parameter values from part (b) with h = 25 W/m2 °C.
Solution
Forcing Functions
Note that the steady state temperature can be determined form ������������ �������� �������� = ℎ�������� (���� ����∞ ) + �������� = 0
With no heat generation (g = 0), the object will simply end up at room temperature.
Part (c): Effect of the Heat Transfer Coefficient
The object cools quicker with a higher h, representing a higher wind velocity.
Part (d): Effect of Heat Generation
Note that the steady state temperatures can be verified as being correct. For g = 105
65°
Also, the solution is a linear function of the heat source. Thus, doubling g doubles the temperature rise above T∞.
Problem 9.4: Population Model
The earth’s population can be estimated using the following simplified model ��������
�������� = �������� ��������2
where a is the birth rate parameter and b is the death rate parameter.
a) Determine the steady state population.
b) Sketch the phase plot, ��������⁄�������� vs. P. Using the phase plot, sketch the anticipated population history, ���� (����) vs. time. Draw a single graph with several curves corresponding to different starting populations.
c) When the time variable t is measured in years, experimental evident suggests that the parameters a and b in the population model are approximately a = 0.028 1/year and b = 2.9 × 10⁻¹² 1/(people*year). Starting from a population of approximately P0 = 100 million people in the year 1800, compute and plot the earth’s population as a function of time in years. Run your simulation until the population appears to level off. Using these parameters, how many people will we eventually have on this earth? At what year will we have reached 99% of our maximum population?
d) Estimating population is an inexact science. Examine the effect of the birth rate parameter by plotting the earth’s population for a = 0.025, 0.03, and 0.035 with b = 2.9×10⁻¹². Put all curves on a single graph.
e) Examine the effect of the death rate parameter by plotting the earth’s population for b = 2.5 × 10⁻¹², 3 × 10-12 and 3.5 × 10⁻¹² with a = 0.029. Put all curves on a single graph.
Solution
a) Steady State
Steady state occurs when�������� �������� = 0. Thus P = 0 and ���� = ����/���� are possible steady states. The stable steady state is ���� = ����/����
b) Phase Plot and Anticipated Solution


Maximum Population
The earth`s population will reach 9.333 billion people! We will reach 99 percent of the earth`s maximum population in the year 2129.
e) Birth Rate Study
f) Death Rate Study
Problem 9.5: Linear Oscillator, Effect of Damping
Consider the spring-mass-damper system with zero forcing, described by the following differential equation and initial conditions.
a) Draw the cause/effect diagram for this system.
b) Write a function to numerically solve this differential equation.
c) Use your function to solve and plot x(t) and v(t) versus t. Use the following parameters: x0 = 1 m, v0 = 0, m = 20 kg, k = 20 N/m, c = 0, 8, and 40 N s/m. Create separate plots for x(t) and v(t) versus t. Put all three curves for different c values on a single graph (see Fig. 9.7 for an example).
Solution
Forcing Functions
Problem 9.6: Linear Oscillator with Forcing
Consider the forced spring-mass-damper system, described by the following differential equation and initial conditions.
a) Draw the cause/effect diagram for this system.
b) Write a function to numerically solve this differential equation.
c) Use your function to compute the displacement and velocity for the following special cases. For each case, create a 3-part graph containing F(t), x(t), and v(t ) vs. t. For all cases: m = 20 kg, c = 4 N⋅s/m, k = 20 N/m, and x0 = v0 =0. See Figure 9.6 for an example.
Forcing: F(t) (N)
Constant forcing ���� (����) = ����0 F0 = 10 N
Harmonic forcing ���� (����) = ����0 sin(��������) F0 = 5 N/kg, ���� = 1 rad/s
Pulsed forcing ���� (����) = ����0 (
(����) ���� (���� ������������ )) F0 = 10 N , ton = 40 sec
Solution
Forcing Functions
Constant Forcing
Harmonic Forcing
Pulsed Forcing
Problem 9.7: Pendulum
The oscillations of an undamped pendulum can be simulated with the following nonlinear equation ���� 2 ���� �������� 2 + ���� ���� sin(���� ) = 0
where θ= angle of displacement, g = gravitational constant = 9.81 m2/s, and L = pendulum length. For small angular displacements, sin(���� ) ≈ ���� and the model can be linearized as ���� 2 ���� �������� 2 + ���� ���� ���� = 0
a) Reformulate these equations as two first order equations for θ and ���� = �������� /�������� .
b) Draw the cause/effect diagram.
c) Create a function to compute the solution as a function of the input parameters.
d) Using the function you developed, solve for θ and v as functions of time for both the linear and nonlinear models with L = 0.6 m and initial conditions θ0 = π/8 and v0 = 0. Plot the linear and nonlinear solutions on the same graph. Also plot results for θ0 = π/2, θ0 = 0.99 π, and θ0 = π.
Solution
a) First Order Equations
In order to express as two first order equations, define
= v
d) Numerical Results
Comments
The linear model is more accurate for small angles. However, even at θ0 = π/8, a gradual phase shift between the linear and nonlinear models can be observed. At θ0 = π/2 (vertical starting position), the two models are quite different. At the top position, the two models are completely different. 0
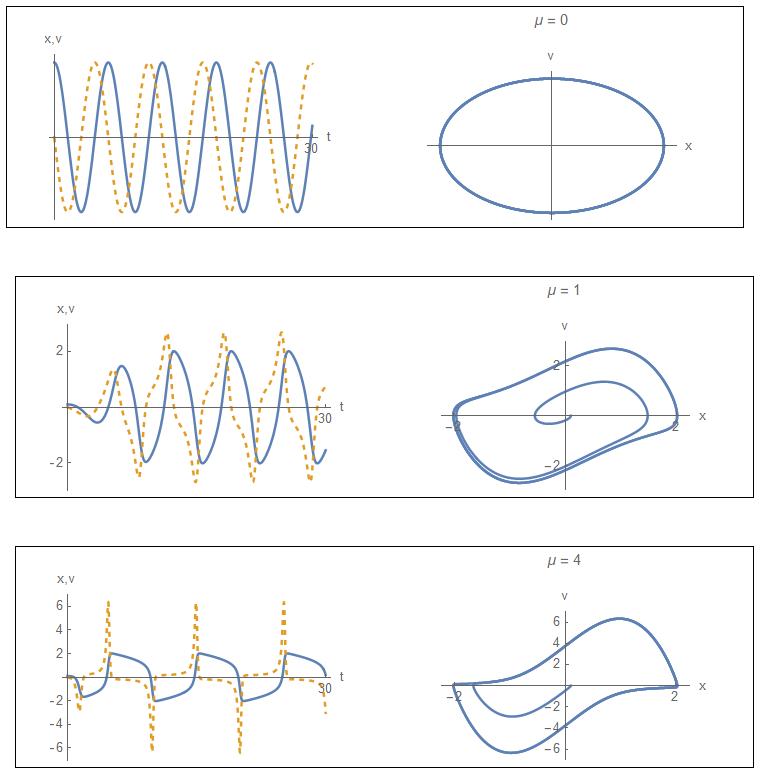
Problem 9.8: Van der Pol Equation
The van der Pol equation is a model of a nonlinear circuit that arose back in the days of vacuum tubes: ���� 2 ���� �������� 2 + ����(1 ���� 2 ) �������� �������� + ���� = 0
a) Reformulate these equations as two first order equations for y y = 1 and ����2 = ��������⁄�������� .
b) Create a function to compute the solution as a function of the input parameters.
c) Using your function from part (b), solve for y1 and y2 as functions of time with µ = 1 and initial conditions y1 = 0.1 and y2 = 0. Create the following graphs:
• y1 vs. t and y2 vs. t
• phase plot: y1 vs. y2
d) Repeat part (c) with µ = 0 and 10.
Solution
a) Using the definitions ����1 = ���� and ����2 = �������� �������� , the original second order system can be decomposed into a set of first order equations.
c) d) Numerical Results
Problem 9.9: Sky Diver
The free-fall velocity of a parachutist can be estimated using the force balance �������� �������� = ���� �������� ���� ���� 2
where v = velocity (m/s), t = time (s), g = 9.81 m/s2 = acceleration due to gravity, cd = drag coefficient (kg/m), and m = mass (kg). For an 80-kg parachutist, we wish to solve this differential equation given that v = 0 at t = 0. During free fall, cd = 0.25 kg/m. However, at t = topen, the chute opens, whereupon cd = 5 kg/m.
a) What would be the steady state velocity if the chute was not opened? What is the steady state velocity after the chute opens?
b) Sketch the phase diagram (dv/dt versus v) and the anticipated solution for v(t ) vs. t based on the phase diagram.
c) Write a function to solve this differential equation numerically from t = 0 to 30 s. Create a plot of v(t) vs. t for topen = 0, 5, 10, and 20 sec, putting all curves on a single plot.
Solution
(a) Steady or Terminal Velocity
The steady state occurs when the velocity no longer changes with time: ���� ∗ =
Terminal velocity, chute closed = 56.0 m/s
Terminal velocity, chute open = 12.5 m/s
From the phase diagram, an approximate sketch of the solution can be anticipated, even for this relatively difficult problem.
c) Effect of Free Fall
Problem 9.10: Coupled Oscillators
Two masses are attached to a wall by linear springs.
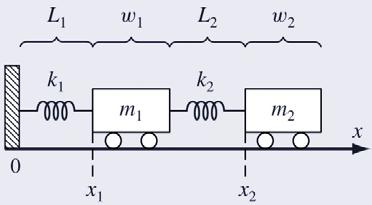
Force balances based on Newton’s second law can be written as
where ki = the spring constants (N/m), mi = masses (kg), Li = the length of the unstretched springs (m), and wi = the widths of the masses (m). Initially, the masses are at locations x1,0 and x2,0
a) Draw the cause/effect diagram for this system.
b) Determine the stead y-state or fixed points.
c) Write a function to numerically solve this system of differential equations.
d) Compute the positions of the masses as a function of time over the range t=0 to 20 using the following parameters: k1=k2=5, m1=m2=2, w1=w2=5, and L1=L2=2. Set the initial conditions as x1,0=L1 and x2,0= L1+w1+L2+6 with zero velocity. Construct time-series plots of both the displacements and the velocities. Indicate the fixed points on your graph. In addition, produce a phase-plane plot of x1 versus x2.
Solution
a) Cause/Effect
Forcing Functions
b) Fixed Points
The steady or fixed points are where the time derivatives are zero (no motion, v1 = v2 = 0).
Arrange as a 2-by-2 matrix
Solve this 2-by-2 system using Cramer’s rule.
The fixed points correspond to the upstretched positions of the springs.
d) Results
Displacements of a Coupled Spring/Mass System
Velocities of a Coupled Spring/Mass System
Phase Plot of a Coupled Spring/Mass System
Problem 9.11: An Epidemic
The following ODE’s have been proposed as a model of an epidemic:
where
S = the number of susceptible individuals
I = the number of infected individuals
R = the number of recovered individuals
a = infection rate
r = recovery rate
A city initially has 10,000 people, all of whom are susceptible. Then a single infectious individual enters the city at t = 0. Use the following estimates for the parameters: a = 0.002/(person week) and r = 0.15/day.
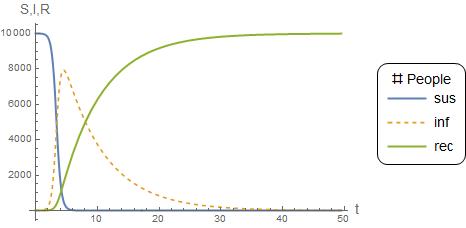
a) Compute the progression of the epidemic. At what time does the number of infected individuals drop back to 10? Create time series plots of all the state variables over a time range from 0 until the number of infected individuals falls below 10. Also, create a 3D phase plot of S versus I versus R.
b) Suppose that after recovery, there is a loss of immunity that causes recovered individuals to become susceptible. This reinfection mechanism can be modeled as ρR, where ρ = the reinfection rate = 0.03/day. Modify the model to include this mechanism and repeat the computations in (a).
c) Suppose that some of the infected people recover and some die. F is the number of dead people. Also consider that there is an influx of susceptible individuals moving to the city at the rate of Q people/day. Modify the model to include these possibilities and repeat the computations in (a).
Solution
a) Basic Model
b) Improved Model
With loss of immunity and reinfection, the equations become
In matrix form, the system of equations can be written as
In order to input these equations systematically into the computer, redefine the variables as follows.
Chapter 10
First Order Ordinary Differential Equations
Problem 10.1
The functions ����1 (����)and ����2 (����) are the solutions of the following simple, elementary problems.
Express the solutions to the following problems in terms of the ψ1 and ψ2 functions. Be specific about the arguments. Do not actually solve for ψ1 and ψ2. A few cases are given as examples in order to clarify the objectives.
Case Source, ����(����)
����0 Solution in terms of
and
H(t) is the step function.
Problem 10.2
Consider the nonlinear problem �������� �������� = 1 ���� ���� 2 ���� = ����0 , ���� = 0
Can the solution be expressed in terms of the ψ1 and ψ2 functions defined Problem 10.1? If not, what is the difficulty?
Solution
Try ���� (����) = ���� ⋅ ����2 (����),
It is impossible to express the solution in terms of ����1 (����)and ����2 (����). The nonlinearity couples the coefficients.
Problem 10.3
A basic population dynamics model is ��������
Can the general solution can be expressed as the superposition of simpler solutions?
where
P1(t) is due to P0 only with S =0
P2(t) is due to S only with P0
List the governing equations for P1(t) and P2(t) if this superposition attempt is successful.
Solution
Substitute the proposed solution into the ODE.
The squared term 2����1 ����2 makes the equation impossible to separate algebraically into individual problems with ����1 only and ����2 only.
Problem 10.4
Consider the thermal system described by the equations
Show that the general solution can be expressed as the superposition of the simpler solutions
where
T1(t) is due to T0 only with g=0
T2(t) is due to g only with T0=0
List the governing equations for T1(t) and T2(t).
Solution
Substitute the proposed superposition
Break this problem into sub-problems.
x1(t) Problem
2(t) Problem
Problem 10.5
A lumped thermal system with radiation and heat generation is described by the equations ������������ �������� �������� = �������� ��������(���� 4 ���������������� 4 ) + ����(���� )���� ���� = ����0 , ���� = 0
Can the general solution can be decomposed as the superposition of the simpler solutions ���� (����) = ����1 (����) + ����2 (����)
where T1(t) is due to T0 only with g=0 T2(t) is due to g only with T0=0
List the governing equations for T1(t) and T2(t) if this superposition attempt is successful.
Solution
Substitute the proposed superposition ����cV ���� (����1 + ����2 ) dt = �������� εσ((����1 + ����2 )4 ����sur 4 ) + ���� ����
The 4th order term makes the equation impossible to separate algebraically into individual problems for ����1 only and ����2 only.
Problem 10.6
Consider the linear first order ODE where τ is constant. �������� �������� = 1
+
(
)
= ����0 , ���� = 0
a) Determine the analytical solution for S(t) = 0. Create a meaningful plot of this solution.
b) Determine the analytical solution for S(t)=Sc=constant with ����0 = 0. Create a meaningful plot of this solution.
c) Show that the general solution to this linear problem can be expressed as the superposition of effects due to the initial condition θ0 and source S(t).
d) Determine the analytical solution for S(t)=Sc=constant and initial condition, θ0, using the superposition principle demonstrated in part (c) and the results found in parts (a) and (b).
e) Consider the case where θ0 =0 with a finite pulse source, defined by
) = ��������
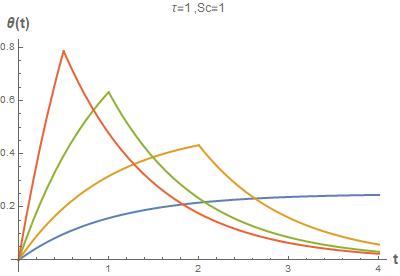
Determine the analytical solution. Create a meaningful plot of this solution. Consider the effect of ∆t for a fixed Sc. Examine the limit as ∆t ⇒ 0.
Solution
a) Solution for ����(����) = 0
) =

b) ����(����) = �������� = �������������������������������� with ����0 = 0

c) Linearity
���� (���� ) = ����ic (���� ) + �������� (���� ) is allowable for linear problems.
d) Combined Effects of θ0 and Sc
e) Pulsed Source
Problem 10.7
A square silicon chip of length L = 10 mm on a side and thickness δ = 5 mm is embedded in a well-insulated substrate.
∞ = 30°C
Substrate
The chip draws P = 0.5 W of electrical power and is cooled by convection from the top surface to air at T ∞ = 30°C with a heat transfer coefficient h = 40 W/m2 K. Assume that radiation effects are negligible and that the lumped capacity approximation is valid. The chip has the following thermal properties:
ρ = 2000 kg/m3, c = 700 J/kg K, k = 150 W/m K
1. The chip is initially at the ambient temperature of T ∞ with the power off. At t = 0, the power is switched on.
a. Sketch the temperature as a function of time for this process
b. Derive the energy equation for this case (symbolic form).
c. Determine the eventual steady-state temperature of the chip (numerical value).
2. After the steady condition in Part 1 has been reached, the power is shut off.
a. Sketch the temperature history as a function of time for this process, starting from the time the power is initially switched on, all the way to a new steady-state after the power is switched off.
b. What does the energy equation reduce to for this case (symbolic form).
c. Determine how long it takes for the chip temperature to drop to 35 °C after the power is shut off (numerical value).
3. After the steady condition in Part 1 has been reached, the system suffers a loss of coolant, causing the heat transfer from the surface due to convection to become negligibly small.
a. Sketch the temperature history as a function of time for the entire process, starting from the time the power is initially switched on, all the way to the time the chip reaches its failure temperature.
b. What does the energy equation reduce to for this case (symbolic form)?
c. Determine the how long it takes for the chip to reach its failure temperature of 300 °C after loss of coolant.
Solution
Part 1.

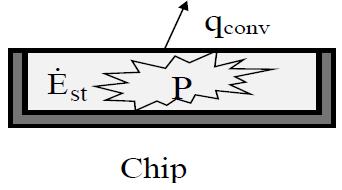
Recall the general statement of ENERGY CONSERVATION ����st = �������� +
Application to our problem gives,
At steady-state, energy storage is zero, thus
Part 2.
An energy balance during time t2 gives
Solve this differential equation subject to the initial condition T = Tss when t = 0;
Substitute
An energy balance during time t3 gives,
Solve subject to the initial condition, T = Tss when t = 0.
Substitute numbers, ����3 = 203 sec = 3.4 min
Problem 10.8
Consider a thin plate of area A and thickness L with material properties k, c, and ρ. The plate is exposed to convection on the bottom side and to a specified heat flux, qs”(t), on the top side. In addition, the plate is subjected to a volumetric heat source, g(t) (W/m3). The initial temperature is T0. Assume the lumped capacity approximation is valid.


a) Derive the energy equation. Formulate the complete mathematical model of the system.
b) Sketch the solution assuming g and qs” are constant. Consider T0 = T∞ . On a single graph, put curves for a 0, medium, and large value of h. On another graph, show the effect of the volumetric heat source, g. Try to create a meaningful graph that highlight the effect of g only.
c) Consider the mathematical model from part (a) in the form
What are the temperature rise, θ(t), initial temperature, ����0 , time constant, τ, and the source term, S?
d) Using the model from part (c), solve for the transient temperature solution, ���� (����) when S(t) is a constant. Plot your solution.
e) Using the model from part (c), solve for the transient temperature solution, ���� (����) when S(t) is a pulse,
where S0 is a constant and ∆t is the pulse time. Plot your solution.
f) Show that due to the linear nature of this problem, the solution can be constructed as a superposition or summation of two simpler solutions, one due to the heat source S(t) only, and another due to the initial condition ����0 only. Do not simply examine the mathematical solution to verify that this works (zero credit for this approach). Instead, try the superposition ���� (����) = �������� (����) + ������������ (����) directly in the governing equations. What equations govern the functions �������� and ������������ ?
Solution
a) Mathematical Model
b) Sketches
At steady-state
c) Equivalent Form
d) Solution for constant S

e) Pulsed Solution
Define �������� (����) as the response to a constant source of unit magnitude (S = 1) with zero initial condition ( ����0 = 0). For this case the previous solution reduces to
It is best to program this type of function on a computer using the step function rather than an ‘if’ condition. The pulsed heat flux can be considered as an on/off sequence, written in either of the following equivalent forms.
Alternately, the solution can be obtained by carefully evaluating the resulting integral using an integrating factor.
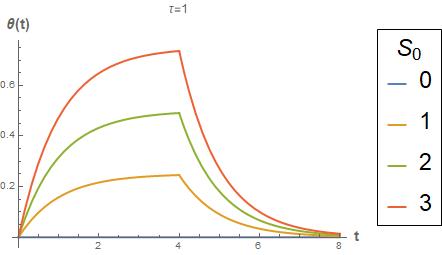
f) Superposition of Elementary Solutions
Problem 10.9
Consider a large, thin plate of area A and thickness L with material properties k, c, and ρ. The plate is exposed to convection at different environments on the top and bottom. In addition, the plate is subjected to a constant volumetric heat source, ���� (W/m3). The initial temperature is T0. Assume the lumped capacity approximation is valid.


a) Derive the energy equation.

b) What is the steady state temperature?
c) Solve for the transient temperature solution, T(t).
d) Transform the energy equation into dimensionless form.

e) Sketch the anticipated solution for ℎ1 ≫ ℎ2 , ℎ1 = ℎ2 , and ℎ1 ≪ ℎ2 with g = 0, ����0 = (����∞1 + ����∞2 )/2 and ����∞1 > ����∞2 Put all curves on a single graph.
f) Show the effect of the volumetric heat source, g. Try to create a meaningful graph that highlights the effect of g only.
Solution
a) Energy Equation
b) Steady State Temperature
c) General Solution
d) Nondimensional Form
Note that the meaningful interpretation of temperature is actually a temperature difference. It is always easier (and more meaningful) to define a new dependent variable as the rise above a logical ground level.
Problem 10.10
A long thin copper wire of diameter D and length L has an electrical resistance per length of wire R’ e (Ω /m), density ρ, specific heat c , and total emissivity ε. The wire is initially at steady state at temperature T0. At time t=0 an electric current I (amps) is passed through the wire, causing electrical resistance heating. As the wire temperature rises, heat is dissipated by convection to the air at temperature T ∞ with a heat transfer coefficient h and by radiation to the walls at temperature Tsur.
Walls, Tsur
Air, T∞ , h
Assumptions
• Constant thermal and electrical properties
• Lumped capacity, valid for low Bi. That is, spatially uniform temperature at any time, ���� = ����(���� ).
• Negligible conduction from the ends or stand.
a) Derive the mathematical model governing the transient temperature of the wire.
b) For the case where ����0 = ����∞ = ���������������� , sketch the anticipated temperature vs time behavior of the wire. On a single graph sketch curves corresponding to free convection, mild forced convection, and strong forced convection. Clearly label your graph.
c) Neglecting radiation affects, derive an analytical solution for the transient temperature of the wire. What is the steady temperature of the wire for this case?
d) Create a function to evaluate the solution numerically. Plot temperature vs. time using the following parameters. Put all three curves on a single graph. h values of 5, 25, and 100 W/m2 K
����0 = ����∞ = ���������������� = 300 ����
D = diameter = 0.001 m , L = length = 0.4 m
ρ = density = 8933 kg/m3 , k = 400 W/m K, c = specific heat = 385 J/kg K
ε = emissivity = 0.9
I=6 Amps, ρe = electrical resistivity = 80 µΩ -cm
Solution
(a) Energy Equation
Power supply I Wire
(b) Anticipated Solution
free convection
mild forced strong forced
Time, t
(c) Transient Linear solution neglecting radiation
In terms of the original physical variables the solution is
Steady State Solution
(d) Numerical Solution
Effect of Convection Coefficient
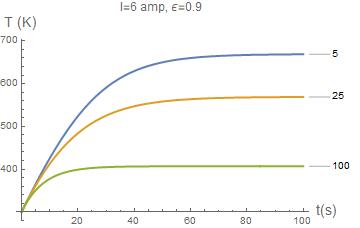
Convection and Radiation Effects
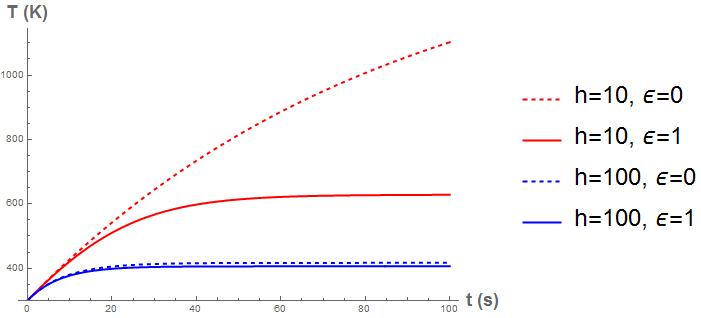
Problem 10.11: Canister Wall
A spherical, stainless steel (AISI 302) canister is used to store reacting chemicals that provide for a uniform heat flux �������� " to its inner surface. The canister is suddenly submerged in a liquid bath of temperature T ∞< Ti where Ti is the initial temperature of the canister wall.
Cannister ri ro
Liquid T∞, h qi"
ρ = 8000 kg/m3
c = 500 J/kg K
ri = 0.5 m
ro = 0.6 m
T∞ = 300 K
a) Assuming negligible temperature gradients in the canister wall and a constant heat flux qi", develop an equation that governs the variation of the wall temperature with time during the transient process.
b) Develop an expression for the steady temperature of the wall.
c) The convection coefficient depends on the velocity of the fluid and whether or not the wall temperature is large enough to induce boiling in the liquid bath. For the parameters listed below, compute and plot the steady-state temperature as a function of h for the range 100 < h < 10,000 W/m2 K. Include curves for �������� " = 105, 2x10⁵, and 3x10⁵ W/m2. Put all three curves on a single graph.
d) Is there any value of h below which operation would be unacceptable?
Solution
a) Mathematical Model
b) At steady-state
Problem 10.12
Consider the system �������� /�������� = ���� ∙ ���� ���� 3 . For ���� < 0, ���� = 0, ������������ ���� > 0:
a) Use linear stability analysis to classify the fixed points.
b) Plot the phase portraits and the anticipated solutions, x(t) versus t.
Solution
The fixed points ���� ∗ = 0 and ± √���� are found from setting �������� /�������� = 0. Stability is ascertained from the sign of ��������(���� ∗ ) �������� = ���� 3���� ∗ 2 . The bifurcation point is rc = 0 since real fixed points ���� ∗ =
±√���� exist only for 0 ≥ r . The findings are:
• ���� < �������� : one fixed point, stable at x* = 0
• ���� = �������� = 0: one fixed point, stable at x* = 0, but weakly stable
• ���� > �������� : 3 fixed points, unstable at x* = 0, stable at ���� ∗ = √����, and stable at ���� ∗ = √����
The following phase portraits and solutions with fixed points and bifurcation diagram reveal the dynamics of this system.
Problem 10.13: Bifurcations
Consider the following first order ODEs.
Case 1: �������� �������� = ���� �1 + ���� 1+���� 2 �
Case 2: �������� �������� = �������� + ���� 1+����
a) Find all the fixed points.
b) Find any critical values r c at which bifurcations occur. What type of bifurcations occur (saddle-node, transcritical, supercritical pitchfork, or subcritical pitchfork)?
c) Classify the stability of the fixed points. Collect your results in a table.
d) Sketch the bifurcation diagram: x* versus r.
e) Sketch the phase portraits and corresponding solutions for each qualitatively different behavior.
Solution
Case 1
A bifurcation occurs at �������� = 1. Subcritical pitchfork bifurcation.

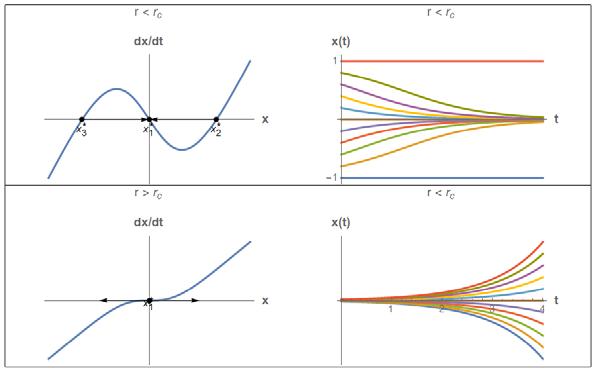
A bifurcation occurs at �������� = 1. Transcritical bifurcation. ���� < �������� ���� > ��������
����1 ∗ = 0 unstable stable
����2 ∗ = 1 ���� 1 stable unstable

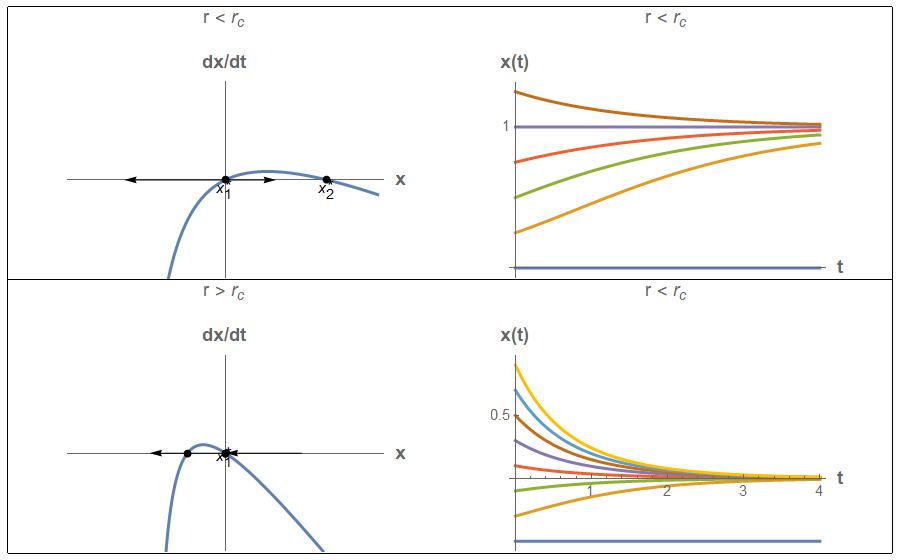
Problem 10.14: Transient Parameter
Consider a first order ODE of the form �������� �������� = ���� (���� , ����) where r is a parameter. The phase diagrams for two different values of the parameter r are shown.

Consider a process where the parameter r is at a value r1 for a quite some time and then changes to a new value r2. Sketch the resulting dynamic response of the system (x(t) versus t) starting from initial states x0 = -4, -2, 0, and 2.
Solution

Problem 10.15: Improved Laser
An improved model of a laser is
a) Assuming �������� �������� ≈ 0, derive a differential equation for n
b) Show that n* = 0 becomes unstable for p > pc. Determine pc.
c) What type of bifurcation occurs at pc
d) For what range of parameters is it valid to assume that �������� �������� ≈ 0?
Solution
a) Adiabatic elimination
Assume �������� �������� ≈ 0. Then, ���� = ���� ��������+����. The differential equation for n becomes:
b) Fixed Points
The fixed points are the values n* where �������� �������� = 0.
We find 2 possible fixed points:
Stability Analysis of the fixed Points
of n1*=0
We see a critical value of p,
of n2*
We see a critical value, �������� = ����
: Stable
: Unstable
, again dictates stability.
: Unstable
: Stable
c) Type of Bifurcation
We have a transcritical bifurcation.
d) Validity of the Adiabatic Elimination Assumption
Consider two linear, uncoupled differential equations:
These have solutions
If a2 >> a1, then x2 will relax or approach steady state much faster than x1. Under such conditions, we could assume dx2 dt ≈ 0. Our equations are both nonlinear and coupled, however, let’s try to apply the same line of reasoning.
Our logic would dictate that �������� + ���� ≫ ���� ��������. The trouble is that n and N are variables. However, at fixed point-1, we have
Substitute to find
Similarly, fixed point-2,
Substitute and we find,
Thus, the criteria for validation of the model are
Problem 10.16: Biochemical Switch
Zebra stripes and butterfly wing patterns are two of the most spectacular examples of biological pattern formation. Explaining the development of these patterns is one of the outstanding problems of biology. As one ingredient in a model of pattern formation, consider a simple example of a biochemical switch, in which a gene G is activated by a biochemical signal substance S. For example, the gene may normally be inactive but can be “switched on” to produce a pigment or other gene product when the concentration of S exceeds a certain threshold. Let g(t) denote the concentration of the gene product, and assume that the concentration so of S is fixed. The model is
where the k’s are positive constants. The production of g is stimulated by s o at a rate k1, and by an autocatalytic or positive feedback process (the nonlinear term). There is also a linear degradation of g at a rate k2.
a) Show that the system can be put in the dimensionless form
where r >0 and s ≥ 0 are dimensionless groups. What are the dimensionless variables and parameters?
b) For s = 0, find and classify all the positive fixed points x*. Is there any critical values rc? Determine and plot the fixed points for all r and s.
c) Find the parametric equations for the bifurcation curves in (r, s) space, and classify the bifurcations that occur. Plot the stability diagram in (r, s).
d) Assume that initially there is no gene product, i.e., g(0) = 0, and suppose s is slowly increased from zero (the activating signal is turned on); what happens to g(t)? What happens if s then goes back to zero? Does the gene turn off again? Support your findings using phase plots and numerical solutions of the x vs. τ behavior.
Solution
(a) Dimensionless Form
(b) Fixed Points for s=0
Fixed
The two positive fixed points only exist if ���� < �������� = 1/2. The phase plots for various r values and s =0 are shown below.
(c) Fixed Points
Next the more general fixed point diagram in r-s space is shown. The fixed points are the solution of a cubic equation, resulting in a fold and cusp.
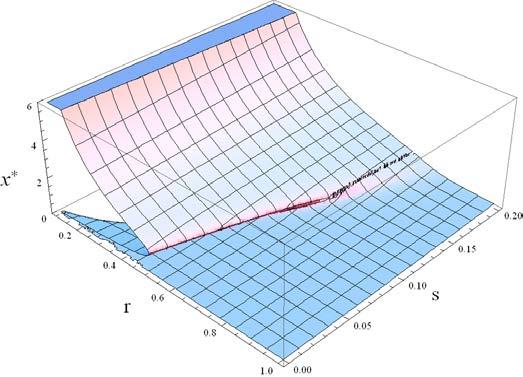
(d) Phase Portraits and Bifurcation Diagram
It seems that rc = 0.5 is an interesting value for r. In addition, it would be interesting, as suggested in the problem, to start at zero and slowly increase s. A sequence of phase portraits is shown below.
The mathematical explanation behind the biochemical switch is now revealing itself. Starting from an initial state of x0 = 0, as s increases slowly the gene concentration rises slowly to the lower stable fixed point. At around s = 0.068, a saddle node bifurcation occurs as the smaller
two fixed points disappear. x then shoots to the larger stable fixed point, causing a switchinglike mechanism where x changes rapidly from a low value to a high value. The phase portraits show that the saddle node is the only possible type of bifurcation.
Note a hysteresis effect. If s is slowly decreased the gene level x will not return to the low level, it will stay at the higher activated level.
Next is a stability diagram in r-s space is shown. Derivations are in the Appendix.
Based on this stability diagram and previous conclusions from our phase portraits, we can qualitatively sketch the solutions for all (s, r) combinations.
(e) General Dynamical Behavior
Let’s thus examine the dynamical behavior for r = rc =0.5 as s is increased.
Note that a switching phenomenon occurs between s = 0.068 and 0.07. For s =0.07, the x vs t behavior shows a slow rise or bottleneck (the ghost of the annihilated fixed points), followed by a rapid rise to an elevated level.
Problem 10.17: Trout Fishing in Stocked Streams
Fishing in stocked trout waters usually involves a sudden addition of fish on stocking days immediately followed by lots of fisherman feverishly trying to catch them. The rate of fish caught is usually proportional to the number of fish still available. Assuming no natural reproduction, the following model is proposed.
(
)
The stocking function is modeled as a periodic sequence of regularly spaced pulse functions as shown where
Nst = number of fished per stocking
������������ = time between stockings
∆t = time required for each stocking
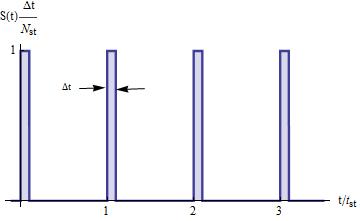
a) Express the stocking function S(t) in mathematical form.
b) Determine the analytical solution for a single stocking event. Name this function �������� (���� , ����) where i = 1,2,3,.. is the ith stocking event.
c) Determine the general solution for a sequence of stocking events in terms of the function �������� (���� , ����).
d) Determine the limit as Δ���� → 0.
e) Plot your solution from part (d). Use parameter values that make sense.
Solution
(a) Stocking Function
(b) Unit Response
(c) Pulsed Response
(d) Total Solution
(e) Limit as Δt → 0
(f) Numerical results for r = 0.1 and r = 0.25 are displayed.

Problem 10.18: A Model of a Fishery
The equation �������� �������� = �������� �1
provides a simple model of a fishery. Here N(t) is the number of fish. In the absence of fishing, the population is assumed to grow logistically. The effects of fishing are modeled by the term, –H, which says that fish are caught or “harvested” at a constant rate H > 0, independent of the fish population N. This assumes that the fishermen are not worried about fishing the population dry; they simply catch the same number of fish every day.
a) Show that the system can be rewritten in dimensionless form as ��������
(1 ���� ) ℎ
What are the dimensionless variables x, τ, and h?
b) Determine the fixed points. Classify the stability of the fixed points. Show that a bifurcation occurs for a certain critical value hc. What type of bifurcation is this? Plot a bifurcation diagram (x* versus h).
c) Plot separate phase portraits for 0 < h < hc, h = hc, and h > hc..
d) Plot the solutions x(t) vs. τ for 0 < h < hc, h = hc, and h > hc. Create 3 plots, one corresponding to each range of h. Include several initial conditions on each plot.
e) Discuss any unrealistic aspects of this model. Can you suggest an improved model? Sketch the anticipated solution for your improved model.
Solution
(a) Dimensionless Form
(b) Fixed Points
A bifurcation occurs at �������� = ����/����. This is a saddle bifurcation.

(c) And (d) Phase Portraits and Solutions
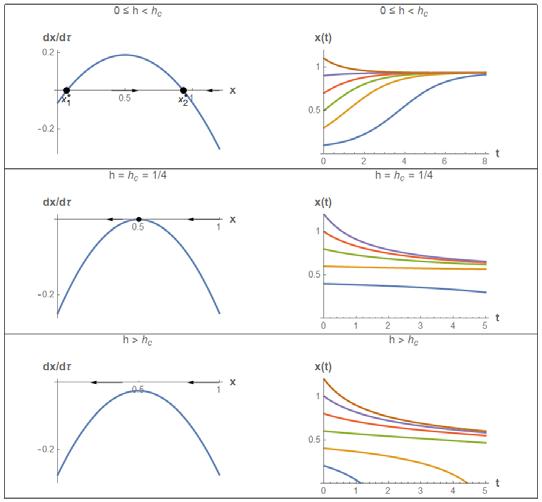
(e) Improved Model
This model can predict “negative fish” or perhaps I should say “anti-fish”. Also, the harvesting rate should be related to the number of available fish. The harvesting rate should be zero for zero fish and should reach a saturation limit (how many all-you-can-eat fish buffets can we stand). It would be better to replace H by something like: ���� (����) = ���������������� ���� 2 ����2 + ���� 2
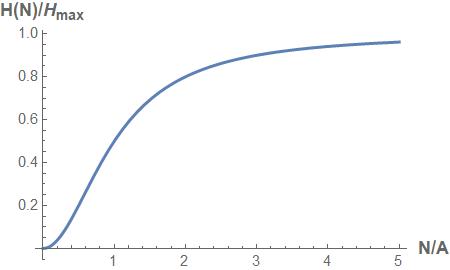
Problem 10.19: Improved Model of a Fishery
The equation
provides a model of a fishery. Here ���� (����) is the number of fish. In the absence of fishing, the population is assumed to grow logistically. The effects of fishing are modeled by the term ����
where ���� > 0 and ���� > 0, which says that fish are caught or “harvested” at a rate that decreases with the fish population N. This is plausible since it gets harder to catch fish as the population decreases.
a) Show that the system can be rewritten in dimensionless form as ��������
What are the dimensionless quantities x, τ, a, and h?
b) Determine the fixed points. Classify the stability of the fixed points using linear stability analysis. Collect your findings in an organized table. What types of bifurcations occur?
c) Plot the stability diagram in (a, h) space. Can hysteresis occur in any of the regions?
d) For each qualitatively different behavior plot
Solution
(a) Dimensionless Form
(b): Fixed Points
Bifurcations
Stability of the Fixed Points

(c) Stability Diagram

Note that there are three different qualitative behaviors. Hysteresis is possible. Imagine the variable a<1 and slowly vary h back and forth.
(d) Phase Portraits and Solutions

Chapter 11
Second Order Ordinary Differential Equations
Linear Systems
Problem 11.1.1
The motion of a linear damped harmonic oscillator is described by
where b ≥ 0 is the damping coefficient.
a) Rewrite this equation as simultaneous first order equations.
b) Classify the fixed point at the origin and plot the phase portrait. Be sure to show all the various cases that can occur, depending on the relative sizes of the parameters.
c) How do your results relate to standard notions of overdamped, critically damped, underdamped, and undamped vibrations?
Solution
a) Decomposition into coupled first order equations
In vector form
b) Classification of Fixed Point
The only fixed point is clearly at (0,0). The character of this system is revealed by examining the eigenvalues, obtained from the characteristic equation.
The system behavior is indicated by
The eigenvalues always have a negative real part (τ < 0). However, there is a clear behavior change when the quantity under the square root changes sign. This value of b is designated as bcr
At this point it seems natural to define a natural frequency, defined as
It now also seems natural to express b in terms of ω
and bcr
eigenvalues
The solution classification is summarized in the following table.
Standard Notions in Vibrations b = 0 or ���� = 0 Purely imaginary Center Undamped
b < bcr or 0 < ���� < 1 Complex conjugates, negative real parts Stable spiral Underdamped
b = bcr or ���� = 1 negative real (repeated) star or degenerated node Critically damped
b > bcr or ���� > 0 negative real Stable node Overdamped
Phase Portraits: ���� = b/bcr

Problem 11.1.2
Consider the following system of linear ODE’s.
a) Determine the fixed points.
b) Determine the eigenvalues and the corresponding eigenvectors.
c) Classify the fixed point for various values of parameters a and b
d) Sketch phase portraits showing all the qualitatively different behaviors.
e) Determine the solution x(t) and y(t) for a = 0, x0 = 0, and y0 = 1.
Solution
a) Fixed points
Solve to get
b) Eigenvalues and eigenvectors
Eigenvectors for
This equation must be singular, thus
Eigenvectors for
This
c)
< 0
Stability is not affected by b
One positive, one negative Saddle
Complex conjugates, Purely imaginary Center
Problem 11.1.3
Consider the system of linear ODE’s
This system is non-homogeneous due to the presence of the terms p and q.
a) Determine the fixed points (����
, ����
).
b) What variable change would transform this to a homogeneous system (one with p and q zero)?
c) Are the eigenvalues and stability of the system affected by the presence of the nonhomogeneous terms p and q? If your answer is yes, explain how?
d) Let’s say that for a certain combination of parameters the homogeneous problem is a center. With the presence of the non-homogeneous terms p and q the fixed point is determined to be (
, ����
Solution
) = (1,0). Sketch the phase portrait.
a) Fixed points
Solve using Cramer’s rule.
b) Variable change
c) No, the presence of the non-homogeneous terms p and q simply shifts the fixed points. Stability of the shifted points is not affected.
Problem 11.1.4
Consider a series LRC circuit equation:
where L, C > 0 and R ≥ 0.
a) Rewrite the equation as a two-dimensional linear system.
b) Show that the origin is asymptotically stable if R > 0 and neutrally stable if R = 0.
c) Classify the fixed point at the origin. Plot the phase portrait in all cases.
Solution
a) Define:
The second order system then decomposes as two first order ODE’s
b) Analysis of the fixed point (����1 , ����2 ) = (0,0) is the only fixed point. Since the system in linear, the eigenvalues will indicate the global behavior.
R > 0: ���� < 0, ���� > 0, the origin is stable.
R = 0: ���� = 0, ���� > 0, the origin is neutrally stable (center).
c) Classification of the fixed point
The origin is a stable spiral (or a center if R = 0). This often called under damped
The origin is a star or degenerate node. This often called critically damped
The origin is a stable node. This often called over damped
Problem 11.1.5
Consider the two-dimensional system of equations
a) Express the system in matrix form.
b) Determine the eigenvalues of this system.
c) Classify the behavior of this system.
d) Sketch the phase portrait.
e) Sketch a typical solution.
Solution
a) Matrix form
b) Eigenvalues
c) Classification
This is a non-isolated fixed point (see Figure 11.3). For ���� > 0 it is stable For ���� < 0 it is unstable.
d) Phase Portrait


Problem 11.1.6
For each of the following cases:
a) Classify the stability of the fixed point based on the eigenvalues. Identify all the different possible types of behavior depending on the parameters a and b.
b) Determine the analytical solution using eigenvalues/eigenvectors. Carefully examine the case where sign(ab)=0.
c) For each different type of behavior identified in part (a), plot the phase diagram. Also plot the corresponding solution for the special case R0 = 1, J0 = 0.
Case 1: Jerry Springer
Case
2:
Out of Touch with Their Own Feelings
Suppose Romeo and Juliet are out of touch with their own feelings such that they react to each other but not to themselves.
Case 3: Fire and Water
Case 1 Solution: Jerry Springer
Unstable Spiral
b) Transient Behavior of Romeo and Juliet

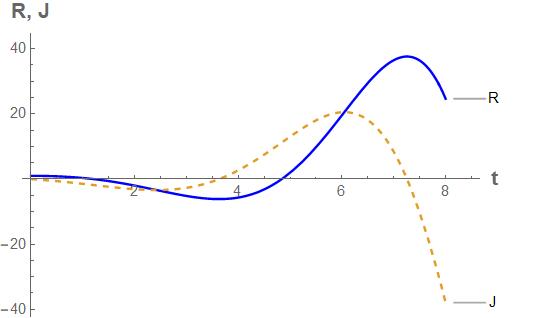
Case 2 Solution: Out of Touch
(a) Stability Analysis
The eigenvalues indicate 3 basic types of behavior. Sign
Behavior 1 positive (0,0) Saddle
Behavior 2 Negative (0,0) Center
Behavior 3 0 (0,J0) when a=0 (R0,0) when b=0 (R0,J0) when a=b=0
(b) General Analytical Solution
Non-isolated fixed points
The eigenvectors come from the non-trivial solutions of (���� �������� )���� = 0. The coefficients are determined by the initial conditions.
Eigenvalues Eigenvectors Coefficients
The special case of Sign(���� ⋅ ���� ) = 0requires L’Hospital’s rule or a separate analysis.
fora=0
Special Case of R0 = 1, J0 = 0
(c) Phase Diagrams and Solutions
Behavior 1: Saddle, ����������������(���� ∙ ����) > 0
a>0, b>0 is similar to a<0, b<0, except the arrows flow in the opposite direction.
Behavior 2: Center, ����������������(���� ∙ ����) < 0
a>0, b<0 is similar to a<0, b>0, with rotation in the opposite direction.
Behavior 3: Non-isolated fixed points, ����������������(���� ∙ ����) = 0
The case a = 0, b ≠ 0 is shown. The case where b = 0, a ≠ 0 is similar with lines in the phase plane parallel to R axis.
Case 3 Solution: Fire and Water
Analysis of Fixed Point at (0,0)
Problem 11.1.7
Suppose we have a system of three linear, first order, ordinary differential equations. The eigenvalues and eigenvectors are
����1 = 2 + ����
����2 = 2 ����
����3 = 1
����1 = [1,0,0]
����2 = [0,1,0]
����3 = [0,0,1]
Sketch the phase portraits in the x-y plane, x-z plane, and the y-z plane.
Solution
Unstable spiral in x-y plane. Saddle in the x-z plane. Saddle in the y-z plane.
Non-Linear Systems
Problem 11.2.1: Solutions from Phase Portraits
The phase plot for a second order system is shown.

a) Speculate on the location and stability of the fixed points.
b) Plot solutions x(t) and y(t) starting from initial conditions (����0 , ����0 ) = (1,1).
Solution
a) There appears to be a saddle at (-2,-2) and a unstable spiral at (2,2).
b)

Problem 11.2.2
Consider the following non-linear second order systems.
a) Determine all the fixed points.
b) Classify the stability of the fixed points.
c) Sketch the phase portrait.
d) Sketch the solution starting from the initial conditions
Solution System 1
Stability of Fixed Points The Jacobian
Portrait

Solution System 2
Fixed Points (����1 , ����1 ) = (0,0) (����2 , ����2 ) = ( 2, 2) (����3 , ����3 ) = (2, 2)
Stability of Fixed Points
The Jacobian is:
= � 4 12 3 11�⇒ {
= 7| ⇒ Saddle point (b) x = y If x = y, then
The rate of change is the same for x and y, thus the trajectory stays on the line x = y. (c)
Phase Portrait

Problem 11.2.3


Consider an undamped pendulum of mass m driven by a constant torque, T (N m).
a) Derive the equation of motion for the angular position, θ(t).
b) Change variables in order to express the equation of motion in the form
What are the variables τ and γ?
c) Find all the equilibrium points and classify them as γ varies.
d) Is the system conservative? If so, find a conserved quantity.
e) Using computer generated solutions, plot phase portraits for various values of ���� .
f) Find the approximate frequency of small oscillations about any centers in the phase portrait.
Solution
a) Equation of motion
Newtons’s 2nd law of motion for a rotating system is
I = mass moment of inertia = L2 m (for a concentrated mass). Application to the pendulum gives
b) Variable Change
Define the natural frequency and dimensionless time as
Decompose the system into coupled first order equations.
c) Analysis of Fixed Points
Equilibrium requires
sin(���� ∗) = ���� or arcsin(γ) = θ*
Note that the formal ‘arcsin’ function on most computers is usually restricted between -π/2 and π/2. This equilibrium condition can be visualized graphically by plotting sin(θ) and γ and noting the intersections. We see that for |���� | < 1 we have two fixed points, while for |���� | > 1 fixed points do not exist.
To perform a linearized stability analysis, determine the Jacobian ���� =
The fixed points are classified according to ranges of the driving torque parameter.
|
γ | < 1
1) θ1* = arcsin(γ)
trace(A) = 0 , det(A) = cos(θ1*) > 0 → Center
2) θ2* = π - arcsin(γ )
trace(A) = 0 , det(A) = cos(θ1*) < 0 → Saddle point
| γ | = 1
Here θ1* = θ2* = π/2 and the fixed point becomes precarious.
|
γ | > 1
No fixed points can exist. The driving torque is too strong and the pendulum whirls around.
d) Conservative quantity
Let’s look for a conservative quantity. Multiply the equation of motion by velocity.
Thus a conserved quantity does exist
This is a statement of conservation of energy:
Kinetic energy + Potential energy – Work added = constant
e) Results
Imagine the pendulum at the lowest position (θ = 0) with various initial velocities. We can then plot a phase portrait for various values of the driving parameter, γ.
Fig 1: γ = 0
f) Small oscillation approximation
Fig 2: γ = 0.5
Fig 3: γ = 1
Small oscillations can only occur for | γ | < 1. The angle must be close to the center fixed point θ1*. Define a small perturbation about θ1*
Substitute into our equation of motion in dimensionless form
Now use the small angle approximations
The dimensionless natural frequency of this system is
Thus, we see an approximate frequency for small oscillations about the centers emerge
Problem 11.2.4: Bifurcations
Consider the system
a) Determine all the fixed points. What is the critical value µc at which a bifurcation occurs?
b) Classify the stability of the fixed points.
c) Plot a phase portrait for µ < µc and one for µ > µc.
Solution
a) Fixed points occur when
Solve to get
The critical value is �������� = 1. No real fixed points exist for ���� > �������� .
b) Stability of fixed points
The eigenvalues are determined from
This is a saddle point for ���� > �������� = 1.
Similarly for at ����2 ∗ = 1 �1 ���� we find
This is a stable spiral for ���� > �������� = 1.
c) Phase Portraits


Problem 11.2.5: Bead on a Wire
Consider a bead of mass m constrained to slide along a wire. Suppose that the motion is opposed by a viscous damping force b dx/dt.

x = coordinate along wire, measured from closest point to the spring support
m = mass
k = spring stiffness
L0 = relaxed length
a = distance between support point and wire
a) Derive Newton’s law for the motion of the bead.
b) Transform the equation of motion into the following dimensionless form.
Determine these dimensionless variables and parameters.
c) Find all possible equilibrium points (fixed points) Identify any bifurcations and determine critical parameter values.
d) Consider the highl y damped case.
1.Under what conditions can we neglect the acceleration term (second derivative term) compared to the damping term?
2.Classify the stability of all the fixed points for this case.
3.Plot the bifurcation diagram (X* vs A). What kind of bifurcation do we have?
4.Plot phase portraits for A > 1, A = 1, and A < 1 Plot some solutions corresponding to each of these phase portraits.
e) Now consider the general case.
1.Classify the stability of all the fixed points.
2.Plot phase portraits A > 1, A = 1, and A < 1 Plot some solutions corresponding to each of these phase portraits. Create a set of plots for B=0 and another set for a B=0.1.
f) Now consider an inclined wire, shown on p. 73 in the text.
1.Derive Newton’s law for the motion of the bead.
2.Determine and classify all the fixed points for this case.
Solution
a) Equation of Motion
Forcing Functions
b) Dimensionless Form
Decomposition into a system of first order ODE’s
c) Fixed Points
A supercritical pitchfork bifurcation occurs for a = ac = L0 or in dimensionless variables when A = Ac = 1.
d) Highly Damped Case
d.1) When is the highly damped approximation valid?
d.2) Stability of Fixed Points
X= 0 is always an equilibrium position. Stability depends on the size of A
A>1: spring is in tension, X = 0 is a stable
A<1: spring is in compression, X = 0 is an unstable with a pair of stable points on either side.
d.3) Bifurcation Diagram: Supercritical Pitchfork

d.4) Highly Damped: m = 0 or B>>1
Fig. 1: Phase portraits and solutions r = A= a/L0, rc = Ac = 1.
e) General Case
e.1) Stability of the Fixed Points
Non-isolated fixed point:
Non-isolated fixed point:
Solution shows a center for B=0 and a stable spiral for B>0

Fig 2: Stable fixed point at (0,0),:B=0 (center), B=0.1 (stable spiral), B=1 (stable node)
Phase Portraits and Solutions for A<1
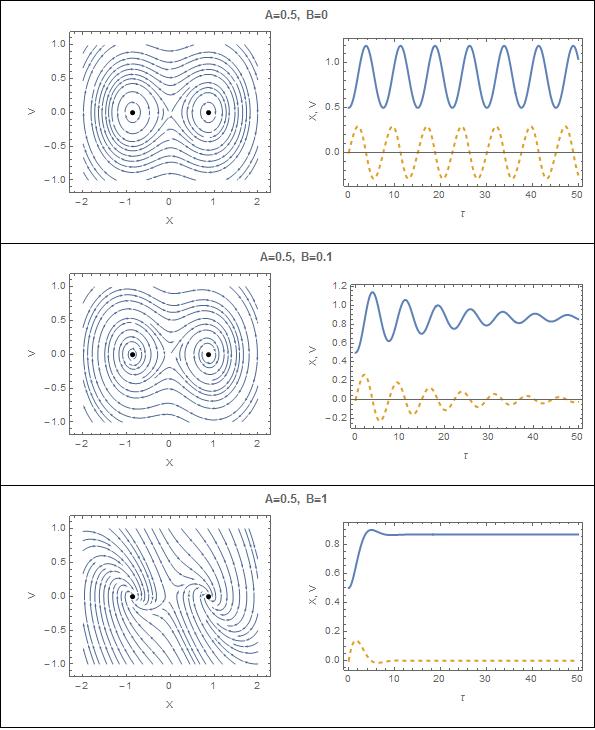
Note that there are 6 different qualitative behaviors.
Fig 3: Stable fixed point at (±√���� �������� ,0)
B=0 (center), B=0.1 (stable spiral), B=1 (stable node)
f) Tilted Wire
Equation of Motion
Dimensionless Form
Variables:
A new dimensionless parameter has emerged:
Fixed Points
The fixed points come from the roots of
Actually, the term ���� ∙ ������������(���� ) can be considered as a single push.
These fixed points cannot be determined analytically but can be visualized graphically and determined numerically. For instance, the following bifurcation diagram is for F=0.1
Bifurcation diagram is for F=0.1
Problem 11.2.6
Consider the bead of mass m constrained to slide along a wire as described in Problem 11.2.5. A constant force f is applied and the motion is opposed by a viscous damping force ���� �������� /��������
a) Derive Newton’s law for the motion for the bead.
b) Transform the equation of motion into the following dimensionless form.
Determine these dimensionless variables and parameters.
c) For F=0,
1. Find and classify all possible fixed points
2. Plot the bifurcation diagram (X* vs A).
3. Plot phase portraits for each qualitatively different behavior.
d) For any F,
1. How do you find the fixed points? Create a function to determine them.
2. Classify the fixed points
3. Plot bifurcation diagrams (X* vs A) for F=0.01, F=0.1, F =0.5, and for F=1. Also plot a 3D bifurcation diagram showing X* as a function of A and F
4. Plot phase portraits and some solutions for each qualitatively different behavior.
Solution Summary
(a) Equation of Motion
Functions
(b) Dimensionless Form
Decomposition into a system of first order ODE’s
c) Zero Forcing
(c.1) Fixed Points: F = 0
Real Variables
Dimensionless Variables
Table 1: Stability of the Fixed Points: F = 0 (
(0,0)
A < 1 Saddle B=0: Center ���� < �4(1 ����2 ): Stable spiral ���� > �4(1 ����2 ): Stable node
A = 1 Non-isolated fixed point: Solution shows a center for B=0 and a stable spiral for B>0
A > 1 B=0: Center
: Stable spiral
: Stable node
(c.2) Bifurcation Diagram: Supercritical Pitchfork
Non-isolated fixed point: Solution shows a center for B=0 and a stable spiral for B>0
Does not exist
(c.3) Phase Portraits and Solutions: B = 0 (X = solid line, V = dashed line)
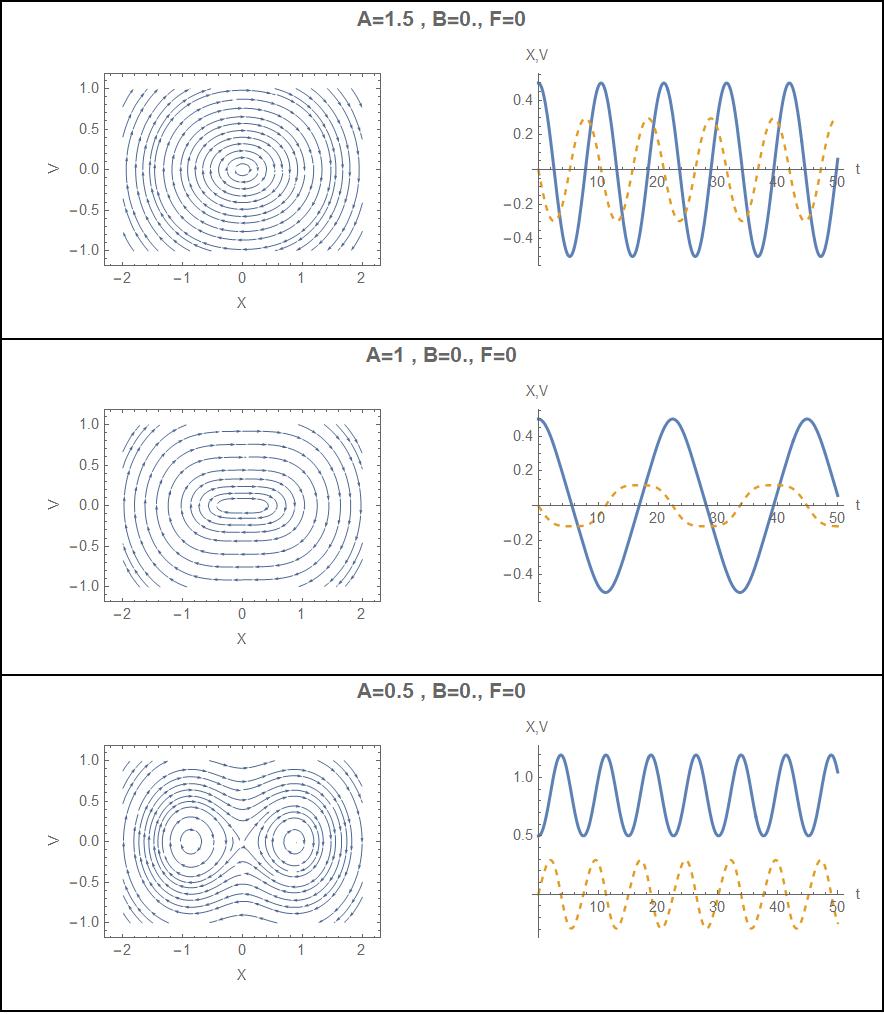
Phase Portraits and Solutions: B = 0.2 (X = solid line, V = dashed line)

(d) Constant Forcing
(d.1) Fixed Points
The fixed points come from the roots of
These fixed points cannot be determined analytically but can be visualized graphically and determined numerically using non-linear algebraic methods such as the bisection or NewtonRaphson methods.

(d.2) Classification of Fixed Points
Note that a saddle bifurcation occurs when F reaches some critical value Fc. This value occurs when
Solving �������� �������� = 0 gives (see Mathematica code for details)
Substituting into ���� = 0then gives
A<1
0<F<Fc
A<1
Table 1: Stability of the Fixed Points for F > 0
B = 0: Center B > 0: Stable node or spiral Saddle
F>Fc DNE DNE
A>1
AllF DNE DNE
B = 0: Center
B > 0: Stable node or spiral
B = 0: Center
B > 0: Stable node or spiral
B = 0: Center
B > 0: Stable node or spiral
As depicted in the following bifurcation diagrams, ���� ∗ is the left most point ����0 ∗ is the middle point and ����+ ∗ is the right most point. Note that for F = 0,
The points ���� ∗ ������������ ����0 ∗ disappear in a saddle bifurcation as when F becomes greater that Fc.
(d.3) Bifurcation Diagrams


Problem
11.2.7
The Kermack-McKendrick (1927) model of an epidemic is ��������
x = number of healthy population
y = number of sick population
r = death rate constant for sick people
k = infection rate constant
The equation for the deaths plays no role in the model and is omitted.
a) Find and classify all the fixed points
b) Sketch the nullclines and vector field
c) Find a conserved quantity for the system
d) Plot the phase portrait. What happens as t → ∞
e) Let (xo,yo) be the initial condition. An epidemic is said to occur if y(t) increases initially. Under what conditions does an epidemic occur?
Solution
a) Fixed Points y* = 0 for any x*
= 0
b) Vector Field
c) Conserved Quantity
Non-isolated fixed point
d) Phase Portrait: ���� = ℓ = 1

As t → ∞, y → 0 and x approaches a point between 0 and l/k
e) Epidemic Conditions
Problem 11.2.8: Predator Prey Model
Considered the system
where x ≥ 0 is the dimensionless population of the prey, y ≥ 0 is the dimensionless population of the predator, and a≥ 0 is a control parameter.
a) Plot the nullclines in the first quadrant x, y ≥ 0.
b) Find the fixed points. Classify the stability of these fixed points.
c) Plot the phase portrait for a >1, and show that the predators go extinct.
d) Show that a Hopf bifurcation occurs for at ac= ½. Is it subcritical or supercritical?
e) Estimate the frequency of the limit cycle oscillations for a near the bifurcation.
f) Plot the topologically different phase portraits for 0 < a <1.
(b) Fixed Points and Stability
√3/2 stable spiral
√3/2 star
Solution (a)
(c) Phase plot for a > 1
(d) Examination of the eigenvalues of the fixed point �����, ����(1 ����)� indicate the real part of the eigenvalues changes from positive to negative at a = ac = ½. A plot of the real and imaginary parts of the eigenvalues is shown. Graphical observations indicate a super critical bifurcation.
Re - solid, Im - Dashed
(e) According to Strogatz, p. 251, ���� = ��������(����) evaluated at a = ac =1/2. Thus
(f) Phase portraits for the different behaviors.
Problem 11.2.9
Consider the predator-prey model.
where x, y > 0 are the populations and a, b > 0 are parameters.
a) Sketch the nullclines and discuss the bifurcations that occur as b varies.
b) Show that a positive fixed point x* > 0, y* > 0 exists for all a, b >0. (Don’t try to find the fixed point explicitly; use a graphical argument instead).
c) Show that a Hopf bifurcation occurs at the positive fixed point if
= 4(���� 2)
2 (���� + 2)
and b > 2. (Hint: A necessary condition for a Hopf bifurcation to occur is ���� = 0, where τ is the trace of the Jacobian matrix at the fixed point. Show that ���� = 0 if and only if 2x* = b – 2. Then use the fixed point conditions to express a, in terms of x*. Finally, substitute x* = (b –2)/2 into the expression for a, and you’re done.)
d) Using a computer, check the validity of the expression in (c) and determine whether the bifurcation is subcritical or supercritical. Plot typical phase portraits above and below the Hopf bifurcation.
Solution
Parts (a) and (b)
From the nullclines, 3 fixed points are apparent: (x*,y*) = (0,0), (b,0), and the other one at the intersection of ���� ���� ���� 1+���� = 0 and ���� 1+���� �������� = 0 that has no exact algebraic expression. From the nullclines only, I find it impossible to anticipate a bifurcation. After creating the vector field along with the nullclines, a bifurcation from a stable spiral (for a > ac) to an unstable spiral (a < ac) can perhaps be anticipated. I was not totally convinced until I plotted phase plots of the solution however.

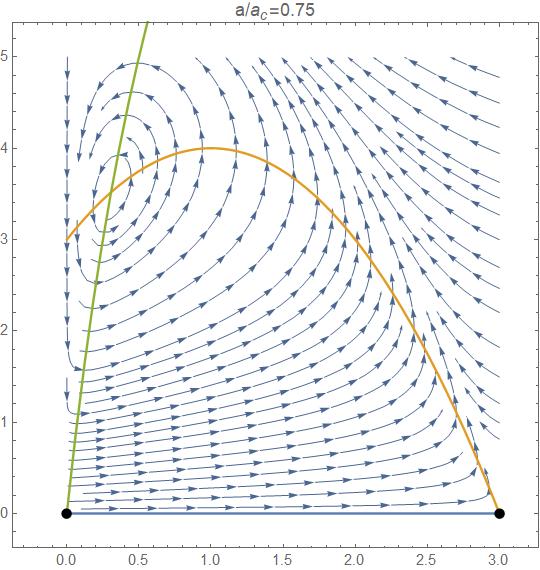
Part c
After following the suggestions, I was able to show that ���� = �������� = 4(���� 2) ���� 2 (���� + 2)
Part d
The phase portraits above and below ac clearly show the Hopf bifurcation. Slowly crossing ac indicates a supercritical Hopf bifurcation.

a/ac > 1: Stable spiral
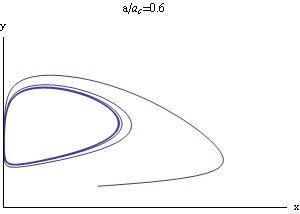
a/ac < 1: Unstable spiral going to a limit cycle
Problem 11.2.10
In Problem 10.15 an improved model of a laser was introduced. �������� �������� = ������������ − ��������
�������� = ������������ �������� + ����
N(t) = number of exited atoms
n(t) = number of photons in laser field
G = gain coefficient for stimulated emission
k = decay rate of the photons
f = decay rate for spontaneous emission
p = pump strength
All parameters are positive.
a) Non-dimensionalize the system. Use photon parameters as reference quantities.
b) Find the fixed points. Classify the fixed points using linear stability analysis.
c) Plot the stability diagram for the system. What types of bifurcation occur?
d) Plot all the qualitatively different phase portraits and transient responses.
Solution Summary
a) Non-dimensional System
b) Stability of the Fixed Points (x*,
(0, ����/���� ) Stable node
Saddle
Saddle (���� ���� , 1) does not exist Stable spiral Stable node
This table reveals three distinct behaviors, as derived using linearized stability analysis.
A transcritical bifurcation occurs when S = F
• For S < F, the device acts as a lamp with a stable fixed point �0, ���� ���� �. There are no atoms in laser field
• For S > F, the device acts as a laser with a stable fixed point (���� − ���� , 1), which can be either a node or a spiral.
c) Stability Diagram

d) Phase Portraits and Solutions
Representative solutions are shown for each of the three qualitatively different cases.
Case 1: ���� < ����
Stable node at �0, ���� ���� �
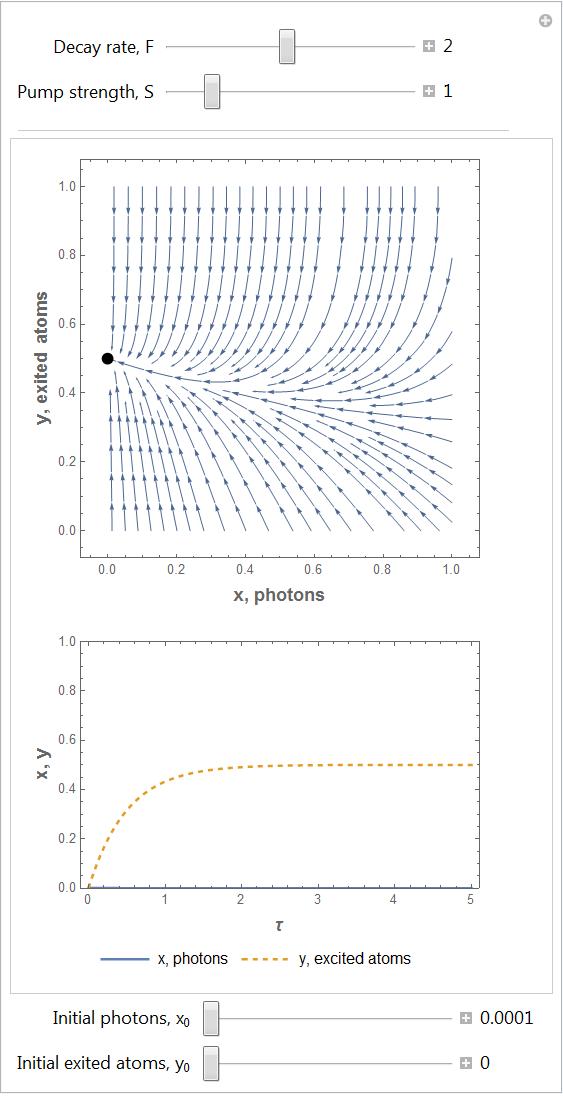
Case 2: ���� > ���� and �������� �������� + �������� < ����
Stable spiral at (���� ���� , 1)
at (0, ����/���� )
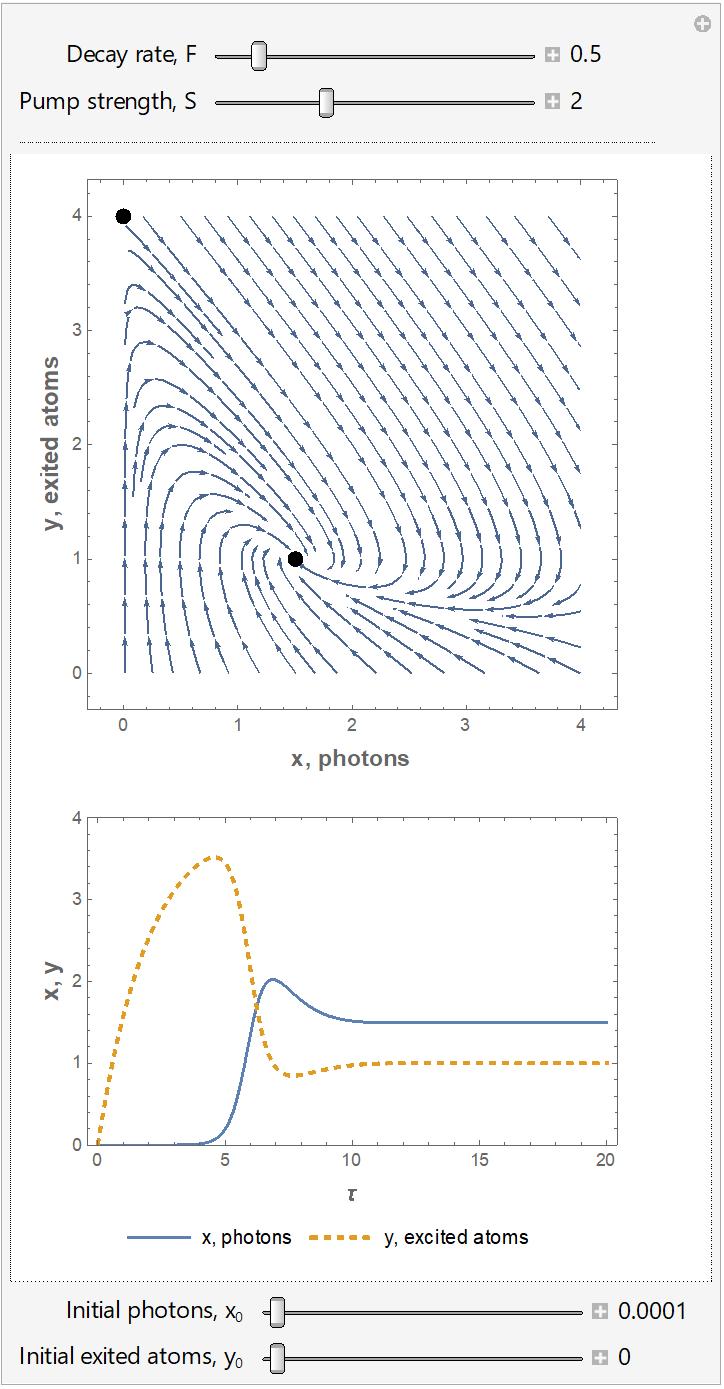
Saddle
Case 3: ���� > ���� and �������� �������� + �������� < ����
Stable node at (���� ���� , 1)
Saddle at (0, ����/���� )

Problem 11.2.11: Two-Mode Laser
A two-mode laser produces two different kinds of photons with numbers n1 and n2. By analogy with the simple laser model, the rate equations are
���� (����) = ����0 ����1 ����1 ����2 ����2 is number of excited atoms n1 and n2 are the number of photons. The parameters ����1 , ����2 , ����1 , ��������2 , ����1 , ����2 , and N0 are all positive.
a) Find and classify all the fixed points.
b) Depending on the values of the parameters, how many qualitatively different phase portraits can occur? For each of the qualitatively different phase portraits, what does the model predict about the long-term behavior?
Solution
Mathematical Model
Fixed Points
It would help to first draw the nullclines.

Note that ����1 = 0 always makes
= 0 and ����2 = 0 always makes
= 0. Thus (0,0) is a fixed point. We identify another fixed point when ����1 = 0 if we also require
This fixed point only exists when
> 0. Similarly, another fixed point can be found at
This fixed point exists only when
> 0. Another possibility is for
These lines have the same slope so they can be true simultaneously only if
In summary, our fixed point possibilities are
All points along the line
Analysis of Fixed Points
The Jacobian matrix is
Analysis of Fixed Point (n1*, n2*) = (0 , 0)
Stability depends on the signs of
A table is useful for summarizing the possibilities.
The only stable or attracting combination is
Sign of τ Sign of ∆ Stability of (0, 0)
node
Saddle point
Stable node
and
. Note that the discriminate, τ2 – 4 ∆ > 0 for all cases. The reasoning is that we have the form
>
Thus, no spirals exist.
Analysis of Fixed Point (n1*, n2*) =(0,
Since
Stability depends on the signs of
to exist. Sign
Sign
The only stable or attracting combination is
Analysis of Fixed Points Along Line ��������
This case is restricted to the case
Note that τ <0 and ∆ = 0. This is a line of non-isolated fixed points. They are stable or attracting.
Summary
We have only 4 qualitatively different phase portraits, corresponding to combinations of parameters where each of the 3 fixed points takes its turn being stable.
Case sign of a =����0
Long-term Behavior of (n1, n2)
1 - - (0, 0)
2a + -
2b - +
4 + + (n1, n2) on the line ����0 ����1
Case 4 is the most interesting since both modes of the laser can be active simultaneously, depending on the initial conditions.
Case 1
In the following graphs, (a,b

Case 2a

Case 2b
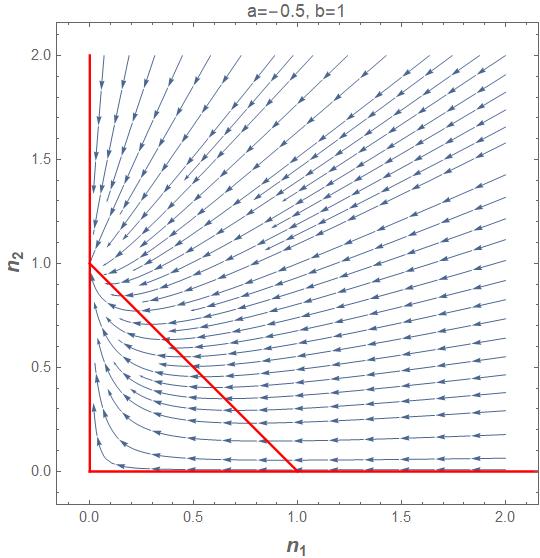

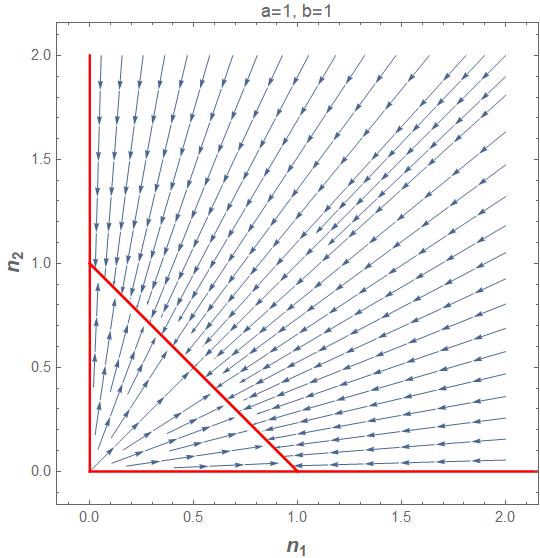
Problem 11.2.12: Budworms vs. Forest
S = Average size of trees
E = Energy reserve; a measure of health
B = constant budworm population
a) Interpret the terms in the model biologically.
b) Nondimensionalize the system.
c) Plot the nullclines. Show fixed points. Identify the type of bifurcation that occurs.
d) Plot the phase portraits.
Solution
a) Biological Interpretation
rs = growth rate for S
rE = growth rate for E
Ks = carrying capacity for S
KE = carrying capacity for E
P = rate parameter relating destruction of E to B/S
b) Non-dimensional Formulation
Step 1: List all variables and parameters along with their units. Dependent variables:
S (size)
E (health)
Independent variables:
t (sec)
Parameters:
rs (1/sec)
rE (1/sec)
Ks (size)
KE (health)
P*B (health*size/sec)
Step 2: Count the number of independent dimensions in the problem.
3 independent dimensions: size, health, sec
Step 3: Choose independent reference quantities equal to the number of dimensions. Let’s completely normalize the S equation.
Choose: rs, Ks, KE
Step 4: Form dimensionless variables.
Step 5: Substitute and identify dimensionless parameters groups which naturally emerge.
Two dimensionless groups have emerged:
Our dimensionless mathematical model is:
c) Nullclines
A plot of these two nullclines shows:
• b/R sufficiently small: 2 fixed points
• b/R sufficiently large: 0 fixed points

We see a Saddle Node bifurcation for a critical value of b/R.
Determination of Critical b/R
The critical value is the point at which the two nullclines touch tangentially.
Equate nullclines:
Equate tangents of nullclines:
Solve these two equations simultaneously for e and b/R.
In real variables, the critical value of B is:
d) Phase Portraits
b/R < (b/R)cr

b/R > (b/R)cr

Problem 11.2.13
A (Dumb) dog, instead of seeking to head off the duck, swims at constant speed in a circular pond straight at the (even dumber) duck. (Very dumb) duck, deciding not to fly, makes no other attempt at escape from the dog beyond swimming (at constant speed) in a circle the radius of the pond. Parametrically determine the path of the (previously admittedly dumb) dog. Develop a non-dimensionalization that minimizes the number of parameters necessary for characterization of this solution.
Parameters:
• Pond radius, ���� , ����
• Angular velocity of (again, very dumb) duck, ����, ������������/����
• Speed of (dumb) dog, ���������������� , ����/����
Solution
Equation of Motion for the (very dumb) duck:
Equation of Motion for the (not quite as dumb) dog:
Initial condition for dog:
Nondimensionalize
Select two reference parameters (two independent dimensions, length and time)
Parameter
Duck
Develop Reference Length
Develop Reference Time
Dimensionless variables:
Duck position
Dog position
Non-dimensional equations of motion:
Duck:
Dog:
Thus, the only parameter to vary for the dog is ���������������� �������� , which, for the current purposes, will be referenced as ���������������� .
