
Analysis of Integrated Hybrid System in Nigerian Sub-Grid
Makinde Kayode, Lawal Olawale Kazeem
Department of Electrical Engineering, Federal Polytechnic Bida, Niger State, Nigeria

Ibraheem Abimbola Ganiyu
Federal Airport Authority of Nigeria, Electrical Department Dugbe Ibadan, Oyo State, Nigeria
ABSTRACT
There is no argument that Nigeria like many other developing countries is currently faced with power supply crisis. Despite the abundance of renewable energy sources available within the country, Nigeria is still in short supply of electrical power. About 56% of the nation’s over 150 million inhabitants have no access to grid electricity while the power delivered to the remaining 44% of its population is unsteady and unreliable. This paper discusses the analysis of the impact of integrated Hybrid Photovoltaic and Wind turbine System (HPWS) in a section of the Nigeria electric grid network. The existing Benin 330/132/33kV which is a significant transmission link in the Nigerian Electric Network is used as case study. The HPWS supplied additional generated power of 40MW at 16kV to the aforementioned section of the grid network. Major focus was on the steady state stability of the electric grid network which was modeled with specified loads. In other to effectively carry out the analysis, load flow studies was conducted using Newton Raphson method of iteration and simulated with Electrical Transient Analyzer Program (ETAP) power tool. Different case scenarios were carried out at pre hybrid integration(unconnected), post hybrid integration (connected) as well as at varying load increase of 20%, 60%, and 100%. Consequently, from the analytical simulation results, it was observed that integrating HPWS was able to provide adequate and reliable power supply, the optimal location of HPWS was also observed to be at the 33kV network as its result showed a better improved voltage profile with minimal line losses in comparison to that of the 330kV and 132kV networks.
KEYWORDS: Hybrid, Integrated, Electric Grid, ETAP, Wind, Solar.
1. INTRODUCTION
Electrical power plays an important role in all aspects of development. Being a driving force its roles are indispensible on every aspect of social, economic, educational, military, research and political development of any nation. Generation of electrical power (energy) from conventional technology relies mostly on the use of expendable resources, namely fossil fuels. Fossil fuels besides being expendable their burning releases greenhouse gases which affect the world climate adversely. Renewable energy sources are not expendable and have much less impact on climate than fossil fuel energy sources. Hence there is a global need to harness potentials from renewable energy sources for reliable power supply as excessive demand strain to depletion. All over the world, there has been a great diversion from non renewable into the use of renewable source of energy. It is important we begin to explore the renewable energy sources. To this end globally, progress has been made especially to power load centers and energy demands that are not part of existing electric power networks with renewable energy. Renewable energy like those generated from solar, wind, biomass, geo thermal, hydropower and ocean resources, certainly increases the diversity of energy supplies and offer “clean” environment friendly energy.
https://cejsr.academicjournal.io
Evidently, the use of a hybrid power system presents some outstanding advantages over power systems based entirely on diesel resources, since the energy mixes or configurations in hybrid power systems are scalable, reliable, cost competitive, and sustainable (Olabode et al, 2021)
Various researches has worked on different hybrid energy optimal system design, modeling, utilization and cost implication especially on solar wind concept some of these works include but not limited to the following;
Rohit (2013), in his research presented the simulation of 132 kV substation in Electrical Transient Analyzer Program (ETAP) with detailed load flow analysis and how to overcome the problem of an under voltage discovered in the network. The results are based on actual data received from 132 kV substations. He stated that load Flow study using ETAP software can be used effectively to study the problem of an under voltage as it is an excellent tool for system planning, as a number of operating procedures can be analyzed using the software such as the loss of generator, a transmission line, a transformer or a load. He concluded by saying that ETAP can be used to determine the optimum size and location of capacitors to surmount the problem of an under voltage which is also useful in determining the system voltages under conditions of suddenly applied or disconnected loads.
Adejumobi et al. (2011), developed a technology hybrid Solar Wind power system that harnesses the renewable energies in Sun and Wind to generate electricity. Here, electric DC energies produced from photovoltaic and wind turbine systems are transported to a DC disconnect energy mix controller. The controller being a bidirectional connected DC AC float charging inverter system provides charging current to a heavy duty storage bank of battery while producing inverted AC power to AC loads, in order to demonstrate the hybrids viability.
Sandeep (2013), described the simulation of a combined wind and solar hybrid system for electric power generation with energy storage facilities. The simulation did include all realistic components of the system. The system power delivered by the combined system component was compared with each other fostering credible conclusions. The viability of the hybrid system is not peculiar to Africa and Asia, for instance the feasibility of a grid independent hybrid wind/solar system for a particular region of Australia was studied.
2. MATERIALS AND METHODS
The proposed set up did consists of a photo voltaic solar cell array, a mast mounted wind generator, lead acid storage batteries, an inverter unit to convert DC to AC, electrical lighting loads, electrical heating loads, several fuse and junction boxes and associated wiring, and test instruments for measuring voltages, currents, power factors, and harmonic contamination data throughout the system. The proposed hybrid solar wind power generating system was extensively used to illustrate electrical concepts in hands on laboratories and also for demonstrations in the Industrial Technology curriculum. It was also developed to accommodate remote locations. However, the hybrid system was also applied with grid connection and owners were allowed to sell excessive power back to the electric utility.
2.1 Hybrid Power System
Pace International Wind turbines and Hybrid solutions, defines hybrid power system as a combination of two or more energy conversion devices or two or more fuels for the same device that when integrated, it overcomes limitations inherent in either of them. Hybrid Power Systems incorporate several electricity generating components with usually one major control system which enables the system to supply electricity in the required quality. Combining different renewable energy sources like wind turbines, photovoltaic, solar, thermal, hydropower, wave power or biomass power stations components for electricity generation can effectively supply steady and reliable energy. In this study the Hybrid Photovoltaic and Wind System (HPWS) which is a combination of
https://cejsr.academicjournal.io
Solar PV array and Wind Turbine generators was used to supply additional power to the grid network under consideration. Figure 1 is a typical basic connection of a Hybrid Solar and Wind System (HPWS).

Figure1: Hybrid Wind Solar System
2.2 Hybrid Solar and Wind System Components
According to (A Global Report on Photovoltaic and Wind Energy, 2009), the wind solar hybrid system mainly consists of one or two aero generators along with PV panels of suitable capacity, connected with charge controller, inverter, battery bank, etc. to supply AC power (figure 1). Each of these components are detailed as follows:
i. PV Module (PV Array): A number of PV panels connected in series or/and in parallel giving a DC output out of the incident irradiance. Orientation and tilt of these panels are important design parameters, as well as shading from surrounding obstructions
ii. Wind turbine: This is installed on a tall tower, collects kinetic energy from the wind and converts it to electricity that is compatible with a home's electrical systems.
iii. Hybrid controller: are designed to integrate all three (the DC power from the solar array, the AC/DC or three phase AC from the wind turbine, and the power from the backup).
iv. Battery bank: this can be a single battery or multiple batteries connected together to create essentially one large battery of the required voltage and amp hour capacity. In some ways the battery configuration and capacity are the most important electrical power decision to make, and a wise choice can help guarantee a steady supply of electrical power as well as a system that is simple to operate and maintain.
v. Charge controller: also called charge/battery regulator, limits the rate at which electric current is added to or drawn from electric batteries.
vi. Inverter: is an electronic device or circuitry that converts direct current (DC) to alternating current (AC).
https://cejsr.academicjournal.io
2.3 Transmission system network description
The power flow study of Benin 330kV/132kV/33kV which is the section of the power grid used for this study is pertinent to ascertain the state performance of the existing network for scheduled loads and generation. The network has the following data for 330kV network, 12 power grid, 34 buses, 29 Branches, 4 connected loads, 7 transformers. That of 132/33kV network contains 5 power grids, 25 buses, 23 Branches, 9 connected loads, 5 transformers. All these are used for assessment of the impact of adding a total of 40MW of hybrid generator with (20MW from Solar generator and 20MW Wind generator) to the grid network at a generated voltage of 16kV. The choice of generated power was based on total load demand from the existing afore-mention network. The network model is used to enable a thorough check of the network with respect to steady state stability. Details of the single line diagram at Pre integration (un connected HPSW) and Post Integration (connected HPSW) of existing Benin 330kV transmission network and 132/33kV line network which is the section of Nigerian electrical power transmission network used in the course of this study is found in figure 1 and 2, 3 and 4 respectively.

Figure 3: 330kV Pre Integration One Line Network Diagram
Figure 4: 132/33kV Post Integration one line Model Network Diagram


European
3. ANALYSIS
In order to carry out a proper analysis of the simulation results, some study assumptions for four scenario development were put into consideration and this includes:
The length of lines for 330kv were above 100km and below for 132kv
Storage were fixed for each of the two technologies of wind and solar PV
Static loads were fixed for each scenario
The geographic scenarios considered just one state transmission network in its design.
Existing transmission capacity was assumed to be unavailable for new renewable energy generation only for the scenario development process.
The model used was tested without inputting weather conditions, that is to say an assumption that the supply from wind turbine generator and solar plant were considered constant over the year taking advantage of their complementary characteristics.
The various scenarios that were used to analyze the steady state impact of HPWS on the Benin (330kV, 132kV and 33kV) Electrical Grid Network are stated below;
Scenario one: Voltage profile observed at Un connected and Connected Hybrid Grid network.

Scenario two: Lines losses observed at Un connected and Connected Hybrid Grid network.
Scenario three: Percentage load increase of 20%, 60% and 100% at Un connected and Connected Hybrid Grid network.
RESULTS AND DISCUSSION
Nominal kV
Figure 6: Graph of Voltage Profile for 33kV line for Un connected and connected
The graph in figure 6 shows improved voltage profile for buses 1, 3, 4, 6, 7, 8, 9, 10, 11, 12, 13, 29, 31, 33,35, 37, 39 and 42 while other buses had no significant change in magnitude because the hybrid system had no direct connection to those buses. There were no values for Bus 39 and 42 in the un connected system because they were both linked to the hybrid system for transmission of power to the grid and were consequently not active with regards to the un connected scenario simulation.
Figure 7: Graph of Line Losses for 33kV Un Connected and Connected
From figure 7, it was observed that there was a great reduction in losses with regards to the hybrid system connected to the 33kV line which could be seen on Line 2, Line 4, Line 11, Line 12, Line 16, Line 17, Line 19, Line 22, T21, T22, T23 and T24 when compared to the grid with the hybrid system un connected. The hybrid system acts as a relief system to the already existing grid where these lines were previously feeding from in the un connected network. Also, there were no loss values for T3 and Line 22 for the unconnected system because they were both linked to the hybrid system for

https://cejsr.academicjournal.io
transmission of power to the grid while for Line 6, Line 10 and T23 there was no difference noticed because the hybrid system has no connection to the buses where they were tied to.
Figure 8: Graph of Voltage Profile for 132kV connected and unconnected
Figure 8 shows a voltage improvement on buses 1, 9, 11 and 13 while others were still as they were because the hybrid system had no connection to them. There were no values for Bus 14 and 39 in the unconnected system because they were both linked to the hybrid system for evacuation of power to the grid and so were not active with regards to the unconnected simulation.
Figure 9: Graph of Line Losses for 132kV Un connected and Connected

From figure, there was loss reduction which was noticed on LINE 2 when the hybrid system was connected to the 132kV line while Line 10, Line 12, T21 and T24 had a significant increase in its losses when compared to unconnected result from the design simulation. Also, for the other lines there was no difference noticed because the hybrid system has no connection to the buses where they were tied to.

Figure 10: Graph of Voltage profile for 330kV Un connected and Connected
Figure 10 shows a voltage improvement on buses 4, 18, 19 and 21, they all had same voltage magnitude because they are tied to the same infinite bus. There were no values for Bus 17 in the unconnected system because it was associated to the hybrid system for evacuation of power to the grid and was not active with the hybrid system unconnected.

Figure 11: Graph of Line Losses for 330kV Un connected (Un) and Connected(c)

https://cejsr.academicjournal.io
Figure shows that there was loss reduction on Line 11, 13 and 14 as compared to when the hybrid system was unconnected to the network coming from the relief coming from the hybrid system tied to the network. There were no value Line 16 and T4 in the unconnected system because they were both linked to the hybrid system for evacuation of power to the grid and were not active with regards to the unconnected simulation.
4.3 Percentage Load Increase of 33kV Line at Un-connected at Connected Scenario
The various graphs in figure 12 to 14 shows the percentage load increase of 20%,60% and 100% of 33kV line showed an improved voltage profile for buses 1,3,4, 6, 7, 8, 9, 10, 11, 12, 13, 29, 31, 33 and 37 while other buses had no significant change in magnitude because the hybrid system had no direct connection to those buses. There were no values for Bus 39 and 42 in the un connected system because they were both linked to the hybrid system for transmission of power to the grid and were therefore not active with regards to the un connected simulation.


Figure 12: Graph of 20% Load Increase of 33kV Line Voltage profile
Figure 13: Graph of 60% Load Increase of 33kV Line Voltage profile
Figure 14: Graph of 100% Load Increase of 33kV Voltage Profile
4.2 Line Losses Percentage load increase analysis for 33kV Network
Figure 15 to 17 shows percentage load increase at 20%, 60% and 100%, it was observed that there was a great reduction in losses with regards to the hybrid system connected to the 33kV line which could be seen on Line 2, Line 4, Line 11, Line 12, Line 16, Line 17, Line 19, T21 and T22 when compared to the grid with the hybrid system un connected, the hybrid system acts as a relief system to the already existing grid where these lines were previously feeding from in the un connected network. Also, there was no loss for T3 and Line 22 for the unconnected system because they were both linked to the hybrid system for transmission of power to the grid while for Line 6, Line 10 and T23 there was no difference noticed because the hybrid system has no connection to the buses where they were tied to.
Figure 15: Graph of 20% Load Increase of 33kV Line Losses


Figure 16: Graph of 60% Load Increase of 33kV Line Losses


Figure 17: Graph of 100% Load Increase of 33kV Line Losses
4.3 Percentage Load Increase of 132kV Line at Un-connected at Connected Scenario
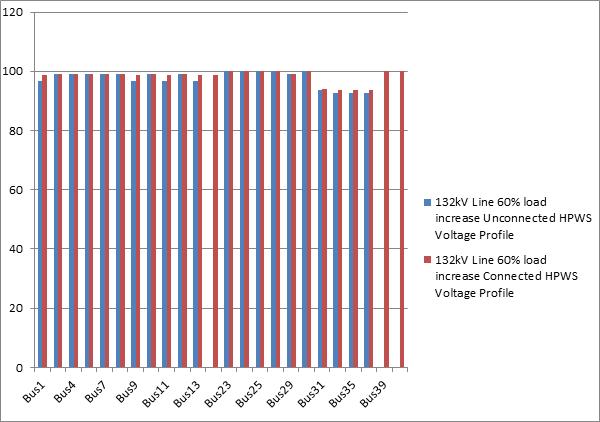
The various graphs shown below at percentage load increase of 20%, 60% and 100% of 132kV network showed an voltage improvement on buses 1, 9, 11 and 13 while others were still as they were because of the hybrid system had no connection to them. There were no values for bus 14 and 39 in the unconnected system because they were both linked to the hybrid system for evacuation of power to the grid and were not active with regards to the unconnected simulation.
Figure 18: Graph of 20% Load Increase of 132kV Voltage Profile
Figure 19: Graph of 60% Load Increase of 132kV Voltage Profile

5. CONCLUSION
The steady state analytic results did show the post hybrid integrated network as a significant improvement on the quality of power supply and reliability on the existing Benin (330kV/132kV/33kV) grid network. The connection of Hybrid Photovoltaic and Wind System (HPWS) into the section of Nigerian grid had great impact on the grid power quality, on the voltage profile level of the buses as well as line losses of the various line branches that had direct link to the HPWS. When analytic comparison was carried out at pre integration (unconnected) and post integration (connected) of the HPWS with respect to 330/132/33kV grid system where it was integrated at, it was observed that integrating the hybrid system at 33kV close to the consumers at the distribution level in comparison with that of 330kV and 132kV transmission voltage levels yielded the best result in terms of improved voltage profile and significant reduction in line losses.

REFERENCES
1. Olabode O. E. Ajewole T.O., Okakwu I.K., Alayande A.S. and Akinyele D.O. (2021). Hybrid power systems for off grid locations: A comprehensive review of design technologies, applications and future trends. Available@ journal homepage:www.elsevier.com/locate/sciaf
2. Rohit, K., (2013). Load Flow Analysis of 132 kV substation using ETAP Software. International Journal of Scientific and Engineering Research, 2, 2229 5518.
3. Adejumobi, I. A., Oyagbinrin, S.G., Akinboro, F.G., and Olajide, M.B. (2011). Hybrid solar and wind power: an essential for information communication technology infrastructure and people in rural communities. International Journal of Research and Reviews in Applied Sciences. p.130.
4. Sandeep K., and Vijay K., (2013). A Hybrid Model of Solar Wind Power Generation System Garg. International Journal of Advanced Research in Electrical, Electronics and Instrumentation Engineering. 8, 912 920.