BEYOND THE HORIZON:
VIEW OF THE EMERGING ENERGY VALUE CHAINS


WHILE ABS USES REASONABLE EFFORTS TO ACCURATELY DESCRIBE AND UPDATE THE INFORMATION IN THIS PUBLICATION, ABS MAKES NO WARRANTIES OR REPRESENTATIONS AS TO ITS ACCURACY, CURRENCY OR COMPLETENESS. ABS ASSUMES NO LIABILITY OR RESPONSIBILITY FOR ANY ERRORS OR OMISSIONS IN THE CONTENT OF THIS PUBLICATION. TO THE EXTENT PERMITTED BY APPLICABLE LAW, EVERYTHING IN THIS PUBLICATION IS PROVIDED WITHOUT WARRANTY OF ANY KIND, EITHER EXPRESS OR IMPLIED, INCLUDING, BUT NOT LIMITED TO, THE IMPLIED WARRANTIES OF MERCHANTABILITY, FITNESS FOR A PARTICULAR PURPOSE, OR NON-INFRINGEMENT. IN NO EVENT WILL ABS BE LIABLE FOR ANY DAMAGES WHATSOEVER, INCLUDING SPECIAL, INDIRECT, CONSEQUENTIAL OR INCIDENTAL DAMAGES OR DAMAGES FOR LOSS OF PROFITS, REVENUE, OR USE, WHETHER BROUGHT IN CONTRACT OR TORT, ARISING OUT OF OR CONNECTED WITH THIS PUBLICATION OR THE USE OR RELIANCE UPON ANY OF THE CONTENT OR ANY INFORMATION CONTAINED HEREIN.


The 2016 Paris Climate Agreement was a historic point in global environmental policy. With nearly 200 nations ratifying it, the world has collectively pledged to address the growing risk of climate change by reducing anthropogenic greenhouse gas (GHG) emissions. The agreement established a specific target: limit the rise in world average temperatures to below 2° C above pre-industrial levels, with an aspirational goal of 1.5° C. The ways to achieve this goal, however, were open to interpretation and change.
The International Maritime Organization (IMO) took an important step in this direction in 2018 when it introduced the Initial IMO Strategy on Reduction of GHG Emissions from Ships (Initial IMO GHG Strategy). This strategy reaffirmed the maritime industry's commitment to significantly lowering GHG emissions during the 21st century. This step not only indicated increased regulatory ambition but also emphasized the need to improve the efficiency of global transport services, which are essential for modern commerce and trade.

In the following years, the IMO has developed and put into effect a number of new regulatory measures by working with other regulatory bodies. These policies were aimed to reduce GHG emissions from maritime activities while promoting the development of advanced fuels and technologies that could further reduce these emissions. The 2023 IMO Strategy on Reduction of GHG Emissions from Ships (the 2023 IMO GHG Strategy) reaffirmed the IMO's commitment to accelerating the reduction of GHG emissions from maritime activities and established the ambitious goal of achieving “net-zero” GHG emissions by or around 2050.
The 2023 IMO GHG Strategy, as revised at the IMO’s 80th meeting of the Marine Environment Protection Committee (MEPC 80), will lead to significant changes for marine vessels. Vessels will need to switch from traditional fuels to greener alternatives, which might involve engine upgrades and the development of new fueling infrastructure. Improved energy efficiency measures, such as improved hull designs and operational changes like optimized routing, will be essential. Additionally, vessels may need to be equipped with real-time emission monitoring and reporting systems, which will require crew training for effective implementation and compliance. Older ships may also see challenges with retrofitting, thus rendering them commercially unviable. However, new, complying ships might see an increase in market value.
The transition to greener technologies may incur initial expenses, but long-term operations could benefit from reduced fuel use and regulatory compliance. Additionally, safety measures will need to evolve, especially when considering the characteristic of the alternative fuels being currently considered by the marine industry. For example, ammonia is one of the alternate fuels currently being considered, and it has unique handling and storage requirements which will be further analyzed later in this publication. Overall, the IMO strategy indicates a time of transition for the marine industry, with a focus on sustainability and efficiency.
On the other hand, the global energy market is at a crossroad. With rising energy consumption to meet consumer demands and a pressing need to simultaneously reduce carbon footprints, there is a definitive shift toward renewable and low-carbon energy sources. One of the solutions to the decarbonization challenge is the evolution of the energy industry, which will support creating an alternative, low-carbon fuel supply chain. The Market Outlook Section 2 provides a comprehensive analysis of the current energy sector and highlights the upcoming challenges and possibilities.
ABS carried out extensive research in support of this publication to evaluate the potential effects of using alternative, low-carbon fuels in the shipping industry. Part of our analysis was to present an updated fuel mix forecast. Based on extensive research and the most current information from Q3 2023, we looked at different scenarios up to 2050 and their effect on the forecasted fuel mix. Another layer of complexity in the equation is the current geopolitical events that impact the future fuel mix. While geopolitical events have had a distortive impact on mature energy markets, their ability to impact a transitioning energy market is disproportional. Despite these challenges, the shipping industry remains dedicated to decarbonization, as demonstrated by the growing investments in alternative fuel-powered vessels.
The fleet orderbook measures the maritime industry's progress toward meeting the IMO's decarbonization targets for the future decades. As the sector navigates the challenges of this transformation, it is critical to invest in cutting-edge technology that can significantly lower maritime operations' carbon footprint. This involves looking at alternative fuels, energy efficiency technology (EET) and novel solutions such as onboard carbon capture systems. While intriguing, the research of alternative fuels presents its own set of obstacles in terms of supply, cost, infrastructure and safety. Concurrently, while EETs provide a realistic pathway to improve ship operational efficiency and thus reduce carbon emissions, they’re expected to play a supportive role in decarbonization projects. Onboard carbon capture, while still in its early phases, has the potential to transform the way industry manages carbon emissions.
The maritime industry is heading towards a technological revolution; a future that offers greater sustainability, efficiency and collaboration which is propelled by developments in clean energy, digitalization and applied research. As technology advances, the maritime industry is positioned to benefit from a myriad of creative solutions. These solutions not only solve today's urgent environmental concerns but also meet the ever-changing demands of a globalized world.
This year's Outlook focuses mainly on the anatomy (i.e., a study of the structure or internal workings) of the three value chains that are expected to play a significant role as we approach 2050.
The carbon value chain — which includes core elements like the capture, utilization, storage and transportation of carbon — is an integrated step for carbon emissions management, from source to potential utilization or sequestration. Understanding and improving the carbon value chain becomes increasingly important as the entire globe steps up its efforts to combat climate change. As it scales up, it will become apparent that the maritime industry is at the center of making this value chain a reality as the industry accounts for a substantial portion of global trade. Carbon, once extracted, can be utilized for a variety of applications. Captured carbon has a wide range of possible applications; from chemical and fuel production to boosting agricultural yields. While this year’s Outlook provides insights of the various aspects of the carbon value chain, it focuses primarily on transportation components.
As companies worldwide increase their carbon capture projects, the requirement to transport collected carbon becomes essential. Ships built to transport liquid carbon as cargo are emerging as an important link in the carbon value chain. These vessels ensure that liquid carbon is transported safely and efficiently from capture sites to utilization or storage facilities.
Safe and long-term storage methods are required for carbon dioxide (CO2) that cannot be efficiently utilized. Geological storage techniques, in which CO2 is stored deep down in rock formations, offer a possible path forward. Furthermore, the economic potential of the carbon value chain ranges from the creation of new industries focused on carbon usage to the creation of employment in carbon capture and storage (CCS). By lowering carbon emissions, companies can avoid potential penalties and conform to global emission regulations.
The ammonia value chain focuses on ammonia as a basic chemical substance which is emerging as a critical component in the global search for sustainable energy options. Its relevance goes beyond simply being a potential fuel source; it becomes a critical component in the larger energy transition narrative. The relevant section of the Outlook goes into the complexities of the ammonia value chain by investigating its production, transportation and utilization, as well as the associated challenges and opportunities.
Because ammonia has a higher energy density per volume than hydrogen, it is a more efficient energy carrier for storage and transportation. Unlike hydrogen, which must be stored at extremely low temperatures or high pressures, ammonia can be liquefied at room temperature. This makes long-distance storage and transit more viable and cost-effective. The global ammonia production infrastructure, which was built primarily for the fertilizer sector, can be used for energy purposes. This existing infrastructure has the potential to increase the use of ammonia as an energy carrier.

The importance of ammonia as cargo is growing and stands as a potential contender to bridge the gap between renewable energy generation and consumption in the context of the global green transition. Ammonia plays a major role in the future energy matrix because of its ability to store and transmit energy effectively, as well as its carbon-free emissions. As the world is dealing with energy storage and transportation challenges, ammonia's position as an energy carrier becomes increasingly important and gives a sustainable answer to some of time's greatest energy challenges.
The importance of the ammonia value chain in the global green transition cannot be emphasized enough. As the world works to reduce its carbon impact, ammonia stands out as a potential viable fuel option and critical cargo. Its dual role emphasizes the marine industry's vital role in the global transition to a greener, more sustainable future.
Finally, the hydrogen value chain focuses on hydrogen, which is often described as the "molecule of the future." Hydrogen grows as a key component in the worldwide endeavor to build a sustainable energy landscape. Its importance in the transportation industry, both as a cargo and as a potential fuel, cannot be overstated. The hydrogen value chain demonstrates the shipping industry's dedication to the global green transition. As the globe grapples with the effects of climate change, the maritime industry's acceptance of hydrogen represents a bold step toward a more sustainable future. The industry is tackling its carbon impact while also establishing itself as a vital actor in the global green energy revolution by embracing the hydrogen value chain.
As the marine industry looks ahead and dives deeper into the complexities of these three value chains, it becomes clear that it’s more than a spectator in the global green energy revolution. Instead, it serves as a critical facilitator and enabler. The transportation of carbon, ammonia and hydrogen as cargo highlights the industry's significance in bridging the global energy landscape's gaps between production, storage and consumption.
Carbon collection and transportation can significantly offset emissions and transform a potential environmental burden into an economic benefit. The marine industry can support carbon capture activities worldwide by providing safe and efficient transportation, thereby supporting efforts to reach a carbonneutral future.
With its potential as a green fuel, ammonia represents a twofold opportunity for the transportation industry. While it can be used as an alternative maritime fuel, it must also be transported as cargo. As countries and industries investigate ammonia-based energy solutions, the marine sector is at the forefront, ensuring regional supply.

Hydrogen, nicknamed the "future fuel," has far-reaching consequences for industries ranging from automotive to industrial. It can potentially serve two purposes in the marine industry: a fuel and a cargo. Transportation of hydrogen, particularly green hydrogen derived from renewable sources, is critical to the realization of a worldwide hydrogen economy. With its huge network and experience, the shipping industry is primed to be a cornerstone in this initiative.
In essence, the maritime industry actively influences the green energy transition rather than simply adapting to it. The sector is helping the global shift toward sustainable energy solutions by shipping these critical elements — carbon, ammonia and hydrogen. This publication aims to shed light on the complexities, problems and opportunities afforded by these value chains while underlining the marine industry's essential position in a greener, more sustainable future.


The Paris Agreement unified the global commitment to reduce the sources of anthropogenic greenhouse gas (GHG) emissions and mitigate the impact of the increasingly energy-intensive pace of commerce.
In shipping, the International Maritime Organization (IMO) introduced its Initial GHG Reduction Strategy in 2018, committing the industry to drastically reduce its GHG emissions. The first step of that strategy was the introduction of two short-term measures, namely the Energy Efficiency Existing Ship Index (EEXI) and the Carbon Intensity Indicator (CII). In July of 2023, a revised strategy was adopted which introduced more stringent targets in an effort to accelerate the decarbonization efforts of the industry with the aim to reach "net zero" by or around 2050.

As the first targeted short-term measures from the Initial IMO GHG Strategy, EEXI and CII were implemented under the International Convention for the Prevention of Pollution from Ships (MARPOL) at the start of 2023; this came after extensive deliberations about the most appropriate way to represent the efficiency of transport work in calculations without disadvantaging specific voyage types or destinations.
The EEXI provides a one-time certification of the energy efficiency of a ship’s machinery and its intended operating profiles while the CII provides an ongoing annual certification and grading that indicates a vessel’s operational efficiency. The effectiveness of these metrics will be examined for improvements by the IMO in 2026.
Since the adoption of the Initial IMO Strategy on Reduction of GHG Emissions from Ships in 2018, the IMO has continued to assess emerging technologies and the availability of alternative fuels to remain current with the options that could support the decarbonization in shipping. In that time, the will among member States grew to increase the level of ambition in the IMO’s GHG reduction goals; by adopting the 2023 IMO Strategy on Reduction of GHG Emissions from Ships, the shipping industry committed to achieving net-zero emissions 50 years sooner than previously agreed.
The IMO’s revised strategy is a comprehensive work package consisting of targets, workplans, reviews and impact studies all aimed at achieving decarbonization by or around 2050: the GHG-reduction targets set levels of ambition for overall emissions and carbon intensity, and they set indicative checkpoints along the way.
Achieving these targets will require a basket of mid-term measures to be developed to steer the maritime industry towards full decarbonization by 2050. However, to get the balance of the proposed measures right, a comprehensive impact assessment will be carried out in parallel.
In July of 2023, the IMO’s 80th meeting of the Marine Environment Protection Committee (MEPC 80) adopted the following new targets in the revised strategy (all reductions compared to the 2008 levels). Also see Figure 2.1.
• A reduction of carbon intensity by 40 percent in 2030.
• An uptake of zero or near-zero GHG emission technologies, fuels and/or energy sources to represent at least 5 percent, striving for 10 percent, of the energy used by international shipping by 2030.
• A reduction of overall GHG emissions to net zero by or around 2050.
• Indicative checkpoints set at:
Overall GHG emissions reduction by 20 percent, striving for 30 percent, by 2030.
Overall GHG emissions reduction by 70 percent, striving for 80 percent, by 2040.
Several of the levels of ambition leave leeway for the exact date or amount of implementation, such as the targets that strive for a higher value, or the net-zero target on or around 2050. Nevertheless, the revised targets are ambitious and will be challenging to achieve.
To achieve the new emissions-reduction targets, a basket of candidate midterm measures to reduce GHGs will be developed based on technical and economic components. The technical measures will be a goal-based marine fuel standard regulating the reduction of the marine fuel’s GHG intensity.
The economic measures will be based on a maritime GHG emissions pricing mechanism; there are several proposals (see Figure 2.2), including:
• Variations on Sustainability Fund and Reward (F&R) and International Maritime Sustainability Funding and Reward (IMSF&R) systems.
• A Zero-Emission Shipping Incentive Scheme (ZESIS).
• The International Maritime Sustainable Fuels and Fund (IMSF&F).
• A GHG Levy (GHGL).
Both the technical and economic measures are to consider the Well-to-Wake (WtW) GHG emissions of marine fuels as per the life-cycle assessment (LCA) Guidelines, the initial version of which was adopted by MEPC 80 in July of 2023. Also see Figure 2.3.
Combinations of the measures above will undergo comprehensive impact assessments to discover their effectiveness and feasibility across the shipping industry.
In 2021, the European Commission adopted a series of legislative proposals known as the “Fit for 55” package, aiming to reduce the region’s net GHG emissions by at least 55 percent by 2030 compared to 1990 levels. Under the Paris Agreement, parties are requested to prepare, communicate and maintain the successive nationally determined contributions they intend to achieve. Additionally, the European Union (EU) has also declared to reduce the GHG emissions target by approximately 55 percent by 2030, as well as pursuing complete carbon neutrality by 2050.
The Fit for 55 package is considered one of the most pioneering and ambitious regulatory frameworks to reverse the impacts of climate change and to build a sustainable economy on the continent. The legislative package is in line with the Paris Agreement objective to keep the global temperature increase to well below 2° C and pursues efforts to keep it below 1.5° C. Furthermore, it consists of new technical and market-based regulations along with measures to revise existing ones.
Figure 2.3: Well-to-Wake approach to emissions.The proposals affecting the maritime industry are:
• Revision of EU Emissions Trading System (EU ETS).
• FuelEU Maritime.
• Revision of Renewable Energy Directive.
• Revision of Energy Taxation Directive.
• Alternative Fuels Infrastructure Regulation.
The EU ETS is a cap-and-trade regulation which aims to put a cap on annual GHG emissions. It has two principles: setting a ceiling for the maximum annual GHG emissions and creating a system to trade EU allowances (EUAs). Regulated installations will be required to purchase and surrender, at the end of each annual period, an EUA for each tonne of carbon-dioxide equivalent (CO2e) they emit during that period. Starting in 2025, shipping companies operating in European territorial waters will have to surrender EUAs for ships over 5,000 gross tonnage (gt) based on their verified emissions of the previous year as quantified by Regulation (EU) 2015/757 (MRV).
On January 1, 2026, the EU ETS will be extended to include methane and nitrous oxide emissions. On January 1, 2027, it will become applicable to offshore vessels of over 5,000 gt. The EU MRV Regulation (EU) 2015/757 has been amended accordingly.
FuelEU maritime incentivizes the production and adoption of sustainable low-carbon and renewable fuels for ships over 5,000 gt operating in European territorial waters. Starting on January 1, 2025, the GHG intensity of energy consumed by vessels on European voyages will be evaluated on a WtW basis. The upper limit of GHG intensity is calculated based on the EU MRV data from 2020. This upper limit will be incrementally decreased every five years, from 2 percent in 2025 to 80 percent in 2050. This progressive reduction is designed to incentivize the development and uptake of biofuels and renewable fuels of non-biological origin. Additionally, from January 1, 2030, container and passenger ships will be required to connect to an onshore power supply and use it for all energy needs while at berth at a port under the jurisdiction of an EU member State. 2
The goal of the California Air Resource Board (CARB) Ocean Going-Vessels at Berth Regulation is to reduce diesel particulate matter (PM) and nitrogen oxides from ocean-going vessels’ auxiliary engines while they are docked at California ports.
This is done using CARB Approved Emission Control Strategies (CAECS) while vessels are at berth. CARB considers shore power to be the “gold standard” for reducing emissions from ocean-going vessels. Other CAECS include emission-capture systems and onboard power generating systems that meet the regulation’s emissions standards.
Per their ship type, ships visiting regulated terminals will be required to comply by the applicable start date. The compliance start date for containerships, refrigerated cargo vessels and passenger vessels began on January 1, 2023. All roll on/roll off (ro/ro) vessels will need to comply by January 1, 2025, along with tanker vessels visiting the ports of Los Angeles and Long Beach. The compliance date for all other tanker vessels is January 1, 2027.
Opacity and other reporting requirements for all vessels began on January 1, 2023.
The Clean Shipping Act of 2023 was proposed to the U.S. Congress in June of 2023. The bill proposes to direct the Environmental Protection Agency (EPA) to set progressively tighter carbon intensity standards for fuels used by ships to reduce GHG by 2040. This is consistent with the goals of the Paris Agreement to limit warming to 1.5° C.
Specifically, the bill would direct the EPA to:
• Set carbon intensity standards for fuels used by ships. The bill sets progressively tighter carbon intensity standards for fuels used by ships. These standards would require life-cycle CO2e reductions of:
20 percent from January 1, 2027.
45 percent from January 1, 2030.
80 percent from January 1, 2035.
100 percent from January 1, 2040.
• Set requirements to eliminate in-port ship emissions by 2030. By January 1, 2030, all ships at-berth or at-anchor in U.S. ports would emit zero GHG emissions and zero air pollutant emissions.
The International Maritime Pollution Accountability Act was proposed to the U.S. Congress in June of 2023 with the intent to levy a pollution fee on large marine vessels offloading cargo at U.S. ports, driving industry-wide decarbonization efforts and incentivizing the use and development of cleaner maritime fuels. The legislation imposes a fee of $150 per ton on the carbon emissions of the fuel burned on the inbound trip, as well as fees for the nitrogen oxides ($6.30/lb.), sulfur dioxide ($18/lb.) and particle pollution (PM2.5) ($38.90/lb.) that the ships emit. Only vessels that have 10,000 gt or more would be required to pay the fee, which would exclude most domestic shipping.
The pollution fees are expected to raise approximately $250 billion (B) over 10 years, providing critical funding for decarbonization efforts in the maritime economy. The revenues collected from the fees would go toward modernizing the Jones Act fleet with low-carbon vessels, revitalizing and electrifying the U.S. shipbuilding industry, as well as addressing and reducing pollutants in U.S.’ port communities.
China implemented the first phase of its national ETS on July 16, 2021. The initial phase included 2,225 companies in the power sector. Further plans are being developed to include seven additional industrial sectors by 2025. China is expected to evaluate the success of the inclusion of the marine industry in EU’s ETS before contemplating including such measures for their shipping and shipbuilding industries.
The United Kingdom has established the Clean Maritime Plan to provide a framework to direct the development of domestic regulations. The plan emphasizes government support for new or improved port infrastructure for bunkering alternative fuels and to deliver shoreside power to vessels. The plan’s aspirations include the goal for all domestic ferries to be zero emission by 2050.
The Maritime Singapore Green Initiative seeks to reduce the environmental impact of shipping and related activities and to promote clean and green shipping in Singapore.
In 2019, the initiative was extended until December 31, 2024, and it was enhanced to promote the decarbonization of shipping. Two pillars of the program are the Green Port Program and the Green Energy and Technology Program.
The Green Port Program provides incentives to encourage environmental sustainability among ocean-going vessels calling at the port of Singapore (including the Maritime Port Authority’s licensed harbor craft) by providing up to 30 percent lower port fees for vessels that meet the criteria.
The Green Energy and Technology Program aims to encourage Singapore-based maritime companies to develop/conduct pilot trials for green technologies that can help vessels meet the targets of the Maritime Singapore Decarbonization Blueprint: Working Towards 2050.
On January 2, 2023, the Norwegian Maritime Authority proposed a regulation to limit GHG, carbon dioxide (CO2) and methane emissions in the West Norwegian Fjords world heritage site; it also sought to encourage the use of the best available technology to reduce nitrous oxide emissions.
Entering into force on January 1, 2026, the regulation will require passenger ships (cruise ships and ferries) to use sources of energy that do not directly emit CO2 or methane. Until December 31, 2035, passenger ships of 10,000 gt and above will be encouraged to use biogas as an alternative source of energy, making those fjords among the first Zero Emissions Control Areas (ZECAs), to be established.
As the global energy demands continue to increase, there is a growing list of fuels being added to the mix to satiate the demand. Traditional energy sources, such as oil and coal, have typically been the staple. However, there is a recent emerging trend of gradual replacement with alternatives fuels.
ABS updated the data found in the previous ABS Outlook publication which assessed the shipping industry’s potential of emission-reduction impact of the adoption of alternative, low-carbon fuels. Building on earlier studies, this subsection presents a summary of the latest base case scenario — extracted from MSI HORIZON’s Q2 2023 online forecasting platform — that assesses the decarbonization of the global economy from now until 2050.
As in previous studies, these scenarios consider how the supply and demand for key commodities, such as coal, liquefied petroleum gas (LPG) and liquefied natural gas (LNG), and containerized goods will drive global trade through 2050. With this update, our coverage expanded to include all major shipping sectors. The forecasts incorporate explicit views on global economic growth, demographics, social factors and energy intensity.
Recent geopolitical events changed the energy landscape and has plunged the world into a new era of high inflation and rising interest rates. The redrawing of the trade map for key energy commodities has been swift and the implications for demand profound, just as the world is experiencing greater evidence that climate change is beginning to show its effects. With the increase of cost, there is potential of an increase toward the consumption of fossil fuels like oil and coal. In the near term this means the likely increase of the consumption of some fossil fuels (notably oil and coal). But at the same time, investment in alternative fuels, particularly in the hydrogen economy is advancing rapidly. The industry anticipates that the global energy demand continues to gradually evolve, therefore, fossil fuel demand will be stronger for an extended period. However, the long-term trends are anticipated to remain the same.
Currently, the shipping industry’s decarbonization journey is accelerating its pace. Investment in LNG, LPG and methanol fueled vessels continues to grow, and the next topic of discussion will be what alternate fuels producers can provide at affordable prices.
As part of this publication, ABS reexamined the supply and demand data for alternative fuels and updated the future fuel mix to reflect the latest market information. In addition, we looked at the effect of the 2050 net-zero target to the projected fuel mix based on the recent adoption of the IMO revised decarbonization strategy. By combining the derived ship demand with a forecast for a changing fuel mix in deep sea shipping, the scenarios for global energy consumption are translated into global fuel consumption by ships. Overall, with the updated findings, ABS finds that by 2050, demand for fossil fuels have the potential to be marginally lower than what was estimated in our Outlook IV publication.
According to the International Energy Agency (IEA), global energy demand is predicted to increase by 30 percent between 2020 and 2050. Multiple factors, including population growth, economic development and urbanization, are expected to contribute to this expansion.
By 2050, the global population is projected to increase by two billion people, with most of this growth occurring in developing nations. These nations are also anticipated to experience accelerated economic growth, resulting in a rise in energy demand. As it stands, urbanization is a significant contributor to the global energy demand. This increase will also place additional strain on the world's energy resources.
The IEA has identified a number of key trends that will influence global energy demand in the coming decades. These trends consist of:
• Renewable energy — anticipated to play a significant role in satisfying the increasing global energy demand. Solar and wind energy are the most promising renewable energy sources, and their prices have been falling significantly over the past few years.
• Coal — anticipated to decline over the next several decades because of factors like environmental concerns, the rise of renewable energy and the availability of inexpensive natural gas.
• Electric vehicles — becoming increasingly popular, and their sales are projected to increase significantly in future years. This expansion will strain electricity demand, but it will aid in reducing GHG emissions.
The IEA’s latest comprehensive view of the changing energy landscape is contained in the World Energy Outlook (WEO) which was published in October 2022. With this latest update, IEA changed its scenarios, now called Stated Policies Scenario (STEPS), Announced Pledges Scenario (APS) and New Zero Emissions by 2050 Scenario (NZE). The latter scenario represents a new approach, but comprehensive data is not available for it and given it differs greatly from the Sustainable Development Scenario used in the previous WEO, we have not included it in our review. STEPS is the most pessimistic scenario because it implies that countries will not take significant steps to reduce GHG emissions. Under this scenario, global energy demand expects an increase of 50 percent between 2020 and 2050.
While there is uncertainty that surrounds the future of global energy demand, it is evident that renewable energy will play a significant role in satisfying the rising demand. Countries that aggressively reduce their GHG emissions and invest in renewable energy sources have the potential to better satisfy their energy needs while protecting the environment.
According to the IEA’s WEO 2022, STEPS looks to the actions and intentions of today’s policy makers and provides a candid assessment of their implications for energy markets, energy security and emissions. Under STEPS, the projected average temperature rise is 2.5° C by 2100.
The scenario reflects:
• The impact of energy-related policies that governments have already implemented.
• An assessment of the likely effects of announced policies as expressed in official targets and plans.
• A dynamic evolution of the cost of energy technologies, reflecting gains from deployment and learning-by-doing.
APS assumes that all climate commitments made by global governments — including Nationally Determined Contributions (NDCs) and longer-term net-zero targets — as well as targets for access to electricity and clean cooking, will be met in full and in a timely manner. Under APS, the projected average temperature rise is 1.7° C by 2100.
NZE sets out the pathway to achieve net-zero CO2 emissions by 2050 and less than 1.5° C increase in the global average temperature. Additionally, it doesn’t rely on emission reductions from outside the energy sector to achieve its goals. Universal access to electricity and clean cooking are expected to be achieved by 2030. Figures 2.4 and 2.5 provide an illustration of the global primary energy consumption under STEPS and APS.
STEPS makes the assumption that the existing policies will continue to be in place before depicting the consequent path. The most significant shift that will take place as a result of this scenario is a decrease in the demand for gas. However, it is anticipated that the demand for coal will continue for a longer period of time in the foreseeable future. This indicates the impact that increased cost of fuel has had on people's capacity to afford their lifestyles. On the other hand, it is anticipated that there will be a correction in the demand for gas during the subsequent years, presuming that there would be a price drop.
Figure 2.4: IEA Stated Polices (STEPS) — global primary energy consumption (©MSI). Figure 2.5: IEA Announced Policies/Pledges (APS) — global primary energy consumption (©MSI).APS operates with the presumption that all aspirational government aims, such as its long-term net-zero and energy access objectives, would be reached within the estimated timeframe and in their whole. Under this scenario, the most notable changes are a substantial rise in the use of coal through the year 2030 and a transition away from the use of natural gas over the long term. Global energy demand is expected to grow over the next few decades, but the concentration of growth is expected to be within certain regions.
Looking at some key regions, we can identify the following trends:
1. Americas and Europe/FSU (Former Soviet Union) stabilize overall demand alongside a steady trend of decline in their global share of final energy demand.
2. China and Northeast Asia are set to stabilize in terms of overall energy demand in the 2020s, peaking above 30 percent of the global share before seeing a long-term trend decline.
3. Africa, Middle East, south and southeast Asia have potential to be the main regional drivers of long-term increases in the global energy demand. These regions currently account for approximately 27 percent of global final energy consumption. This is forecasted to rise to a combined 37 percent by 2050.
Figures 2.6 and 2.7 depict the transformation in the supply of energy from renewables in various regions (note that FSU: Former Soviet Union and JKT: Japan, Korea, Taiwan). Additionally, it showcases the necessity of renewables to meet the growing demand for energy in these regions. Renewables are already one of the fastest growing sources of energy in the world, and they are expected to play an even greater role in the future. By 2050, renewables are forecasted to account for over 40 percent of global electricity generation and over 20 percent of global primary energy consumption.
By reviewing the total global consumption forecasts (see Figures 2.8 and 2.9) certain major trends can be clearly identified.
One major identified trend is the proportion of hydrocarbons will decrease, going from approximately 75 percent at the present time to slightly more than 50 percent by 2050. The use of hydrocarbons as a whole is forecasted to reach its maximum around 2030; however, it is crucial to note that these fuel types will continue to make up a significant portion of the global energy mix by 2050.
To that effect, we anticipate that the “gap” in energy will be filled by electricity, which will continue to rise throughout the forecast in both absolute numbers and market share. In turn, this will necessitate considerable increases in, as well as changes to, the way power is generated to meet this requirement in a manner that is more environmentally friendly. Furthermore, it’s expected that other energy sources — such as hydrogen — will potentially play a more prominent role in final energy consumption.
Figure 2.7: Total global consumption by region (©MSI).It is anticipated that the demand for electricity will increase at a high rate over the next few decades. With this increase, the ultimate need is anticipated to double from its current levels by the year 2050, totaling to approximately 4 billion tonnes of oil equivalent (Btoe) (see Figure 2.10). There will be an expected increase in demand across all the end-use sectors, particularly in the industrial sector; however, the transportation sector is expected to have the most dramatic shift.
Currently, the demand for transportation only accounts for a very small portion of the ultimate consumption of energy that is currently dominated by the utilization of industry and residences. However, the industry anticipates that this will alter when electric vehicles become more widespread. With the rapid rate in which industries are working to make this a reality in the near future, it is anticipated that by 2030, transportation will account for 7 percent of worldwide electricity demand, an increase from the current 2–3 percent share it holds. By 2050, this number has potential to reach 21 percent. It is expected that as we move toward 2050, there will be a significant increase in the generation of electricity by renewable sources, as illustrated in Figure 2.11.
Recent geopolitical events are largely responsible for the significant shifts in the expectations that are reflected in this latest update. The current high price of oil has had a beneficial impact on the oil market, as indicated by the expectation to stimulate an increase in output in regions such as the U.S.
At the same time, a new course is being plotted for the trade of oil. While it is anticipated that the oil market will remain strong until the middle of the following decade, the downward trend will then resume.
When it comes to oil, the industry still leans toward the APS. It is believed that the progress made towards decarbonizing the transportation sector will be a significant element in the long-term drop in the demand for oil (refer to Figure 2.12).
The circumstances surrounding gas couldn't be more different from one another. The rise in demand for non-Russian gas to flow to Europe has come at the expense of demand from other regions that are more sensitive to price changes. As a consequence of this, it is anticipated that there will be a progressive decline in the demand for natural gas relative to earlier predictions up until the middle of the following decade.
However, it is important to note that in comparison to the IEA, the outlook for gas is optimistic as indicated in Figure 2.13. This reflects how difficult it is to remove gas from the residential and industrial sectors of the economy. For instance, it's possible that goals have been set to reduce carbon emissions from household consumption, but there's not much evidence to suggest that a significant shift is on the horizon.
Similarly, to events that happened with oil, the latest disruptions that have been caused by recent geopolitical events are operating in favor of coal, which continues to be a readily available and less expensive option to gas. Many developing countries that had intended to make the transition to gas are unable to compete with Europe's larger pulling power for available supplies of LNG due to gas prices. As such, this will act as a barrier to the growth of the demand for gas in the short term.
Recent events had a considerable impact, particularly on the oil and gas industries. The "traveling" distance of Russian coal exports has increased recently, and larger boats are being used. The average distance traveled is now between 7,000 and 8,000 miles, which is significantly further than the customary range of 3,000 to 4,000 miles. The percentage of Russian coal commerce that is conducted on capsize vessels is currently over 25 percent, which is significantly higher than the regular range of 10–15 percent. However, because of the accelerated shift toward renewable sources of energy, the trade in coal has been steadily decreasing ever since it reached an estimated new peak in 2025 as illustrated in Figure 2.14.
Figure 2.13: Consumption by energy carrier (scenarios comparison) — GAS (©MSI).Figure 2.15 displays an aggregated view of the trends for each commodity. Consequently, demand for fossil fuels in 2025 is expected to experience a dramatic uptick in comparison to more recent years. On the other hand, this is an artifact partly caused by the emphasis placed on five-year milestones. In particular, the year 2020 stands out as an exception because of the influence that COVID-19 had on the economy and the consumption of energy.
Notably, the trajectory leading up to 2025 does not imply a significant failure of the program to reduce carbon emissions even though current geopolitical events are impeding progress in that direction. However, what cannot be disputed is the fact that the use of fossil fuels will continue for a longer period of time than was previously projected. The base case continues to be that geopolitics will not, over the course of the longer term, derail progress.
Figure 2.14: Consumption by energy carrier (scenarios comparison) — COAL (©MSI).As a result of fuel competition from various parts of the economy, the biofuels industry is, perhaps, the clearest example of the effects that will be felt in the near future. However, the most important question is whether there is an alternate supply of biofuels and how closely the supply of “conventional” biofuels can meet the demand. Regarding the first part, the scenario seems to have a fairly straightforward answer. The available supplies of edible oil, which can be utilized in the manufacturing of biodiesel, have reached a plateau and will be subject to substantial challenges going forward.
There is a growing demand for biodiesel use within producing countries — most notably Argentina (for soybean oil) and Indonesia/Malaysia (for palm oil) — with total edible oil consumption currently standing at about 250 million tonnes (Mt) due to food being used as the primary application (refer to Figure 2.16). Recent geopolitical events also brought about a potential problem regarding the supply of sunflower oil which is anticipated to persist for a medium amount of time.

With this in consideration, there has been a recent uptick in interest in recycling spent cooking oil for use as a feedstock in the manufacture of biodiesel as indicated in Figure 2.17. This provides the opportunity to gain access to supplies of edible oil without interfering with the primary and most important market for these items, which is the consumption of food.
In recent years, we have seen an exponential increase in the volume of trade in this product, but it still represents a very small portion of total energy requirements. Acquiring prime mover status and securing supply is likely the most effective tactic that can be utilized in the shipping sector. The individuals who would be in the best position to do this would, in theory, be bunker suppliers rather than shipowners. Although there are pioneers in this field, many more are required.
Figure 2.15: Energy consumption by primary carbon carrier (©MSI).To put things into perspective, the total global consumption of edible oils is 250 Mt which raises the question of, how much of this can be recovered? The distinction between non-commercial and commercial use, as well as general cooking versus recoverable oil applications like deep fat frying, is crucial in this context. If onefifth of the world's demand for edible oils were available in a form that could be used, the amount demanded would be approximately 50 Mt, which is equivalent to 1 million barrels of oil per day (BOPD) and accounts for approximately 1 percent of the world's need for oil. If current practices continue, this could be added to already existing bunkers at a ratio of up to 30 percent. Additionally, by adding just 10 Mt, it would cut Tank-to-Wake (TtW) shipping emissions by approximately 5 percent. Emissions from the Well-to-Wake (WtW) are more difficult to estimate, and they could potentially have a less favorable influence.
However, the carbon footprint of individuals who will be collecting and distributing used cooking oil (UCO) is currently unknown. In essence, it seems that current biofuels, in the absence of some major technological breakthrough, offer limited opportunity to radically change the shipping industry’s decarbonization outlook.
Since the previous update from ABS, a model for the global hydrogen economy has been developed. This model includes a database of green and blue projects that contain data on the sectoral use of hydrogen, as well as the hydrogen carrier that will be utilized if hydrogen is not consumed directly.
Based on this data, Figure 2.18 shows the potential supply of green methanol by 2030 should all projects (currently at the feasibility stage) materialize. This contrasts with the potential demand for methanol from vessels fitted with methanol dual-fuel engines by 2030, based on continued optimistic demand from the containership sector as indicated in Figure 2.19. Currently, containerships are blazing a trail; however, there is available funding in newbuilding investments that are out of sync with normal market cycles. As it stands, methanol has emerged as the favorite in this process, as shown in Figure 30. This is largely due to being a “here-now” technology compared to ammonia which is a “hoped-for” technology.
Figure 2.17: UCO consumption (©MSI).Though the global energy crunch led to higher-than-expected coal consumption and trade during 2021 and 2022, the coal trade is expected to peak by the middle of this decade before declining at a faster pace than previously forecasted. This is illustrated in Figure 2.20.
The outlook for iron ore trade is also forecast to peak by mid-decade before declining through to 2050. With the two largest bulk commodities expected to decline in the long term, it will fall to grains/soya and minor bulks to drive growth for the bulk carrier market. The grains/soy carrier market is forecast to expand at a compound annual growth rate (CAGR) of 2 percent by 2050. Minor bulks are expected to grow at a CAGR of 2.2 percent.
Australia and Indonesia are the two major global coal exporters. As shown in Figure 2.21, global coal exports are forecast to peak around 2025 with a total volume of 1,400 Mt. Exports are expected to gradually decrease to around 900 Mt by the year 2050.
Figure 2.22 illustrates the fuel mix projection for the global bulk carrier fleet. By 2050, oil-based marine fuels are forecast to account for less than 7 percent of the bulk carrier fuel mix on a heavy fuel oil (HFO) equivalent basis. Ammonia, hydrogen and methanol are expected to account for most fuel consumption by 2050.
 Figure 2.21: Coal exports (©MSI).
Global oil consumption expanded by 2.3 percent year-on-year in 2022 and was forecast to grow by a further 2.4 percent year-on-year in 2023, as illustrated in Figure 2.23. However, the demand for oil is expected to decrease in the future.
The declining demand for oil stems primarily from the continued acceleration in the uptake of alternative fuels within the transport sector, with electrification and hybrid technologies leading the way. Oil demand from the power sector is also under pressure from increased commitments to renewable energy sources. Comparing figures 2.24 and 2.25, crude oil seaborne trade is forecast to peak and decline at a faster pace than seaborne trade for oil-based products, reflecting the dislocation between points of refining supply and demand. North American and European refining capacity is forecast to decline by 2050, with capacity expansions in oil-producing regions bridging the gap as oil producers seek to diversify away from crude exports toward refined products and petrochemicals. This moves refiners up the value chain and enables them to capture a greater share of refining margins.

As indicated in Figure 2.26, the outlook for the seaborne trade of chemicals has seen a marginal revision compared to 2020 projections. The expansion of petrochemical production in major oil-producing countries should support export demand, but increasing petrochemical capacity in major consuming countries, namely China, is likely to undermine trade. Much of the demand for chemical tankers will come from the dislocation between petrochemical-producing nations supported by cheap feedstock, and rapidly developing countries that require petrochemicals in the production of end products for both domestic consumption and exports, as well as mining and agriculture.
However, as more petrochemical production comes online in these consuming countries, demand will be met by regional trade and chemicals from cost-competitive nations. New markets will also be sought, such as in Africa. The trade focus in Africa will likely emphasize mining and agriculture, but the region could potentially become a frontier in the production of consumer products in the future. Regarding oil demand, it is assumed that more oil will be converted into chemicals. Though it may be possible for organic chemicals to be produced from carbon-neutral sources, these are still likely to be traded.
By 2050, oil-based marine fuels are forecast to account for approximately 10 percent of the oil and chemical tanker market fuel mix (HFO equivalent). Ammonia, hydrogen and methanol are expected to dominate the future fuel landscape for the sector. The fuel mix chart for oil and chemical tankers, shown in Figure 2.27, illustrates the forecast for varying HFO equivalent levels among all the marine fuel options. It’s expected that 2025 will have the highest HFO equivalent level before decreasing toward 2050. Starting from 2040, ammonia, methanol and hydrogen are projected to account for most fuel consumption. The latest oil-based forecast presents a sharp decline after 2035 compared to the 2020 oil-based projection for oil and chemical tankers.

The global container trade is forecasted to evolve as illustrated in Figure 2.28. This partly reflects the assumption that step-changes in consumer technology will gradually become smaller, lengthening the technology replacement cycle. It also reflects a partial reshoring and nearshoring of manufacturing.
Recent global events are driving a growing interest in manufacturing reshoring. Natural disasters and geopolitical conflicts have highlighted the disruptive risks to manufacturing supply chains that rely on outsourced component manufacturing. Heightened geopolitical tensions have also emphasized the importance of reshoring production of goods and components critical to national security. Figure 2.29 shows the loaded container lifts by region.
By 2050, oil-based marine fuels are expected to account for less than 20 percent of the containership fuel mix (HFO equivalent), with ammonia, hydrogen and methanol forecast to account for most fuel consumption.
The fuel mix chart for containerships, shown in Figure 2.30, illustrates the varying HFO equivalent levels among all the marine fuel options from 2020 to 2050. HFO equivalent levels are expected to increase into 2050, indicating long-term growth for the containership market. Starting from 2040 to 2045, ammonia, methanol and hydrogen are projected to account for most fuel consumption. The latest oil-based HFO equivalent forecast presents a similar trend compared to that of the 2020 oil-based projection.
Figure 2.27: Fuel mix for oil and chemical tankers (©MSI).
 Figure 2.28: Global container trade evolution (©MSI).
The loss of the Russian pipeline natural gas supply substantially impacted global gas markets. A combination of demand destruction, alternative energy sources, increased LNG imports and mild weather helped Europe successfully navigate the winter season of late 2022 and early 2023. Outside Europe, high gas prices decreased LNG demand and imports in many other markets, encouraging the development of alternative energy solutions. Figure 2.31 indicates a forecast for gas consumption by region.
 Figure 2.30: Fuel mix for containerships (©MSI).
Although the forecast is optimistic compared to the IEA, this reflects the difficulty in displacing gas from the domestic and industrial sectors. While targets for decarbonizing domestic consumption may already exist, there is limited evidence of a step change in the future. Not surprisingly, the fuel mix for this sector is dominated by LNG, with ammonia and hydrogen beginning to make inroads from 2035 onwards.
As illustrated in Figure 2.32, the Middle East and Africa regions are expected to continue leading LNG exports, with the Americas close behind.
The forecast fuel mix chart for LNG carriers shown in Figure 2.33 illustrates the varying HFO equivalent levels among all the marine fuel options from 2020 to 2050, with 2040 having the highest HFO equivalent level and 2020 as the lowest level. This signals that the LNG-fueled carrier market is expected to grow until 2040 and then decline as the use of green fuels increases. The latest oil-based HFO equivalent forecast presents a similar trend but projects higher values each year than the 2020 oil-based projection for LNG carriers.

LPG is produced as a by-product of oil and gas production and oil refining. Production and consumption are ultimately constrained by activity in these other sectors. In Figure 2.34, the downward adjustment to LPG production reflects the more pessimistic outlook for oil and, to a lesser extent, gas over the long term.
As indicated in Figure 2.34, exports of LPG are closely aligned with regions that account for the majority share of oil and gas production. The production of U.S. shale gas has driven a considerable increase in exports from the Americas. Though the Middle East and Africa regions are expected to remain important suppliers of LPG, output will ultimately decline in line with trends in oil production and refining and gas output.
 Figure 2.33: Fuel mix for LNG carriers (©MSI).
Newbuild activity in the sector has focused on very large gas carriers (VLGCs) fueled by LPG, and it’s expected that LPG usage for propulsion will escalate significantly in the sector by 2025. The projected LPG imports by region are shown in Figure 2.35. In the longer term, ammonia and hydrogen will increasingly displace fossil fuels in the fuel mix.
The projected fuel mix chart for LPG carriers is shown in Figure 2.36 and illustrates the varying HFO equivalent levels among all the marine fuel options from 2020 to 2050, with 2035 representing the highest HFO equivalent level and 2020 showing the lowest level. This projection indicates that the LPG-fueled carrier market is expected to grow in the near future before declining as the industry pivots to green fuels. From 2035, ammonia, methanol and hydrogen are projected to account for most future fuel consumption.

As illustrated in Figure 2.37, global light vehicle (LV) sales declined by 0.6 percent year-on-year in 2022 despite strong pent-up demand driven by pandemic-related supply chain disruptions. High and heavy equipment manufacturing and exports were similarly disrupted at a time of high equipment investment, as shown in Figure 2.38. Extensive order backlogs and severely depleted dealer inventories are expected to support higher shipment levels during 2023–2024.
Long-term prospects for the sector remain positive. The transition from fossil fuels to new energy sources is supporting a surge in electric vehicle production and sales globally, with China establishing itself as a production and export hub for electric vehicles.
Although newbuild activity from 2021 to 2023 was dominated by LNG dual-fuel orders, a few leading operators are now opting for ammonia-ready and methanol-fueled vessels.
Figure 2.36: Fuel mix for LPG carriers (©MSI).The fuel mix chart for PCTCs shown in Figure 2.39 illustrates the varying HFO equivalent levels among potential marine fuel options from 2020 to 2050. HFO equivalent level is expected to increase into 2050, signaling the PCTC market has a growing trend compared to other ship types. Starting from 2035 to 2040, ammonia, methanol and hydrogen are projected to account for most fuel consumption. The latest oil-based HFO equivalent forecast presents a steady decreasing trend for PCTCs.

 Figure 2.37: LV sales by region (©MSI).
The general cargo sector competes with a few other sectors for employment. Unitized minor bulk cargoes are ideally suited for carriage in general cargo vessels. Still, those vessels face competition from conventional and open hatch bulkers, containerships, and, to a lesser extent, ro/ro ships and PCTCs. General cargo vessels are also well-suited for container feeder employment and were increasingly called upon by container operators during the tight box market in 2021 and the first half of 2022. The sector also competes with other ship types for project cargoes such as power generation equipment, railcars and industrial equipment. Despite the high level of competition, Figure 2.40 projects continued growth for general cargo carriers.
As shown in Figure 2.41, in contrast to the long-term outlook for conventional bulk cargoes such as iron ore and coal, prospects for minor bulk cargoes are relatively positive. Aggregated minor bulks are forecast to grow at a CAGR of 2.2 percent until 2050. However, iron ore and coal are expected to decline at a CAGR of -1.5 percent and -1.8 percent, respectively. The project cargo market is also expected to expand on the back of rising infrastructure and green energy investments.
Figure 2.39: Fuel mix for PCTCs (©MSI).The fuel mix for general cargo vessels shown in Figure 2.42 illustrates the varying HFO equivalent levels among potential marine fuel options from 2020 to 2050. By 2050, oil-based fuels are projected to still account for most fuel consumption for general cargo vessels. However, ammonia, methanol and hydrogen are expected to grow to 42 percent of the fuel market by 2050.
Figure 2.41: Minor bulk seaborne trade by commodity (©MSI).The COVID-19 pandemic left a profound impact on the global cruise industry. From a record peak of 29.7 million passengers in 2019, passenger volumes declined by 75 percent year-on-year in 2020 and a further 50 percent year-on-year in 2021. As indicated in Figure 2.43, the industry is expected to recover and surpass 2019 levels by 2025.
Long-term prospects for the sector are positive but are predicated on the continued expansion of cruise holiday participation, particularly in Asia. Cruise penetration, measured as a percentage of the global population, was less than 0.3 percent in 2010 but reached just under 0.4 percent in 2019. It is forecast to reach 0.7 percent by 2050.
The cruise sector was an early mover on LNG fuel, with the first dual-fuel LNG vessel built in 2018. Given the frequency of port calls and the energy-intensive nature of hotel operations while in port, shoreside power will be an important factor in reducing emissions. At the end of 2022, 45 percent of the vessels owned by the three largest cruise groups could connect to shoreside power, which was only available in approximately 5 percent of cruise ports.
The fuel mix chart for cruise ships shown in Figure 2.44 illustrates the varying HFO equivalent levels of potential marine fuel options from 2020 to 2050. With HFO equivalent levels expected to grow into 2050, the cruise ship market is forecast to grow rapidly compared to other ship types. Starting from 2040 to 2045, methanol is projected to account for most fuel consumption. By 2050, LNG and oil-based fuels are expected to have HFO equivalent levels of 6 percent and 26 percent, respectively.
Figure 2.43: Cruise passengers by origin and global percent penetration (©MSI, CLIA).Since 2022’s shipping industry fuel mix projections, the seemingly unstoppable investment in containership newbuilds has continued rapidly. As a direct consequence of this, most shipyards have now reached their capacity for the year 2025. Very little dock space is available at major yards for 2026.
Since the 2022 ABS Outlook study, the most significant change was the rise of methanol use and, to some extent, a decrease for LNG use.
While the proliferation of methanol has accelerated industry adoption of vessels capable of running on alternate fuels, availability of such fuels is becoming a pressing issue for shipowners and operators. In addition, methanol adoption is reliant on the type and size of the vessel.
Meanwhile, the oil tanker industry is underinvested at the present time, even though the freight market is reasonably healthy. In this context, the recent surge in orders for very large crude carriers (VLCCs) is noteworthy. While these orders included ships powered by LNG, the vast majority were still powered by oilbased fuels.
Ship types included in this study are oil and chemical tankers, dry bulk carriers, containerships, LPG and LNG carriers, car carriers, general cargo or multipurpose (MPP) vessels, reefer ships, ro/ro ships, roll on/ roll off passenger (ro/pax) ships and cruise ships. Ro/ro, ro/pax, general cargo and cruise ships are new considerations in this ABS Outlook compared to past editions.
The ABS Zero Carbon Outlook: View of the Value Chain publication and the International Council on Clean Transportation’s (ICCT) Accounting for Well-to-Wake Carbon Dioxide Equivalent Emissions in Maritime Transportation Climate Policies [1] paper were used as sources for assumptions regarding WtW emissions.
With this latest update, the long-term prognosis for trade has not undergone any significant or noteworthy shifts. The same cannot be said for the relatively close future. The energy landscape has been altered to an extent that, prior to the conflict in Ukraine, would have been considered impossible.
Figure 2.44: Fuel mix for cruise ships (©MSI).The Ukraine conflict has contributed to rampant inflation and rising interest rates globally. At a time when the world is facing increasing evidence of climate change’s impact, the trade map for critical energy commodities has been swiftly redrawn. The consequences for growing energy demand are substantial.
When looking at seaborne trade, it’s anticipated that the crude oil trade, currently the largest single commodity transaction, will fall of 40 percent from 2025 to 2050. This will only be surpassed by coal, the seaborne volumes of which are forecast to plummet by 43 percent within the same period.
It is forecast that the oil products trade will be more resilient. Supported by structural adjustments in refining capacity, that trade is expected to expand until the middle of the following decade.
The LNG trade is expected to expand alongside growing demand for natural gas. It is anticipated that electricity generation from gas will approach a ceiling around the year 2035. As a result, the seaborne trade of LNG is expected to hit a ceiling of around 740 Mt by 2040 following significant expansion in the prior decades.
When looking at shipping that does not involve energy, three major trends emerge:
• The volume of container storage is expected to increase, mostly unaffected by the energy transition.
• Although iron ore is not directly employed in the production of energy, its trade volumes are expected to experience the same fate as crude oil and coal — specifically a 37 percent decrease in volume between 2025 and 2050.
• Small bulk cargo growth is expected to make up for the decrease in other trades and is forecast to be the largest non-containerized sector shipped by the year 2050.
The forecast trade growth for key commodities is illustrated in Figure 2.45 and is expected to vary depending on the commodity. Some commodities, such as oil and natural gas, are expected to see slower growth. Others, such as agricultural products and metals, are expected to see faster growth.
• Oil and natural gas: The trade growth of oil and natural gas is expected to slow down in the coming years. This is due to several factors, including the increasing availability of alternative energy sources, the transition to a clean energy economy and the geopolitical risks associated with oil and gas production.
• Agricultural products: The trade growth of agricultural products is expected to accelerate in the coming years. This is anticipated because of growing demand for food from emerging economies, the global increasing population and climate change.
• Metals: The trade growth of metals is expected to expand at a moderate pace in the coming years. This is due to the increasing demand for metals from several industries, such as construction, infrastructure and manufacturing.
Some of the trends expected to drive trade growth for key commodities in the coming years include:
• Growing demand for food from emerging economies: The population of emerging economies is growing rapidly, leading to an increased demand for food. This is driving trade growth for agricultural products, such as wheat, rice and corn.
• Increasing population: The global population is expected to reach 9.7 billion by 2050, driving demand for essential commodities such as food, energy and metals.
• Climate change: Climate change is leading to changes in agricultural production and thus increasing demand commodities such as corn and soybeans. Climate change is also leading to increased demand for metals used in technologies that mitigate the effects of climate change.
• Geopolitical risks: Geopolitical risks, such as the Ukraine conflict, can disrupt the trade of commodities. This can lead to higher prices and shortages.
The trade growth of key commodities is a complex issue that is influenced by many factors. These trends are just some of the key factors expected to drive trade growth of key commodities in the coming years.
The ship composition of the global fleet ship is expected to be significantly different in 2050 from what it is today.
• Tankers: The global demand for oil is expected to peak in the mid-2020s and then decline. This is anticipated because of increased availability of alternative energy sources, the transition to a clean energy economy and the geopolitical risks associated with oil production. The decline in the demand for oil is expected to lead to a decline in the number of oil tankers in the global fleet.
• Containerships: The global trade of goods is expected to grow significantly in the coming years. Increasing global population, growing middle class and the rise of e-commerce are driving this anticipated growth. This is expected to lead to more containerships in the global fleet.
• LNG Carriers: The demand for LNG is expected to grow significantly in the coming years, driven by the increasing use of LNG as a cleaner-burning fuel, the growth of the LNG export market and the geopolitical risks associated with oil production. As a result, LNG carriers are expected to increase in the global fleet.
• Bulk Carriers: The global bulk carrier market is forecast to grow at a CAGR of 3.8 percent from 2022 to 2027. This growth is due to increasing demand for commodities such as iron ore, coal and grain. The growth in the bulk carrier market is expected to lead to an increase in the number of bulk carriers in the global fleet.
• Cruise Ships: The global cruise ship market is expected to grow at a CAGR of 6.6 percent from 2022 to 2027. Increasing popularity of cruising, the growing middle class and the aging population are pushing this forecast. The growth in the cruise ship market is expected to lead to an increase in the number of cruise ships in the global fleet.
• Ro/pax Ships: Ro/pax ships are designed to carry both passengers and vehicles and are becoming increasingly popular for short-sea voyages. The ro/pax market is expected to grow thanks to increasing demand for tourism, the growing middle class and the development of new technologies. This is anticipated to lead to more ro/pax vessels in the global fleet.
The fleet composition forecast based on the above is illustrated in Figure 2.46.
Figure 2.45: Trade growth by key commodity (©MSI).The transition to renewable energy sources is expected to play a key role in the long-term decarbonization goals of the maritime industry. Due to the complexity of emissions performance of alternative fuels, emissions abatement technologies and commercial viability, the development of a fuel blend for shipping is contingent on several factors.
When viewed from the WtW perspective, the IMO's adoption of the LCA methodology is a significant factor in the maritime industry's shift toward low- and zero-carbon fuels. The LCA Guidelines were adopted at MEPC 80 and additional development is anticipated from subsequent sessions.
The LCA method enables renewable fuels with carbon content to be viable candidates for reducing carbon emissions via internal combustion engines, which is how shipping currently reduces carbon emissions. Due to the technological characteristics of this form of engine, it is impractical to use it as the primary source of propulsion for an extended period. As a result, the industry has a strong desire to continue utilizing fuels that are compatible with internal combustion engines.
ABS has conducted an analysis to ascertain the potential impact that the shipping industry's adoption of alternative marine fuel sources could have on reducing emissions. The scenarios for worldwide energy consumption are then rendered into global fuel consumption by ships by integrating the generated ship demand with a projection for a changing fuel mix utilized in deep-sea shipping. This is done so that the effects of prospective future changes in global energy consumption can be better understood.
This publication examines the impact that the development of alternative fuels will have on the emissions produced by various categories of maritime vessels. The available fleet is a result of the industry-specific forecasting models we have developed. These models incorporate our trade estimates and the fluctuating demand for vessels of various sizes. No assumptions regarding future shifts in engine efficiency, vessel commerce speed, port efficiency or fleet fuel mix have been made in the preliminary investigation. All these factors lie within the scope of the forecast.
This analysis accounts for HFO with a scrubber, marine gas oil (MGO), marine diesel oil (MDO), LNG, LPG, methanol, ammonia and hydrogen as fuels. Based on the base case fuel mix projection scenario, expressing the quantity of energy used in terms of tons of HFO equivalent illustrates the proportion of both traditional and emerging fuels used in shipping.
Figure 2.46: Fleet composition (©MSI).The most significant change since the 2022 ABS Outlook has been the remarkable emergence of methanol, although sector and vessel size continue to play a significant role in determining adoption. The emergence of methanol has hastened the adoption of alternative fuel-capable engines.
This has, if anything, raised the question of how to obtain green fuels. Competition from other sectors of the economy is also increasing, and this may be a significant factor impeding the shipping industry's adoption of biofuels as well. Restating the energy consumption in terms of tonnes (t) of HFO equivalent reveals the proportion of existing and novel fuels in shipping. This is considered simpler to contextualize than the use of joules for energy content.
Since forecasts for the shipping industry's fuel mix were last updated, the expected shares for methanol and ammonia have increased. The prospects for LNG would continue to be used across the energy system in a steady demand for the following decades. In power, it has half the emissions intensity of coal and therefore can persist longer. Figure 2.47 illustrates this year’s fuel mix (HFO equivalent) projection.
The consumption of fossil fuels is estimated to decline by 75 percent in 2050. The decline in the consumption of fossil fuels will be driven by the following factors:
• The world is transitioning to a clean energy economy, and this is driving the demand for renewable energy sources.
• The public is becoming increasingly aware of the environmental benefits of renewable energy, and this is driving the demand for these sources.
• Governments around the world are supporting the development of renewable energy through a variety of policies, such as tax breaks, subsidies and renewable portfolio standards.
The key to decarbonization will be the production of sufficient quantities of carbon-neutral versions of these fuels.
Figure 2.48 shows how the total energy consumed by the shipping industry is expected to continue to rise under the base case scenario, from 232 Mt HFO equivalent in 2020 to 308 Mt HFO equivalent in 2050. This is due to the increasing importance of containerships and the degree of persistence of tankers and dry bulk carriers within the system, even in 2050.
The shifting pattern of trade will reshape the global fleet. The aggregate share of the oil and chemical tanker and dry bulk carrier sectors is forecast to decline from 64 percent of the fleet in gt terms in 2022 to 45 percent in 2050. In both sectors there is expected to be much greater emphasis on smaller vessels (e.g., medium range (MR) tankers and bulkers of Panamax, etc.). Considering the need for more containerized cargo by 2050, it is noteworthy that the additional energy demand will come from containerships. Most other sectors are anticipated to maintain their current profile. These trends offer mixed prospects for decarbonization. To date, small tankers and bulkers are sectors that have been slowest to adopt alternative fuels. Considering the fleet size, energy consumption and the benefit of bunkering alternative fuels along predetermined trade routes, it’s expected that containerships will be the primary drivers of alternative fuel pathways.
Considering the structural changes in trade patterns and fleet composition, the base case scenario referenced in Figure 2.49 forecast results in a global fleet of 1.8 gt in 2050. The base case scenario assumes that newbuilding vessels with oil-fueled engines will still be constructed until the next decade, and by 2050, there will be a residual oil-fired fleet of 225 million gross tons (m gt). When paired with forecasts for the development of the fleet over time and the future newbuilding deliveries and scrapping, the assumption results in a fleet breakdown by 2050 as follows: 13 percent of the fleet will remain fitted with oil-only engines. This results in a total of 224m gt with an associated consumption of approximately 47 Mt of VLSFO/MGO.
Figure 2.48: Fuel consumption by ship type (HFO equivalent, ©MSI).The base case scenario also assumes that the global supplies of green methanol and ammonia are sufficient across the forecast. However, LNG and LPG are gradually “greened” so that by the designated timeframe, emissions are 375 Mt CO2 equivalent. Most of this is due to the consumption of oil; however, based on the WtW emission factors, some GHG emissions will remain such as those related to gas slip during the methanol burning process and nitrous oxide emissions from burning ammonia.
The percentage of new construction contracts that are exclusive to oil production has decreased from 95 percent in 2015 to 44 percent in 2022 and finally to 37 percent so far this year. On the other hand, this decrease is due to activities in the containership, vehicle carrier and cruise ship sectors; certain sectors have not been penetrated at all. These sectors that “had-to-abate” will potentially require a dramatic acceleration in steps to cut emissions.
Assumptions have been made that all orders placed after 2030 will be for dual-fueled vessels to remove this fleet as quickly as possible. If this happens, the remaining oil-engine fleet will only be 122m gt by the year 2050. As it stands, this fleet is primarily comprised of ships that were constructed in the later years of this decade and the early years of the following decade. These ships have lifespans that are greater than 20 years and include cruise ships, general cargo ships, ro/ro ships and ro/pax ships. The remaining fleet is estimated to consume 26 Mt of oil. It is expected that there will be sufficient biofuel or synthetic fuel available to fulfill this requirement in a manner that is environmentally friendly.
Under these circumstances, it is of the utmost importance that the LNG industry transitions entirely to the use of bio- or synthetic-LNG at this point.
Besides the base case towards net zero in 2050, ABS has developed three additional scenarios by considering energy efficiency technologies (EETs), onboard carbon capture and storage (OCCS) and adoption of biofuels. The developed scenarios are summarized as follows:
• Scenario 1: EETs.
• Scenario 2: EETs and OCCS.
• Scenario 3: EETs, OCCS and adoption of biofuels/e-diesel.
The assumptions associated with these three scenarios are listed below:
• It is assumed that an accelerated adoption of dual-fueled engines and scrapping rates over the next 15 years will provide an enhanced level of fleet turnover; a similar outcome would be achieved by retrofitting. This is most significant for those sectors of the fleet that typically have lifespans beyond 20 years (in some cases well beyond 20 years).
• To assess the potential for net zero, it is assumed that all ships ordered from 2030 onwards are dual fueled, compared to our previous forecast where we assumed some would continue to be ordered into the first half of the next decade.
• The oil-fueled fleet will consume around 47 Mt of oil. Net zero can be achieved with the consumption of 47 million tonnes of oil equivalent (Mtoe) of net-zero biofuels or e-diesel.
• If EETs achieve fuel savings of 15 percent on average across the fleet, the total fuel consumption will decrease to 40 Mtoe.
• This analysis shows that within the fleet growth and renewal assumptions that have been adopted, most of the fleet can be dual fueled by 2050. The key assumptions are:
Aggregate fuel consumption is reduced by 15 percent due to the widespread adoption of EETs on both existing and new ships.
There is sufficient synthetic oil/biofuel available to meet the needs of the residual oil-engine fleet. Supplies of green methanol and ammonia, as well as LNG and LPG, are sufficient to meet the needs of the shipping industry.
E-diesel or zero carbon biofuel will be needed for the remaining fleet of oil-fueled vessels. If net zero is based on WtW emissions, then substantial greening of fuel production and supply will be needed.
The actual required energy is likely to be much lower based on widespread adoption of energy saving devices on both existing and new ships.
Scenario 1
To clarify the path to net zero, ABS examined a series of potential actions by the industry to quantify additional reductions in emissions. Scenario 1 looks at the impact if aggregate fuel consumption is reduced by 15 percent due to the widespread adoption of EETs on both existing and new ships. The adoption of these technologies is anticipated to start impacting the industry from 2025 and reach the maximum impact of 15 percent in 2040.
By introducing EETs, the fuel consumption of the oil-fueled fleet will fall to 40 Mtoe. Starting from 2035, there is an expected trend of gradual uptake of biofuel or e-diesel for conventional HFO/MGO/MDO.
Figure 2.50 illustrates the fuel mix projection toward 2050 under the first scenario.
Scenario 2
The second scenario looks at the potential impact of onboard carbon capture technologies on emissions. In this case, the fuel mix remains the same and there is no impact on emissions from fuels other than oil. The adoption of OCCS is assumed to begin in the second half of this decade and reach a peak of 70 percent in 2050. This is based on the assumption that 70 percent is a realistic maximum across the fleet. The overall impact is to reduce emissions from burning oil to 44 Mt CO2 equivalent and total emissions to 116 Mt CO2 equivalent. Figure 2.51 illustrates the fuel mix projection toward 2050 under this scenario.
Figure 2.50: Fuel mix projection toward 2050 (Scenario 1, ©MSI).Scenario 3
In this scenario, it is assumed that oil consumption is gradually replaced by a mixture of biofuels and e-diesel. For indicative purposes, these fuels are expected to become available from 2035 and achieve full penetration by 2050.
To achieve net-zero emissions, a strong support would be for the economics use of green fuels or carbon capture technologies which are still considered favorable prior to 2050. This can be achieved through a combination of progressive reduction in the cost of producing green fuels and a high carbon price. Additionally, this will be considered necessary so that all LNG, LPG, ammonia and methanol consumption is green by this date.
Moreover, there are residual emissions from the burning of fuels such as ammonia, but these are reduced to 71 Mt CO2 equivalent from 375 Mt CO2 equivalent that is found in the base case scenario. Additionally, it has a close peak to 950 Mt CO2 equivalent in the middle of this decade. A study by ICCT showed that secondgeneration biofuels made from waste and lignocellulosic biomass could offer lower WtW GHG reductions of up to 100 percent than that of MGO. This could be due to their small impact on land use, large biogenic carbon uptake and modest use of fossil fuel energy for feedstock conversion. Figure 2.52 illustrates the fuel mix projection toward 2050 under Scenario 3.
Figure 2.51: Fuel mix projection toward 2050 (Scenario 2, ©MSI).The 2023 IMO Strategy for Reducing GHG Emissions from Ships emphasizes the need for mid-term reduction measures that take into account the WtW GHG emissions of marine fuels.
Since the analysis of WtW GHG emissions is still relatively new, a range of different assessments have been applied in the marine industry. These assessments differ from one another in their breadth, coverage of the fuel production process, length of study and resolution of study.
However, multiple studies have neglected to include this stage in their LCA. This is due to uncertainties in the data that are currently available on the carbon footprint of manufacturing solar panels and wind turbines for green electricity, as well as the construction of various other processing plants for both alternative and conventional fuels.
A lack of unanimity can be seen across emission inventories because of the difficulties associated with measuring the uncertainties. To get around this obstacle, standardized models that have the potential to quantify effective decarbonization across the industry will need to be adopted. These models will need to be in line with the goals that have been established by the IMO.
In the context of this research project, fuel consumption on a sector-by-sector basis has been recast as theoretical emissions from shipping using a WtW basis. We have applied elements that were cited in the ABS Zero Carbon Outlook: View of the Value Chain publication, as well as a 2021 briefing paper on WtW emissions written by ICCT.
It has been assumed for the purposes of this analysis that oil, LNG and LPG will continue to be produced via traditional gray sources of production while methanol and ammonia will be available in green form. To ensure the most accurate outcome possible, it is likely that a more sophisticated set of potential outcomes should be discussed and agreed upon with ABS. Following the previous outputs of fuel mix projections, the base case CO2 equivalent emissions for the global fleet are shown in Figure 2.53.
Figure 2.52: Fuel mix projection toward 2050 (Scenario 3, ©MSI).As mentioned in subsection 2.2.6.2, ABS developed three scenarios, as indicated in Figures 2.54–2.56, to consider EETs, OCCS and gradual uptake of biofuel. To reduce WtW GHG emissions to zero, the following assumptions have been made for the three scenarios, which are also an indication of what needs to happen by 2050:
• Aggregate fuel consumption is reduced by 15 percent due to the widespread adoption of EETs on both existing and new ships.
• Carbon capture is widely adopted on vessels consuming oil, with a 70 percent reduction of onboard emissions achieved.
• E-diesel or zero-carbon biofuel will be needed for the remaining fleet of oil-fueled vessels.
• Global supplies of green methanol, ammonia, LNG and LPG are sufficient to meet the needs of the shipping industry.
• Substantial greening of fuel production and supply chains is needed.
Figure 2.53: WtW CO2 emissions projections toward net zero (base case, ©MSI).From the above figures, one item that can be easily identified are the benefits of EET, OCCS and biofuel. The most optimistic case presents that the WtW GHG emissions in 2050 can be reduced to 20 percent of base case, 28 percent of EET case and 50 percent of EET and OCCS cases. This study assumes that newbuilding vessels with oil-fueled engines will still be constructed well into the next decade.
As a result, widespread adoption of EETs and carbon capture will be required for the shipping industry to achieve net-zero emissions. Achieving net-zero emissions will also require economies to use green fuels or carbon capture technologies through a combination of progressive reduction in the cost of producing green fuels and a high carbon price. This is necessary so that all LNG, LPG, ammonia and methanol consumption transition to green by 2050.
The COVID-19 pandemic initially curtailed global newbuilding contracting — in the first 10 months of 2020, a total of 23m gt was ordered at shipyards, a decrease of 45 percent during the same period in 2019 — but ultimately, the pandemic supercharged activity in a handful of sectors. 2021 was the key year with total newbuild contracting that reached to 97m gt, the highest annual order intake since 2013 as seen in Figure 2.57.
Figure 2.56: WtW CO2 emissions projections toward net zero (Scenario 3, ©MSI).The momentum continued into 2022, when an additional 67m gt was added to the global orderbook. As of this year, the pace of newbuild ordering eased back considerably in response to increasingly challenging and complex politico-economic conditions, elevated newbuild prices, limited berth availability at major shipyards and, in some major shipping markets, significant correction in vessel earnings.
Recent trends in the newbuilding market include waves of ordering certain ship types. In 2021, the first ship type to see a significant order volume was containerships, followed by dry bulk and gas carriers. Over the course of 2021, these ship types accounted for a total over 80 percent of all orders placed.
Because of the 2020 pandemic, vessel earnings rose, even when underlying trade was weak; however, both containerships and bulkers benefited from supply-chain disruption and port congestion. For containerships, freight and time charters, rates hit unprecedented levels of approximately eight times those seen in the previous decade. The profits accumulated in this period have funded the investment wave of the last couple of years. Oil tankers also saw an initial surge in earnings in the early part of the pandemic, but this more short-lived and did not translate into newbuilding investment.
In 2022, newbuild contracting of containerships and dry bulk carriers declined by 37 percent to 26.1m gt and 54 percent to 11.4m gt. Conversely, with accelerated orders of LNG carriers, there has been an increase of 60 percent, leading to a record 16.4m gt. After a prolonged absence from shipyards, PCTC owners returned in force during 2021 and 2022, ordering 10.7m gt over this two-year period. For comparative purposes, annual contracting volumes of PCTCs averaged 1.0m gt in the 2010s.
In summary, the boom in ordering since 2021 has been caused by disruption to global supply chains and trade patterns rather than strong underlying economic fundamentals.
In the first seven months of 2023, a relatively modest 36.6m gt had been contracted at shipyards. However, the most notable trend in 2023 thus far has been an uptick in contracting for product and chemical tankers, which have benefited enormously from the disruption to oil trade due to recent geopolitical events.
Figure 2.57: Annual deliveries in gt (©MSI).In terms of shipbuilders, the main beneficiaries of the recent ordering boom have been major Chinese and South Korean shipyards. At an aggregate level, shipyards in these two countries have accounted for 85 percent of all newbuild orders since 2021 compared to the years immediately preceding the pandemic which accounted to approximately three-quarters of the amount. Chinese shipyards have arguably made the most impressive gains over the last few years. As detailed in Figure 2.58, not only have Chinese shipyards gained overall market share, but they have also started securing a greater proportion of contracts for more complex ship types such as LNG carriers, product tankers and PCTCs. China has also made strong inroads into the passenger ro/ro market.
The composition of the global orderbook in recent years has been drastically altered to match the concentration of newbuild contracting in specific markets. The orderbook is now remarkably “lopsided” with sizable orderbooks for specific ship types and historically small orderbooks for others which are outlined in Figure 2.59.
Figure 2.58: Orderbook breakdown by region (©MSI).A defining characteristic of the shipbuilding market in recent years has been a surge in newbuilding prices. After struggling over the course of 2020, they rose across the board in 2021. Although there was a divergence in the rate of increases between different ship types in 2022, prices have generally continued to stay firm. Figure 2.60 indicates that, at the start of August 2023, benchmark newbuild prices are around 30-50 percent higher than they were at the end of 2020. This was partly driven by the strong newbuilding interest and the subsequent firming of forward cover at major shipyards. However, other factors have been at play at various points over the last few years. The most significant of these have been elevated steel prices, significant fluctuations in the exchange rates of the Asian currencies against the U.S. dollar ($) and general inflationary pressures. Another significant factor was the reduction in shipbuilding capacity over the last decade.
Figure 2.59: Orderbook by ship type (©MSI).Shipbuilding as an industry underwent a period of capacity retrenchment following the end of the shipbuilding boom of the mid- to late-2000s. Characterized by an extended period of rationalization and consolidation, global shipyard capacity fell to a low of 65.9m gt at the end of 2021, which was a 40 percent decrease from its peak of 109.8m gt in 2011. While the process of retrenchment was global, it was most pronounced in Asia where a significant number of smaller, greenfield shipyards exited the shipbuilding industry as indicated in Figure 2.61.
Figure 2.60: Average newbuild price by vessel category (©MSI).It is considered that the industry is at the peak of the current newbuild price cycle. Moving forward, prices are expected to drop over the next few years as the factors that supported prices, most notably the high steel prices and elevated forward cover, unwind. However, rising shipyard costs are also expected to put a floor under the declines, and the low forecast in newbuild prices for 2025 will be significantly higher than pre-pandemic levels. A revival in contracting volumes from 2025 and onwards will potentially see newbuilding prices recover to firm levels.
Following the newbuild contracting boom in recent years, a spate of shipyard reactivations has been announced. The cumulative effect of reintroducing this capacity into the market could be significant, with aggregate latent capacity of over 13m gt, or one-fifth of the global total at the end of 2021. However, because some of the capacity will be used for ship machinery or other activities, the actual growth is expected to fall short of that figure. It will take considerable time to ramp up production volumes and the full reactivation of capacity at many yards. As such, while shipyard capacity grew last year, it only increased 1.8 percent to 67.1m gt. Despite this, it is anticipated that by 2025, the capacity will reach 69m gt.
Looking further ahead, it is anticipated that shipyard capacity will continue rising over the second half of this decade in response to increased ordering volumes on the back of replacement demand and environmental regulations. However, a repetition of the “boom-and-bust” cycle that characterized shipyard capacity development during the 2000s and 2010s is not expected. Instead, there is a current forecast that global capacity will peak at 81m gt in 2030. While this is significantly above current levels, it remains 26 percent below the 2011 peak.
The volume of newbuild contracting capable of utilizing alternative fuels as a proportion of the overall total has risen significantly in recent years. In 2017, 11 percent of all newbuilding tonnage ordered across all ship types were equipped with propulsion systems capable of utilizing alternative fuels. By 2022, the share of alternative fuel, newbuild contracting had risen to 49 percent as shown in Figure 2.62. Uptake has been particularly rapid in liner markets such as containerships and PCTCs. By comparison, their adoption in tramp bulk markets, specifically tanker and dry bulk carriers, has been more limited, especially for smaller vessels where it is non-existent.
Figure 2.61: Shipyard capacity by region (©MSI).The maritime industry is undergoing a technological revolution driven by advancements in clean-energy technology, digitalization and applied research. These developments are propelling the sector towards a more sustainable and efficient future, fostering reduced emissions, enhanced operational capabilities and improved collaboration across the maritime ecosystem.
As technology continues to evolve, the maritime industry is poised to embrace even more innovative solutions to address environmental concerns and meet the increasing demands of a globalized world.
Figure 2.63 contains an illustration of the technology trends and their expected outlook towards 2050.
Figure 2.62: Percentage of newbuild contracts with alternative fuels by ship type (©MSI).Figure 2.63: Technology Trends by ABS [1].
The decarbonization of shipping is complex with unique challenges to navigate. An area of significant advancement is the clean-energy transition and associated technologies where solutions such as carbon capture, electrification, alternative fuels and alternative energy have gained prominence.
Carbon capture, utilization and storage (CCUS) holds great promise in mitigating GHG emissions in the shipping industry. By capturing CO2 emissions from ships’ exhaust gases, CCUS prevents the release of the emissions into the atmosphere. Various CO2 capture technologies can be employed, including post-combustion capture, pre-combustion capture and oxy-fuel combustion.
Shipboard carbon capture is currently being explored as an end-of-pipe solution to reduce vessel emissions. CCUS is still in its infancy as present land-based CCUS equipment cannot be directly used on ships due to energy usage, on board storage and energy usage-related challenges. These technologies are at an early stage of commercialization with considerable potential to reduce costs, increase efficiency and enable safe operations [2],[3].
i. Technology readiness:
The most CCUS technologies for power generation and industrial applications are at Technology Readiness Levels (TRLs) seven to nine. This means they have been demonstrated on a large scale or in relevant environments. However, some CCUS — such as CO2 liquefication and boil-off gas (BOG) — are at lower TRLs of three to six, which means they require further development and testing.
ii. Technology benefits:
Enable the use of existing fossil fuel-based assets and infrastructure. Create new revenue streams from CO2 utilization and storage. Support the production of low-carbon synthetic fuels.
iii. Key considerations:
High capital and operating costs.
Large energy consumption and efficiency loss.
Integration with ship design.
Limited availability and suitability of CO2 storage sites.
One of the key steps for achieving net-zero emissions in the shipping industry is electrification which involves using shore or offshore renewable energy sources to provide zero-emission energy to marine vessels or offshore assets. Electrification can be achieved through various combinations of advanced energy storage systems (ESS) and fuel cells that can power different systems on board, such as carbon capture and propulsion.
Initially, the main utilization of electrification will be in the short-shipping sector. The utilization will include onsite/onboard energy storage, port and offshore buoy charging stations, lithium and non-lithium batteries and ceramic batteries. As 2030 approaches, the industry can expect to see a limited deep-sea shipping application as the charging infrastructure and onsite/onboard storage is improved.
i. Technology readiness:
Electrification is still a low TRL of three to six in the shipping industry, with various technical and systemic challenges that need to be overcome to achieve large-scale deployment.
ii. Technology benefits:
Improve local air quality and reduce noise pollution. Enhance operational flexibility and responsiveness. Integrate with renewable energy sources and smart grids.
iii. Key considerations:
High upfront costs and long payback periods.
Limited range and endurance of batteries.
Insufficient availability and reliability of shore power and charging infrastructure.
The industry is currently going through the phase of testing and early adoption of different alternative fuels. The fuels that are currently in focus are LNG, ammonia, methanol, biofuels and hydrogen. As the industry moves towards 2030 and 2040, it is expected that there is going to be a scaling up of the production and adoption of different alternative fuels. The scaling up will support the industry to manage the reduction of carbon emissions.
i. Technology readiness:
Most of the alternative fuel projects in the shipping industry are at TRL three or four, meaning they have been validated in a laboratory or a simulated environment.
ii. Technology benefits:
Increase engine performance and reduce emissions.
Facilitate the transition to a low-carbon economy.
Diversify the fuel supply and reduce price volatility.
iii. Key considerations:
High production and distribution costs.
Low energy density and storage challenges.
Compatibility and safety issues with existing engines and systems.
The industry is also looking at other, non-traditional, alternative energy sources. Advances in alternative energy systems — such as fuel cells, hybrid systems and nuclear power — will be pivotal to the goal of complete decarbonization of the global fleet.
Focusing on the potential of nuclear energy as international regulations evolve and advanced reactor development matures, there is exciting potential for providing maritime industries with a zero-emission energy source. Ongoing development in new types of reactors aims to commercialize nuclear reactors in relatively small, plug-and-play platforms, providing assets with energy for years before refueling. Nuclear power could offer several advantages for the commercial fleet like eliminating the need for bunkering services — which can save time and money for vessels that operate in remote or isolated areas — and extending the lifespan of vessels as nuclear reactors have longer operational cycles than conventional engines. However, nuclear power also faces challenges and consequences that may hinder its widespread adoption. The range from the need to update the relevant regulation in allowing the use and transport of radioactive materials on assets, all the way to the management of an increased volume of nuclear waste, must be managed by specialized operators of nuclear waste repositories. Finally, the initial costs of nuclear systems may be higher than traditional energy systems, but they could be offset by savings in the long run.
i. Technology readiness:
Nuclear power is still at a low TRL between two to three, technology in the shipping industry, as there are very limited examples of mostly experimental applications [4],[5].
ii. Technology benefits:
Reduce fuel consumption and GHG emissions.
Harness abundant and renewable energy sources.
Demonstrate leadership and innovation in the shipping industry.
iii. Key considerations:
High capital and operating costs.
Variable and intermittent availability of renewable energy sources. Regulatory and social barriers for nuclear energy.
EETs are a key component of the decarbonization strategy. These technologies can improve the operational performance and fuel efficiency of ships, thereby reducing their emissions. Some examples of EET include propulsion improving devices, lubrication systems, wind-assisted propulsion, waste heat recovery systems and digital optimization tools. These technologies can be applied to both new and existing ships, depending on their feasibility and compatibility.
When considering ways to manage emissions compliance for the existing fleet versus the new fleet, there tends to be a dichotomy in the potential solutions.
For the existing fleet, EET retrofits provide a gradual reduction in emissions which will meet compliance in the short to medium terms.
The EET adoption rate for the current fleet is relatively low, but as shipping continues towards 2030 and beyond, the adoption rate is expected to grow. As seen in Table 2.1, there are some key takeaways from the current EET profile across the fleet.
• EETs with the highest adoption rates in the current fleet benefit from their relative ease of implementation (e.g., exhaust gas economizers, propeller ducts, etc.).
• Renewables have some of the lowest levels of adoption in the current fleet. However, some vessel types are more suitable for renewable options. One such example is the Flettner rotor, a cylindrical structure that utilizes the magnus effect to generate propulsion power, which is much more practical for a bulker than a containership.

The orderbook adoption rate can be seen in Table 2.2, with key insights provided below:
• Design considerations, such as bow enhancement and rudder bulbs have a much higher adoption rate on new vessels than on the existing fleet.
• Exhaust gas economizers and air-lubrication systems have some of the next highest adoption rates and require minor design changes.
• Suction wings have a high adoption rate in the general cargo market. This solution, like the Flettner rotors, is most practical on specific vessel types. It could also be implemented on tankers, which generally offer more available deck space for installation.
• Overall, renewables continue to have low adoption rates in all vessel types except ro/ro/PCC and passenger/cruise vessels.

Digitalization in the marine and offshore industries encompasses several interconnected technologies that enhance efficiency, reduce risk and improve safety.
Visualization technology — such as mixed reality (MR) — allows for interactive training and education in limited or hazardous environments. Combined with virtual reality (VR), augmented reality (AR), MR, and with edge computing and digital twins, comprehensive visual information can be provided, thereby enabling informed decision-making and condition-based maintenance strategies.
The continuous advancements in visualization technologies can significantly enhance operational efficiency in marine vessels and offshore assets. MR technology merges the virtual and physical realms, enabling users to directly engage with virtual environments (offering enhanced interactive education and training opportunities). By combining VR, AR and MR with edge computing and digital twins, comprehensive visual information can be provided for systems that are not directly observable. An example is the inner workings of operating pumps. Additionally, virtual crew access, remote management and monitoring of various functions on vessels can be accomplished. Eventually, when vessels become fully autonomous, a single individual could virtually connect to a digital twin and oversee the entire system [1].
Artificial intelligence (AI) plays a crucial role in machine learning (ML) systems, enabling automated decision-making and adaptive responses to all evolving patterns. AI-based machinery analysis and monitoring systems improve asset performance and predict maintenance needs.
Virtual assets involve interconnected technologies that improve efficiency, reduce risk and enhance safety in marine fleets and offshore operations. Digital twins, virtual replicas of physical assets, play a central role in this digital transformation. By continuously updating with real-time data from sensors, digital twins provide decision support for various systems. They range from individual components to entire vessels, analyzing data to optimize operations. Advancements in connectivity, sensors, computing power and AI drive the evolution of digital twins. As they become more reliable, digital twins will increasingly shape maritime operations.
Autonomous functions — supported by modeling, simulation and increased asset connectivity — optimize vessel operations, reduce risks and improve efficiency. Digital twins serve as virtual replicas of physical assets, continuously updated with real-time data to support decision-making and eventually achieve self-learning and autonomy. Cloud and edge systems can enhance simulations by reducing computing power requirements and enabling real-time monitoring.
Improved asset connectivity is crucial for expanding the use of cloud and edge systems at sea. Cloud-based models combined with operational data reflect real-life conditions. Future communication technologies like low earth orbiting (LEO) satellites, high-altitude platform station (HAPS) and wireless optical systems are essential for cloud-edge connectivity.
Modeling, simulation and increased asset connectivity contribute to the development of digital twins. Combining AI with digital twins enhances decision-making, therefore, improving operational efficiencies and safety.
Autonomous technology enables independent decision-making and can be applied to marine vessels and offshore assets. It improves safety, reduces human involvement in high-risk operations and lowers operational expenses by reducing crew numbers. Autonomous and remote-control functions may lead to a shift in vessel and asset design, optimizing resources for primary objectives [1].
Applied research continues to drive innovation in the maritime industry, addressing various challenges and exploring new possibilities. Research institutions, industry players and governments are investing in projects that focus on areas such as green ecosystem, new materials and additive manufacturing (AM), vessels performance and blue economy.
Green ecosystems cover not only the design and construction elements of green ships but also the green infrastructure such as green ports, green shipping corridors and green cargo management (i.e., green labeling, etc.).
Nanotechnology and AM are technologies that can improve the performance and efficiency of the marine and offshore industries by enhancing materials and creating objects based on digital 3D models.
Nanotechnology, which involves the utilization of advanced materials at the atomic and molecular scale, could bring numerous benefits such as anti-viral coatings for high-touch surfaces, hull coatings to reduce drag and composite materials for enhanced strength. Furthermore, carbon nanomaterials can be employed to absorb sulfur in fuel oils. While the adoption of nanotechnology was hindered in the past due to cost and manufacturing complexity, recent advancements have helped mitigate these challenges, leading to reduced costs and increased acceptance.
On the other hand, AM — also known as 3D printing — offers a process where physical materials are fused or joined to create objects based on a digital 3D model. Initially developed to expedite prototype development and production, AM has evolved significantly, expanding its material capabilities to include metals, ceramics and carbon fiber. As AM continues to advance, it could revolutionize how the marine and offshore industries manage repairs. By decentralizing part manufacturing, repairs or part replacements can be achieved independently of supply chains and away from ports. On-site or remote AM systems provide the added advantage of printing parts closer to the point of need, streamlining logistics and supply chain services. However, AM faces challenges such as system cost and space constraints, anisotropic mechanical properties of as-built parts and post-processing requirements. Nonetheless, as technology advances, AM systems can gradually produce more critical metal parts and fulfill large-scale needs like structural or machine components [1].
Vessel performance addresses aspects such as component level performance optimization — multiphysics/ multi-domain optimization, virtual testing and commissioning — and vessel system level performance optimization — fast solvers for high-fidelity models, advanced SIM-based decision-making — leading to real-time fleet performance optimization.
The aim is to have real time fleet performance optimization. With the wide-spread adoption of energy saving devices to maximize vessel performance, enhanced high fidelity performance optimization at the vessel system level and higher fidelity analysis enabled by generative design can support this goal.
Finally, the blue economy covers all the activities that utilize ocean resources and space. It focuses on the sustainable use of ocean resources and space, minimizing environmental impact while promoting economic growth. It includes activities like windfarms, aquafarms, wave and tidal energy systems and offshore spaceport rocket launching and recovery. Blue economy has the potential to be a key enabler for a global paradigm shift in maritime industries. Sustainable practices are vital for supporting growth in the blue economy, attracting investments in new infrastructure and bringing novel industries and opportunities to the marine and offshore sectors. The proliferation of aquafarms as sustainable food sources is expected to increase significantly, requiring infrastructure investment in the seafood value chain to support sustainable aquaculture. Similarly, the growth of commercial space exploration can impact the blue economy with offshore spaceports with the associated infrastructure playing a crucial role in the industry's impact on ocean space. It is important to consider the carbon footprint of this infrastructure, including sustainable transport of crew, fuel and equipment, as the industry expands. Additionally, the blue economy can contribute to the maritime industry's broader energy transition by harnessing the ocean's renewable energy potential. Offshore windfarms, wave energy conversion facilities and tidal energy harvesting facilities can tap into these renewable sources [1].


Carbon value chain has gained significant attention due to the crucial role it plays in addressing the challenges posed by the Paris Agreement’s climate change objectives and transition to a more sustainable and low-carbon future. Other incentives to supplement the Paris Agreement, such as emission trading systems (ETS) and carbon taxation to name a few, increase the need to focus on the whole value chain that addresses the generation, emission, capture, utilization and management of carbon dioxide (CO2). Understanding the carbon value chain is crucial for developing effective strategies to mitigate CO2 emissions.
Carbon capture, utilization, storage and transportation (CCUST) is one of the top priorities of the sustainability agenda while onboard carbon capture systems gain ground in the shipping industry and are supported by regulations. Figure 3.1 illustrates the steps of CCUST after CO2 is generated at the source.
CAPTURE
Capturing CO2 from fossilor biomass-fueled power stations, industrial facilities or directly from the air.
TRANSPORT
Moving compressed CO2 by pipeline or ship from the point of capture to the point of use or storage.

USE
Using captured CO2 as an input or feedstock to create products or services.
STORAGE
Permanently storing CO2 in underground geological formations, onshore or o shore.
Figure 3.1: Carbon capture, utilization, storage and transportation (CCUST) value chain.In carbon capture, utilization and storage (CCUS) from point sources, CO2 is captured from large industrial sources, including power generation or industrial facilities (e.g., cement, steel factories, etc.). Different methods and technologies are considered for this purpose such as post- and pre- combustion and oxy-fuel combustion [1].
Direct air capture (DAC) is an emerging technology that captures CO2 directly from the ambient air rather than from specific emission sources [1].
Once CO2 is captured, it needs to be transported from the capture site to either the storage or utilization sites. Transportation methods include pipelines, ships or other means, depending on the quantity of CO2 and the distance (see Figure 3.2). CO2 transport is the vital link in enabling the deployment of CCUS.

CO2 is utilized in a variety of industries, such as in the production of foods and beverages, as well as integrating it into industrial processes to convert it into fuels, chemicals or building materials while offering economic and environmental benefits. Additionally, CO2 will be a key enabler in energy chains of the future as it be used to synthesize methanol, and then re-capture the CO2 from burning the methanol. Figure 3.3 provides an overview of the different uses of CO2
Based on the current market conditions, CO2 utilization occupies a small portion of the overall CO2 volume expected to be captured, making storage an important option.
•
Figure 3.3: Elements of CO2 utilization.There are a few options available for the permanent storage of CO2. One option includes using it during enhanced oil recovery (EOR), where it is permanently stored, following the recovery of oil from the reservoir. This same process can be replicated by injecting supercritical CO2 into depleted oil and gas reservoirs, saline aquifers and other geologic formations. These have existed for millions of years and already have containment caps, faults and permeability features that are suitable for storing liquids. Figure 3.4 illustrates the main elements of both the onshore and offshore storage. One challenge that this process faces is that the CO2 stream needs to have consistent properties, and monitoring will be required to account for carbon to ensure there aren’t issues with long-term leakage.


The Paris Agreement’s primary objective is to hold the increase in the global average temperature to well below 2° C above pre-industrial levels and pursue efforts to limit the temperature increase to 1.5° C above pre-industrial levels.
To support this global effort, in 2018, the International Maritime Organization (IMO) published its own “Strategy on the Reduction of GHG Emissions from Ships” with the target of reducing the total greenhouse gas (GHG) emissions by at least 50 percent by 2050. During the recent 80th meeting of the Marine Environment Protection Committee (MEPC 80), IMO members agreed on the revision of the Initial Strategy and approved the 2023 Strategy which prescribes more enhanced targets to tackle harmful emissions with the continued goal to reach net-zero GHG emissions by (or around) 2050.
These emissions-reduction goals have propelled the maritime industry down new pathways for zero- and lowcarbon fuels while searching for effective decarbonization technologies. An example includes carbon capture and the supporting systems required to store, transport and use (or permanently sequester) captured carbon. The ability to capture carbon and produce blue fuels (hydrogen, ammonia and methanol) as well as transport green fuels (hydrogen and ammonia) will be one of the key pillars of the energy transition, thus requiring the entire carbon value chain — from capture to utilization and storage — to scale up over the next decade.
Reports [2],[3] from the Intergovernmental Panel on Climate Change (IPCC) and the International Energy Agency (IEA) have stated that carbon capture efforts will be essential for global efforts of meeting net-zero carbon goals.
At the IMO level, there were proposals submitted to MEPC 79 and 80 (see Table 3.1) that consider the inclusion of carbon capture technologies in the regulatory framework of reducing CO2 emissions from ships.
Figure 3.4: Elements of CO2 storage (onshore and offshore). Provided by Global CCS Institute.MEPC 80/7 Onboard carbon capture
MEPC 80/7/7
The use of onboard carbon capture systems within IMO's regulatory framework
MEPC 80/INF.14 Onboard carbon capture [Full Report]
RINA
China, Japan, Liberia, Norway, Republic of Korea and ASEF
RINA
MEPC 80/INF.31
The challenge and importance of accounting for GHG emissions from shipping for sustainable renewable marine fuels and onboard carbon capture
Republic of Korea
MEPC 80/INF.32
Policy action on Inclusion of carbon capture system from ship's engine exhaust
India
MEPC 80/7/4
Final report of the Correspondence Group on Marine Fuel Life-Cycle GHG Analysis
China, Japan, and EU
MEPC 79/7/4
Proposal for including carbon capture technologies in the IMO regulatory framework to reduce GHG emissions from ships
Liberia and ICS [4]
MEPC 79/7/6
Proposed amendments to the Energy Efficiency Design Index (EEDI) calculation Guidelines to incorporate Carbon Capture system for Ship Exhaust gas (CCSE)
China
MEPC 79/7/7
Proposed amendments to EEDI Survey and Certification Guidelines to incorporate a Carbon Capture system for Ship Exhaust Gas (CCSE)
China
MEPC 79/7/16
Carbon capture and storage (CCS) on board ships
Norway
MEPC 79/7/22
MEPC 79/INF.27
Proposal to include onboard CO2 capture system in the IMO GHG regulatory framework
Information on the development of onboard CO2 capture system in the Republic of Korea
Republic of Korea
Republic of Korea
Table 3.1: Carbon capture, utilization, storage and transportation (CCUST) value chain.
An important international convention which controls marine pollution and dumping of waste at sea is the London Protocol (LP), adopted in 1996. This protocol superseded the 1972 Convention on the Prevention of Marine Pollution by Dumping of Wastes and Other Matter (London Convention).
While CO2 dumping was initially prohibited by the Protocol, the 2006 amendment (Resolution LP.1(1)) enabled sub-seabed CO2 storage — derived from CO2 captured processes— by incorporating it to the list of wastes that can be considered for dumping. Another amendment in 2009 enabled cross-boundary export of CO2 for sub-seabed geological storage. While the 2009 export amendment is not yet in force — it requires ratification by formally being accepted by two-thirds of the Parties to the LP — it does effectively allow CO2 streams to be exported for carbon capture and storage (CCS) purposes between cooperating countries, provided that the protection standards of all other LP requirements have been met. A further amendment made in 2019 (Resolution LP.5(14)) allows provisional application of the 2009 amendment by flag Administrations, indicating their intent to provisionally apply the 2009 amendment, before entry into force.
The LP can facilitate the international transport of CO2 by ship, increase availability of portside infrastructure for CO2 loading and unloading, and subsequent discharge of carbon captured on board vessels.
Several countries have established bilateral agreements under the LP or have entered in cooperations towards the signing of such an agreement. Some examples are as follows:
• Belgium and Denmark: In 2022, these countries signed a bilateral agreement on cross-border CO2 transport for permanent storage offshore. This agreement was instrumental for Project Greensand, which aims to store CO2 in a depleted oilfield offshore Denmark.
• Belgium and the Netherlands: In 2023, these two countries signed a bilateral agreement on facilitating the cross-border transport of CO2 between key ports and industrial hubs in both countries, such as Antwerp, Ghent, Rotterdam and Zeeland.
• Belgium and Norway: In 2022, Belgium and Norway signed a memorandum of understanding (MOU) on energy-related cooperation in the fields of offshore wind energy, hydrogen and CCS. One key objective of this MOU was to prepare a bilateral agreement to enable cross-border transport and permanent geological storage of CO2 on the Norwegian Continental Shelf.
• Norway and the United Kingdom: In 2018, these countries signed an MOU to cooperate on CCS which includes the transportation of CO2. In 2022, there was an expansion of the MOU to concretize the cooperation from ship CO2 to a subsea storage facility in Norway.
• Denmark and the Netherlands: In 2022, these two countries signed an agreement that expresses mutual intent to advance CCUS development and deployment. As part of this agreement, they will explore the need for a bilateral agreement to enable cross-border transportation and storage of CO2
• Norway and Sweden: In 2022, the two governments have agreed to put in place an agreement to enable cross-border transportation and storage of CO2 as soon as possible. The intent is the transportation of CO2 from Sweden to Norway for the purpose of geological storage.
• Norway and the Netherlands: In 2021, Norway and the Netherlands signed an MOU to promote bilateral cooperation in the field of CCS and explore future areas of energy cooperation related to the North Sea.
• Norway and France: In 2022, the two governments signed a letter of intent (LOI) to promote the development of CCS by creating a framework for cooperation to facilitate their sharing of technical knowledge, advice, skills and expertise in the field of CCS. As part of the cooperation, the two governments will consider and prepare a bilateral agreement to enable cross-border transportation and storage of CO2
• Germany and Norway: In 2023, Germany and Norway agree to enter a strategic partnership on climate, renewable energy and green industry. The partnership encompasses, among others, the field of CCS.
• Germany and Denmark: In 2023, the two countries signed a joint declaration of intent to enter a bilateral cooperation on the further development of CCUS. One of the priorities is the consideration of a bilateral agreement or arrangement between the two countries to enable cross-border transportation and storage of CO2
Directive 2014/52/EU, on the assessment of the effects of certain public and private projects on the environment which adds requirements on environmental impact assessment to identify direct and indirect impacts on:
• Population and human health.
• Biodiversity.
• Land, soil, water, air and climate.
• Material assets, cultural heritage and the landscape.
Projects defined in Annex I of the Directive should be assessed according to Articles 5–10.
Projects related to CCS defined are:
• Pipelines with a diameter of more than 800 millimeters (mm) and length of more than 40 kilometers (km) for the transport of CO2 streams for the purposes of geological storage, including associated booster stations.
• Storage sites pursuant to Directive 2009/31/EC on the geological storage of CO2
• Installations for capturing CO2 streams for geological storage pursuant to Directive 2009/31/EC.
Directive 2009/31/EC, that amended Council Directive 85/337/EEC on the geological storage of CO2, regulates the scheme under which member States can store captured CO2 under their exclusive economic zones and on their continental shelves. 2009/31/EC focuses on governance of CO2 storage and not on cross-border CO2 transportation. Article 24 “Transboundary Cooperation” states that for transboundary transport of CO2, the competent authorities of the member States concerned shall jointly meet the requirements of that Directive along with other relevant community legislation.
For now, there is no legislative regime that governs the transboundary transportation of CO2 in Europe. However, the latest revision of Projects of Common Interest (PCIs) under the TEN-E Regulation — with the six new cross-border CO2 transport network projects — proves the interest of European Union (EU) to invest in transboundary transport of CO2, as well as recognizing CCUS as a necessary tool to achieve the decarbonization targets. Thus, it is safe to assume that it is only a matter of time for the development of the regulatory framework of cross-border transport of CO2 in the EU.
By applying goal-based reduction of GHG energy intensity as of 2025, FuelEU Maritime Regulation will be the basic tool for EU to motivate the maritime industry towards the adoption of renewable and low-carbon fuels and technologies. Although FuelEU is mostly focused on adoption of alternative fuels, Article 28 of Fuel EU titled "Report and Review" states the possibility to include new GHG abatement technologies such as onboard carbon capture systems in the calculation of GHG intensity which is subject to review by December 31, 2027.
Starting from January 2024, EU Emissions Trading System (EU ETS) will be extended to cover CO2 emissions from all ships 5,000 gross tonnage (gt) and above that are entering EU ports, regardless of the flag they fly. This will require vessel operators to purchase allowances for emissions produced by voyages in and out of European ports. Additionally, carbon prices will be raised, and the emissions cap will be tightened to align with the 2030 target.
Carbon pricing's potential role in the transition to a low-carbon economy is gaining acceptance from governments and businesses alike. Climate policies, that include mechanisms such as carbon pricing, account for transition risks and opportunities and allow the reassessment of strategies to stimulate clean technology and market innovation.
Many of today’s businesses use internal carbon calculations to evaluate the potential impact of mandatory carbon prices on their operations and to identify potential climate risks and revenue opportunities. Additionally, long-term investors use carbon pricing to assess the impact of climate change policies on their investment portfolios. This allows them to reassess investment strategies and reallocate capital to low-carbon or climate-resilient activities.
The illustration in Figure 3.5 highlights the five main types of carbon pricing; these options continue to be fine-tuned, adapting to new circumstances and incorporating lessons learned.
A system where emitters can trade emission units to meet their emission compliance targets. By creating supply and demand for emissions units, an ETS establishes a market price for GHG emissions.
Tax directly sets a price on carbon by defining an explicit tax rate on GHG emissions i.e. a price per tCO2e.
An o set mechanism is usually project- or program-based, which o ers carbon credits to entities in accordance with an accounting protocol or their own registry.
RBCF makes payments to programs which are verified to have climate change mitigating outcomes, such as emission reductions.
Organizations usually use internal carbon pricing to direct their decision-making process related to the e ects, risks and opportunities of climate change.
Article 6 of the Paris Agreement allows countries to voluntarily cooperate with each other to achieve emission reduction targets set out in their Nationally Determined Contributions (NDCs) [6].
Article 6.4 of the Paris Agreement approved by the 21st session of the Conference of the Parties (COP) to the United Nations Framework Convention on Climate Change (UNFCCC), provides a framework for the establishment of a global carbon credit market, which is being overseen by a United Nations’ entity referred to as the Supervisory Body. While the Parties of the Paris Agreement have agreed to the basic principles of this market mechanism, negotiations continue about certain elements (e.g., development and assessment of mechanism methodologies, mechanism’s regulations, etc.) that will need to be finalized for the mechanism to reach operationalization.
Through this mechanism, a company in one country can reduce emissions and have those reductions credited so that they can be sold to another company in another country. The second company may use them to comply with its own emission reduction obligations or help it meet its net-zero target.
CCUST value chain will be discussed in two separate sections: CCUS and CO2 transportation. The CCUS section focuses on the latest project development status of CCUS. Meanwhile, the CO2 transportation section covers the major transportation modes for CO2 as a commodity.
Most of the research and feasibility studies [7],[8] primarily focus on examining the feasibility of connecting a single point source of CO2 emissions to a single storage site. Over the last few years, there has been a broader approach which explored the potential of emission clusters and storage hubs.
Industrial clusters will handle CO2 captured from various sources, and they will include different impurities likely to be included in the gas stream. The quantity of captured CO2, number of sources, injection rate, storage type and capacity will all impact the ship size, portside infrastructure and CO2 conditioning needs. Building CCUS hubs near clusters of large emitters can lower costs and accelerate scale-up. Shared transportation, utilization or storage infrastructure could lower costs, increase savings through economies of scale, provide additional options for managing or sharing risks and strengthen regional visibility for support by governmental entities. However, hubs may bring companies together from different sectors that do not normally work together, and this can introduce project complexity as there are multiple collaborators across different industries, all with different timelines and objectives.
Figure 3.5: Main types of carbon pricing [5].Based on the 2022 Status Report from the Global CCS Institute [9], there are over 190 facilities in the global project pipeline; CCS has progressively become commercially competitive in many countries with governmental policy and funding support. As of September 2022, the total output capacity of CCS projects in development was 244 million tonnes per annum (Mtpa) of CO2, which represents a 44 percent increase over the past 12 months. Approximately 45 Mtpa in capacity is operational, while nearly 10 Mtpa is under construction and 100 Mtpa is in advanced development and there has been 5 Mtpa of capacity suspended.
Many factors have led to this rapid growth: public pressure for greater economic prosperity; a just transition; greater demand for low-carbon energy, steel, cement, chemicals and for services to reduce GHGs. Figure 3.6 illustrates the status of carbon capture projects globally.
As of September 2022, there are currently 35 commercial facilities applying CCUS to industrial processes, fuel transformation and power generation. This produces almost 45 million tonnes (Mt) of CO2 annually. While CCUS deployment has been below expectations, there are around 300 projects in various stages of development across the value chain which include 200 new capture facilities that have potential to detain about 220 Mt of CO2 per year by 2030. Even at this level of deployment, it will be well below the International Energy Agency’s (IEA) Net-Zero Scenario (see Figures 3.7 and 3.8).
 Figure 3.6: Global carbon capture capacity.
As of 2022, most of the CO2 capture capacity in operation was used at natural-gas processing plants, but the new CCUS developments are increasingly used for other applications. Based on the IEA’s projections, it is expected that the amount of CO2 captured annually for hydrogen production could reach 70 Mt in addition to the 70 Mt already captured from power generation and 20 Mt from industrial facilities (cement, steel and chemicals).
The technologies used in bioenergy with carbon capture and storage (BECCS) and DAC with CO2 storage are critical to the sector’s development. About 40 bioethanol facilities have announced plans to capture CO2 along with 15 biomass and waste-fired, heat and power plants which have collective potential to capture 15 Mt CO2 by 2030. Finally, the first megaton-scale DAC plant is expected to start operations in the United States (U.S.) by 2024.
There are two routes for captured CO2: permanent storage or utilization by converting into products. CO2 can be used in a broad range of applications, either directly (i.e., not chemically altered) or indirectly (i.e., transformed into various products). In today’s age, approximately 230 Mt of CO2 is used globally each year. This is primarily for production of fertilizers (around 125 Mt/year) and for enhanced oil recovery (around 70-80 Mt/year). Other commercial uses of CO2 include food and beverage production, cooling, water treatment and greenhouses.
IEA disclosed that in 2024, the current and planned annual CO2 storage capacity is 38 Mt, and it will increase to 166 Mt in 2028 and 267 Mt in 2030, respectively. The Net-Zero Emissions (NZE) Scenario predicts that there will need to be 877 Mt of CO2 storage capacity to achieve net-zero emission by 2050. Figure 3.9 illustrates this point.
New utilization pathways in CO2-based synthetic fuels, chemicals and building aggregates are gaining momentum. The current project pipeline shows that approximately 10 Mt of CO2 per year could be captured for these new uses by 2030 with about 7 Mt being captured in synthetic fuel production. If all announced projects are commissioned, they could reach approximately half the level of CO2 utilization for synthetic fuel production by 2030 envisaged in the IEA’s NZE Scenario. To be compatible with the NZE Scenario, all the CO2 would need to come from air or biogenic sources. Currently, this is the case for approximately 4 Mt per year of planned CCU to fuel capacity for 2030 (see Figure 3.10).
Figure 3.9: Annual CO2 storage capacity, current and planned vs. net-zero scenario, 2020-2030.The deployment of other utilization routes remains limited. Only a few large-scale capture projects are targeting the use of CO2 to produce building materials or yield enhancement. However, there are several facilities that exist on a smaller scale to produce CO2-based chemicals and polymers. Some examples are as follows:
• Since 2015, approximately 75,000 tonnes of CO2 per year have been captured from a Capitol Aggregates Cement plant located in Texas. It has then been used for chemical production by the company Skyonic.
• In 2022, U.S. company Twelve announced the scale-up of their technology for electrochemical reduction of CO2 into various products that range from plastics to fuels.
• Econic Technologies announced partnerships with chemical companies in China and India to scale up their CO2 to polymers technology.
Furthermore, there have been recent government funding calls for CCUS hub developments in Canada, Europe and the U.S. to address industrial emissions and accelerate the development of both carbon-removal technology and infrastructure. There are approximately 15 CCUS hubs globally under various stages of development, with many more being planned. Countries and regions making notable progress in CCUS include:
• U.S.: In 2022, the U.S. announced significant opportunities aimed at accelerating the development of CCUS projects. One of the opportunities is the new funding under the 2021 Infrastructure Investment and Jobs Act, and favorable CCUS tax credits changes in the 2022 Inflation Reduction Act.
• EU: In March 2023, the EU introduced the Net Zero Industry Act, which proposes ambitious measures to achieve carbon neutrality. This includes setting an annual CO2 injection target of 50 Mt of CO2 by 2030 and improving permitting procedures for CCUS projects. At the same time, the pilot phase of Project Greensand in Denmark became operational. This project facilitates the transportation of CO2 from Belgium and its storage in a depleted oil field located in the Danish North Sea.
• The U.K. announced 20 bbillion (B) British Pound (GBP) in its Spring Budget for the early deployment of CCUS projects.
• Indonesia: In March 2023, Indonesia finalized its legal and regulatory framework for CCUS, making it the first country in the region to establish a framework for CCUS activities.
• In China, three new projects became operational in 2023 while Japan selected seven candidate projects for support towards their commercialization.
Figure 3.10: Planned commercial CO2 use in synthetic fuel production by CO2 source compared to the net-zero scenario, 2022-2030.CO2 transport is an essential factor of carbon value chain in enabling the deployment of CCUS. The two main options for large scale transport are pipelines (onshore and offshore) and ships. However, for smaller capacities, motor carriers and railways are deployed. Table 3.2 summarizes the different transportation methods and their yearly capacity.
The oil and gas industry has used pipelines for transporting CO2 for more than 50 years, notably for providing injection media for EOR.
Pipeline routing has, thus far, avoided large population centers; however, extensive pipeline networks for large scale CCUS facilities may be more of a challenge. It will be important to minimize risks associated with the potential release of CO2 since, at ambient temperature, it is a colorless, odorless and hazardous gas that can accumulate in enclosed spaces or depressions. Permanent underground storage of CO2 will require thousands more miles of pipeline, both as main trunk lines and feeders from industrial sites where it is captured. As it stands, existing pipelines are unlikely to be suitable for repurposing in many cases due to differences in design parameters.
Another factor to consider is that pipeline costs are proportional to distance while shipping costs are not significantly affected by the same parameters. Total cost of pipelines consists of capital expenditure (capex), especially offshore, while shipping costs are less capex-intense. For point-to-point transport of CO2 between a cluster and a nearby store, pipelines have low operational costs after the initial capex investment. However, for cross-border transport of CO2 which entails longer distances, shipping becomes a cheaper option.
Numerous studies have shown that shipping is economically advantageous over pipelines for distances greater than 700 km and quantities greater than 6 Mtpa. IEA GHG analysis found the distance threshold to be roughly above 650 km for a flow rate of 1 Mtpa and that increases to 920 km for a flow rate of 2 Mtpa.
The Zero Emissions Platform (ZEP) report on CO2 transport costs states that the construction of a “point-topoint” offshore pipeline for a single demonstration project is less attractive than ship transportation for distances under 500 km. An indicative cost estimate for large-scale networks of 20 Mtpa (EUR/tonne CO2) is presented in Table 3.3.
ISO 27913:2016 specifies additional requirements and recommendations — not covered in existing pipeline standards — for the transportation of CO2 streams from the capture site to the storage facility where it is primarily stored in a geological formation or used for other purposes (e.g., EOR or CO2 use).
CO2 as liquid has a higher density than in gas phase, so for economic reasons, it is more practical to transport CO2 as a liquid [12]. Along with pipelines, shipping is turning into a crucial means of moving CO2, frequently when sources and storage locations are too far apart for pipelines. Shipping offers a versatile solution for CO2 transport, especially for dislocated emitters that are far from geological storage solutions. Additionally, it offers the potential to develop projects earlier and at lower costs than pipelines.
Figure 3.11 is a schematic of the CO2 shipping chain from source to storage. It illustrates the process of CO2 being captured from a power plant, then liquefied and stored. It is loaded onto an LCO2 carrier and delivered to the intermediate terminal that is connected to end-point pipelines and storage site.
However, different offloading modes should be considered such as:
• CO2 unloading at port with transportation through a pipeline to a storage injection site (as depicted in the graph).
• CO2 unloading at an intermediate port and loading to another ship for onward transportation to storage or utilization site.
• CO2 unloading at an offshore, subsea injection point.
• CO2 unloading into temporary storage for onward transportation to an injection site, moored storage at an injection site or another port connected to an injection site.
• Ship-to-ship transfer is highly unlikely with its difficulty to deliver, but it should not be ignored.
To enable LCO2 shipping, development of dedicated vessels is a crucial step; however, relevant infrastructure needs to be developed as well. The entire chain should be well defined as it has an impact on the CO2 conditioning requirements (pressure and temperature) and offload conditions or injection. Additionally, different equipment may be required for each case. Currently there are two vessels under construction plus one recently signed that are intended for commercial use (Northern Lights CCS project) and one technology demonstration vessel while two more have recently been ordered for Capital Gas with an estimated delivery of 2025 or 2026. Table 3.4 summarizes the current LCO2 carrier orderbook.
Figure 3.11: CO2 shipping chain.Currently, other than the existing four LCO2 carriers of capacities not exceeding 1,800 cubic meters (m3), the largest capacity CO2 carrying ships are at different stages of construction. The orderbook ranges from 7,500 m3 capacity (intended for the Northern Lights carbon sequestration project) to the recently announced 22,000 m3 capacity.
The presented concept designs in this report are a result of collaboration between ABS and an engineering design firm. They have been based on a 10-bar operating pressure, corresponding to an operational liquid phase temperature range of -45° C to -50° C. This is believed to be a good compromise between a reasonably broad temperature range for control of the liquid phase and minimization of overall pressure for large C-Type cylindrical tank construction. These temperature and pressure values are kept constant by an onboard refrigeration plant. These CO2 carrier concept designs also include CCS to capture the CO2 produced from the conventionally fossil fueled engines and auxiliaries.
Given the relatively high-pressure range, CO2 storage tanks are typically small diameter cylindrical C-tanks. The larger tanks that have been built for shipping purposes are those on the ship Yara Gerda, which have a capacity of around 1,800 m3 and operate at a minimum temperature of -30° C (and presumed to be at a pressure of around 18 bar). However, scaling up cylindrical C-tanks can be problematic since the outer shell steel thickness depends on the maximum operating pressure value and the tank diameter. For this reason, most commercial tanks retain a relatively small diameter and increase capacity by increasing the tank length. Of course, this limits their maximum size as a result of the increasing length/diameter aspect ratio.
The feasibility of very large CO2 carriers (e.g., a total cargo capacity of 80,000 m3) depends on the maximum operating pressure. In turn, this determines the temperature range the tank insulation and refrigeration system needs to maintain to prevent over-pressure venting from boil off. As an illustration, an 18-bar max operating pressure implies an operating temperature range of approximately -25° C to -50° C, which is easily and safely manageable for any standard refrigeration system and reasonably cheap external polyurethane insulation. At this pressure, while using a 25 mm thick high tensile steel shell, the maximum tank radius is around 7 meters (m). The same shell thickness at 10-bar max operating pressure allows a maximum tank radius of up to 12.5 m; however, it also requires a much narrower operating liquid temperature range of about -45° C to -50° C with colder temperature transition to the solid phase and higher boiling temperature transition to the gaseous phase. The latter temperature range is more difficult to manage and would require more effective (and expensive) insulation, as well as a more sensitive and reliable temperature and pressure control system.
For the above reasons, Type C cylindrical tanks can be designed for higher pressures (18-24 bar), but their size quickly becomes limited by the need to maintain a reasonable shell thickness for manufacturing. Assuming that a tank has a 25 mm maximum thickness E690 high-tensile steel, the maximum tank size is around 10,000 m3. In the case of stainless steel, the size would drop to 1,000 m3 or less unless shell thicknesses above 25 mm are used. If the design pressure is reduced to 10 bar, the maximum E690 tank size for Type C cylindrical tanks based on 25 mm thickness would roughly be 30,000-40,000 m3, while the equivalent stainless steel of equal shell thickness would only be about 5,000-6,000 m3. Stainless steel tanks of equivalent sizes could only be built in specialized facilities that are able to increase the shell thickness well above 25 mm.
Bi-lobe tanks would be suitable for the larger sizes of CO2 carriers due to the volumetric efficiency they offer in cargo hold comparing to cylindrical tanks. However, the detailed construction of these tanks depends on careful design and manufacturing of the internal stiffeners. It is conceivable that similar sizes to those of the cylindrical tanks might be achievable for the higher maximum operating pressures (at least 10 bar) needed for CO2. While this is, at present possible, it is also highly speculative. Figure 3.12 illustrates the different IMO tank types.

A multi-gas option strategy would need to effectively address all the individual risks from the intended gases and those which might arise from having two or more gases, e.g., CO2, liquefied petroleum gas (LPG), NH3, on a vessel. The potential design of such a carrier will consider the following points:
• Applicability of international regulations and codes and potential conflicts among cargoes.
• Material availability and compatibility with all potential cargoes (adequate properties).
• Individual gas characteristics (flammability, toxicity, corrosivity etc.).
• Constraints due to gas characteristics.
• Increase in overall cost due to engineering design constraints (for instance LCO2 is carried only in Type C tanks).
• Technological development and readiness to handle various cargoes (reliquefication plants, cargo pumps and compressors).
• Hazardous areas and ventilation requirements.
While it is still uncertain how big the CO2 market will be, with more and more CCUS projects being announced, it is expected that increasing the number and unit capacities of the LCO2 carriers will be essential to transport the large volumes of captured CO2
In response to this anticipated demand, shipyards are currently investigating larger designs, ranging from 10,000-100,000 m3. ABS stays close with these developments and has worked with all major shipyards with respect to issuing approval in principle (AIP) for their designs.
To achieve the larger capacities, design developments from shipyards are focusing on transporting CO2 at pressures closer to its triple point (5.18 bar, -56.6° C for pure CO2), where CO2 density is approximately 1,100 kg/m3 and enables transportation of a greater cargo quantity comparing to higher pressure and lower density. The construction of larger sized tanks is also more favorable at lower pressures, as higher design pressures require thicker steel plates. The key point when transporting CO2 near its “triple point” — the temperature and pressure at which the three phases (gas, liquid and solid) coexist — is to avoid transitions from the liquid to solid phase and solidification of cargo that can subsequently cause tank and equipment damages, piping clogging, etc.

Pressure (p) > 2,000 mbar
No Secondary Barrier
Independent Type C Tanks Bi-lobe/Tri-lobe CylindricalType C tanks are considered the most appropriate for LCO2 carriers; normally, the tanks are cylindrical or bi-lobe shapes and arranged in vertical or horizontal configurations. The diameter of these tanks vary between 10–30 m, depending on the individual tank's capacity. Material choices should take into consideration the low-temperature operating conditions close to triple point, corresponding to approximately -50° C. Low-temperature carbon manganese steel is suitable for CO2 storage while Nickel steel may also be applied. However, it may not be a viable solution from a cost perspective. Simple polyurethane (PU) foam insulation is applied externally by spray.
Plate thickness is correlated to design pressure and affects the maximum diameter and tank capacity. If higher pressure is used, higher steel plate thickness will be required which will increase the weight of the tank. A plate thickness of 40-50 mm can be considered for the construction of these tanks, and shipyards are working to develop effective tank materials that will meet the rules and regulations requirements. Additionally, cargo tanks should be continuously monitored for low pressure, and safety functions will be activated when pressure falls within 0.05 megapascal (MPa) above triple point as prescribed in the IMO’s International Code of the Construction and Equipment of Ships Carrying Liquefied Gases in Bulk (IGC Code).
The most common storage used for CO2 in land applications is in its liquid form. Storing CO2 as a liquid requires compression to at least 6 bar and refrigeration to keep it in liquid form. Although low-temperature CO2 liquefaction is not a simple process on board ship, liquid CO2 near the triple point occupies 561 times less volume than gaseous CO2. At ambient temperature, even if compressed to the same pressure as that necessary to liquefy it, gaseous CO2 would still occupy 94 times more volume than liquid CO2 of the same mass.
The LCO2 carrier cargo tank design (see Figure 3.13) is driven by the conflicting requirements of guaranteeing reasonable tank construction characteristics with an appropriate shell thickness chosen for the tanks shell. The goal is to be able to sustain 10-bar operating pressure and minimize the refrigeration plant power requirements with a reasonable insulation thickness by supplying the lowest tank surface to volume ratio. Furthermore, a design philosophy choice was made that these LCO2 carriers should use conventional fossil fuel propulsion and auxiliary plants with an appropriately sized CCS system. Finally, the high cargo specific gravity (liquid CO2 weighs approximately 1.1 t/m3) and the weight of the tanks imposed reasonably large residual buoyancy in addition to the net cargo tank volume.
For both LCO2 ships, the same basic tank setup was chosen with two main cargo tanks occupying the ship’s mid-body and a smaller CCS tank at the bow. The trim is controlled by exchanging a sea water ballast (SWB) for CCS LCO2 as this gets generated and stored. The CCS tank is a vertical cylinder to better accommodate it in the finer bow sections and minimize free surface effect. The CCS liquefaction plant is separate from the cargo and CCS refrigeration plant to simplify and minimize the requirements and management of the refrigeration plant power.
Since the CO2 market is not yet established, these ships were designed so that they could carry alternative cargo. This is relatively simple for refrigerated LPG, which does not impose any changes to the basic design. However, it could be more complex and expensive to carry ammonia as an alternate cargo for several reasons. One such reason is the imposition it would have on the use of stainless steel for the cargo tanks, in addition to a more complex cargo handling and piping system, and with a doubling of shell thicknesses compared to the high-tensile E690 steel used for CO2 and LPG. ABS | VIEW OF THE
The 25k LCO2 vessel features two identical cargo tanks that are 8.25 m in radius and 58.25 m in length. Each tank is 11,900 m3 in volume and has a 40 mm thick shell if fabricated in stainless steel. With this shell thickness, each tank weighs around 1,000 t. If the tanks are to only carry CO2 or LPG, the thickness of E690 could be reduced to 17 mm, implying a weight of 425 t per tank. Additionally, both tanks are insulated with 0.5 m thick polyurethane foam that is covered by a high-reflective white outer shell. Estimated heat ingress rate is 22 kilowatts (kW) per tank, which is removed from the refrigeration plant.
The CCS tank is 6.3 m in radius and 15.95 m in height. Its capacity is 1,730 m3, which covers all the CO2 generated by the vessel’s fuel capacity. It has a 20 mm thick shell, and it is fabricated in E690 steel. The total tank weight is around 115 t and it is insulated with 0.5 m thick polyurethane foam that is covered by a highreflective white outer shell, resulting in an estimated heat ingress rate of just 5 kW.
The main engine’s maximum continuous rating (MCR) is 5.85 megawatt (MW), plus 4.95 MW for auxiliaries. The CCS system power requirements take approximately 1.1 MW of the auxiliary power to feed an amine carbon capture plant in addition to a CO2 liquefaction plant. The remaining installed auxiliary power is needed for the cargo refrigeration plant and shipboard consumption, having assumed appropriate redundancies. Propulsion is provided by a single 6.6 m diameter high performance propeller that is matched to a rudder bulb. The remaining auxiliaries’ power feeds the ship load and the cargo refrigeration plant. The main engine and fuel tank capacity are sized to provide enough power to sail at 14.5 knots with a 20 percent sea margin for 17.2 days, covering 6,000 nautical miles range. Refer to Table 3.5 for relevant onboard carbon capture system parameters at 90 percent capture rates.
Additionally, the vessel is sized to carry CO2. This means that no ballast, other than the ballast needed to offset the CCS tank contents, is needed when CO2 is loaded. However, SWB is needed to counterbalance the significant difference in specific gravity (SG) between liquid CO2 and LPG or ammonia when these cargo types are carried instead. Damage stability is ensured, extending the SWB J-tanks to the B/5 line, placing the cargo holds beyond max IMO damage penetration.
The basic design for the 82k LCO2 carrier (see Figure 3.14) is the same as for the 25k LCO2 carrier, with two main cargo tanks occupying the ship’s mid-body and a smaller CCS tank at the bow. The 82k LCO2 vessel cargo tanks both have 13.22 m in radius, and they measure 74.22 m and 78.22 m in length. The aft tank is 38,300 m3 in volume, while the forward tank has a total capacity of 40,600 m3. They need a 62 mm thick shell if fabricated in stainless steel and would weigh around 3,200 and 3,400 t, respectively. If the tanks were only to carry CO2 or LPG, the thickness could be reduced to 26 mm, implying a weight per tank of approximately 1,400 t. Both tanks are insulated with 0.5 m thick polyurethane foam that is covered by a high-reflective white outer shell. the estimated heat ingress rate is around 46 kW per tank, which is removed from the refrigeration plant.
The CCS tank is 8.0 m in radius and 24.0 m in height. Its capacity is 4,250 m3, which covers all the CO2 generated by the vessel’s fuel capacity. It has a 25 mm thick shell, and it is fabricated in E690 steel. Total tank weight is around 270 t and it is also insulated with 0.5 m thick polyurethane foam that is covered by a highreflective white outer shell, resulting in an estimated heat ingress rate of 10 kW. All tanks are protected from the elements by a main deck superstructure.
The main engine’s MCR is 12 MW, with an additional 6.6 MW for auxiliaries. The CCS system power requirements take approximately 2.4 MW of the auxiliary power to feed an amine carbon capture plant in addition to a CO2 liquefaction plant. Propulsion is provided by a single 8.4 m diameter high performance propeller that is matched to a rudder bulb. The remaining auxiliaries’ power feeds the ship load and the cargo refrigeration plant. The main engine and fuel tank capacity are sized to provide enough power to sail at 14.5 knots with a 20 percent sea margin for 17.2 days, covering 6,000 nautical miles range. Stability and subdivision are the same as the 25k LCO2 vessel. Refer to Table 3.6 for relevant onboard carbon capture system parameters at 90 percent capture rates.
Ship-based CO2 transport relies on refrigeration to liquefy the CO2 and make it denser, allowing for the transport of more tonnes for a given volume. Early ship designs were specialized carriers that shuttle CO2 from specific CO2 harvesting plants. These early ships were based on LPG carrier designs that already existed. The current fleet of dedicated LCO2 carriers is limited to only four vessels that serve the food and beverage industry; these ships have small capacities (~1,700 tonnes of CO2) and operate at high pressures (15-19 bar). The current orderbook includes three vessels of 7,500 m3 capacity, each destined for Norway’s Northern Lights project; they will transport pure CO2 and operate at medium operation pressures (13–18 bar). In March 2023, Japanese shipbuilder, Mitsubishi Shipbuilding, launched a LCO2 demonstration test vessel intended for CCUS. This demonstration vessel will be equipped with the liquefied CO2 tank system that was researched and developed by the Engineering Advancement Association of Japan (ENAA). Future CO2 ships are expected to be built using brand-new designs and bigger capacities to enable longer open-sea transport routes. Recently, Greece’s Capital Gas Ship Management Corp announced their order of two 22,000 m3 gas carriers, which is capable of transporting LCO2, LPG and ammonia. The ships will have energy-saving technologies, including onboard carbon capture and cold-ironing (shore power), as well as dual fuel “ammonia-ready” engines that can run on LNG and ammonia fuel in the future.
Figure 3.14: 82k LCO2 carrier concept design.The design and construction of LCO2 carriers is covered by IGC Code, which also sets the standards for all liquefied gas carriers. Chapter 17.21 of the Code sets high-level, prescribed requirements to mitigate the risk of cargo freezing that focus on:
• Cargo tanks pressure/temperature monitoring.
• Safety functions when pressure falls within 0.05 MPa of the triple point.
• Cargo tank relief valves isolation and interlock.
• Materials selection.
• Gas detection requirements.
Chapter 17.22 refers to the reclaimed quality CO2 and the corrosion issues that impurities, such as water, sulfur dioxide, etc., can cause. The next revision of the IGC Code is expected to include more details on CO2 shipping.
The society of International Gas Tanker and Terminal Operations (SIGTTO) also worked with industry to address the hazards of CO2 transportation and provide recommendations to the IMO to improve the Code. In the meantime, several SIGTTO publications are available and may be relevant to LCO2 carriers.
The development of LCO2 carriers requires a solid understanding of the behavior of CO2 as cargo, especially when transported close to triple point. CO2 is a non-flammable gas where many of the hazards associated with transportation of flammable liquefied gases in IGC Code (e.g., LNG, LPG, etc.) are not applicable. However, to carry it in liquid phase, it is necessary to compress CO2 to a pressure at least that of its triple point (5.18 bar) and refrigerate it to temperature values close to (but not below) -56.6° C as the liquid would freeze at any pressure below that. If carried near this triple point pressure, the cargo would be difficult to control as the temperature range between the solid, liquid and gaseous phase of CO2 is very small.
In practice, most commercially available LCO2 tanks operate at pressures between 12 bar (at temperatures under -30° C) and 24 bar (at temperatures under -15° C). Figure 3.15 provides an illustration of the CO2 pressure and temperature phase diagram.
At atmospheric pressure, CO2 has a density of approximately 1.98 kg/m3 while at liquid phase — close to -50° C and 7 bar — it reaches approximately 1,100 kg/m3. This means that CO2 is denser than air (approximately 1.5 times) and would accumulate in lower areas in case of a potential release. Higher density means that more CO2 can be transported. For liquid CO2, the density increases when reducing the pressure due to the lower equilibrium temperature.
CO2 is an asphyxiant (see IGC Code Chapter 19) but there are also several standards that highlight CO2 toxicity in high concentrations. Exposure limits from various standards are shown in Table 3.7. If a cargo is designated as “toxic,” more stringent measures are applied.
IV.
Operating an LCO2 carrier close to triple point requires the careful design of cargo-handling equipment and piping to avoid the formation of dry ice. In general, it is expected to follow a similar philosophy for LPG carriers. Any discharge piping from safety-relief valves will need to remain free of obstructions that could cause clogging.
Operational procedures should be established to mitigate the risk of losing pressure/temperature controls and the solidification of cargo. Installation of the reliquefication plant will depend on the individual vessel’s trading pattern and voyage duration.
CO2 composition plays a key role in designing these vessels and associated systems. Most designs consider pure CO2. Composition can be influenced by the CO2 source and capture technology, the transportation conditions (pressure/temperature) and destination storage reservoir.
Impurities in the mixture have impacts on:
• Thermophysical properties and phase behavior. Some impurities could potentially alter the phase envelope of CO2, which in turn, could affect the triple point or density.
• Corrosion and material suitability. CO2 with free water creates carbonic acid which is highly corrosive. Reaction and cross-effects of impurities should be investigated.
• Reliquefaction plant design (non-condensable and cargo contamination).
• Health and safety due to toxic components in the mixture. Insignificant amounts of hydrogen sulfide (H2S) or sulfur dioxide (SO2) may pose a substantial risk due to their toxicity.
So far, there is limited work on standardization of CO2 specifications for shipboard transportation. The majority refers to pipelines. Impact of the impurities in the CO2 mixture needs to be investigated through proper research specifically for shipboard transportation.
Table 3.8 shows an indicative list of impurities reported in published specifications. Table 3.9 includes concentration recommendations for ship transport from EU CCUS Projects Network.
Component
Water (H2O)
Hydrogen Sulfide (H2S)
Carbon Monoxide (CO)
Methane (CH4)
Nitrogen (N2)
Oxygen (O2)
Argon (Ar)
Hydrogen (H2)
Component
Nitrogen Oxides (NOx)
Sulfur Oxides (SOx)
Acetaldehyde
Amine
Ammonia (NH3)
Cadmium (Cd) / Titanium (Ti)
Formaldehydes
Mercury (Hg)
Table 3.8: Indicative list of impurities in CO2 mixture.
It is still uncertain how big the CO2 market will be. However, with more and more CCUS projects being announced, it is expected that increasing the number and unit capacities of the LCO2 carriers will be essential to transport the large volumes of captured CO2, and the projections of future fleet are ambitious. According to a 2018 study by European Zero Emission Technology and Innovation Platform (ETIP ZEP), it is estimated that 600 vessels will be required for CO2 transport due to the burgeoning CCUS application for supporting the CCUS sector in Europe. Although the study was EU specific, the CO2 vessels will support the development of the carbon value chain all over the world.
From the current orderbook, there have been at least three vessels that are confirmed to support actual offshore sequestration projects (e.g. Northern Lights), and if the market follows the IEA estimation of needing a 16-fold increase in CCUS capacity by 2030 and a 100-fold increase by 2050, it can be estimated that the number of vessels required will be 48 in 2030 and 300 by 2050 (see Figure 3.16). The range varies between 50 to 600 vessels between the years 2030 to 2050. While the specific number is not the most important part, it helps showcase that the general trend is increasing.
As the size of the vessels gets larger, the number of vessels may reduce; however, the total capacity required will follow the market trend of greater need for LCO2 carriers. There are several assumptions and variables in estimating the size of the market such as the CCUS market size, the announcements of projects and their successes, economic climate and disruptions, etc.; however, it is still uncertain how big the market will eventually be. But as new projects are announced and source to sink matching is done, it becomes apparent that new vessels will be required to satisfy the demand for offshore storage.
In addition, the CO2 utilization market is nascent and there is large variability in the expected growth of the market. That will also pull in additional demand and lead to further growth in the size of the LCO2 vessel market.
a The number of vessels ordered ub Carbon Storage application (Northeren Lights (3), Sanyu Kisan (1) and Capital Ship Management Corp (2))
b Represents a 16-fold increase to meet the IEA estimated total CCUS requirement of 800 Mtpa from 50 Mtpa in 2020
c Represents a 100-fold increase to meet the IEA estimated total CCUS requirement of 5,000 Mtpa from 50 Mtpa in 2020 d EU Zero Emission
Understanding CO2 emitters and captured carbon destination is crucial in analyzing LCO2 trading routes. By identifying and prioritizing the key LCO2 trading routes, stakeholders can focus their efforts and resources on implementing CCSTU projects. There are different categorizations that may be followed to sort emitters, end users and sequestration sites, some of which are listed below:
Sector-Based: Grouping emitters based on sectors such as power generation, industrial processes, transportation, buildings, agriculture and waste management allows for targeted strategies tailored to the specific characteristics and challenges of each sector. Different sectors may have unique CO2 emission profiles and technological requirements for CCUS implementation.
Regional: Analyzing carbon utilization and sequestration on a regional or geographical basis helps identify hotspots of post-captured carbon processing. Focusing CCUS efforts on regions with high emissions can make a substantial difference in overall carbon mitigation. Additionally, regional categorization considers factors like population density, industrial concentration and environmental vulnerabilities, thereby influencing the feasibility and impact of CCUS projects.
Fuel Source: Distinguishing emitters based on their primary fuel sources such as coal, natural gas, oil, or biomass provides insights into the carbon intensity of various energy systems, as well as the means of carbon utilization.
CCUS Infrastructure Availability: Categorizing emitters based on their proximity to CO2 storage sites, existing pipeline networks or potential utilization opportunities can inform the feasibility of the development of CCUS projects in these sites.
The 2022 IEA report for CO2 emissions indicates that global energy-related CO2 emissions grew by 0.9 percent (or 321 Mt) in 2022, reaching a new high of over 36.8 gigatonnes (Gt). Emissions from energy combustion increased by 1.3 percent (or 423 Mt), while emissions from industrial processes decreased by 102 Mt.
Power generation is the top emitting sector, with industry ranked second close to transport. Power generation also comes first among the other sectors with respect to an absolute increase in emissions from 2021 to 2022. This increase corresponds to 261 Mt (or 1.8 percent), reaching an all-time high of 14.6 Gt. Gas-tocoal switching in many regions was the main driver of this growth: CO2 from coal-fired power generation grew by 2.1 percent and was led by increases in the Asian emerging market and developing economies. Natural gas emissions in the power sector remained close to 2021 levels; however, it was significantly propped up by an increase in the U.S. At a global level, CO2 emissions from power and transport (including international bunkers) grew by 261 Mt and 254 Mt. This is, respectively, more than offsetting reductions from industry and buildings. Figures 3.17 and 3.18 illustrate this data.
The latest outlook from IEA for the electricity market includes a projection for a slight decline of CO2 emissions of approximately 1 percent, both in 2023 and 2024, as electricity generation from fossil fuels shrinks. Falling coal-fired generation is the main driver of this decline, with a drop in total CO2 emissions of approximately 140 Mt over the current period and up to 2024. Oil follows with a decrease of 100 Mt. Total change in emissions from gas fired generation out to 2024 is expected to be close to zero as slight increases in 2023 are expected to be offset by declines in 2024. The top 10 CO2 emitting countries are illustrated in Figure 3.19.
Figure 3.17: Global CO2 emissions by sector [17]. Figure 3.18: Global CO2 emissions [18].China has been the world's largest CO2 emitter. The country's rapid economic growth and industrialization have led to significant increases in CO2 emissions over the past few decades. The primary source of CO2 emissions in China is the burning of fossil fuels, particularly coal, for energy generation and industrial processes. The U.S. is the second largest CO2 emitter with the largest sources coming from transportation, power generation and industry. The country heavily relies on fossil fuels, including coal, natural gas and oil, to meet its energy needs. Although the U.S. government undertook significant efforts on adoption of renewable energy sources, fossil fuels still dominate the energy mix, contributing to CO2 emissions. India, Russia and Japan are among the top emitters by region. Coal still makes up a significant share of these courtiers’ energy consumption. Those top emitters will be acting as the carbon exporters if their domestic carbon utilization and sequestration capacities cannot consume the produced CO2
It is estimated that the CO2 commodity market could increase between 1 and 7 Gt of CO2/year by 2030 as new methods of carbon utilization are unlocked, such as the use of fuels, chemicals and building materials. The utilization value chain is overly complex and may not develop as fast as required to help reduce GHG emissions; hence, the disposal of CO2 — by injecting it into geological formations — will be necessary.
Only a few large-scale (> 100,000 tonnes CO2 per year) capture plants using CO2 for fuel, chemical production and yield enhancement are operational today, with the most recent commissioned at a steel plant in December 2022. Plans are underway for around 15 additional capture facilities targeting CO2 utilization for synthetic hydrocarbon fuels through Fischer-Tropsch (FT) synthesis, direct conversion to methanol or fermentation to ethanol. Together, these large-scale plants could be capturing and using around 7 Mt CO2 by 2030.
Figure 3.19 Top 10 CO2 emitting countries [19].An increasing share of the synthetic fuel project pipeline is targeting sources of CO2 that are compatible with a net-zero trajectory, including air and bioenergy or waste plants:
• Project Air in Sweden aims to start producing 200,000 tonnes per annum (tpa) of methanol in 2025, using CO2 captured from a biogas plant and electrolytic hydrogen.
• Highly Innovative Fuels (HIF) global is studying the feasibility of large-scale air-sourced synthetic fuel production facilities, with plants being developed in Chile, the U.S. and Australia.
• In Switzerland, Synhelion started construction of their first synthetic fuel plant using solar-based thermochemical conversion technology and sourcing CO2 from a nearby pulp and paper mill.
CO2 storage involves injecting captured CO2 deep into an underground geological reservoir comprised of porous rock covered by an impermeable layer of rocks. This sealing layer ensures that the CO2 remains within the reservoir, preventing any upward movement or "leakage" to the atmosphere. Several types of reservoirs are suitable for CO2 storage, with deep saline formations and depleted oil and gas reservoirs offering the largest capacity.
Deep saline formations consist of porous and permeable rocks saturated with salty water (brine) and are found in both onshore and offshore sedimentary basins. They offer extensive storage potential for CO2 Depleted oil and gas reservoirs are porous rock formations that have naturally trapped crude oil or gas for years before being extracted. These reservoirs can effectively trap injected CO2, making them suitable for large-scale CO2 storage.
Global CO2 storage resources are considered well over future requirements. However, in many regions, further assessment work is required to convert theoretical storage capacity into “bankable” storage to support CCUS investment. As per IEA analysis, billions of tonnes of CO2 will need to be stored in a net-zero pathway, but this is dependent on identifying and developing the world’s vast resources for geological storage. IEA detailed geospatial analysis shows that approximately 70 percent of power and industrial emissions in China, Europe and the U.S. are within 100 km of potential storage. For comparison, in the U.S., CO2 captured at existing facilities is transported an average of 180 km via pipeline today.
The proximity of storage to emission sources, where feasible clustered around CCUS hubs with shared infrastructure, will be a crucial factor in reducing costs, decreasing infrastructure development times and enabling a rapid rollout of CCUS.
The IEA examined the opportunity for CO2 storage in three key regions:
• U.S.: The leader in global CCUS deployment, home to more than 60 percent of current CCUS capacity and approximately 50 percent of capacity under development.
• Europe: Progressing significant CCUS development in the North Sea and around CCUS hubs. In September 2020, the Norwegian government committed $1.8B to the Longship CCS project, which includes the “Northern Lights” CO2 transport and storage hub. Additionally, the U.K. government has announced 1B GBP to establish CCUS in four industrial regions.
• China: Accounts for around one-third of global emissions today with the 2060 carbon neutrality target announced in September 2020 already providing a major push for CCUS.
Figure 3.20 showcases the theoretical CO2 storage capacity by region. The availability of storage differs across regions, with Russia, North America and Africa holding the largest capacities. Substantial capacity is also thought to exist in Australia. Furthermore, it is obvious that for most of the regions, more than 50 percent of storage capabilities are onshore. Graph results are, of course, theoretical estimations and any actual storage capabilities will be defined after detailed site explorations which will require considerable time supported by legal and regulatory frameworks.
Figure 3.21 illustrates the increase of carbon storage projects. The stacked columns indicate the yearly injection capacity rather than the total storage capacity. The “capture” line illustrates capture capacity. The Asia-Pacific column excludes data from China to avoid double counting.
In the U.S., there is a clear increase in CO2 storage capacity with a doubling in the announcement of new projects in 2022 compared to 2021, according to IEA data. A similar increase in storage capacity can be seen in Europe, mainly in the North Sea region. The Asia-Pacific region is also seeing an increase on the announcement of new storage capacity. An example is the region of Japan which has set up an annual CO2 storage target of 6–12 Mt CO2 per year for 2030 and 120-140 Mt CO2 per year for 2050.
Figure 3.20: Theoretical CO2 sequestration capacity by region [20].The CO2 shipping market has yet to be established, and the potential trading patterns for LCO2 carriers are expected to start emerging once the location of sequestration and utilization projects become clearer. With the current data for the emitters by region and storage capacities, only a few assumptions can be made.
Although there are several regions that are in the top 10 emitters, there are other sites that can provide additional storage capabilities in terms of sequestrations and potential trading patterns.
While the U.S. is expected to have significant storage sources, it is not expected to have transatlantic trading. Long duration voyages should also consider cargo conditioning using reliquefaction plants that increase operational costs.
European mapping of geological CO2 storage sites and estimations of CO2 storage capacities have indicated a large potential in the Nordic region. Extensive sedimentary basins in the Baltic Sea, the Skagerrak area, the North Sea and the area offshore mid-Norway have been assessed to be able to store substantial amounts of CO2 in deep saline aquifers and depleted oil and gas fields. This site could be a potential location for North and Central Europe to access sequestration.
The EU and China pledged to further develop their bilateral cooperation on carbon markets in the EU-China Joint Statement on Climate Change adopted at the EU-China summit in 2015. The EU and China signed an MOU to further their collaboration on emissions trading during the EU-China summit in 2018. Additionally, the 2015-launched Korean emissions trading system (KETS) accounts for over 66 percent of all GHG emissions in Korea. It is the first UNFCCC-mandated carbon trading system for non-Annex I nations. The KETS may lead to an increase in carbon trading among developing nations and growing economies.
Based on the collected data from both carbon emissions [21] and carbon sequestration capacities [22] the country-based gap value can calculate by the ratio of annual carbon emissions and theoretical carbon sequestration capacities as indicated in Table 3.10.
*Theoretical CO2 storage for Iran and Saudi Arabia is assumed as the Middle East sequestration capacity; Germany is using Europe sequestration value; Indonesia is applying southeast Asia sequestration value.
As indicated in Table 3.10, Japan, South Korea, Russia, China and India share the least carbon gap ratio values, so these five countries display a higher possibility to be carbon exporters. Meanwhile Saudi Arabia, Iran, Canada, Indonesia and Germany share the largest values of carbon gap ratios, making them more susceptible to serve as carbon importers. Therefore, the possible CO2 shipping routes has potential to be from Northeast Asia to Southeast Asia, Russia to Europe/Eurasia and India to Middle East/Southeast Asia by considering the geographical locations (see Figure 3.22). Other possible carbon trade routes may be U.S. to Canada/Central America and European emitters to the North Sea/North Africa. Carbon routes projection is more sensitive for voyage distance since carbon price is a major driver for LCO2 trade.
Figure 3.22: Global carbon trade routes projection.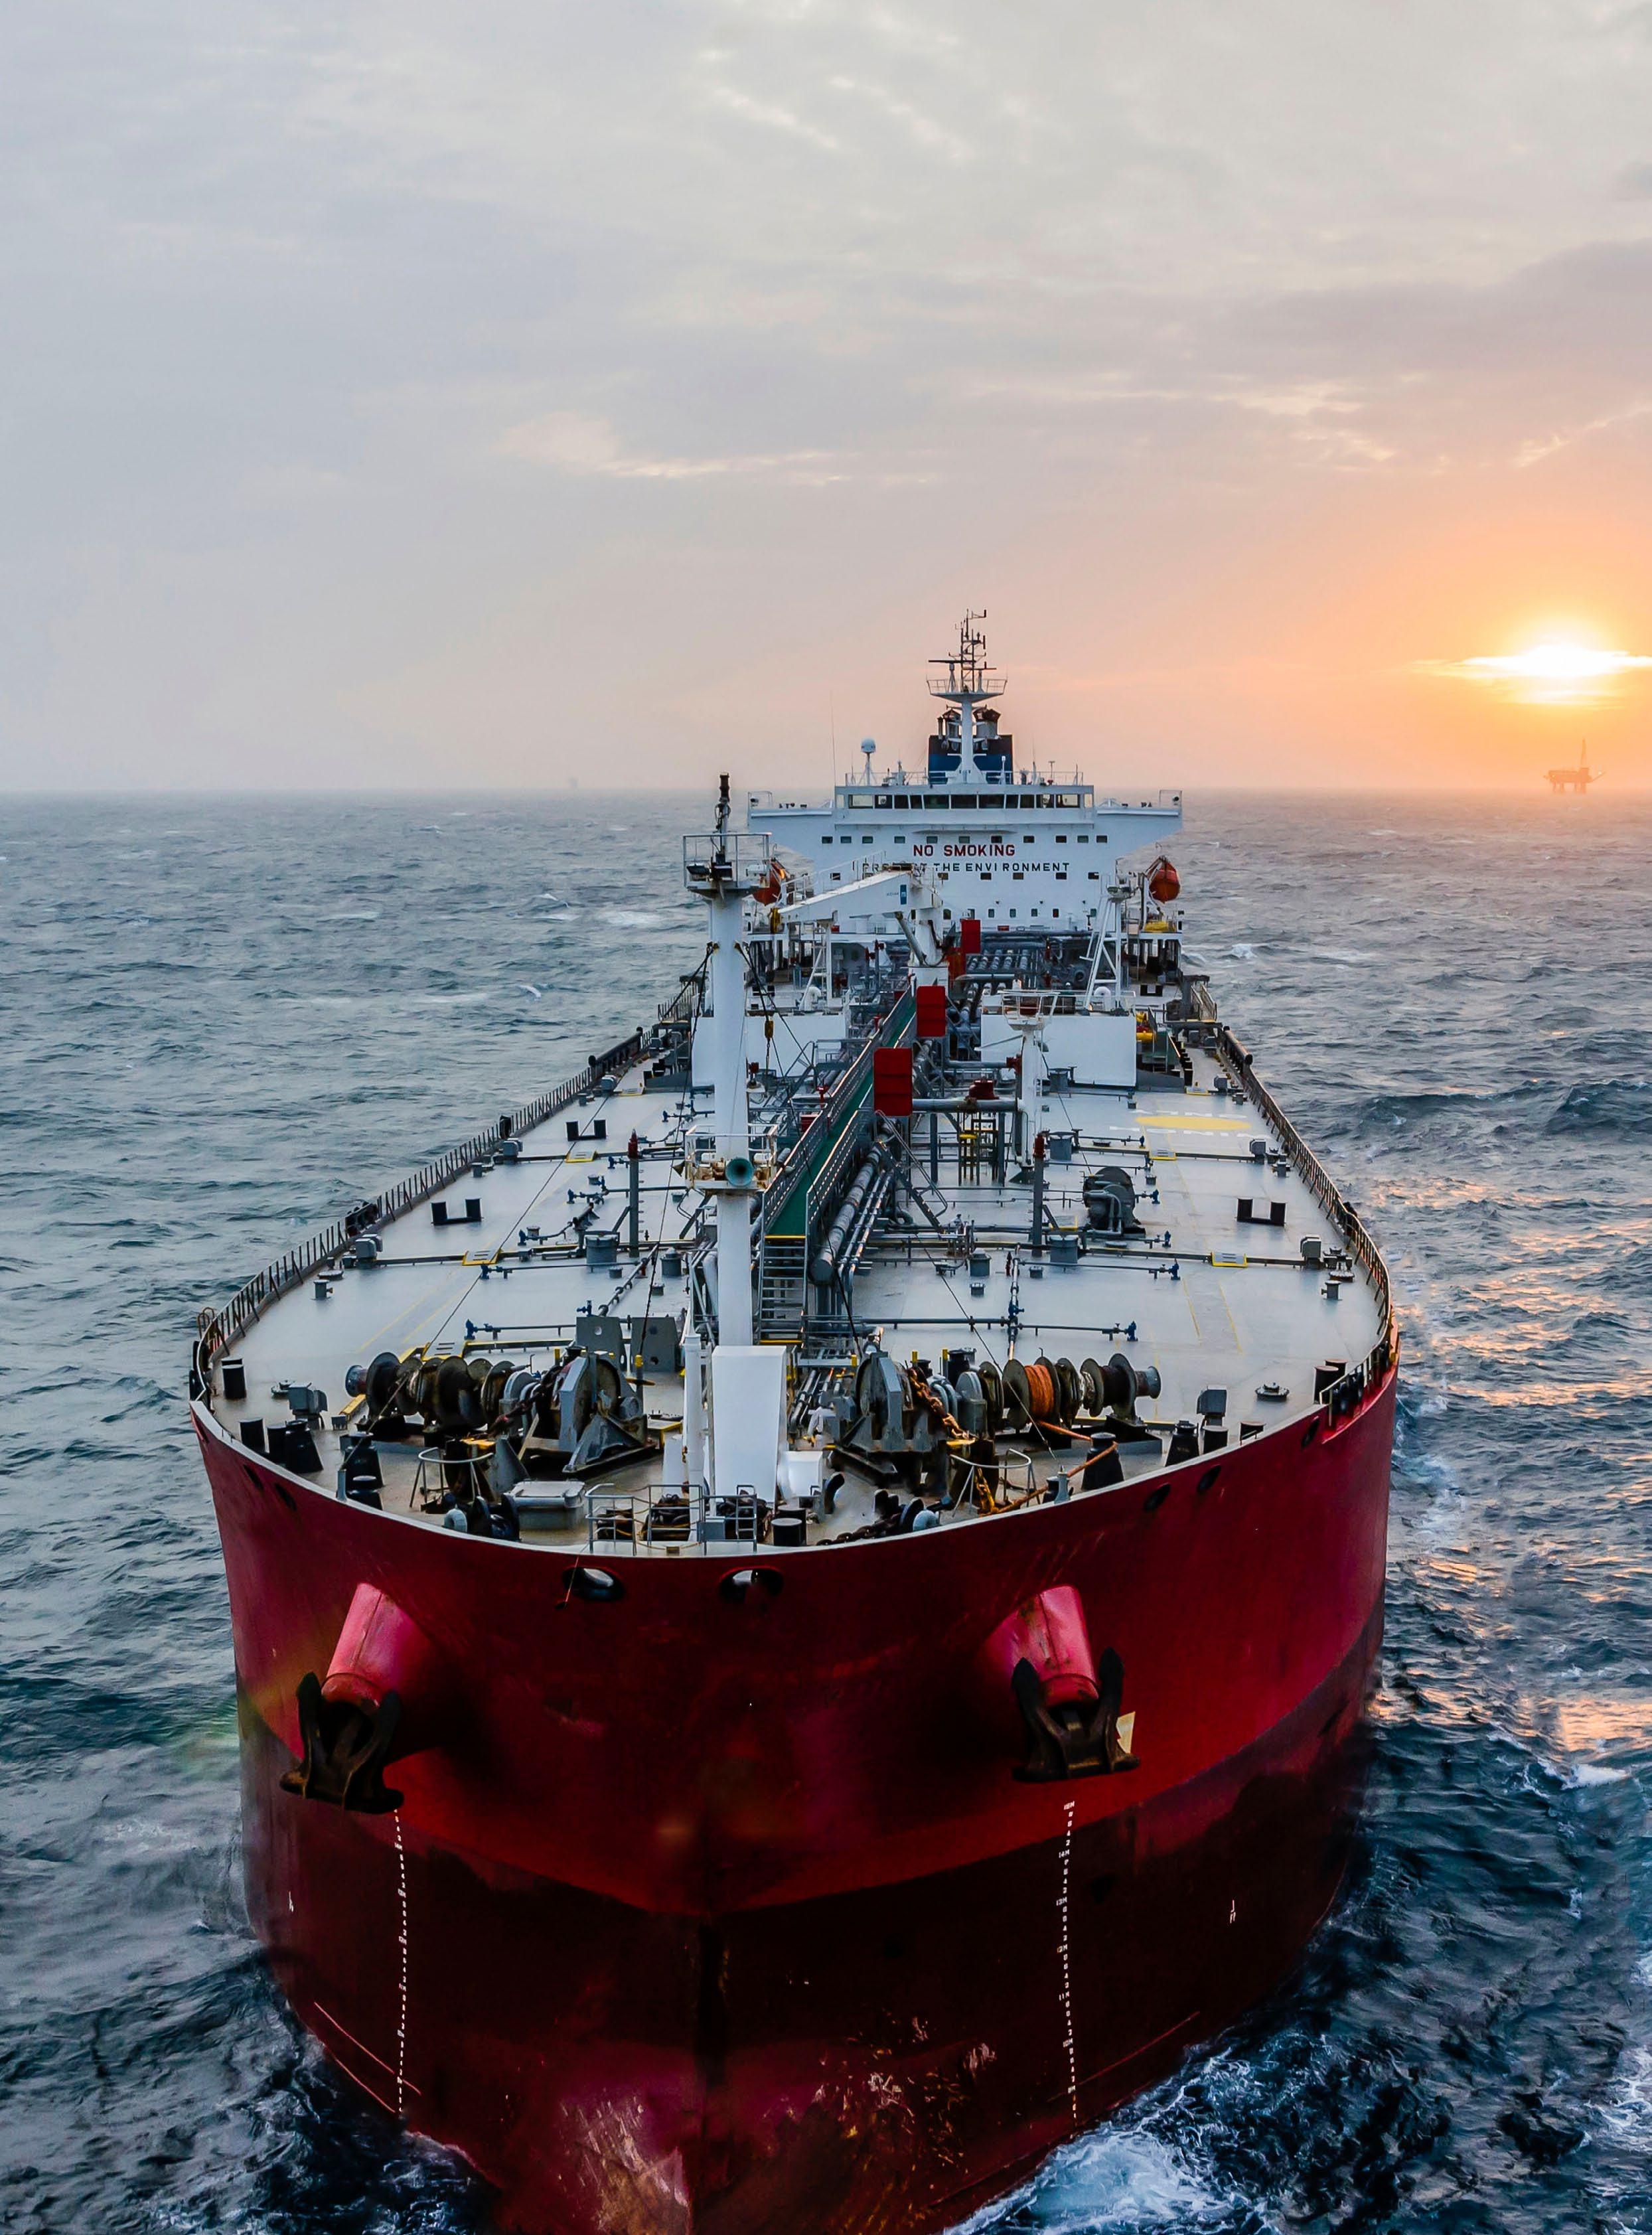


In a world that is increasingly interconnected and more environmentally conscious, ammonia (NH3) is gaining prominence as a key player in the global energy landscape. Ammonia has numerous industrial applications and in addition to being a key component in the production of fertilizers, it’s also emerging as a potential alternative marine fuel. This section examines the complex and expansive ammonia value chain and its significant connection to the marine industry that is currently at a turning point of innovation and sustainability.
The value chain includes all elements of the production, transportation and usage of ammonia. From the production side, there are numerous stakeholders involved, including natural gas producers and ammonia production facilities. Current ammonia production is energy-intensive and relies heavily on fossil fuels, which contributes significantly to global greenhouse gas (GHG) emissions.
Ammonia is mainly used in the production of fertilizers, as well as in cleaning agents and various chemical processes. It is also widely used in refrigeration systems, air conditioning and cold storage in industries due to its thermodynamic properties.
The maritime sector is crucial to the ammonia supply chain. As a substantial amount of ammonia is transported across oceans, the maritime industry can be both a key consumer and service provider in this chain. As it stands, the maritime industry is under pressure to reduce its GHG emissions, and ammonia has been identified as a possible clean fuel and potential hydrogen carrier. It could be an essential component that could revolutionize shipping through the global transition to more sustainable energy.

Figure 4.1: Production and utilization routes of ammonia in the energy sector.
On the other hand, transporting ammonia presents numerous obstacles. Its corrosive nature and explosive potential require specialized handling and storage solutions.
This section explores the ammonia value chain as it relates to the marine industry and provides a holistic view as it examines the ammonia producers, technology trends in ammonia carriers, potential trading routes and the inherent challenges of ammonia's cargo characteristics.
Ammonia is gaining favor in the global shipping industry due to its potential as a zero-carbon fuel. Since there is no carbon atom in the ammonia molecule, it does not emit carbon dioxide (CO2) during combustion. At atmospheric temperature and pressure, ammonia is a colorless gas with a characteristically pungent smell. At higher pressures, ammonia becomes a liquid, making it easier to transport and store.
The energy density of ammonia is similar to that of methanol and more favorable than hydrogen. Compared to hydrogen, ammonia storage is more practical due to both its energy density and liquefaction temperature. As ammonia has low energy content, it will require larger tanks for storage. Additionally, their location on board will be a critical design factor. When ammonia is used as a fuel, the changes in vessel arrangement are dependent on the location and type of ammonia tank/containment system. Cargo capacity is also expected to decrease based on the use of ammonia combustion engine or ammonia fuel cell arrangement employed. The additional space for fuel, due to lower energy density, may require larger vessels sizes, decreased cargo space or more frequent bunkering.
Ammonia has a relatively narrow range of flammability compared with some other fuels being considered for the shipping industry; however, it is highly toxic and very reactive. In addition, low concentrations of ammonia can be irritating to the eyes, lungs and skin; at high concentrations, or in the case of direct contact, it is immediately life-threatening. Symptoms include difficulty breathing, chest pain, bronchospasms and, at its worst, pulmonary oedemas where fluids fill the lungs and result in respiratory failure. Due to these toxicity issues, ammonia is classified as a hazardous substance. For this reason, exposure levels and time of exposure is controlled by several national standards, typically setting Permissible Exposure Limits (PEL) at approximately 50 parts per million (ppm), Recommended Exposure Limits (REL) at 25 ppm and identifying the Immediate Danger to Life or Health (IDLH) limit at 300 ppm.
The risk of fire and explosion is reduced when compared with other hydrocarbon fuels and gases, particularly in open air, as ammonia has a flammability range in dry air from 15.2 percent to 27.4 percent. However, under certain conditions, there can be a risk of fire and explosion, so safety concepts must consider both toxicity and fire/explosion risks [1].
When attempting combustion in an engine, ammonia is hard to ignite. It requires high-ignition energy in the form of either a pilot fuel or another "hot" source. It also has a high auto-ignition temperature and low cetane number, so it will be challenging to develop for marine combustion without a pilot fuel. However, many different fuels can be used as pilot fuels. The best igniters are fuels such as marine gas oil (MGO), marine diesel oil (MDO) and dimethyl ether (DME); different types of biofuels and very low sulfur fuel oils (VLSFO) can also be used.
Ammonia is incompatible with various industrial materials. In the presence of moisture, it reacts with and corrodes copper, brass, zinc and other alloys, forming a greenish/blue color. Ammonia is an alkalinereducing agent and reacts with acids, halogens and oxidizing agents. These properties add challenges related to the selection of materials for onboard equipment and tanks.
With the demand for global food production constantly growing, the global appetite to make fertilizers out of ammonia is expected to remain strong. It is a vital component in the manufacture of nitrogen-based fertilizers such as urea, ammonium nitrate and ammonium phosphate. Demand for these applications of ammonia is continuously driven by the growth of the chemicals, pharmaceuticals and plastics sectors.
The use of ammonia, as well as its storage and transportation, is subject to stringent rules and regulations, which affect supply chain logistics and overall production costs. However, the increasing environmental worries about ammonia emissions during manufacture and consumption are expected to impede market growth to some extent.
Figure 4.2 illustrates the main sources, production methodologies, transportation and utilization of ammonia.A typical Well-to-Wake (WtW) ammonia value chain consists of two processes: Well-to-Tank (WtT) and Tank-to-Wake (TtW). The WtT process starts from feedstock exploration and processing, through refining and distribution, to the storage facilities in the port areas. The TtW process for GHG footprint refers to the CO2 equivalent emissions by ammonia combustion onboard [1].
Conventional and clean ammonia production processes are distinguished by colors, based on the carbon footprint. Gray and brown ammonia refers to conventionally produced ammonia, while blue and green ammonia represents environmentally friendly alternatives.
In general, three pathways can be identified for the WtT portion of the ammonia value chain, and they are:
• Brown/Gray ammonia: Utilizes hydrogen produced from coal via coal gasification (brown ammonia) or hydrogen produced from natural gas via Steam Methane Reforming (SMR) (gray ammonia).
• Blue ammonia: Utilizes either gray or brown hydrogen; however, its manufacturing process is integrated with carbon capture technologies to capture up to 90 percent of CO2 emissions associated with the ammonia life cycle.
• Green ammonia: Utilizes renewable electricity for electrolysis, thus resulting in a zero-carbon emission.
HIGH CARBON INTENSITY
FOSSIL FEEDSTOCKS
RENEWABLE ENERGY
LOW CARBON INTENSITY
Most of the ammonia produced to date is “gray ammonia,”’ which has higher GHG emissions than conventional marine fuels on a WtW basis. Current production processes for ammonia mainly rely on natural gas which is used as a feedstock for SMR to produce hydrogen for the ammonia-synthesis process without any carbon capture, utilization and storage (CCUS) processes.
Ammonia Pathways Figure 4.3: The color spectrum of ammonia production. I. Gray Ammonia Pathway CO2 CO2When using ammonia as a fuel in marine internal combustion engines, the emissions of sulfur dioxide, carbon monoxide, heavy metals, hydrocarbons and polycyclic aromatic hydrocarbons (PAH) drop to zero. In addition, harmful particulate matter (PM) emissions would also be substantially lower than conventional fossil fuels. This is because ammonia has no carbon, sulfur or other contaminants typically seen in conventional residual or distillate fuels. Particulate matter emissions will mainly come from the combustion of pilot fuel and cylinder lubrication oil.
Blue ammonia is produced with hydrogen from steam-reformed natural gas, and the CO2 emissions from the process are captured and permanently stored geologically. Hydrogen is first derived as a byproduct of captured and stored CO2. It is then combined with nitrogen to produce ammonia. Blue ammonia is considered a low-carbon fuel based on the effectiveness of carbon capture and fugitive methane emissions in upstream natural gas production.
Ammonia made from e-hydrogen (clean hydrogen made from renewable resources such as solar and wind power) is only considered “green” if the electricity used in the electrolysis process is renewable. For example, this would require the direct use of electricity produced from wind turbines or solar panels, or electricity from the grid that is considered “green” after purchasing renewable electricity certificates.
Currently, hydrogen for ammonia production is typically produced by means of SMR or autothermal reforming (ATR) of natural gas (gray ammonia) [2]. If the CO2 emissions from the process of converting natural gas are captured and stored, the ammonia is typically referred to as “blue.” However, methane, which is a much more potent GHG than CO2 (82.5 times that of CO2 on a 20-year basis and 29.8 times on a 100-year basis, as per the IPCC AR6 report) [3], may leak at the production plant or at any point along the distribution chain. Also, the CO2 capture rates of SMR and ATR are lower than 95 percent.
Because ammonia can be produced from the same process as hydrogen, it is reasonable to question whether hydrogen could be used directly as a marine fuel instead of ammonia. However, to use hydrogen as a fuel would require it to be stored in a highly compressed form (from 250–700 bar) or as a liquid to minimize the storage space it would require on board a ship. Even in the liquid form at -253° C, it would still take up about four times more volume than fuel oil.
In addition, liquid hydrogen needs to be stored in insulated spherical tanks to minimize heat ingress which can take up even more volume. When hydrogen is transported in a liquid form on ships, or when it is stored at terminals, a substantial amount of energy is required to keep the hydrogen in cryogenic conditions. As a result, there is a near consensus that ammonia is a preferred energy carrier compared to hydrogen. It provides a higher energy density by volume compared to hydrogen, and it has a much higher boiling temperature. Additionally, turning hydrogen into ammonia using the well-established and efficient HaberBosch process results in a relatively low energy loss, another feature that favors ammonia as a marine fuel. Marine engines are being developed to burn ammonia with similar efficiency as hydrogen engines.
Each type of ammonia requires a different technology for its production. Five productions processes have been identified for green ammonia as indicated in Figure 4.4, and it’s described as follows:
1. Electrolysis and Haber-Bosch synthesis.
2. Direct solar hydrogen production.
3. Biogenic hydrogen production.
4. Non-thermal plasma synthesis.
5. Electrochemical ammonia synthesis.
Most pathways start with the production of renewable hydrogen. The first three pathways combine renewable hydrogen-production technologies with the Haber-Bosch synthesis process. Pathway 4 combines renewable hydrogen technology with an innovative synthesis process (non-thermal plasma synthesis), while Pathway 5 (electrochemical ammonia synthesis) does not require a separate hydrogen production step.
Production Pathways 2–5 are still at a low technical-readiness level, and their expected efficiencies are lower than those of Pathway 1. As such, Pathway 1 should be projected to dominate in the years to come.
Figure 4.4: Production process of green ammonia [4].Ammonia is currently produced in large quantities as an input for products in the fertilizer and chemical industries. However, to realize the large-scale production of “green” ammonia needed for shipping, its production capacity, along with that of renewable electricity and green hydrogen, will need to increase dramatically. The current globally installed capacity of wind and solar farms, and especially the electrolysis needed to produce the necessary green hydrogen for ammonia production, fall short by the capacity required.
Renewable electricity for the electrolyzers will need to be produced at locations around the globe that have favorable exposure conditions to wind and solar (or other low carbon power generation). Compared to transporting hydrogen itself, it is generally cheaper and more efficient to use the electricity directly located in electrolyzers, in addition to synthesizing ammonia (i.e., co-location of hydrogen and ammonia production) for use and further distribution. Storing hydrogen has also proven to be costly, so this practice will need to be minimized and to keep production costs low.
Current projections for the growth in global production appear to indicate that by 2040, there will be enough renewable electricity to produce the volumes of green ammonia needed for the maritime fleet alone. However, by that time, shipping will also be competing with many other industries for renewable electricity and green hydrogen necessary to produce ammonia, as well as with other sectors that also currently depend on the consumption of ammonia (e.g., agriculture).
Furthermore, there are constraints toward the speed at which solar and wind farms, ammonia plants and transport and distribution infrastructure can be deployed. This can potentially limit the availability of green ammonia, especially in the short and medium term. It should also be noted that the production and creation of ammonia relies on the use of water that is further decomposed into hydrogen and combined with nitrogen. Currently, it is produced in large quantities as a binding agent for products in the fertilizer and chemical industries.
There is significant experience from the land-based sector with regards to the production, storage and distribution of anhydrous ammonia. Ammonia is currently widely used in other industries and in the agricultural sector, therefore, it has been handled in large quantities in the past decades. Consequently, there is a high level of maturity for the storage and distribution of ammonia in the industry. Currently, 25–30 million tonnes (Mt) of ammonia are transported by road, trains, ships or pipelines. The ship-based transportation accounts for 18–20 Mt of ammonia trade [5].
Ammonia is not new to shipping. For several years, it has been transported as cargo with gas carriers. Because there is considerable industry experience, some safety procedures for handling ammonia are already in place. However, the prospect of using ammonia as a fuel would mean an increase in the operations and human interaction with it. This would require the careful implementation of dedicated and unified training regimes. In addition, when pertaining to the distribution, it’s important to consider the proximity to ports or to a pipeline grid connection. This is to ensure feasible and rapid distribution of ammonia at a lower cost [6], as well as to lower the risk to stop production of ammonia for lack of security in the distribution.
To that effect, additional regulations would need to be developed to reduce the risk and safety concerns. These should include rules for the detection of ammonia leakages; definition of ammonia concentration thresholds; requirements for protective equipment, toxicity zones, the handling of ammonia, bunkering procedures, safe discharge of ammonia or water contaminated with ammonia, fire protection, firefighting, ventilation, procedures for emergencies, alarms, etc.
The design elements of ammonia carriers are addressed in more detail in Section 4.5.
One of the key elements in the transportation of ammonia is the special considerations of the storage tanks. The most significant storage issue relates to stress corrosion cracking (SCC) in pressure vessels made of carbon steels. After World War II, the U.S. agricultural industry used a method for injecting liquefied ammonia directly into the soil as a direct source for nitrogen fertilization. This led to the development of the U.S. ammonia pipeline-distribution system and significant experience in storage of ammonia in pressure vessels in the agricultural sector. While liquefied ammonia has been used in the refrigeration and chemical sectors without significant difficulties, inexplicable ruptures of ammonia containers started to occur soon after introduction to the agricultural sector [7]. In the 1950s, these failures were found to be caused by SCC. As such, the U.S. National Association of Corrosion Engineers (NACE) recommended Department of Transportation (DOT) regulations [8] to prevent such failures.
While failures are attributable to several factors linked to the grade or quality of the ammonia, the material composition and production or the repair practices, the recommendations still form the basis for the safe storage of anhydrous ammonia in carbon-steel pressure vessels. These recommendations included the selection of lower strength steels — ensuring that pressure vessels were fully stress relieved — measures to eliminate air contamination and the retention of small quantities of water (0.1–0.2 percent) within the ammonia to inhibit SCC and reduce the concentration of oxygen. These principles are applied to the carriage of anhydrous ammonia in carbon manganese steels under the International Maritime Organization's (IMO's) International Code for the Construction and Equipment of Ships Carrying Liquefied Gases in Bulk (IGC Code).
The ability to store ammonia in a liquefied state at pressures of approximately 17 bar (or -330° C) is a significant advantage compared with other gaseous fuels such as liquefied natural gas (LNG). It enables storage in carbon manganese or low nickel steels, which are cheaper. The IGC Code requirements (Section 17.12.6) provide an established marine reference for ammonia storage in tanks manufactured from these steels. The IGC Code requirement specifically prohibits the use of nickel steels containing more than 5 percent nickel. For obvious commercial reasons, it is typical for designers and specifiers to select the cheapest materials suitable for the application. The Code applies the material storage requirements with respect to the specific conditions in which the product is stored, so it has more detailed requirements at cryogenic temperature thresholds from -550° C to -1,650° C for LNG.
Additionally, the Code does not envisage the storage of ammonia in stainless-steel tanks. At the least, it has differentiated specifically to restrict application of nickel steels; effectively, the use of stainless steels containing chromium and nickel (such as 304 or 316 types) is unclear because of its high price and because there are ways to mitigate for SCC. The use of these stainless steels may be common in refrigerant piping and similar applications for ammonia, but data substantiating their use for bulk storage seems limited. This requirement may only be an issue for designs that require these materials for other products at lower cryogenic temperatures, which intend to switch to ammonia later. The British Stainless-Steel Association [9] notes that “… It has been assumed that there is no corrosion risk to stainless steels that are normally considered for the storage and handling of bulk ammonia (i.e., 304 or 316 types), although there does not appear to be any published data to substantiate this...” Furthermore, the Nickel Institute [9] notes that the usage of steel types 304 and 316 are recommended in applications where freedom from corrosion products is essential and that they have been in use in ammonia production plants.
The ammonia market is anticipated to witness a remarkable expansion due to various industry applications. As indicated earlier, it is mainly used in the production of fertilizers as well as in cleaning agents, refrigeration and various chemical processes. It is an environment-friendly refrigerant due to low global warming potential (GWP), which led to its increased adoption as a replacement for hydrofluorocarbons (HFCs) and chlorofluorocarbons (CFCs) in refrigeration systems. The market is expected to grow due to the increasing demand for fertilizers to enhance worldwide food production. Ammonia is also a key ingredient in the production of nitrogen-based fertilizers such as ammonium nitrate, urea and ammonium phosphate. The expansion of industries like chemicals, pharmaceuticals and plastics also drives the demand for ammonia in these applications. Strict regulations and guidelines govern the transportation, storage and usage of ammonia which impacts the overall cost of production and supply chain logistics. The rising environmental concerns related to emissions of ammonia during production and use are anticipated to hinder market expansion.
Ammonia is mainly used as a nitrogen-based fertilizer in the agricultural sector to increase crop yields and meet the rising demand for food. The demand is also anticipated to grow due to the increasing population, particularly in an emerging nation. With worldwide food demand likely to rise due to increasing numbers of people and changing dietary trends, there is a big opportunity for ammonia manufacturers to meet the growing need for agricultural fertilizers. Approximately 90 percent of global ammonia production is utilized in fertilizers that assist in sustaining the production of food for billions of people. Food crop production naturally reduces soil nutrient resources. Farmers rely on fertilizers to make their soil productive to produce healthy harvests. Ammonia is utilized to generate nitric acid, which is then combined to produce nitrate fertilizers such as ammonium nitrate (AN).
Furthermore, ammonia is used as a raw material in the production of various chemicals, including plastics, fibers, explosives and cleaning agents. The demand for these industrial applications impacts the demand for ammonia in the market. For instance, the growth of the automotive industry, construction industry and consumer goods manufacturing influence the demand for ammonia in the production of chemicals used in these sectors.
As a cargo, the ammonia trade supply chain is well established. Ammonia is shipped in bulk on ammonia carriers, and it is served as the third largest seaborne trade in liquefied gases market after LNG and liquefied petroleum gas (LPG). The largest ammonia exporting country in 2020 is Saudi Arabia, and the top 10 ammonia exporting countries account for approximately 85 percent of total ammonia exports. Currently, there are roughly 196 ammonia terminals worldwide. There is increased industry interest in ammonia as a marine fuel — the first marine engines capable of burning ammonia are expected to be commercially available in early 2024 — with significant potential to help meet IMO’s GHG-reduction targets for 2050.
Ammonia is used as a medium for storing and transporting hydrogen, which is then released on demand for various applications, such as fuel cells or combustion engines. One of the main advantages of using ammonia as a hydrogen carrier is its high hydrogen content. Ammonia contains approximately 17.6 percent hydrogen by weight, making it a dense source of hydrogen. This denotes that ammonia stores and transports hydrogen more efficiently compared to other hydrogen carriers (e.g., liquid hydrogen, compressed hydrogen gas, etc.) which have lower hydrogen densities. Furthermore, the advantage of using ammonia is its relatively low cost. As the world shifts towards renewable energy sources, and as decarbonization efforts gain momentum, the demand for ammonia as a clean energy carrier may increase, thereby driving the ammonia market. Ongoing research and development efforts are currently being conducted to further explore the use of ammonia as a hydrogen carrier.
Ammonia as a fuel has gained popularity in recent years, particularly in the maritime sector, where it is considered a zero-carbon fuel that is less expensive on a volumetric basis compared to liquefied hydrogen. Additionally, it has been recognized as a potential long-term solution for maritime fuels, especially for marine applications. Ammonia is currently being explored as a potential future maritime fuel, either via ammonia-based fuel cells or directly as fuel. Such techniques are presently being tested and developed on maritime ships. Using existing ammonia facilities expands ammonia's usage as a fuel to cut emissions from the shipping sector, but ships must be constructed or retrofitted to use ammonia as a fuel. The availability and prices of raw materials used in the production of ammonia, such as natural gas or coal, impact the cost of production as well as the prices of ammonia in the market. This further affects the ammonia market.
Ammonia is a widely available chemical, notably used for the global production of fertilizers. Currently, approximately 235 Mt of ammonia is produced annually, thereby suggesting that production capacity would need to increase significantly to provide fuel for maritime shipping and other industries.
Global ammonia production in 2020 was about 187 Mt, produced mainly from worldwide fossil gases and coal. By region, more than 107 Mt came from Asia Pacific countries, followed by Europe with a count of 35 Mt and North America at 22 Mt. The largest consumers, which includes China, the European Union (EU), U.S. and India, produce most of their ammonia demand locally using domestic or imported fossil fuels. However, although they are only minimally reliant on ammonia imports, their combined share of global imports is almost 60 percent.
By product, liquid represented the largest revenue shareholder segment in 2020; it is also the segment with the greatest growth rate during the forecast period [10]. The segment's dominance is related to the growth in demand from the pharmaceutical and metal sectors.
Ammonia production using renewable energy sources, such as wind and solar energy, is becoming more and more popular. This green ammonia has the potential to grow to be a significant trend in the sector and can aid in lowering GHG emissions related to ammonia manufacturing. Numerous variables are behind the switch to producing green ammonia. The growing emphasis on sustainability and lowering GHG emissions is one of the main causes. The production of green ammonia is thought to be a low-carbon substitute for conventional ammonia production and has the potential to dramatically lower GHG emissions in the sector. The decreasing cost of renewable energy sources like wind and solar electricity is another factor that influences the switch to green ammonia manufacturing. It is becoming more and more practical to employ these technologies to generate hydrogen for the manufacturing of ammonia as their costs come down.
Figure 4.5: Global ammonia market projection (supply capacity) by product type.In general, there are four drivers for global ammonia market:
1. Increase demand in the agriculture and industrial sectors.
2. Ammonia as a hydrogen carrier.
3. Low-carbon maritime fuel and availability of feedstocks.
4. Large-scale production of green ammonia.
Ammonia is primarily used in agriculture as a nitrogen-based fertilizer to boost crop yields and fulfill the expanding global need for food. Ammonia has shown many benefits as a medium for storing and transporting hydrogen. The high hydrogen content of ammonia makes it a prime candidate for use as a hydrogen transporter. Ammonia is a dense source of hydrogen since it has a weighted average hydrogen content of about 17.6 percent. This indicates that ammonia stores and transports hydrogen more effectively than alternative hydrogen transporters, such as liquid hydrogen or compressed hydrogen gas, which have lower hydrogen densities. Also, the use of ammonia has the benefit of being less costly.
Ammonia as a fuel has become more popular recently, especially in the maritime industry where it is regarded as a zero-carbon fuel that is more affordable per volume than liquefied hydrogen. Additionally, it has been recognized as a potential long-term solution for maritime fuels, especially for marine applications. Ammonia is now being investigated as a viable marine fuel for the future, either directly or through ammonia-based fuel cells. The cost of production and ammonia’s market price are both influenced by the availability of the raw materials used for its manufacture, such as natural gas or coal.

The pace and competitive pricing of the large-scale production of green ammonia will prove to be one of the driving forces to the adoption of ammonia as a fuel. Part of that transition will include the decentralization of production to regions where green energy sources (e.g., solar, wind and others) are more readily available. For international shipping, adoption would also require the development of new ammonia terminals, an expansion of existing facilities and the adaptation of existing bunkering infrastructure to accommodate ammonia as fuel.
From the production and supply perspective, the Asia Pacific region is expected to dominate the ammonia market during the period of 2022–2032, followed by Europe. With a combined compound annual growth rate (CAGR) of 5.3 percent, the Middle East and Africa will surpass North America, which will see a CAGR of 3.6 percent in 2029. In 2032, the Asia Pacific is expected to produce about 192 Mt of ammonia, or approximately 63 percent of worldwide supply.
Note:
North America: the U.S. and the rest of North America
Europe: U.K., Germany, Russia and rest of Europe
Asia Pacific: China, India, Indonesia and rest of the Asia Pacific
Latin America: Brazil and the rest of Latin America
ME&A: Middle East and Africa
There are several emerging markets where the demand for ammonia is expected to grow, thus providing opportunities for ammonia producers to expand their operations. For instance, countries with growing populations, such as India and China, are expected to increase their agricultural production to meet the rising food demand which is anticipated to drive the demand for ammonia-based fertilizers. Similarly, countries transitioning to renewable energy sources are likely to present opportunities for ammonia to be used as an energy carrier.
Furthermore, ammonia is produced using renewable energy sources and can be used as a green alternative to traditional ammonia production methods that rely on fossil fuels. This presents opportunities for ammonia producers to invest in green technologies and cater to environmentally conscious customers.
Figure 4.6: Global ammonia market projection (supply capacity) by region.As shown in Figure 4.7, the fertilizer sector is projected to dominate the ammonia market in 2032, with approximately 80 percent of the ammonia produced each year being utilized to produce these goods. In addition to being essential for enhancing nutrition, agricultural production also serves as many people’s primary source of income. In many nations around the world, the variety of diets has also increased. Historically, most agricultural products were comprised of cereals, roots and other staple crops. This now includes foods like nuts, seeds, fruits, vegetables and legumes. International trade has also significantly increased agricultural productivity and therefore has greatly increased the variety of meals around the world. As a result, fertilizers are now used more frequently to boost crop yield.
According to the Food and Agriculture Organization of the United Nations' (U.N.) data, the production of primary crops worldwide increased by 52 percent over the previous 10 years, reaching 9.5 billion tonnes in 2020. Also in 2020, four distinct crops (e.g., sugarcane, maize, rice and wheat) produced half of the world's principal crops. Additionally, over the same time span, worldwide vegetable production rose by 65 percent, and fruit production increased by 55 percent. The most crucial crop nutrient, nitrogen, is made accessible for the synthesis of nitrogen fertilizers when ammonia binds nitrogen in the air. Ammonia practically aids in food production as a crucial component of fertilizers.
In the refrigerant’s sector of application, ammonia is considered a natural choice since only a small amount is required to achieve a significant temperature drop. Food manufacturers and cold storage facilities lower their energy use as well as their energy expenses by employing ammonia-based refrigeration systems. Ammonia has better thermodynamic properties than rival refrigerants, according to the International Institute of Ammonia Refrigeration (IIAR). As a result, an ammonia-based refrigeration system can use less energy to produce the same cooling effect.
Pharmaceuticals are produced by using ammonia as a processing agent. Along with many other purposes in pharmaceutical manufacturing and as a neutralizing agent, ammonia is used in the production of medications that prevent specific types of bacteria from growing and multiplying. Additionally, it is helpful in the production of vitamins, cosmetics and medications including sulfa pharmaceuticals. Ammonium nitrate is also a crucial ingredient in the creation of nitrous oxide for medical applications. As an analgesic and anesthetic in surgery and dentistry, and as a propellant for medications packaged in aerosols, nitrous oxide has applications in the global health industry.
Figure 4.7: Global ammonia market forecast 2023–2032.Textiles made from synthetic fibers offer an extensive variety of characteristics and abilities because of constant advancements in technology for polymers and additives by major manufacturers. Liquid ammonia is used in the manufacture of dyes that are used in textile coloring and the tanning industry. The creation of synthetic fabrics requires liquid ammonia. Ammonia is additionally used in the textile sector to create synthetic fibers like nylon and rayon.
Finally, several compounds such as amines, amino acids, hydrogen cyanide, nitriles, hydroxylamine, hydrazine, phenol, ammonium carbonate, urea, etc. are made using ammonia. Ammonia is also used as a component in the production of a wide range of goods, such as plastics, textiles, insecticides and dyes. As a stabilizer, neutralizer and source of nitrogen, ammonia is also employed in the pulp and paper, rubber, food and beverage, waste and wastewater treatment industries.
In general, it is challenging to predict how much green ammonia will eventually be made available to the global maritime shipping industry because it is dependent on market developments. Some examples include investment plans for the industry, shifts in demand for electricity and renewable energy sources and technological advancements in electrolyzers and ammonia synthesis.
When considering ammonia as a hydrogen carrier, there are two important elements to consider. Ammonia has a higher volumetric energy density than liquid hydrogen and it has a relatively high boiling point of -33° C in one atmosphere (atm), which means it can be transported and stored as a liquid at low pressures or in cryogenic tanks. Ammonia can therefore potentially be transported at low cost via pipelines, ships, trucks and other bulk modes. Its primary drawback is the significant energy requirements to synthesize ammonia and then release the hydrogen. It is also highly toxic, which poses significant safety risks that must be effectively managed.
The distance between the locations of the point of production and point of consumption generates the need to transport hydrogen over potentially long distances. For distances below 1,500 kilometers (km), transporting hydrogen as a gas by pipeline is believed to be the cheapest option. For distances above 1,500 km, it is assumed that transportation by sea will be most cost effective. However, given the extremely high cost of transporting hydrogen in compressed or liquefied form at present, the foreseeable future for the hydrogen is likely to be converted into ammonia or moved via so-called liquid organic hydrogen carriers (LOHCs).
Ammonia is already widely traded, and the cost of transportation is not greatly different to that for moving LPG, assuming ammonia-capable tonnage is available. For indicative values over the last decade, a freight rate of around $50 per tonne (t) is assumed for transportation from the Middle East to Japan in a very large gas carrier (VLGC), with a 50 percent premium for the use of a medium sized gas carrier of 35–40k cubic meters (m3).
The primary issue with the use of ammonia as a hydrogen carrier is the cost of conversion. For example, recent studies have put the cost of conversion from hydrogen to ammonia in the region of $1,000/t. Moreover, if the end user market requires hydrogen rather than ammonia as the fuel, then there is also a further cost for reconversion to hydrogen. These are also estimated to be significant at approximately $750/t. A final issue with the use of ammonia is its extreme toxicity, which is likely to raise public safety concerns.
Despite these costs and safety issues, we have assumed that ammonia will be the favored hydrogen carrier, especially for high volume uses. For example, plans for direct co-burning of ammonia in coal-powered electricity plants in Japan provide a clear opportunity for end use without reconversion. The use of ship to bunker fuel also minimizes overall cost to end user.
The EU has a stated aim to import 10 million tonnes per annum (Mtpa) of hydrogen by 2030 to use as an alternative to natural gas and as a transportation fuel. These nascent plans have been accelerated by the aim to reduce dependence on Russian gas, and as yet, details of the import mechanism are unclear; however, it seems that this will potentially be in the form of ammonia.
At present, the cost of transporting liquid hydrogen by sea is considered prohibitive for all but small volumes on short haul routes. It is assumed that for the foreseeable future, ammonia will be used as a hydrogen carrier, either for direct use via as a fuel or for reconversion to hydrogen at point of consumption.
For the ammonia trade, there is potential for the development of green/blue supply to transform the seaborne trade landscape. Most export-oriented projects are in Oceania, Latin America, Africa and North America. This potentially means that countries which are not currently engaged in the seaborne trade of ammonia — Australia, Chile, Egypt, Canada, etc. — will come to dominate the sector. Moreover, potential volumes could dwarf existing trade in ammonia. Seaborne trade in gray ammonia is currently estimated to be in the region of 17 Mt, while blue/green trade could exceed 40 Mt. While it may be unlikely this milestone will be achieved by 2030, it has the potential to be reached early in the next decade. Given likely patterns of trade, this would necessitate a fleet of more than 50 VLGCs to carry these volumes.
It is forecasted that the production of clean (blue and green) ammonia will be 87.5 Mt in 2030 compared to 14.3 Mt of clean methanol. This is based on the assumption that ammonia will be the hydrogen carrier of choice for the global economy in general, if not specifically for the shipping industry. As it stands, ammonia is seen as having the advantage by being carbon-free. Further, the hydrogen content in ammonia (17.65 percent) is higher than that of methanol (12.5 percent), whilst its volumetric energy density (12.92–14.4 megajoule/ liters [MJ/L]) is comparable to that of methanol (11.88 MJ/L). Both ammonia and methanol are already widely produced and traded commodity chemicals with well-established worldwide distribution systems.
For the purpose of low-carbon ammonia trading routes forecast, ABS assumes that a proportion of each region’s total clean ammonia is to be exported. The study is based on ABS’ database of hydrogen projects, and only those at the Feasibility Stage or more advanced have been included. Seaborne trade is projected to commence in 2026. Figure 4.8 illustrates the global low carbon ammonia trading routes projection for 2030.
By analyzing the demand and supply data of clean ammonia, the following routes will be investigated in detail to make projections for ammonia trading routes in 2030 and 2050:
Figure 4.8: Global low-carbon ammonia trading routes projection 2030 (©MSI).i. North America — Europe: Due to the difficulties of scaling up domestic electrolyzer and renewable energy capacity in the short term, coupled with the need to decarbonize existing industries, the EU is likely to have a hydrogen supply gap in the short term. ABS takes the view that North America will be well placed to provide the EU with hydrogen from 2026 to 2030. U.S. green hydrogen producers will take advantage of regulations in both the EU and the U.S. by scaling up their early operations to secure contracts with EU end users before 2028. ABS forecasts a trade of green ammonia at 435 kilotonnes (kt) a year from 2026–2027, rising to 900 kt from 2028 onwards. In the case of green methanol, exports remain constant at 50 kt a year from 2027 onwards.
ii. North America — China: North America is set to be the largest exporter of blue hydrogen to international markets at a price point lower than green hydrogen in the short term. Oil and gas are some of the U.S.’ largest export to China, so as both economies transition to greener energy consumption, it is likely that the nature of exports will change as well. In this case, it is moving towards blue hydrogen. Furthermore, the U.S. already exports brown/gray hydrogen to China, so as domestic production transitions to blue, facilities that were once brown will transition into producing blue exports. One example is the OCI blue ammonia facility. It is in an optimal location in Texas, with easy access to both the U.S. and export markets (including Europe and Asia) to serve the expected demand for clean hydrogen. ABS forecasts that the exports of green ammonia will remain around the 400 kt mark from 2028 onwards, while for blue ammonia it’s forecasted a growth from 1.5 Mt in 2026 to 2.5 Mt in 2030. As for methanol, green exports remain light, rising only from 50 kt in 2028 to 130 kt in 2030, while blue methanol exports hover around the 700 kt mark.
iii. Latin America — Northeast Asia: Recent years have seen multiple private firms sign memorandum of understandings (MOUs) regarding the production and export of green hydrogen and ammonia from Latin America to Northeast Asia. For example, in June 2023, Sumitomo Corporation and Chile’s Colbun signed an MOU to develop green hydrogen and ammonia export businesses in northern and southern Chile, while in June 2022, Japan Bank for International Cooperation (JBIC) and Colombia’s Ecopetrol signed an MOU to strengthen the green hydrogen and ammonia supply chains between the two. ABS’ short-term view is that Latin American hydrogen production will be focused on the growth of domestic hydrogen sectors, with exports picking up in the medium term. As such, it’s expected that ammonia exports to Northeast Asia will reach 3 Mt in 2030. Green methanol exports will take a back seat in comparison to ammonia, with under 300 kt being exported to Northeast Asia by 2030.
iv. Latin America — Europe: Sources have stated that Chile has signed multiple MOUs with port authorities in Europe, including H2Mission with Rotterdam port and supply of green hydrogen in Europe via Hamburg port. This potential export to Europe could be extended further than 2026 if the Africa-Europe hydrogen pipeline supply is delayed. Exports of green ammonia will start at approximately 500 kt in 2026 and rise to 2.3 Mt in between 2029 and 2030.
v. Latin America — North America: In April 2023, a Canadian trade mission to Chile held an event to explore sustainable business opportunities in Chile’s clean technology sector. Chile and Canada enjoy a strong bilateral and commercial relationship, with Canadian companies having preferential access to the Chilean market through the Canada-Chile Free Trade Agreement (CCFTA). Due to strong existing trade relations, it is likely a large amount of Latin America’s green hydrogen will fill the deficit of North America’s domestic production. ABS forecasts that an initial amount of 1.3 Mt of green ammonia will be exported to North America in 2026, rising and plateauing in the late 2020s at 3 Mt while methanol reaches a modest peak of 130 kt of green methanol traded.
vi. Latin America — China: Chile has extensive plans to be a major supplier of green energy by 2030, mainly to Europe and China. ABS takes the view that Chile’s prospective position as the cheapest green hydrogen supplier will make it an attractive exporter to China, with trade in the region of 1.7 Mt of green ammonia from 2028 onwards.
vii. Middle East — Europe: In May 2023, both the Netherlands and Germany signed MOUs with Saudi Arabia for the supply of green hydrogen. However, Middle East export to Europe will be limited due to a preference for green hydrogen produced in neighboring regions to assist the development of economies in Africa and Eastern Europe. Exports of green ammonia will steadily rise from 2027 onwards, reaching 500 kt in 2030. As for green methanol, lower levels are expected: 75 kt in 2028 and 146 kt in 2029, owing to Europe largely being self-sustaining in terms of methanol supply and demand.
viii. Middle East — North America: The New Future (NEOM) project, which is being developed through a partnership with Saudi Arabia's ACWA Power Co., would be the world's largest green hydrogen-based ammonia facility once it comes online in 2027, with most of its output being shipped to Europe or California. It is expected that the fuel cell electric vehicle industry in California will require imports from the Middle East to fill the domestic supply gap. Exports of green ammonia will rise from 1.5 Mt in 2026 to 2.5 Mt in 2030 as more projects come online. As for green methanol, exports stay around the 330 kt a year mark throughout the latter part of the decade.
ix. Middle East — China: Saudi Arabia’s abundance of promising solar/wind capacity and available land sets it up as a strong competitor in the green hydrogen market. With China’s new national long-term hydrogen development plan aiming to set green hydrogen as a high priority, it is likely that exports will flow to China from the Middle East. ABS forecasts that green ammonia exports to China will go from 700 kt in 2028 and rise to 1 Mt in 2030 by largely relying on the NEOM plant. For green methanol, it’s forecasted that exports will rise from 130 kt in 2028 to 414 kt in 2030.
x. Oceania — Europe: One of Australia’s existing clean energy partnerships is the Australia-Germany Hydrogen Accord, with the aim being to explore opportunities to facilitate trade of Australian hydrogen and its derivatives produced through renewables. Due to the large distance between the two nations, ABS forecasts a relatively modest supply of 457 kt of green ammonia exported to Europe in 2026 which will rise to 864 kt by 2030.

xi. Oceania — Northeast Asia: According to the Opportunities for Australia from Hydrogen Exports report commissioned by the Australian Renewable Energy Agency (ARENA) and developed by ACIL Allen Consulting, Japan was highlighted as the biggest future importer of Australia's hydrogen. This is expected to result in the shipment of green hydrogen in the form of ammonia. Given relative geographical advantage, ABS expects this to be Oceania’s largest export destination, jumping from 1 Mt of exports in 2026 to 9 Mt of green ammonia exports in 2030. Methanol imports to Northeast Asia will be much lower, peaking at 30 kt in the period to 2030.
xii. Oceania — Southeast Asia: The ACIL Allen report projects Australian hydrogen demand by Singapore to be a modest 300 t in 2025 to 4 kt in 2030. However, the Green Energy Agreement has set out its ambition for elevating the importance of green economy cooperation in bilateral links between Australia and Singapore. ABS forecasts 230 kt of green ammonia exports in 2026 with a steady rise to 1.4 Mt exports in 2030. As for green methanol, it’s expected that exports will rise from 27 kt in 2026 to 135 kt in 2030, being largely driven by the green transition Singapore is expecting.
Figure 4.9 provides an outline of potential trade in 2050 for low-carbon ammonia. The forecasted trade assumes that hydrogen consumption in 2050 will be in the region of 220 Mt. Trade in hydrogen and its derivates is equivalent to 50 percent of total consumption, partly due to the mismatch in locations of renewable energy production and hydrogen consumption. For hydrogen transportation, 55 percent of trade is assumed to be taken by pipeline and 5 percent is shipped as hydrogen by sea. The remaining 40 percent will be transported as either ammonia or methanol. ABS assumes that the key ammonia exporters and importers will remain broadly similar in 2050 as in 2030, with the exception of India and Southeast Asia which are projected to expand as ammonia importers due to the projected increase of ammonia trade in these regions.
Typically, LPG is transported aboard gas carriers built to the specifications of the IMO IGC Code. Ammonia and propane have common characteristics, such as saturation vapor pressure. Ammonia carriers that are semi-refrigerated often have a bigger capacity than those that are pressurized. Since material compatibility criteria are well established and it is simple to choose appropriate materials to prevent damage to onboard equipment, pipelines, valves and other fittings, equipping vessels to run on ammonia as a fuel only necessitates minor alterations. Additionally, they have a lower cost premium and are more adaptable, such as when it comes to loading ships with semi-refrigerated fuel tanks.
There are no ammonia-powered ships sailing today, however, the first engine can be expected to be commercially available soon. Only recently has shipping begun to test ammonia-powered engines and fuel-cell systems for vessels. So far, the related testing and research on these engines have been conducted by their manufacturers. Several manufacturers have successfully tested both the Otto and the Diesel cycle engines running on ammonia, using pilot fuels to ignite the ammonia. Figures 4.10 and 4.11 show renderings of typical designs.
Figure 4.9: Global low-carbon ammonia trading routes projection 2050 (©MSI).Ammonia offers a variety of design solutions, and by employing the stress corrosion design and operating precautions mentioned above, it enables the use of less expensive materials than those required for other liquefied gases like LNG. Ammonia can simply be liquefied at -33° C (about 17-18 bar).

The potential for fully refrigerated, semi-refrigerated and fully pressurized storage is shown in Figure 4.12 along with the saturated-vapor pressure curves for the major liquefied gases transported in accordance with the IGC Code.
 Figure 4.10: Rendering of an LNH3 carrier.
Figure 4.11: Rendering of an LNH3 carrier.
4.5.1. Cargo Containment System
Figure 4.10: Rendering of an LNH3 carrier.
Figure 4.11: Rendering of an LNH3 carrier.
4.5.1. Cargo Containment System
As per the latest Clarkson data [11], 29 percent of existing LPG carriers are capable of carrying ammonia. In addition, 33 percent of the new orders are ammonia carriers, mainly in the range of 5,000 to 30,000 m3. Table 4.4 shows the numbers of the existing and ordered LPG carrier fleet, as well as the size of the ammonia carrying capable vessels.
Table 4.4: LPG carrier fleet (existing and orderbook).
Figure 4.12: Typical operating range for liquefied gas carriers.The major technical concern of ammonia carriers is the cargo containment system, which can be fully pressurized, semi-pressurized or fully refrigerated. Key considerations for specific ammonia containment systems may involve operational flexibility, space efficiency, weight and safety.

A comparison of the main characteristics and attributes for IMO fuel containment is shown in Table 4.5.
Types A, B and membrane tanks are low pressure tanks which are nominally known as “atmospheric” tanks, while Type Cs are designed using pressure vessel codes. The predominant technology used for LNG carries fuel containment in the past 20 years has been the membrane and Type B Moss systems.
Types A, B and membrane tanks require a secondary barrier to protect in the case of leakage from the primary barrier. Type A and membrane systems require a full secondary barrier. Type B tanks require a partial secondary barrier since they are designed using advanced fatigue analysis tools and a "leak-beforefailure" concept, for which small leaks can be managed with partial cryogenic barrier protection and inert gas management of the inter-barrier space.
Type C tanks are designed using code criteria for pressure vessels and conservative stress limits; therefore, they do not require a secondary barrier. They are also relatively cheap to fabricate but are not the most space-efficient designs.
Historically, ammonia has been carried in IMO Type A or C tanks on gas carriers that may have been designed predominantly for carrying LPG. However, the Type C tanks enable carriage at fully pressurized (at the standard IMO upper ambient reference conditions of 45° C air and 32° C sea water), semi-refrigerated or semi-pressurized conditions.
Since ammonia can be liquefied relatively easily at -33° C (or 17–18 bar) it offers a range of design solutions, and using the stress corrosion design and operational measures indicated above, it enables the use of cheaper materials than those required for other liquefied gases such as LNG.
As for fully refrigerated containment systems, the temperature could be as low as -33° C at regular air pressure. Another typical practice is to apply 8 bar at a normal temperature of 20° C. The technical comparison among all four-cargo containments suggests that Type C performs better in design pressure and inerting requirements, but not for volume efficiency. While the membrane has a great potential to increase volume efficiency, a couple of bottlenecks prevent it from being viable at this point.
Because of ammonia’s highly reactive nature, copper alloys, aluminum alloys, galvanized surfaces, phenolic resins, polyvinyl chloride, polyesters and VitonTM rubbers are unsuitable for ammonia service. Ammonia is toxic and can react with mercury, chlorine, iodine, bromine, calcium, silver oxide, silver hypochlorite, polytetrafluoroethylene (PTFE) and vinyl (PVC).
In case of pipeline blockage, ammonia may react with CO2 to form carbamate. Loading cargoes after ammonia is often subject to specific terminal requirements and might require fresh water washing/ sweeping to avoid contamination.
Ammonia fuel supply system (FSS) has a similar arrangement to LPG FSS. As shown in Figure 4.13, ammonia FSS may involve fuel tanks, ammonia supply and recirculation, fuel valve unit and double wall safety system.
Specifically, the high-pressure ammonia supply pumps can provide fuel supply pressure up to 80 bar, while low-pressure pumps work in the range of 5 to 15 bar. Ammonia is required to return from the engine to a separate tank to prevent contamination from sealing oil. Ammonia catch system is to prevent the release of ammonia vapor. An emergency venting system for ammonia is required to dilute the concentration to less than 10 ppm, and the vent mast is set to extend to a safe height. Finally, the materials for ammonia FSS should be corrosion resistant.
The upcoming ammonia internal combustion engines (ICE) are being developed based on the conventional two-stroke main engine; however, it is upgraded with one additional injection system. The concept is similar to LPG engines using the typical Diesel cycle combustion process and using fuel oil as the pilot oil. In general, ammonia is resistant to burning; however, it needs an ongoing open flame to ignite. As such, there may be difficulty in lowering the pilot fuel to anything lower than 5 percent. For the first engine operating on ammonia, a higher amount of pilot fuel is expected to be used, approximately 10 percent; however, over time, it is expected to be gradually reduced.
Figure 4.13: Ammonia fuel supply system (high pressure vs. low pressure).The sustainability concern may include nitrogen oxides, nitrous oxide and ammonia slip. The early test results for combusting ammonia in the Diesel cycle process have been very encouraging as they show very limited emissions of nitrogen oxides and nitrous oxide. Since ammonia does not produce sulfur oxides, CO2 and carbon monoxide from the combustion, and because it has limited particular matter, the emission pattern from using ammonia looks very promising. The only contribution of CO2 comes from the use of pilot fuel, and even that amount seems to be very low. It also is expected that those engines will be able to use carbon-neutral biofuels.
Tests using ammonia in Otto cycle engines have been shown to generate more nitrogen oxides and nitrous oxide emissions; there also seems to be a penalty in fuel consumption, but this might be improved when the final designs of these engines arrive. The advantage of the Otto cycle engines is that they utilize a low fuelsupply pressure, which costs less than having to deliver ammonia to the engine at high pressure. For the Otto cycle engines, it is expected that the emissions can be handled by after-treatment technologies.
 Figure 4.14: a) Otto cycle — low pressure gas injection; b) Diesel cycle — high pressure gas injection.
LP gas admission valves located on the cylinder for pre-mixed gas/air and incylinder compression (diesel pilot fuel required for start of combustion)
HP gas injection valves located on the cylinder cover for direct gas injection into the cylinder for diffusion combustion (diesel pilot fuel required for start of combustion)
To find the optimal solutions, the engine-maker’s challenge is to compare the cost of high-pressure fuel supply versus the cost of after-treatment, in addition to the consumption penalty. The expectation is that the smaller-sized engines used for the genset will use the Otto cycle and the bigger engines will use the Diesel cycle. In the test results of both engine systems, ammonia slip was found to still occur, but it is expected that the engines’ final commercial versions will offer very low ammonia slip levels. The selective catalytic reduction (SCR) catalyst is a viable solution to limit nitrogen oxide emissions and ammonia slip. As ship designs and associated technologies (engines, fuel gas supply systems, etc.) are further developed, more knowledge will be acquired on the use of ammonia as a marine fuel.
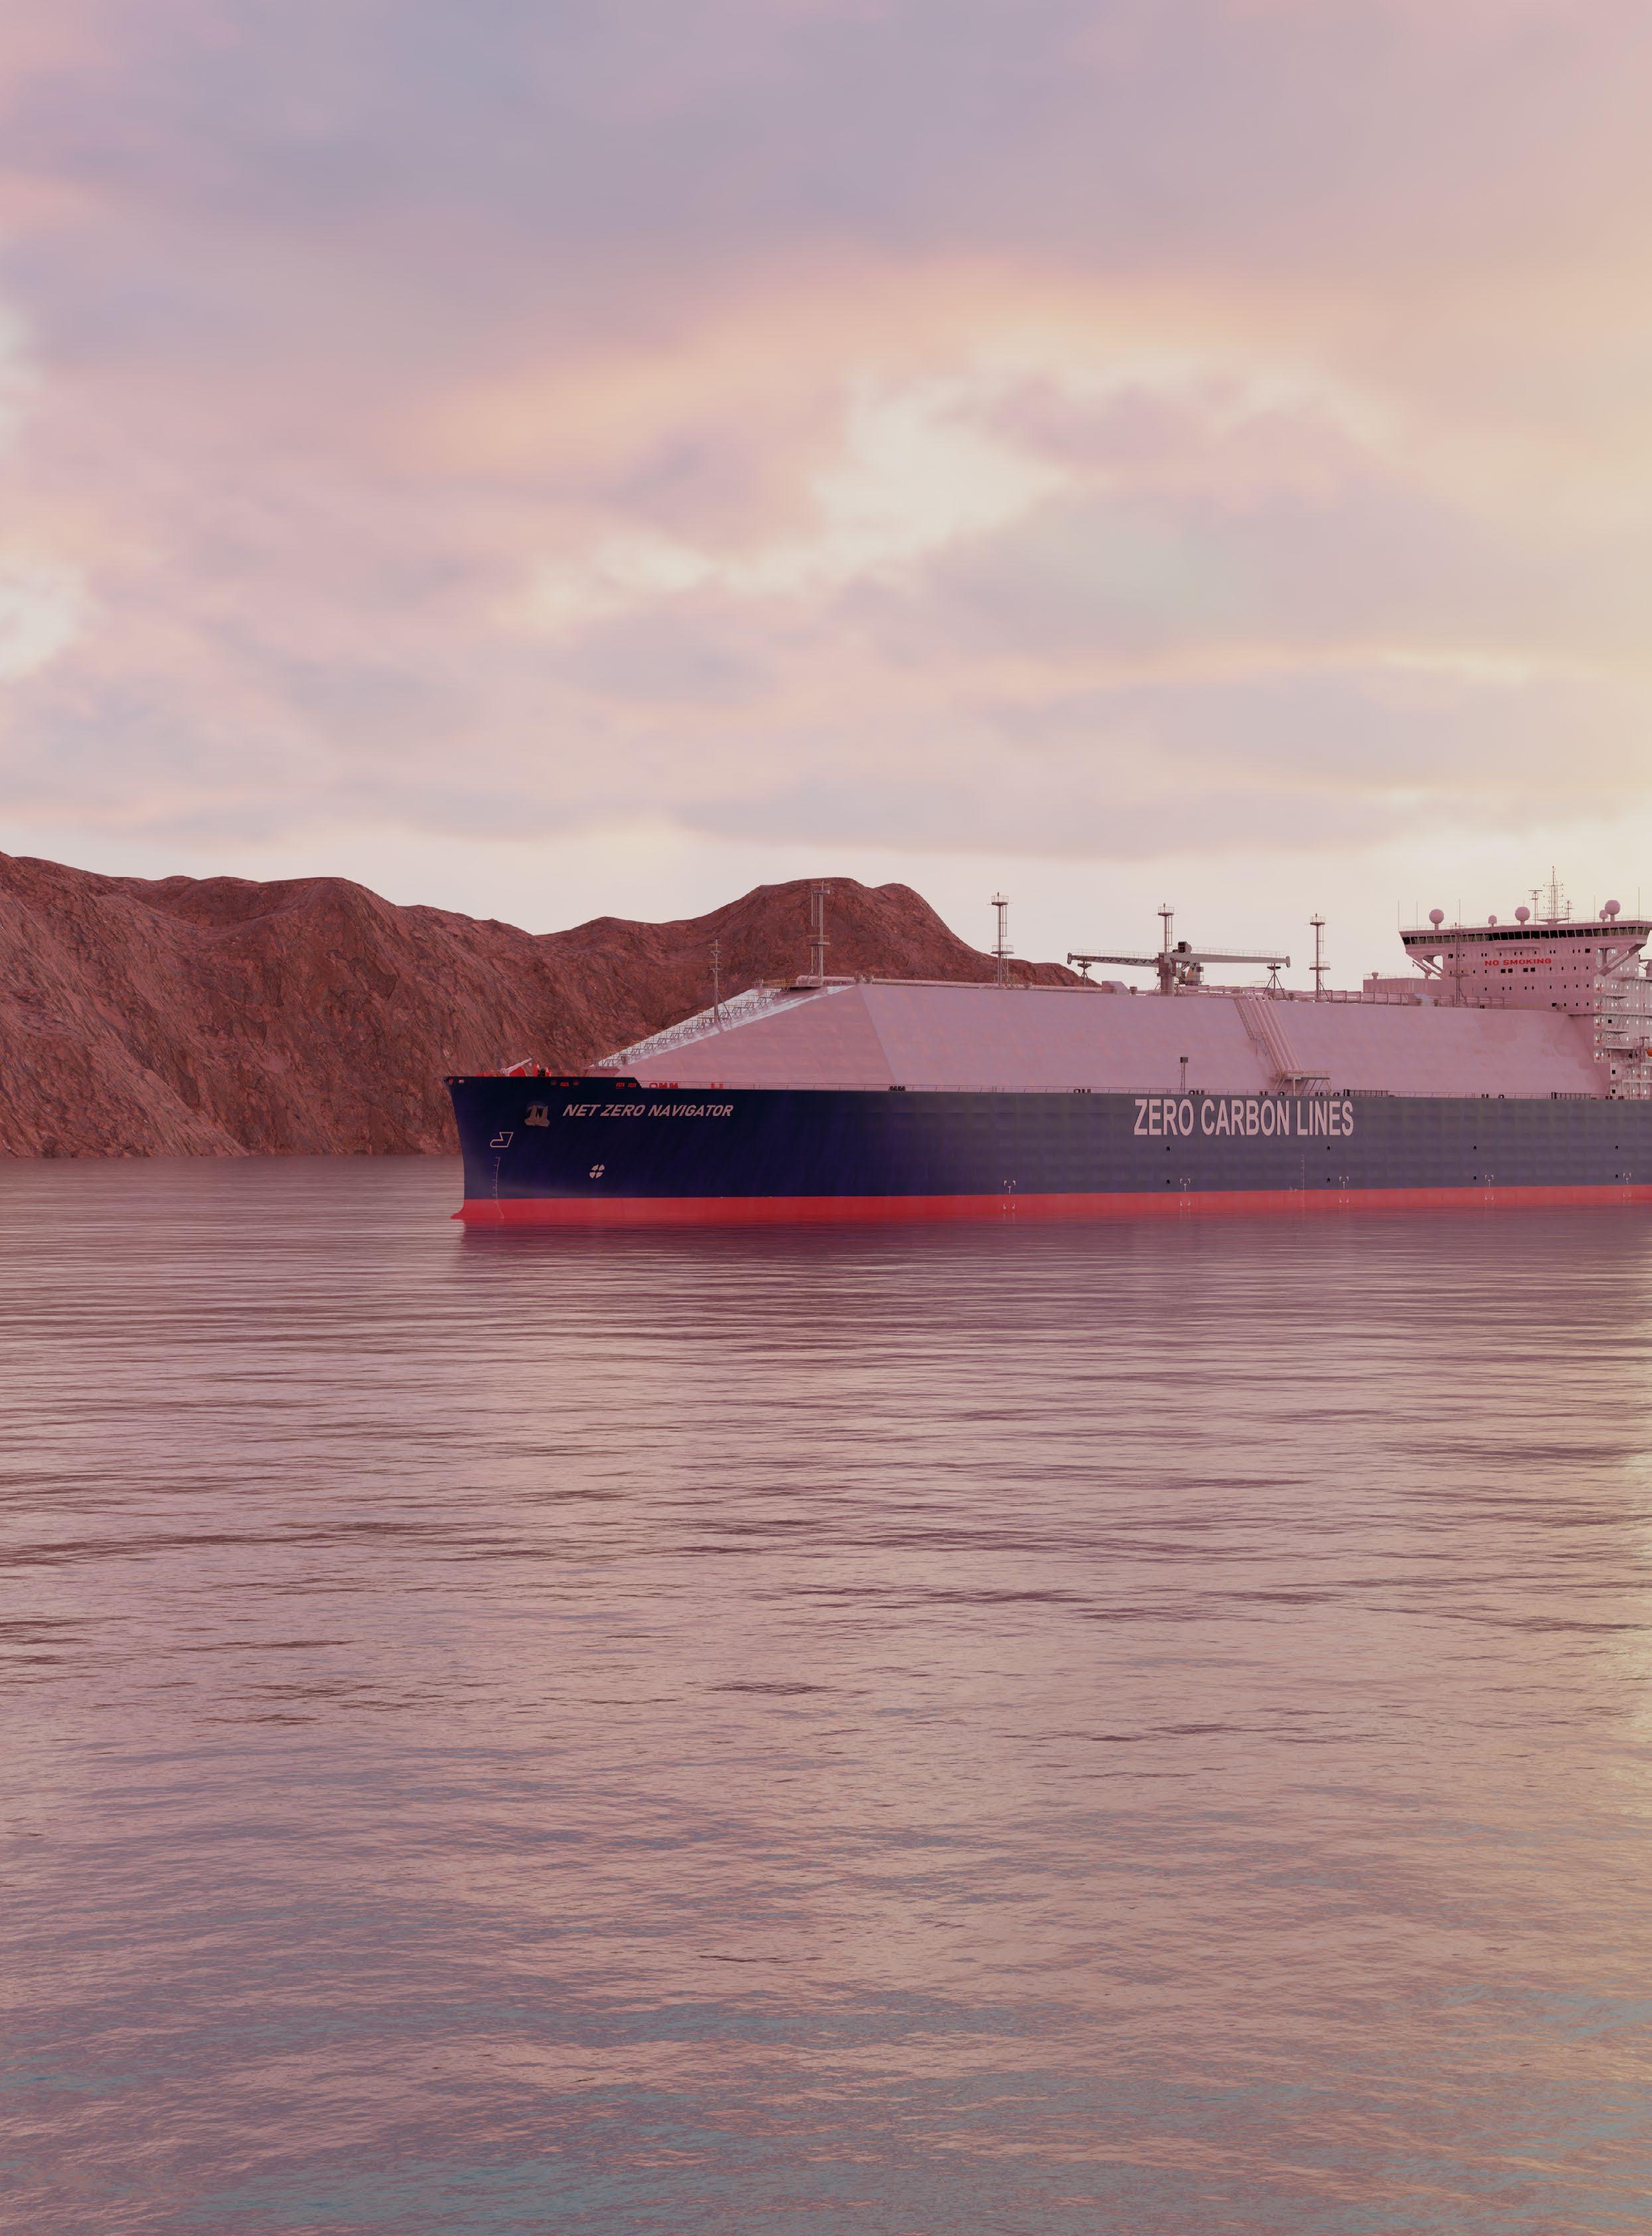

A global transition toward a more sustainable and greener future is crucial for combatting climate change, and the maritime industry is at the forefront of this transition. As the lifeblood of global trade, the shipping sector faces significant decarbonization challenges due to the diversity of its fleet — ranging from small ferries to ultra large tankers — and the lack of clean fuels like green hydrogen at scale. In this context, hydrogen has emerged as a promising option, offering a path to a zero-emission future. This section examines the multifaceted and ever-changing hydrogen value chain and its far-reaching implications for the marine industry.
Hydrogen is not new on the energy scene; it has been utilized for decades in numerous industrial processes. In recent years, its potential as an alternative fuel has attracted significant attention. Hydrogen's only byproduct when used as a fuel is water, making it an attractive option for reducing greenhouse gas (GHG) emissions. The cost of producing green hydrogen has decreased thanks to technological advancements and economies of scale.
The hydrogen value chain is a complex and multifaceted system that includes hydrogen producers, various modes of transportation and the final consumers of green fuel. A zero-carbon or carbon-neutral value chain would need to store, transport, and possibly convert hydrogen energy into other forms and distribute them to the consumer.

Hydrogen can be produced from almost any energy source, such as through steam methane reforming (SMR). Today, hydrogen used in oil refining and chemical production primarily comes from fossil fuels, producing significant carbon dioxide (CO2) emissions. Most hydrogen production is currently derived from natural gas. However, the industry is pursuing a shift toward green hydrogen production using renewable energy sources. Electrolysis, powered by renewable energy, is an increasingly popular method for green hydrogen production. This method splits water into hydrogen and oxygen using electricity.
As with any commodity, supply and demand dynamics are fundamental to the hydrogen economy. Hydrogen transport presents unique challenges, requiring specialized carriers and infrastructure. Emerging hydrogen shipping trading routes are shaped by regions with excess renewable energy (and thus hydrogen production capacity) and regions with high and clean energy demand. Transitioning to hydrogen requires rethinking certain aspects of ship design and technology innovations. These designs must consider the unique characteristics of hydrogen associated with its storage and handling. Adopting hydrogen as cargo must overcome several technical challenges in addition to the traditional challenges of
infrastructure development, regulatory frameworks, safety protocols and economic viability. However, these obstacles are balanced by substantial opportunities. In addition to contributing to global efforts to combat climate change, developing a hydrogen value chain can spur technical innovation, create employment opportunities, and establish new markets.
The hydrogen value chain includes all the energy elements used in its conversion. Due to its varied forms, origins and uses, hydrogen should be seen as more than a molecule from the periodic table or a single marine fuel. It is a medium that could be converted into different forms as an energy carrier. Renewable energy from electrolysis, for example, can be converted into hydrogen, an energy carrier that could be stored and transported by sea. It also can serve as a medium that can be a building block for the green and e-fuels that are in part earmarked to replace fossil fuels.
Hydrogen is a colorless, odorless, tasteless and nonpoisonous gas under normal ambient conditions. It typically exists as a diatomic molecule, meaning each molecule has two hydrogen atoms. This is why pure hydrogen is commonly expressed as H2. Hydrogen is the smallest and lightest element in the periodic table.
Hydrogen can be stored and consumed as liquid hydrogen (LH2) or compressed gaseous hydrogen (CGH2). Liquid hydrogen must be kept at -253° C at 1 bar. Compressed gaseous hydrogen must be stored at 200–700 bar at ambient temperature. The boiling point of hydrogen at atmospheric pressure is -253° C, which is only 20° C above absolute zero and even colder than the boiling point of nitrogen (-196° C) and liquefied natural gas (LNG) (-162° C).
Hydrogen has a wide flammability range compared to other commonly handled fuels and cargoes and a maximum experimental safety gap (MESG) of 0.29 millimeters (mm), having an assigned IIC gas group based on the international method of area classification developed by the International Electrotechnical Commission (IEC).
While hydrogen may dissipate quickly in open, well-ventilated areas, confined spaces with little or no ventilation represent a significant fire hazard. Combustion may occur in some scenarios depending on the flammable air mixture, gas pressure and location of the leak. These characteristics will require corresponding electrical equipment certification for application in hazardous areas.
The heating value of hydrogen is the highest of all potential fuels at approximately 120.2 megajoules per kilogram (MJ/kg), and it has a high energy content per weight. However, the energy density per volume is relatively low at standard temperature and pressure. The volumetric energy density can be increased by storing hydrogen under increased pressure (gas) or at extremely low temperatures (liquid). Still, even in these cases, the energy density is significantly lower than that of distillates. Table 5.1 provides a comparison of the volumetric energy densities of different fuels.
A greater volume of hydrogen would be required to offer energy content similar to other fuels — typically more than four times the volume for liquid hydrogen and approximately eight times for compressed gaseous hydrogen. This means that compressed or liquefied storage of pure hydrogen may only be practical for small ships. The deep-sea fleet will likely need a different fuel as a hydrogen carrier, such as ammonia, to limit the significant loss of cargo space.
Hydrogen is highly flammable and only takes a small amount of energy to ignite. It also has a wide flammability range and can burn when it makes up 4 to 75 percent of the air by volume as indicated in Figure 5.1. In an oxygen-rich environment, the upper bound of hydrogen’s flammability range can be as high as 95 percent. This is a much broader range than most substances being shipped today and is comparable to acetylene and ethylene oxide. Pure hydrogen fires also emit very little visible light, no smoke, and have very low radiant heat, making the flames very hard to detect without specialized equipment. To detect hydrogen leaks, hydrogen detectors and infrared cameras should be used. Leak detection strategies should be implemented along with proper ventilation.
Hydrogen is typically stored at extremely low temperatures. Therefore, caution must be taken to eliminate the risk of human contact with cryogenic materials — uninsulated pipes, tanks, etc. — since this can lead to cold burns and skin damage. Hydrogen is non-toxic and lighter-than-air but can act as an asphyxiant at high concentrations in confined spaces.
Hydrogen also has unique physical properties that aren’t always considered with other substances as indicated in Table 5.2. Molecular hydrogen is very small and can permeate even the lattice structures of metals, resulting in embrittlement, increased fatigue, and leaks in flanges and other seams. Molecular hydrogen also has two spin isomers, depending on the rotation of its protons. Forming liquid hydrogen requires the conversion of ortho-hydrogen to para-hydrogen, accounting for around a third of the work required for liquefaction.
5 .3 .1 SOURCES AND
Hydrogen is typically found naturally as a compound of either water or methane. To acquire pure hydrogen, the element must be separated from these compounds. At standard conditions, hydrogen is a colorless, odorless, tasteless, non-toxic, relatively nonreactive and highly combustible gas with a wide flammability range.
Hydrogen is commonly produced by converting natural gas or coal into hydrogen gas and CO2 However, renewable energy can be used to generate hydrogen through electrolysis to help achieve longterm sustainability goals. Hydrogen is typically used for chemical production or as an industrial feedstock in manufacturing.
Figure 5.1: Typical gas flammability ranges in percentage volume in air.The industry has recognized hydrogen’s potential to generate electricity through fuel cells and combustion technologies in recent years. While hydrogen may be derived locally from fuel reforming of a hydrogen carrier, such processes may have direct GHG emissions. GHGs are not emitted when a pure hydrogen fuel supply is consumed in a fuel cell. Emissions from hydrogen production processes represent the majority of Well-to-Wake (WtW) pollutants.
Hydrogen production is often referenced by color classification. Table 5.3 provides details on some of the color classifications of hydrogen production.
Hydrogen Production
Black Produced from bituminous/hard coal
Brown Produced from lignite coal
Gray Produced from hydrocarbons such as natural gas, liquefied petroleum gas (LPG) or oils
Blue Produced based on gray, black or brown hydrogen where the CO2 produced by hydrogen reactions is removed and sequestrated
Yellow Produced by electrolysis using grid electricity from, at least in part, non-renewable sources
Green Produced by electrolysis using renewable energy (e.g., solar and wind)
Table 5.3: The color spectrum of hydrogen production.
Brown or black hydrogen, produced using coal as feedstock, accounts for approximately 19 percent of the world’s hydrogen. Gray hydrogen from natural gas represents approximately 62 percent of the world’s hydrogen. Green hydrogen contributes less than 2 percent to the global supply, while blue hydrogen production is not widespread.
The production of gray hydrogen is very carbon intensive, producing between 71 kg CO2/MJ hydrogen for natural gas and 166 kg CO2/MJ hydrogen for coal. But these emissions can be reduced or eliminated by the technology used for carbon capture, utilization and storage (CCUS). The CCUS process collects, transports, reuses and stores captured CO2 emissions that are separated from other combustion or processing substances originating from fossil-based fuels. In general, hydrogen production uses comparatively high amounts of energy.
Figure
The energy used worldwide to produce hydrogen is about 275 million tonnes of oil equivalent (Mtoe), or approximately 2 percent of the world’s energy demand. Most of the demand for hydrogen is driven by fossilfuel refineries and ammonia production for fertilizer.
The extraction of hydrogen from natural gas involves reformation processes that use three methods:
1. Steam reforming, which uses water as an oxidant and a source of hydrogen.
2. Partial oxidation, which uses oxygen in the air in the presence of a catalyst.
3. Autothermal reforming, which is a combination of the first two reformation methods.
In all cases, synthesis gas (syngas), which contains carbon monoxide and hydrogen, is formed and then converted to hydrogen and CO2 through the water-gas shift reaction. To reduce the carbon intensity of fossil fuel-based hydrogen production, renewable and sustainably sourced biomass can produce syngas through gasification. Nuclear energy can generate hydrogen via SMR or high-temperature thermochemical production, eliminating hydrogen generation methods that rely on burning fossil fuels.
Green hydrogen is a negligible part of overall production at present. Hydrogen production today is almost exclusively from fossil fuels: black, brown or gray hydrogen. Over one-sixth of the global hydrogen supply comes from byproduct hydrogen, mainly from facilities and processes in the petrochemical industry.
In 2021, low-carbon hydrogen production grew by 9 percent, reflecting the growth in commissioning projects. More than 200 megawatts (MW) of electrolyzers started operating in 2021, including 160 MW in China and more than 30 MW in Europe.
5.2: Production and utilization routes of hydrogen.Carbon taxes are rising, particularly in Europe, and all industries are under mounting pressure to decarbonize their activities, particularly the oil and gas industry. As a result, attention is increasingly focused on producing low-carbon hydrogen. Electrolyzers are a critical technology for producing low-carbon hydrogen from renewable or nuclear electricity. Based on the current pipeline of projects under development, global electrolysis capacity could reach around 5.5 gigawatts (GW) by the end of 2023. This would represent a tenfold increase in total capacity compared with 2021. The on-time completion of projects concentrated in Europe, China and Australia is central to realizing these goals. If all the projects in the pipeline progress as planned, global electrolysis capacity could reach 134-240 GW by 2030. Europe and Australia will be at the forefront of production, with about 30 percent of global capacity each, followed by Latin America with more than 10 percent of the announced projects.
The electrolyzer is the core of the green hydrogen production process. The design of the electrolyzer dictates the equipment’s manufacturing cost, physical footprint, supporting equipment requirements, maintenance requirements and the overall efficiency of hydrogen production. For these reasons, the selection of the electrolyzer design will dictate the design of the entire hydrogen production facility.
All electrolyzers are designed to facilitate the same base electrolysis reaction as portrayed in Figure 5.3. As a result, there are several common features between all designs. There is an electrolyte to facilitate ion transfer between the two electrodes (i.e., the anode and cathode) where the chemical reactions occur. The electrodes and the electrolyte form the components of a circuit, where a power source supplies a direct current.
Hydroxide is oxidized at the anode, producing water and oxygen gas. At the cathode, water is reduced to produce hydroxide and hydrogen gas. The half-reactions are commonly balanced with a base, but in an acidbalanced reaction, the hydrogen is still produced at the cathode and the oxygen is still produced at the anode.
Electrolyzers also have a membrane between the electrodes that permits different molecules to pass through depending on the system design. Other system variables that change between designs include operating temperatures and pressures, electrolyte selection, membrane material, and electrode arrangement. This does not include any further gas compression, liquefaction or storage. The total size of an electrolyzer system depends on the target hydrogen output and the design power input values. Some electrolyzer systems are as small as a refrigerator, while 10 MW or larger facilities can occupy spaces over 7,500 square meters (m2) depending on the exact arrangement of machinery and piping.
In addition to its low energy density, hydrogen has many other unique properties, most prominently the potential for tank embrittlement, boil-off gas (BOG) management and safety concerns. These present special cost and safety obstacles at every step along the value chain, from production to end-use. These obstacles could hinder the development of infrastructure and the development of the storage facilities necessary to support increased supply and demand.
Figure 5.3: Water electrolysis produces hydrogen and oxygen.The preferred or lowest-cost option for transportation will depend on the state of the hydrogen, the distance over which it is transported, the volume being transported and its ultimate end use:
a. Compressed Hydrogen: Transporting compressed hydrogen via pipeline is the most cost-effective way of transporting large volumes over long distances. Compressed hydrogen can be transported in its pure form via dedicated pipelines or potentially blended with natural gas in gas pipelines. It is more economical to transport smaller volumes of compressed hydrogen by truck.
b. Liquid Hydrogen: Liquid hydrogen has a higher volumetric energy density than compressed hydrogen. However, given its very low boiling point, it does require considerable energy to both liquefy it and then release it at the point of use. Liquid hydrogen also has different safety characteristics than compressed hydrogen. Larger volumes of liquid hydrogen are most easily moved via ship, and smaller volumes via truck.
c. Ammonia: Ammonia has a higher volumetric energy density than liquid hydrogen. Moreover, it has a relatively high boiling point of -33° C at atmospheric pressure. That means it can be transported and stored more economically as a liquid at low pressures or in cryogenic tanks. Ammonia can potentially be transported at a relatively low cost via pipelines, ships, trucks and other bulk modes. Its primary drawback is the significant energy requirements to synthesize ammonia and then release the hydrogen. It is also highly toxic, which poses significant safety risks that must be effectively managed.
d. Liquid organic hydrogen carriers (LOHC): Like ammonia, LOHCs have the potential to be transported across the whole spectrum of options available. They also require less energy to synthesize than ammonia. Existing oil and gas infrastructure can potentially be used for pipeline transport systems. The commingling of hydrogen with natural gas has been proposed to take advantage of existing natural gas infrastructure. Still, it is untested on large scales, and uncertainties remain regarding material requirements for such pipelines.
When considering hydrogen export, it is also important to consider how far the hydrogen will need to be transported. When transporting liquid hydrogen on ships, a substantial amount of energy will be required to keep the hydrogen at cryogenic conditions. Hydrogen will heat up and boil off in transit, resulting in a loss of cargo over longer distances. These losses reduce the overall efficiency of pure hydrogen transport via ship. The final use will influence the choice of the shipping option, as energy losses vary between the different hydrogen carriers. Figure 5.4 illustrates the energy losses along the conversion and transportation of hydrogen through various carriers.

Figure 5.4: Energy available along the conversion chain in hydrogen equivalent terms, 2023 [1].
Notes:
Numbers show the remaining energy content of hydrogen along the supply chain relative to a starting value of 100, assuming that all energy needs of the steps would be covered by the hydrogen or hydrogen-derived fuel. The Haber-Bosch synthesis process includes energy consumption in the air separation unit. Boil-off losses from shipping are based on a distance of 8,000 km. For LH2, dashed areas represent energy being recovered by using the BOG as shipping fuel, corresponding to the upper range numbers. For NH3 and LOHC, the dashed area represents the energy requirements for one-way shipping, which are included in the lower range numbers.
When hydrogen is stored using material storage techniques, there is potential for it to be exported in that form as well. For example, ammonia has a higher energy density by volume than hydrogen and can be transported at much higher temperatures. These characteristics make it more suitable for transport by ship. Because of the challenges associated with long-distance liquid hydrogen transport, it may be more efficient to produce hydrogen closer to where it will be used.
Hydrogen pipelines can effectively transport green hydrogen across long distances. They can transport 10 times the energy at one-eighth the cost associated with electricity transmission lines. Furthermore, pipelines have a longer lifespan than electricity transmission lines and offer dual functionality, serving as both a transmission and storage medium for green energy.
Beyond pipelines, three carbon-neutral hydrogen carriers are competitive for long-distance hydrogen transportation.
As gaseous hydrogen is not economically feasible for long-distance shipping, suppliers can liquefy hydrogen, convert it to ammonia or bind it to an LOHC. All three carriers can be considered low carbon if every step of the value chain uses green energy (fuel and electricity) and the hydrogen is produced from low-carbon sources.
The optimal carrier depends on the intended end-use, purity requirements and the need for longterm storage.
The long-term optimal choice of carrier depends on a range of factors. Liquid hydrogen is most efficient if the destination requires liquid or high-purity hydrogen and has benefits if hydrogen needs to be distributed with trucks after landing at port. This is typically the case for hydrogen refueling stations for cars or trucks, for example. In contrast to ammonia and LOHC, liquid hydrogen does not require dehydrogenation or cracking to convert into gaseous hydrogen, saving costs and avoiding purity degradation.
Because hydrogen is a gas at ambient temperature and pressure, it can be volumetrically inefficient to store or transport at ambient conditions. Hydrogen can be compressed or liquefied to maximize the hydrogen contained within a given volume. High pressures between 350 and 700 bar, cryogenic environments below -253° C, or a combination of high pressure and low temperature may be required to reach higher hydrogen densities. It should be noted that hydrogen is typically handled as a gas when in a pipeline at pressures between 30 and 150 bar.
Hydrogen is commonly stored as a liquid to increase stored density and reduce tank volume requirements. In a liquid state, hydrogen can be stored in tanks in a process similar to LNG. The liquefaction process for hydrogen requires more energy to achieve lower cryogenic temperatures compared to LNG, which liquefies around -162° C. This process is relatively standardized, with the gaseous hydrogen undergoing compression before being cooled via heat exchangers and liquid refrigerant gas mixtures (e.g., nitrogen, helium) in a series of refrigeration cycle stages. Liquid hydrogen storage requires a high initial investment in constructing the liquefaction plant. It also has a high operating cost in terms of energy expenditure to total hydrogen stored. A significant risk with storing hydrogen as a liquid is the potential to lose storage capabilities if cryogenic temperatures are not maintained. Additional power reserves will most likely need to be dedicated to the refrigeration system to mitigate this risk. Hydrogen stored under cryogenic conditions will require tanks designed with materials fit for these extreme conditions. Due to the low temperature, the tanks also require a thick layer of insulation, reducing the volume efficiency. These challenges add to the cost of storage and make the system design more complex.
Currently, the scaling of vacuum-insulated tanks beyond 5,000 cubic meters (m3) is a challenge. In principle, the potential boil-off rate (BOR) decreases as the volume within the tank increases, as heat transfer is proportional to the tank surface. This phenomenon aids BOR statistics, as the BOR is expressed in terms of a percentage of the tank volumetric capacity. The shape of the tank also influences BOR. Spheres have the best surface-to-volume ratio. The surface-to-volume ratio of cylindrical tanks increases proportionally as the length-to-diameter ratio increases.
To increase the density of gaseous hydrogen, insulated pressure vessels can be used between ambient and cryogenic temperatures (-253° C) and between atmospheric and high pressures, depending on the technology or material used for tank insulation and strength. Hydrogen stored in insulated pressure vessels can be known as cryo-compressed hydrogen. Liquid hydrogen tanks at low pressures can be susceptible to pressure build-up if temperatures rise and the liquid hydrogen begins to vaporize and boil off. For this reason, protection from pressure build-up is to be in place for gaseous and liquid hydrogen tanks, such as pressure relief valve arrangements. Due to their very low temperatures, cryogenic tanks may require significantly thicker insulation layers, for example, two or three times the thickness of the thermal insulation of an LNG tank. Due to the very small molecular size of hydrogen, the gas is capable of dispersion through materials, including penetrating into the walls of containment systems and permeating into certain fluids or other solid materials over time to achieve a concentration equilibrium. Hydrogen should be stored in appropriate materials that minimize permeation and reduce the loss of contained hydrogen.
These characteristics impose design constraints on the storage system in terms of general architecture and material choices. High-strength steels are the alloys most vulnerable to hydrogen embrittlement, thus the use of lower strength steels and reduction of residual and applied stress are paramount to avoid fracture due to hydrogen embrittlement. This can lead to general weakening of the structure along with crack formation and other forms of brittle failure in tank material. Hydrogen’s small molecular size also makes it more prone to leakages, especially in pipe/containment system fittings and valves. This phenomenon is further enhanced onboard ship due vibrations induced from different sources necessary to the ship’s operation (e.g., main propulsion engines, diesel generators, propellers, compressors).
An alternative to the physical storage of hydrogen is material storage. This refers to hydrogen storage as a component of other materials and chemicals rather than pure hydrogen, typically to reduce the burden on storage systems or make transportation easier for storages such as adsorbents, hydrides, LOGH and ammonia.
Alternative fuels such as ammonia, methanol and synthetic fuel such as e-LNG are derived from green (or blue) hydrogen. In regions already heavily invested in developing renewable energy, hydrogen offers a reliable fuel source when renewable energy alone cannot meet grid demand. The production of green hydrogen is also a useful outlet for the energy generated when renewable power production exceeds the grid demand. Green hydrogen can also be used to produce green ammonia, green methane and green methanol. These chemicals can offer additional storage density and have use cases as alternative fuels or chemical feedstock. Hydrogen can also be used in industrial applications and could drive the development of regional industry that demands carbon neutral energy.
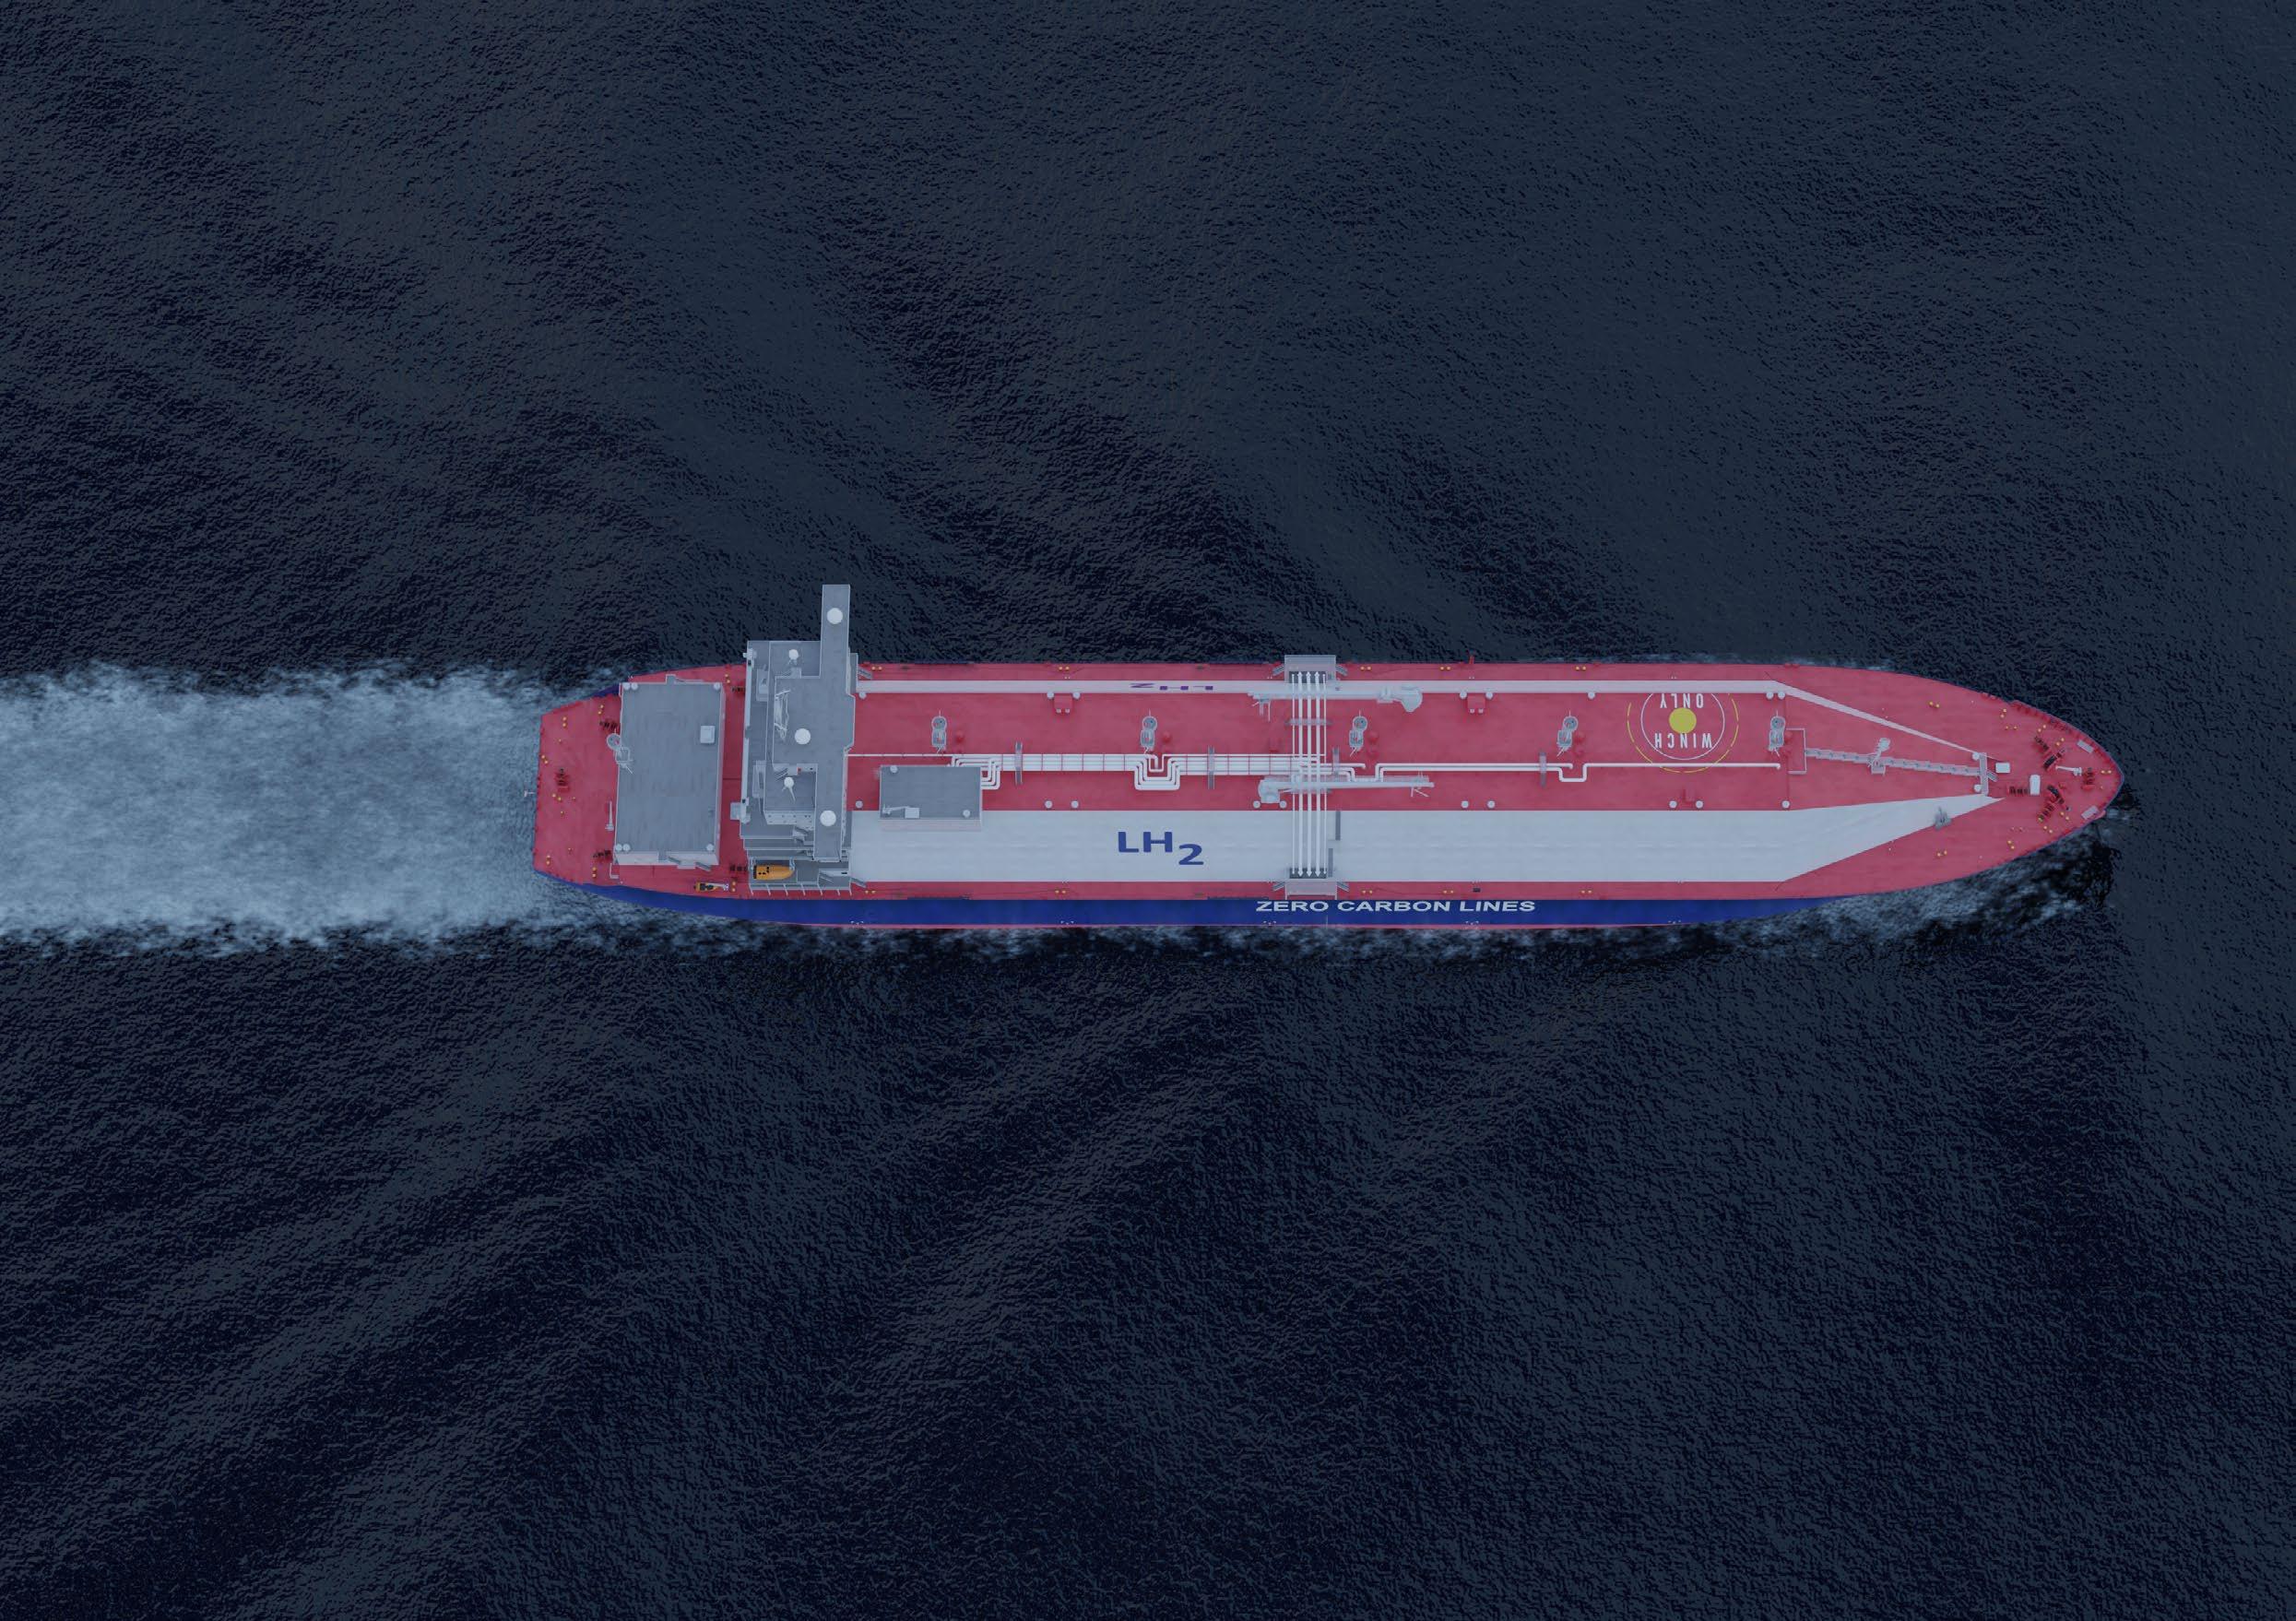
Global hydrogen demand remains concentrated in traditional applications. These are detailed in Figure 5.5. Global hydrogen demand reached the historically high level of 95.7 million tonnes (Mt) in 2022 as illustrated in Figure 5.6. This rise in demand was driven by the recovery of activity in the chemical sector and refining sectors (i.e., traditional applications) as the global economy emerged from the COVID pandemic.
In recent years, hydrogen has been increasingly considered a vital component of the carbon neutral energy transition. However, there has been very limited use of hydrogen in this way, as hydrogen production must be decarbonized — a costly target — before it can play a prominent role in the drive to decarbonize the energy system.
• Oil refineries are the largest consumers of hydrogen. They use it to reduce the sulfur content of diesel oil and upgrade heavy residual oils into higher-value oil products.
• Demand in this sector is set to continue increases in the short- to medium-term.
• Hydrogen is an important component of ammonia production, 70% of which is used as a precursor in producing fertilizers. As such, ammonia demand is correlated with global agricultural production.
• Ammonia is traded globally, with seaborne trade totalling around 13.7 Mt in 2022, equivalent to around 8% of total production.
• Hydrogen is a component of methaol production.
• Methanol is used in industrial processes to produce the chemical formaldehyde and in plastics and coatings.
• A small amount of hydrogen is used annually by steel mills for direct reduction of iron (DRI).
• Fossil fuels are currently used throughout the steelmaking process, in the form of coke, as a reducing agent and for various heat-intensive stages of the iron and steelmaking process. These could e ectively be replaced by low-carbon hydrogen.
Figure 5.5: The traditional uses of hydrogen.Hydrogen continues being termed as the fuel of the future, either in its pure form or with hydrogen derivatives and hydrogen-based synthetic fuels. There is huge demand-side potential for hydrogen, both from traditional end-users and potential end-users to meet future demand. Either way, it has the potential to help meet global energy demand, including hard to abate sectors such as shipping, steel making and cement production, whilst contributing to climate goals.
The majority of all hydrogen produced today is derived from fossil fuels (coal or natural gas). However, the move towards the production of hydrogen from renewable energy sources is rapidly gathering traction across public and private sectors.
Areas that are best positioned to develop into major centers of green hydrogen production need high solar intensity, constant wind in certain areas, large, flat unpopulated areas, energy infrastructure and governments that are used to support large energy-based projects. At present, these regions include Australia, Latin America, North Africa and the Middle East.
Despite this potential, the industry is still very much in a nascent stage of development.
For hydrogen production to scale, there are a number of substantial challenges that need to be overcome such as:
1. Shortage of electrolyzer manufacturing capacity: electrolyzers are central to the production of green hydrogen. However, there is a lack of global electrolyzer manufacturing capacity. Current world production capacity is estimated to be around 8 gigawatts (GW) per annum. Projects in the Middle East and Africa alone are going to require at least 75 GW of electrolyzers to develop the projects currently under consideration. Manufacturing capacity is growing quickly. However, this is likely to be a bottleneck in the short- to medium-term.
2. Costs: A significant stumbling block is the costs associated with hydrogen, particularly green hydrogen. It is still considerably more expensive than other fuels, particularly given the lack of infrastructure and the cost of transportation.
3. Future hydrogen demand: hydrogen is widely regarded as a key fuel in the path to decarbonization, with 26 national governments currently committed to adopting hydrogen as a clean energy vector in their energy systems. However, considerable uncertainty remains around how extensively it will ultimately be deployed, and many countries remain uncommitted to hydrogen’s position in their future energy mix.
The key to production of green hydrogen lies in the development of renewable energy production. Renewable energy production globally increased by 54 percent in the decade to 2020, and the pace of increase is set to do so. Significant investment in renewables has been seen across the globe, most notably in China, Europe, North America and Latin America. Furthermore, massive investment in renewables will be needed to meet the demand for green hydrogen production. Figures 5.7 and 5.8 provide details on the electricity production by fuel and by region.
There are more than 600 projects that have been identified for green hydrogen production that are either operational, under construction, have taken Final Investment Decision (FID) or are at the feasibility study stage. These include projects where the end use product is either hydrogen, ammonia, methanol or synthetic fuels.
The large number of operational projects tells a story wherein 114 facilities produce just 330 kilotonnes (kt) of hydrogen. They are small scale and proof of concept, with an average capacity of around 2 kt per annum. For those projects under construction, the average capacity rises to 22 kt per annum. The need to scale up is clear as the projects that have taken FID or are at the Front-End Engineering and Design (FEED) stage averages to 114 kt per annum.
The overwhelming majority of projects under consideration at present are in Europe and North America, and most of the output will be consumed locally. In the major potential export centers of Latin America, the Middle East and Oceania, there are 104 projects with capacity of 13.5 Mt of hydrogen. Figures 5.9 and 5.10 illustrate the number of hydrogen projects by region, as well as their stage of development.
The assessment of the current pipeline of projects suggests that production of clean (blue/green) hydrogen could reach 43 Mt by 2030. However, it is worth mentioning a caveat that has been noted repeatedly by the World Hydrogen Council — a body that seeks to promote the hydrogen economy. They suggest that while growth in the number of projects is exponential, for projects taking FID, the graph is linear with very low slope.
The gap between proposed and actual needs to be bridged soon if there is to be sufficient green hydrogen and derivative products available by 2030 and beyond.
Most hydrogen will be consumed in the country/region of production with a rapid expansion or conversion of pipeline capacity assumed in the main consuming regions of Europe, China and North America. Nevertheless, given the location of much investment in hydrogen, there is substantial potential for trade to develop. It is assumed by most observers of the sector that trade will be essential to link lower cost areas of production to areas of high demand. Figures 5.11 and 5.12 illustrate the hydrogen production and consumption by region.
Figure 5.10: Clean hydrogen projects by stage of development.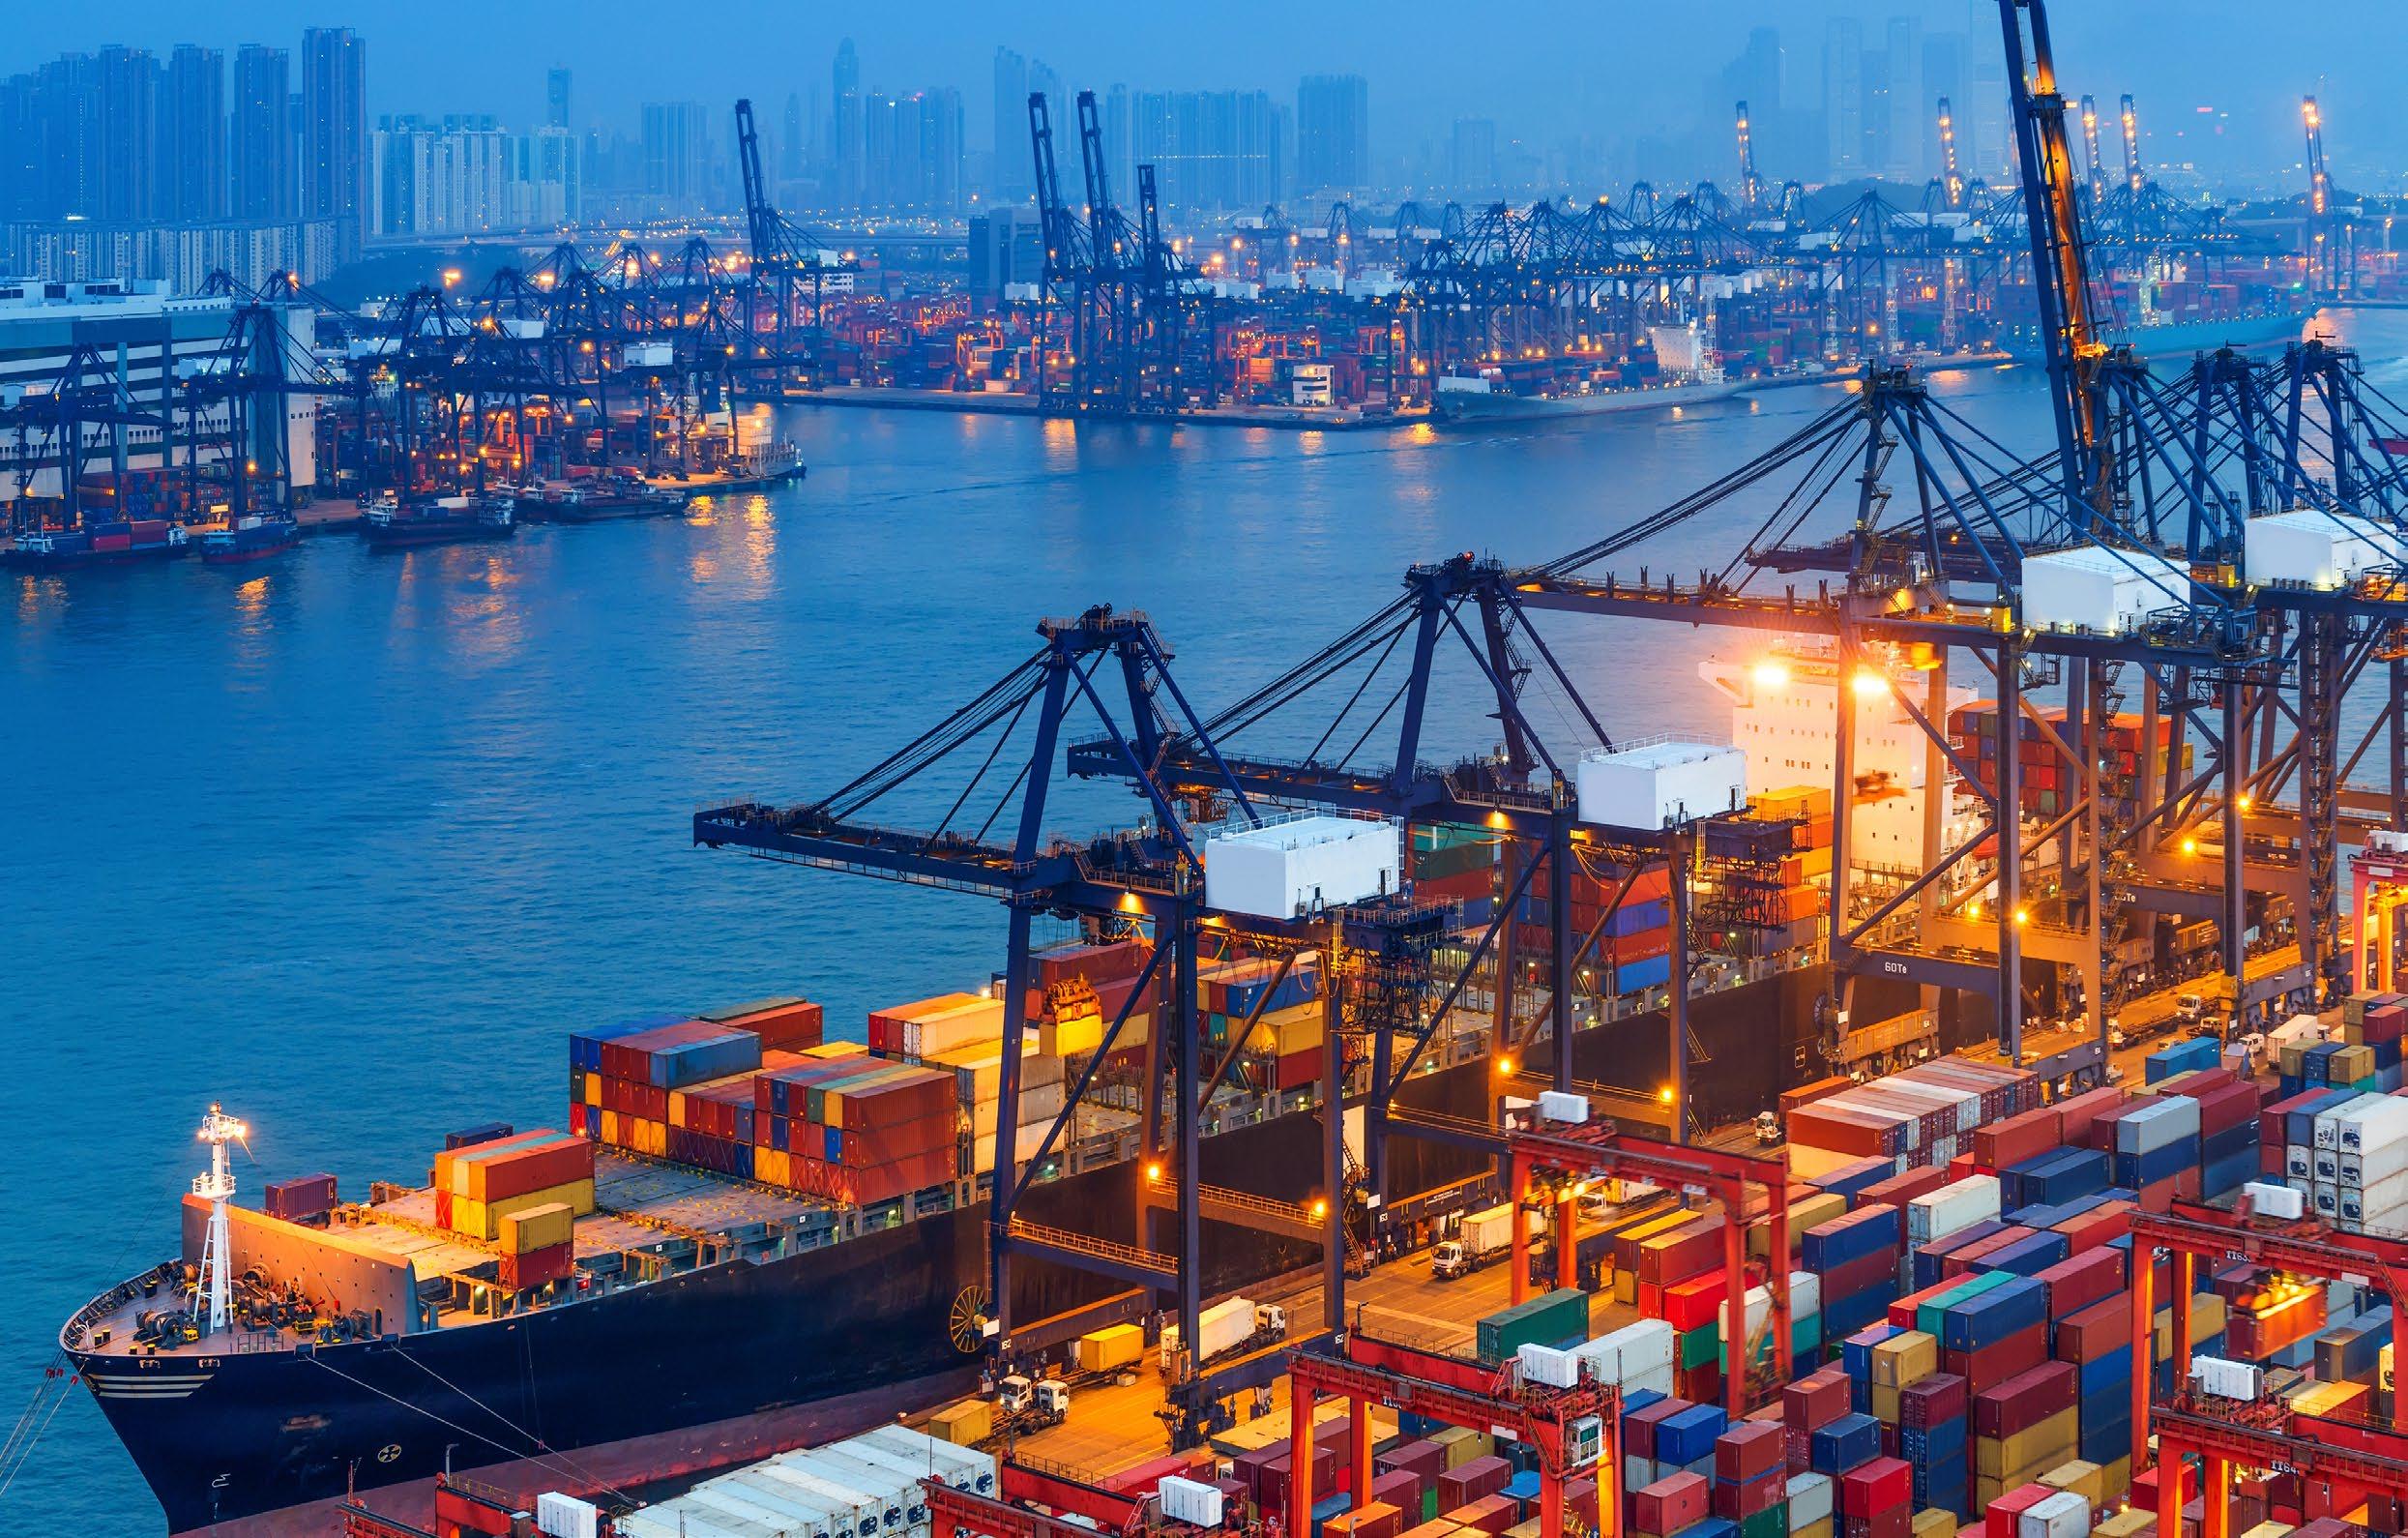
To put our forecast for marine fuels demand into context, demand for ammonia/hydrogen and methanol in 2050 translates into a requirement for around 90 Mt of hydrogen. This assumes that ammonia/hydrogen and methanol account for the majority of shipping bunker fuel by 2050 and that all the dual fuel vessels burn clean fuel. For comparison, if all current methanol and ammonia production were replaced with green production, that would require around 56 Mt of green hydrogen.
From our initial modelling to 2030, we find that approximately one-fifth of green hydrogen production will be exported. However, we have assumed that by 2050, half of all hydrogen produced is traded. If a “consensus” view is taken of around 220 Mt of hydrogen production in 2050, this will mean 110 Mt of hydrogen equivalent is traded. If we assume 55 percent of this is transported by pipeline, 5 percent as seaborne hydrogen, that leaves 40 percent as either ammonia or methanol. These translate into approximately 207 Mt of ammonia trade, 59 Mt of methanol and 5.5 Mt of hydrogen.
Our forecast for the hydrogen trading routes in 2050 is based on certain assumptions made as indicated below:
1. In 2050, hydrogen consumption is in the region of 220 Mt.
2. Trade in hydrogen and its derivates is equivalent to 50 percent of total consumption. This is partly due to the mismatch in locations of renewable energy production and hydrogen consumption.
3. Most of the hydrogen trade is via pipeline. In line with a study from the Hydrogen Council we assumed that 55 percent of hydrogen trade is via pipeline and 5 percent shipped as hydrogen by sea. The remaining 40 percent is transported as either ammonia or methanol. Methanol is ascribed the higher proportion of trade due to our view that it will remain highly significant from a shipping industry perspective. Further support of this lies in the belief that green methanol will be used for other areas of the economy, such as chemical production, will also be significant.
Figure 5.12: Clean hydrogen consumption by region.The key exporters for clean hydrogen will be Oceania, Latin America and the Middle East. However, it is expected that there will be some intra-regional trade (e.g., within Europe and Asia) to satisfy demand in parts of the region that are hard to reach with pipelines. Overall, the volume and number of trade routes remain smaller than for pipelines, reaching 5.5 Mt in 2050 though pipeline trade is assumed to reach 55 Mt of hydrogen by 2050. Figure 5.13 provides an illustration of potential trade in 2050 for clean hydrogen.
United States: By 2030, the U.S. National Clean Hydrogen Strategy and Roadmap (2023) outlines strategic opportunities for the domestic production of at least 10 Mt per year of clean hydrogen. Clean hydrogen is defined as hydrogen produced with a carbon intensity equal to or less than 2 kg of CO2 equivalent that is produced at the site of production. Per kg of hydrogen produced, both blue and green hydrogen can be considered “clean.” ABS takes the view that North America will consume 4.5 Mt of green hydrogen and a further 3.1 Mt of blue hydrogen in 2030. Forecasted domestic production of blue/green hydrogen will not satisfy this demand, and the region will require approximately 2.5 Mt of hydrogen equivalent imports. This will translate into 6.7 Mt of green ammonia with the rest coming from clean methanol.
Latin America: Latin America’s abundance of potential renewable energy projects positions the region to have the lowest levelized cost of green hydrogen production by 2030. In addition, Chile’s National Green Hydrogen Strategy highlights a clear opportunity for the production and export of green ammonia in the medium term. Reflecting this, ABS is projecting that Latin American ammonia exports will be in the region of 5 Mt of green ammonia in 2027 and increase to 8.5 Mt by 2030.
Middle East: In a report from the IEA 2023, Global Hydrogen Review 2022 [1], Middle East exports of region's green hydrogen have been forecast to be 1.1 Mt by 2030. Oman is seen as leading the region in this export push. ABS forecasts that exports of clean hydrogen will be 792,000 tonnes (t) by 2030, with the bulk of projects coming online in 2028. Ammonia will dominate (with a total export of 4.6 Mt). Given that the Middle East is currently one of the leading exporters of methanol, ABS takes the view that this position will extend to the green methanol market, as well as with shipments of 1.4 Mt in 2030.
Figure 5.13: Clean hydrogen trade routes projection in 2050 (©MSI).Oceania: Australia’s hydrogen strategy is split into two phases: phase one looks at “Foundations and Demonstrations” until 2025, and phase two looks at the scaling up of operations in 2026 and beyond. New Zealand’s hydrogen Taranaki Roadmap proposes exports of 300 kt of green hydrogen in 2030. Australia’s stable political system and strong regulatory environment can potentially see it becoming the second largest green hydrogen exporter in 2025 due to its background as a strong and trusted exporter. ABS takes a more positive stance, with Oceania expected to export up to 1.7 Mt of green hydrogen in 2030 and a further 266 kt of blue hydrogen. There will be a clear focus on ammonia, with limited investment in methanol.
Europe: The EU’s ambition is, by 2030, to produce and import 10 Mt of green hydrogen. The aim is to diversify away from Russian energy imports towards more green energy resources, including the use of renewable hydrogen. In May 2023, the German Economy minister stated that Germany can only meet 30 percent of its own needs for green hydrogen, putting Berlin on a quest for trade partners to deliver the remaining 70 percent. ABS forecasts a demand of 16 Mt of clean hydrogen in Europe as the full 20 Mt is not compatible with our forecast for world production in 2030. Some intra-regional trade is anticipated and some exports to Northeast Asia are possible.
Northeast Asia: Japan is a key player in the hydrogen economy and has set a target to increase hydrogen supply. As per the Strategic Energy Plan, hydrogen and ammonia will make up 1 percent of both the primary energy and the electricity supply mix. Japan is looking to expand its hydrogen market to 3 Mt in 2030, which will largely take the form of imports due to the limited potential of renewables in the area. Similarly, South Korea’s Ministry of Trade, Industry and Energy forecasts that South Korea’s hydrogen demand could grow to 3.9 Mt in the year 2030. For this reason, ABS forecasts future demand in the region to be 4 Mt of green hydrogen and 2.3 Mt of blue hydrogen which is lower than the target demand due to insufficient world supply.
Southeast Asia: Singapore is the driver in this region. There has been strong international interest from the public and private sectors to accelerate the development of hydrogen across the value chain. The evidence of this interest comes from the backing of a growing pipeline of production projects worldwide. Singapore sees its hydrogen strategy as a way to diversify the power mix with the potential to achieve 50 percent green by 2050.
China: In a net-zero scenario report developed by Deloitte [2], China is expected to be the world's largest importer of clean hydrogen, requiring 13 Mt of imported hydrogen by 2030 due to the vast amount of clean energy required to decarbonize its economy. While ABS takes a less optimistic approach, we still forecast China to be a net importer of green hydrogen while its domestic industry ramps up production of non-brown hydrogen.
In summary, sufficient hydrogen supply will be a key limiting factor to achieving the goal of maritime decarbonization by 2050 by using fuels derived from clean hydrogen. Understanding the potential to translate aspirations into reality is hampered by a wide range of opinions in forecasts for the production of hydrogen. The shipping trade routes will be expanded if the technique issues of hydrogen onboard storage and transportation are resolved.
The International Code for the Construction and Equipment of Ships Carrying Liquefied Gases in Bulk (IGC Code) provides an international standard for the safe transport by sea in bulk of liquefied gases and certain other substances. However, hydrogen is not currently a covered product.
Fortunately, the IGC Code has language covering this scenario. There is a proposition to carry products that could potentially be considered to fall within the scope of the Code that are not, at present, designated in chapter 19. For this reason, the Administration and the port Administrations involved in such carriage shall establish a Tripartite Agreement based on a provisional assessment and lay down preliminary, suitable conditions of carriage based on the principles of the Code. This scenario led to the creation and subsequent adoption of the International Maritime Organization (IMO) Resolution MSC.420(97) “Interim Recommendations for Carriage of Liquefied Hydrogen in Bulk” which is currently the only IMO instrument available.
Although hydrogen has yet to be widely adopted as a fuel by the maritime industry, it already has landbased uses. There are no international marine requirements mandated by the IMO, however, some of the information, rules and regulations from land-based resources are referenced in MSC.420(97). These include safety measures, methods of transportation and standard procedures for hydrogen production. Multiple codes and regulations set the standards for hydrogen components and equipment designs, fire codes and hydrogen-specific safety codes. There are also general safety codes and standards that include hydrogen.
Hydrogen cargo ships are in the early prototype stages with the only existing hydrogen carrier being the Suiso Frontier, a 1,250 m3 capacity ship.
In this subsection, we explore two different LH2 transport carrier designs based on 25,000 m3 and 80,000 m3 sizes. Both carrier designs use double wall spherical tanks carrying liquid hydrogen at ambient pressures and -253° C. The smaller size ship represents a slightly larger version of the current spherical tanks being built by NASA for land-based hydrogen storage. The larger ship represents a reasonable extension of current technology to apply the same concepts to the approximate capacity of the current largest size range of LPG carriers. Boil off is a significant issue for liquid hydrogen considering the very low temperatures required, and special tank design, as well as special refrigeration, are required to control this boil off. The concept designs are based primarily on the latest integrated refrigeration and storage (IRAS) under development by NASA. It is important to note that the previous generation of NASA tank stowage on barges was based on insulated tanks without refrigeration, thus permitting boil off and venting.
Hydrogen is a highly volatile gas at most temperatures and pressures. Its flammability range in air is approximately 4–75 percent compared to methane’s 5–15 percent, and its ignition energy is a small fraction of that of other common fuels. These characteristics make any onboard leaks or venting of hydrogen dangerous. Furthermore, hydrogen, especially green hydrogen from electrolysis of water, requires a very significant amount of energy to produce. For this reason, venting is unfavorable from an economic point of view. Therefore, any hydrogen storage system should aim to guarantee that there will be no venting in normal operational scenarios.
Furthermore, Figure 5.14 shows that hydrogen remains in its critical phase for a vast range of pressure values at temperatures above -240° C. In other words, the best density for hydrogen as a compressed gas at ambient temperatures that can be achieved by pressure vessels is a density of around 50 kg/m3 at 700 bar and ambient temperatures. This is currently possible only in very small, high-tensile steel or carbon reinforced plastic bottles. Tanks for these pressure levels typically hold only a few hundred kg of hydrogen and are not suitable for large shipboard cargo containments. Instead, the density of liquid hydrogen at -253° C and ambient pressure is approximately 73 kg/m3. This makes liquid hydrogen at cryogenic temperatures the only practical way to store and transport large quantities of this gas, even ignoring the complications and risk inherent in high-pressure storage.
Nevertheless, hydrogen is not easy to maintain in the liquid phase. The enthalpy of vaporization of hydrogen (0.44610 kilojoules per gram [kJ/g]) is similar to that of methane (0.50928 kJ/g), but the temperature difference (-253° C for hydrogen, versus -162° C for methane) implies a much higher standard of insulation to achieve similar BOR. In practical terms, this means that liquid hydrogen can only be stored in double-walled steel tanks with vacuum insulation if BOR is to be minimized prior to introducing refrigeration. Moreover, to avoid having to deal with high vacuum values which are not easily achievable in commercial settings and for larger volume tanks, the vacuum space between inner and outer vessel needs to be filled with insulating material such as multiple-layer insulation (MLI), perlite or glass bubbles.
The largest liquid hydrogen tank is currently being built at NASA Kennedy Space Center in Florida. This tank is spherical, has a capacity of 4,700 m3 and approximately a 20 meter (m) inner diameter. Additionally, it is designed to store liquid hydrogen at ambient pressure and includes both glass bubble bulk fill insulation and a NASA developed IRAS heat exchanger designed to work with a helium refrigerator.
Scaling of vacuum-insulated tanks beyond 5,000 m3 is currently just speculative. In principle, the potential BOR reduces as the tank volume goes up since heat transfer is proportional to the tank surface, and BOR is expressed in terms of a percentage of the tank’s volumetric capacity. However, larger tanks would exacerbate issues with insulation quality control and appropriate refrigeration throughout the liquid volume. At present, it is speculated that the largest land-based tanks serving hydrogen terminals might be as big as 50,000 m3; however, nothing remotely close to these capacities has actually been designed yet.
Tank shape also has an effect on BOR, with spheres having the best surface to volume ratio. Cylindrical tanks can also be used; however, the surface to volume ratio (and thus the BOR) progressively gets worse as the length to diameter ratio grows bigger and bigger. It should be noted that a significant amount of heat transfer is connected to the supports needed to connect the inner and outer vessels. These are also generally easier to minimize for spherical tanks compared to other shapes (cylindrical, bi-lobe, etc.).
Another significant operational issue with liquid hydrogen transportation is cargo transfer. This requires a similar level of insulation performance of the piping and pumps that’s used for the storage tanks.
Figure 5.14: Hydrogen phase diagram.To minimize BOR during transfer, it is also essential that pipe run lengths are kept to a bare minimum. The certification for pump/piping components (e.g., gaskets, flexible hoses, cables, gland seals, etc.) would also need to be certified for the -253° C design temperature. Additionally, the electrical components/equipment would need to be certified to gas group IIC in lieu of IIA for methane and most other liquefied gases listed by the IGC Code. This implies that terminal storage tanks should be placed very close to the loading/ discharge pier with risks during ship operations that should be carefully evaluated. Inerting hydrogen lines is also an issue. For methane, inerting if typically done via nitrogen (N2) which can be generated on board via a nitrogen generator. However, inerting an LH2 piping cannot be done by N2 since it will freeze/solidify. Therefore, helium may need to be supplied for LH2 piping systems.
In terms of ship design, it is important that radiation heat transfer is kept to a minimum. Several techniques have been employed to achieve this, one technique is to use highly reflective paint for the external tank shell. If the tanks are completely internal to the ship, similar techniques might also be beneficial for the deck above.
It is reasonable to expect that the large 4,700 m3 spherical tank built at NASA could be scaled up to a 5,000 m3 capacity as a basis for the proposed 25,000 m3 ship design. The internal diameter of this tank is approximately 20.6 m, and the insulation thickness adds approximately 4 m to that with an outer diameter of approximately 25 m. This would fix the minimum beam of a vessel using these tanks to around 32 m, having added a double skin of similar proportions to that of the smaller prototype carriers. Larger tanks than 5,000 m3 will require further development but have been included on the larger 80,000 m3 design in this study.
The two concepts investigated for the transportation of liquid hydrogen are based on 25,000 m3 and 80,000 m3 carrying capacity with both using double wall spherical tanks carrying liquid hydrogen at ambient pressures and -253° C. The smaller size ship represents the current approximate sized spherical tanks currently being built by NASA. On the other hand, the larger ship represents a "reasonable" extension of current technology to apply the same concepts to the capacity of the current largest size range of LPG carriers. Figures 5.15 and 5.16 offer renderings of the LH2 carrier concept design.
Figure 5.17 indicates the LH2 carrier design that incorporates advanced technologies similar to those employed by NASA with their hydrogen storage extension program at the Kennedy Space Center in Cape Canaveral, Florida. To reflect the feasibility of current technology in such designs, the ship's main and auxiliary engines are powered by LNG stored in membrane tanks at the bow.

 Figure 5.16: LH2 carrier concept design rendering.
The main engine is sized to meet the maximum propulsion power capacity of 6.7 MW in addition to 3.2 MW for auxiliaries. The LH2 storage system features NASA’s IRAS to achieve zero boil off. This is based on the knowledge that, even at current LNG prices, venting of hydrogen cargo would not only be dangerous but also significantly more expensive than the methane needed by the cargo refrigeration system and associated capex. Cargo refrigeration is provided by a helium plant needing approximately 1 MW of electrical power. The propulsion power is provided to twin high performance propellers matched to rudder bulbs, having assumed that the remaining auxiliaries’ power would be in the range of 0.85 MW while sailing. The main engine and fuel tank capacity are sized to provide enough power to the vessel to sail at 16.2 knots with a 20 percent sea margin for 15.5 days, covering 6,000 nautical miles with the full auxiliary load of 1.85 MW.
The liquid hydrogen stored in spherical, double-skin steel tanks is insulated with low vacuum Glass Bubble. These are 12.1 m in external radius, 10.6 m in internal radius and 25 mm thick internal and external shells that weigh approximately 1,500 Mt each. The tanks are protected from direct sun irradiation by highreflective white paint on the top and main deck, ensuring a maximum surface temperature of the tanks outer shell of 54° C when the ambient temperature reaches 45° C. Cargo temperature is maintained at -253° C. BOR calculation shows that a value of 0.11 percent is achievable in the absence of IRAS at ambient pressure. However, high maximum allowable working pressure (MAWP) of 6.2 bar gauge (90 psi) is the driving factor for the wall thickness.
Damage stability is considered by separating each spherical tank hold from the neighboring ones. Furthermore, the hydrogen inner tanks are designed so that they would be fully contained within the ship’s B/5 IMO damage boundaries, ensuring that any collision would, at worst, cause an increase of the BOR which the vessel would have to contain with a combination of over-pressure, refrigeration and controlled cargo venting.
Loading conditions for all LH2 carriers are challenging due to the extreme ratio of cargo weight/volume. This implies that even at full load departure, the vessel would have to use part of the large sea water ballast (SWB) capacity to ensure control of trim, propeller immersion and structural strength. It is also for this reason that the chosen hull features twin propellers with a gondola stern, which is similar to the hull of modern LNG carriers, so that a shallow draft would help minimize the need for an SWB. Further design optimization might be achieved, converting some of the SWB tanks to permanent fresh water ballast (FWB).
5.5.3.2 The 80,000 m3 LH2 Carrier Concept Design
Figure 5.18 indicates the basic design for the 80,000 m3 LH2 carrier. This much larger cargo capacity might become required only after the hydrogen market is more established. For this reason, there would also be some related technologies such as Proton-Exchange Membrane Fuel Cells (PEM-FC).
Figure 5.17: 25,000 m3 LH2 carrier concept design.Figure 5.18: 80,000 m3 LH2 carrier concept design.
This design also incorporates a twin-screw gondola stern to maintain propulsion efficiency and alleviate the need for permanent ballast, but it is fully electric with all power provided by hydrogen fueled PEM-FC and load balancing batteries. The total power capacity has been estimated to be 14.9 MW. The propulsion power is provided to a pair of contra-rotating propellers, which are driven by conventional shafts directly connected to electric motors with a max power equal to 4.25 MW each. The second pair of propellers on steerable pods are also driven by electric motors of a max power equal to 2.7 MW each. Additionally, there is a minimum installed battery capacity of about 169 MWh which is used for power conditioning, dynamic energy stability and hybrid operations for maintaining speed in a seaway.
This PEM-FC/battery set is sufficient to provide enough power to the motors to take the 20 percent sea margin for 15.5 days at 16.2 knots, even with the full auxiliary load, thus providing the same 6,000 nautical miles range. The liquid hydrogen is stored in spherical, double-skin E690 steel tanks insulated with low vacuum glass bubble. These are 16.6 m in external radius, 15.6 m in internal radius, 40 mm thick in both internal and external shells and weigh approximately 2,500 Mt each. Intact stability, damage stability and cargo protection are similar to those of the 25,000 m3 LH2 carrier.
There are several tank types discussed in the IGC Code and they can be generally divided into independent tanks, which are self-supported, and integral tanks, which are integrated into the hull structure.
1. Type A tanks are based on classical ship structure design rules, typically taking the form of a prismatic tank.
2. Type B tanks are based on first-principles analysis and modeling, and designs can be either prismatic or spherical, as indicated in Figure 5.19.
3. Type C tanks are based on pressure vessel criteria and tend to be smaller than other tanks due to the structural requirements that come with higher pressures, and they take the form of cylinders or bi-lobes.
4. Membrane and semi-membrane tanks employ a very thin primary membrane, supported through insulation with the inner hull form providing load bearing support.
Currently, membrane tanks are the dominant choice for large LNG carriers, followed by Type B independent tanks. Type A and Type C tanks, while viable from an engineering perspective, have other drawbacks that make them less cost effective for owners and operators. Figure 5.19 offers an overview of the different cargo containment systems.
When considering the carriage of liquid hydrogen based on current industry initiatives, Type C tanks have jumped out to an early lead. Because of the characteristics of hydrogen, Type C tanks are currently the most attractive option. However, designs for vessels with Type B and membrane tanks are still being developed, and prototypes for these tanks and vessels will likely be constructed soon.
The arrangement and nature of the cargo tanks aren’t the only important considerations for hydrogen carriers. Some other important things to factor into the design of an LH2 carrier are the temperature and pressure control of the cargo tank. Preventing over or under pressurization of the cargo tanks is critical to the safe operation of the vessel. In the event of a pressure incident, proper sizing and function of the relief and ventilation system is also important. It will also be necessary to construct methods to prevent blockages from the hydrogen’s low temperature, which can cause ice to build up from the condensation. Material selection is also critical for the tanks, process piping and other equipment that will be interfacing directly and indirectly with hydrogen.
Furthermore, it will be important to note the definition of the hazardous zones and suitability of monitoring and alarm equipment in those spaces. Preventing a hydrogen fire is much easier than fighting one, so measures should be taken in the design stage of the vessel to ensure that equipment is always suitable for use in its intended space. Another important aspect is the isolation and accessibility of the cargo containment system. Being able to isolate and shut off the source of a hydrogen fire is the preferred method for fighting the fire. If the leak is not found, there is always a chance of reignition and potential detonation.
Table 5.4 provides a summary of the design and operational considerations for handling hydrogen on a marine vessel.
 Figure 5.19: IMO tank types.
Independent Tanks
Figure 5.19: IMO tank types.
Independent Tanks
Energy Converters
Potential Need for Aftertreatment Technology
Energy Density and Volume Considerations
Hydrogen Storage and Fuel Gas Supply Systems
• Internal combustion (IC) engines are being demonstrated or developed but are limited to smaller, short sea shipping.
• IC engine development is primarily focused on ammonia at present.
• Hydrogen can be blended with other compatible fuels such as methane or combusted with fuel oil.
• Commercially available nitrogen-oxide reduction systems (exhaust gas recirculation, selective catalytic reduction [SCR] or water injection) might be required to meet Tier III.
• Major concerns over space.
• Requires four times liquid/eight times compressed gas volume compared to marine gas oil (MGO) and more than three times compared to ammonia for the same energy content.
• Double-structure vacuum insulation requires additional space.
• Cylindrical or spherical fully refrigerated tanks with double walls and vacuum insulation.
• Storage Conditions: High pressures (350–700 bar), cryogenic environments below -253° C or a combination of high pressure and low temperature may be required to reach higher hydrogen densities.
• The current prototype size is 1,250 m3 with larger capacity designs under development.
• The BOR is 1 to 5 percent per day for standard, land-based liquid hydrogen storage tanks.
• Tank cost is currently the main bottleneck to viability.
• BOG management technology/improved insulation.
• Flammable properties, wide flammability range (increased when mixed with pure oxygen) and hydrogen is a small molecule that is difficult to contain.
• Leaks in open or contained spaces can be a serious fire hazard due to quick formation of flammable gas mixtures (low activation and ignition energy).
Safety and Environmental Concerns
• Flow or agitation of hydrogen gas or liquid can create electrostatic charges, resulting in sparks and ignition.
• Flames are invisible and burn extremely quickly (deflagration or detonation); detonations can result in extreme pressure increases.
• While non-toxic, at high concentrations, it can act as an asphyxiant.
• Dissipates quickly — does not pose direct threat to the environment.
• No prescriptive rules, only the IMO Maritime Safety Committee’s interim recommendations and reference to the IGC Code.
• Requires the IGF Code’s alternative-design process (ABS has established Rules).
Regulations
• Current regulations and guidance are mainly associated with fuel-cell technology.
• IMO Sub-Committee on Carriage of Cargoes and Containers could produce amendments to the IGF Code and Development of Guidelines for LowFlashpoint Fuels (about hydrogen fuel).
• Hydrogen availability.
• Hydrogen loading/unloading operations.
• Ship-to-ship transfers.
Operations
• Safety and operational-management plans.
• Equipment failure and emergency procedures.
• Personnel safety training.
Table 5.4: Design and operational considerations.


As is clear from this latest Outlook, the maritime industry is heading toward a technological revolution driven by decarbonization. Powered by improved collaboration and propelled by developments in clean energy, digitalization and applied research, this future will offer greater sustainability and much higher efficiency.
Rather than simply adapting to the green energy transition, the maritime industry is playing an active role in shaping it. The shipping, ports and logistics sectors are enabling the global shift toward sustainable energy solutions by transporting these critical elements: carbon, ammonia and hydrogen.
With energy consumption rising to meet consumer demand and a pressing need to simultaneously reduce carbon footprint, there is a prominent shift toward renewable and low-carbon energy sources.
The transportation of carbon, ammonia and hydrogen as cargo highlights the maritime industry's pivotal role in bridging the global energy landscape's gaps between production, storage and consumption.
As the maritime industry looks ahead and dives deeper into the complexities of these three value chains, it becomes clear that shipping is more than a spectator in the global green energy revolution. Instead, it serves as a critical facilitator and enabler.

The International Maritime Organization (IMO) greenhouse gas (GHG) reduction strategy, as revised at the 80th session of the Marine Environment Protection Committee (MEPC 80), will lead to significant changes for vessel design and operations.
The global fleet must switch from traditional fuels to greener alternatives, which will prompt new designs, engine upgrades and retrofits, and the development of new fueling infrastructure. In addition, strategies to enhance energy efficiency, such as optimized hull designs and route planning, will become increasingly important.
Additionally, vessels may need to be equipped with real-time emissions monitoring and reporting systems, which will require crew training for effective implementation and compliance.
For older vessels, retrofitting may pose challenges, potentially rendering them economically unviable before reaching the end of their expected service life. Conversely, new, compliant ships might see a relative increase in market value.
While intriguing, the research into alternative fuels presents its own set of obstacles in terms of supply, cost, infrastructure and safety.
Concurrently, while energy efficiency technologies (EETs) provide a practical and realistic pathway to improve ship operational efficiency and thus reduce carbon emissions, they’re expected to play a broadly supportive role in the majority of decarbonization projects. Onboard carbon capture, while still in its early stages of development, has the potential to transform the way industry manages carbon emissions.
The carbon value chain — which includes core elements like the capture, utilization, storage and transportation of carbon — is an integrated step for carbon emissions management, from source to potential utilization or sequestration.
The maritime industry can support carbon capture activities worldwide by providing safe and efficient transportation, thereby assisting in efforts to reach a carbon-neutral future.
Ships specifically designed to transport liquid carbon as cargo are emerging as an important link in the carbon value chain. These vessels ensure that liquid carbon is transported safely and efficiently from capture sites to utilization or storage facilities.
Understanding and improving the carbon value chain will become increasingly important as the entire global economy steps up its efforts to combat climate change. The maritime industry, which accounts for a substantial portion of global trade, will be at the center of making this value chain a reality.
With strong potential as a green fuel, ammonia represents a twofold opportunity for the shipping industry. While it can be used as an alternative bunker fuel, it must also be transported as cargo. As countries and industries investigate ammonia-based energy solutions, the marine sector will be key to enabling regional supply.
Ammonia will play a major role in the wider energy matrix because of its carbon-free emissions and its ability to store and transmit energy effectively. As the world deals with energy storage and transportation challenges, ammonia’s position as an energy carrier could become increasingly important, providing a sustainable answer to some of our biggest energy challenges.
The importance of the ammonia value chain in the global green transition cannot be overstated. As the world works to reduce its carbon impact, ammonia stands out as a potential viable fuel option and critical cargo.
Commonly referred to as a long-term fuel option, hydrogen will continue to grow as a key component in global efforts to build a sustainable energy landscape. Its importance in the transportation industry — as cargo and potential fuel — will increase concurrently with mounting energy transition pressures and tightening emissions limits.
The maritime industry's acceptance of hydrogen represents a bold step toward a more sustainable future. More than tackling its own carbon impact, shipping’s embrace of the hydrogen value chain positions it as a vital player in the global green energy revolution.
Transportation of hydrogen, particularly green hydrogen derived from renewable sources, is critical to the creation of a worldwide hydrogen economy. With its huge network and experience, the shipping industry is primed to be a cornerstone in this initiative.
Investments in liquefied natural gas (LNG), liquefied petroleum gas (LPG) and methanol dual-fueled vessels continue to grow quickly, prompting industry discussion and debate around which alternative fuels producers can provide at affordable prices.
For this updated Outlook, ABS reexamined the supply and demand data for alternative fuels and updated the future fuel mix to reflect the latest market information. In addition, the study looked at how the recent adoption of the revised IMO decarbonization strategy and the 2050 net-zero targets affected the projected future fuel mix.
By combining the derived ship demand with a forecast for a changing fuel mix in deep sea shipping, the scenarios for global energy consumption are translated into global fuel consumption by ships. Overall, with the updated findings, ABS finds that by 2050, demand for fossil fuels has the potential to be marginally lower than what was estimated in the previous edition of the Low Carbon Outlook, once again underlining the need for carbon capture technologies.
As the maritime industry — and shipping in particular — navigates the challenges of the energy transformation, it will be critical to invest in cutting-edge technology that can significantly lower the industry’s carbon footprint. This involves both the adoption of alternative fuels, EETs and novel solutions such as onboard carbon capture systems.
This transition to greener technologies will require substantial investment and will incur initial expenses that change the dynamic of shipping’s commercial relationships. But in the long-term, shipping operations could benefit from lower emissions, reduced fuel use and simplified regulatory compliance.
Considering the characteristics of the alternative fuels being evaluated by the maritime industry, safety procedures and protocols and seafarer training must evolve.
Despite the challenges, the shipping industry remains dedicated to decarbonization. This is demonstrated by the investments already being made in vessels using new fuels, EETs and voyage optimization.

1 2 3 4
To achieve the targeted reduction of carbon dioxide (CO2) emissions from shipping to net zero by 2050, under scenarios created by ABS, the following steps must happen progressively:
Improvements in energy efficiency must lower aggregate fuel consumption by 15 percent from 2023 levels. This could be achieved through the widespread adoption of energy saving devices on both existing and new ships.
Carbon capture must be widely adopted on vessels using fuel oil for propulsion with a target of achieving a 70 percent reduction of global onboard emissions.
Sustainable green fuels must be adopted at a 5 percent annual adoption rate.
In addition, supporting measures will be required across specific sectors, including increased emphasis on the production of alternative fuels.
Carbon neutral green fuels will be needed at scale for the residual emissions. Global production of green methanol, ammonia and bio-LNG must scale up to sufficient levels to meet the needs of the shipping industry.
GHG emissions will fall progressively as larger quantities of renewable fuels are produced. Single-fuel ships will still be ordered, driving demand for EET retrofits and onboard carbon capture systems.
Based on Well-to-Wake (WtW) default emission factors, there will still be some GHG emissions from the production of fuels, plus nitrous oxide emissions from burning ammonia.
In Section 2, Figures 2.53, 2.54, 2.55 and 2.56 illustrate GHG emissions under four scenarios. In each case it is assumed that the supply of methanol and ammonia is green throughout the forecast. It’s also assumed that LNG becomes progressively green as we approach 2050 at an incremental rate of 5 percent starting at 2030.
Vessels with single-, oil-fueled engines will still be constructed until well into the next decade. As a result, widespread adoption of retrofitting of energy saving and carbon capture technologies will be required for the shipping industry to achieve net-zero emissions by 2050.
The economics of green fuels and carbon pricing are critical to the pace and breadth of their adoption. Shipowners will need to act to secure their supply chains.
Achieving net-zero emissions requires the economics of using green fuels or carbon capture technologies — through a combination of progressive production cost reductions and a high carbon price — to be favorable before 2050. All LNG, ammonia and methanol consumption must be green by 2050.
Based on the current investment profile, methanol remains a relatively minor component of the wider hydrogen economy but is critical to shipping. Therefore, it is essential that shipping companies demonstrate to the renewable methanol producers that sufficient demand exists to justify investment in production.
There are early examples of methanol demand, but pooling of demand may be needed to drive investment at the necessary scale. Smaller shipowners and operators may need to band together to provide the sufficient collective volume needed to justify an investment in green methanol.
In the period leading up to 2030, shipping will be in competition with other sectors for green and even gray fuels.
In the short term, using gray methanol will achieve an up to 10 percent reduction in Tankto-Wake (TtW) emissions, which can assist in meeting near-term emissions reduction targets. Sufficient volumes of green methanol must be available to meet demand as regulations switch focus to WtW emissions or an emissions life-cycle approach.
If adoption of methanol as a fuel continues at the pace it is today, then even the use of gray methanol may be constrained by demand from elsewhere in the chemical industry. This suggests that many ships that are methanol capable will still burn oil for some time.
Other major competing sources of demand for alternative fuels are likely to be power generation, road transport, domestic and commercial heating, green steel, cement production and synthetic kerosene for aviation, among others. There are thus both near-term challenges in stimulating enough green methanol production to fuel the burgeoning orderbook of methanol-engine vessels and, in the long term, substantial competition for green methanol and green hydrogen from other sectors of the economy.
Decarbonization of the global economy will have dramatic repercussions for some sectors of seaborne trade, with some trades faring better than others. The impact will also affect the relative aggregate shares of the global fleet.
The current largest single commodity trade, crude oil, will decline by 40 percent between 2025 and 2050. Coal trade will fall by even more, 43 percent, over the same period. LNG will fare better, tracking growth in gas demand. LNG seaborne trade is forecasted to reach a ceiling of about 750 million tonnes (Mt) around 2040 before declining.
Looking at non-energy shipping, there are three key trends. First, container volumes will continue to grow as these are relatively insulated from the energy transition. Second, iron ore volumes will decline as steel consumption growth slows and more steel is recycled. Third, other dry bulk cargoes — mainly minor bulks and higher value bulk commodities — will continue to see transport volumes grow.
The shifting pattern of trade will reshape the global fleet. The aggregate share of the oil and chemical tanker and dry bulk carrier sectors will decline from 64 percent of the fleet in gross tonnage (gt) terms in 2022 to 45 percent in 2050. Both sectors will see a much greater emphasis on smaller vessels (e.g., medium range [MR] tankers and bulkers of Panamax size and below).
Conversely, containerships will grow their share of the fleet measured in gt from 20 to 36 percent. Most other sectors will maintain their current profile. These trends offer mixed prospects for decarbonization. To date, small tankers and bulkers are sectors that have been slowest to adopt alternative fuels. Conversely, the larger box ship sector is leading the process.


1. Bryan Comer, Lludmila Osipova, "Accounting for well-to-wake carbon dioxide equivalent emissions in maritime transportation climate policies", The International Council on Clean Energy, March 2021
1. https://ww2.eagle.org/en/publication-flip/technology-trends.html
2. https://ww2.eagle.org/content/dam/eagle/articles/abs-carbon-capture-for-offshore-industry-ccj-2021.pdf
3. https://www.iea.org/reports/ccus-in-clean-energy-transitions/ccus-in-the-transition-to-net-zeroemissions
4. https://www.europarl.europa.eu/RegData/etudes/BRIE/2021/698808/EPRS_BRI(2021)698808_EN.pdf
1. Ji, Chenxi, Shuai Yuan, Mitchell Huffman, Mahmoud M. El-Halwagi, and Qingsheng Wang. "Postcombustion carbon capture for tank to propeller via process modeling and simulation." Journal of CO2 Utilization 51 (2021): 101655.
2. IPCC, 2023: Climate Change 2023: Synthesis Report. Contribution of Working Groups I, II and III to the Sixth Assessment Report of the Intergovernmental Panel on Climate Change [Core Writing Team, H. Lee and J. Romero (eds.)]. IPCC, Geneva, Switzerland, 184 pp., doi: 10.59327/IPCC/AR6-9789291691647.
3. https://www.iea.org/energy-system/carbon-capture-utilisation-and-storage
4. International Chamber of Shipping
5. The World Bank, "Carbon Pricing Dashboard: What is Carbon Pricing?" [Online]. Available: https:// carbonpricingdashboard.worldbank.org/what-carbon-pricing.
6. Paris Agreement to the United Nations Framework Convention on Climate Change, Dec. 12, 2015, T.I.A.S. No. 16-1104
7. Dubey, Aseem, and Akhilesh Arora. "Advancements in carbon capture technologies: A review." Journal of Cleaner Production (2022): 133932. European Commission (2022), CO2 emissions of all world countries
8. Ji, Chenxi. "Predicting Fuel Consumptions and Exhaust Gas Emissions for LNG Carriers via Machine Learning with Hyperparameter Optimization." In SNAME Offshore Symposium, p. D021S004R012. SNAME, 2021.
9. © Global Status of CCS 2022, Global Carbon Capture and Storage Institute Ltd
10. Al Baroudi, H., Awoyomi, A., Patchigolla, K., Jonnalagadda, K., & Anthony, E. J. (2021). A review of large-scale CO2 shipping and marine emissions management for carbon capture, utilisation and storage. Applied Energy, 287, 116510
11. Zero Emissions Platform (ZEP), The Costs of CO2 Transport, Post-demonstration CCS in the EU
12. Y. Seo, C. Huh, S. Lee, D. Chang. Comparison of CO2 liquefaction pressures for ship-based carbon capture and storage (CCS) chain. International Journal of Greenhouse Gas Control, 52 (2016), pp. 1-12
13. Health and Safety Executive (HSE) — EH40/2005 Workplace exposure limits
14. Occupational Safety and Health Administration (OSHA) — Permissible Exposure Limits (PELs)
15. National Institute for Occupational Safety and Health (NIOSH) — Recommended Exposure Limits (RELs)
16. American Conference of Governmental Industrial Hygienists (ACGIH)
17. IEA 2023, CO2 Emissions in 2022
18. IEA 2023, CO2 Emissions in 2022
19. Source: Global Carbon Atlas, 2021
21. https://globalcarbonatlas.org/
22. IEA (2020), World Energy Outlook 2020, IEA, Paris https://www.iea.org/reports/world-energy-outlook-2020, License: CC BY 4.0
1. Ji, Chenxi, and Mahmoud M. El-Halwagi. "A data-driven study of IMO compliant fuel emissions with consideration of black carbon aerosols." Ocean Engineering 218 (2020): 108241.
2. Bicer, Yusuf, and Ibrahim Dincer. "Life cycle evaluation of hydrogen and other potential fuels for aircrafts." International Journal of Hydrogen Energy 42, no. 16 (2017): 10722-10738.
3. Intergovernmental Panel on Climate Change (IPCC), The Synthesis Report of the Sixth Assessment Report (AR6), 2023
4. European Maritime Safety Agency, Potential of Ammonia as Fuel in Shipping, EMSA, Lisbon, 2022
5. Innovation Outlook: Renewable Ammonia, International Renewable Energy Agency (IRENA), 2022
6. Nami, Hossein, Giacomo Butera, Nicolas Campion, Henrik Lund Frandsen, and Peter Vang Hendriksen. "MarE-fuel: Energy efficiencies in synthesizing green fuels and their expected cost." MarE-fuel project report 9 (2021): 9-2021.
7. Loginow, A.W. (1989) Stress Corrosion Cracking of Steel in Liquefied Ammonia Service — A Recapitulation. National Board Classic Series, National Board Bulletin
8. Testing and Recommended Practices to Improve Nurse Tank Safety, Phase I Corporate Creator(s): United States. Federal Motor Carrier Safety Administration. Research Division Published Date: 2013-10-01 Report Number: FMCSA-RRR-13-032. DOI: https://doi.org/10.21949/1502781
9. BSSA, 2022. Selection of Stainless Steels for Handling Ammonia (NH3). British Stainless Steels Association
10. American Iron and Steel Institute, 1978. Stainless Steels in Ammonia Production. Committee of StainlessSteel Producers 023-2032
11. Data Source: ABS, Clarkson’s Research — World Fleet Register — August 2, 2023
1. IEA (2022), Global Hydrogen Review 2022, IEA, Paris https://www.iea.org/reports/global-hydrogenreview-2022, License: CC BY 4.0
2. Deloitte, 2023. Green hydrogen: Energizing the path to net zero
