While ABS uses reasonable efforts to accurately describe and update the information in this publication, ABS makes no warranties or representations as to its accuracy, currency or completeness. ABS assumes no liability or responsibility for any errors or omissions in the content of this publication. To the extent permitted by applicable law, everything in this publication is provided without warranty of any kind, either express or implied, including, but not limited to, the implied warranties of merchantability, fitness for a particular purpose, or non-infringement. In no event will ABS be liable for any damages whatsoever, including special, indirect, consequential or incidental damages or damages for loss of profits, revenue, or use, whether brought in contract or tort, arising out of or connected with this publication or the use or reliance upon any of the content or any information contained herein.
1
EXECUTIVE SUMMARY
1 .1 Well-to-Wake Emissions Fall Short: Net-Zero Ambition in Question
Although shipping has reduced carbon intensity per unit of transport work for almost two decades — initially by slowing vessel speeds and increasing ship sizes, and later through environmentally conscious operations and improved design — the total Wellto-Wake (WtW) greenhouse gas (GHG) emissions present a different narrative. After the 2008 financial crisis sharply reduced trade volumes, emissions have steadily increased in line with trade growth and rising tonnage on the water since 2010.
The shipping industry operates through self-regulating dynamics of supply and demand, influenced by macroeconomic indicators such as gross domestic product (GDP) and population growth, geopolitical disruptions including sanctions and security threats, and climatic factors such as droughts. Similarly, the improvements in carbon intensity observed so far — only partially attributable to environmental initiatives — have largely been shaped by market forces.
Today, shipping’s WtW carbon dioxide (CO 2 ) emissions are approximately 121 percent of the 2008 baseline , highlighting the growing challenge of meeting industry targets.
Emissions (Historical) (LHS)
Emissions (Forecast) (LHS)
IMO Targets (LHS) Carbon
Gross Tonnage (RHS)
(AER) (LHS)
Figure 1: Evolution of shipping CO2 equivalent emissions.
While the industry has yet to fully assess the true impact of regulatory measures on shipping decarbonization, it is evident that in highly regulated markets, end users will largely bear the cost of compliance, rather than shipowners or charterers. As a result, regulatory constraints function as additional variables within the system, rather than overriding the prevailing market dynamics. Given the relatively limited availability of low carbon solutions, compliance costs — whether from regulatory penalties or the procurement of high-cost green fuels — are expected to function as de facto trade tariffs. This dynamic carries significant implications for efficiency and competitiveness in global maritime trade.
1 .2 LNG and Biofuel Availability and Affordability Outpace Green Fuel Readiness
Prevailing market dynamics reveal that, from a total cost of ownership perspective, clean fuels currently present a weak economic case due to their high costs and limited availability, even under optimistic assumptions for their adoption. At the same time, compliance costs are rising sharply. For example, vessels trading within the European Union (EU) could see daily operating costs increase from approximately $15,000 in 2028 to around $45,000 by 2035 for a ship consuming 30 tons of very low sulfur fuel oil equivalent (VLSFOe) per day.
Blue fuels heavily rely on carbon capture technologies, which are advancing slowly. Clean fuels, on the other hand, depend on electrolyzers and renewable electricity, both of which face escalating costs and significant investment risks. Green methanol is limited
by its dependence on renewable hydrogen and scarce biogenic CO2, with costs estimated to be two to four times higher than conventional fuels. Although ammonia is promoted as a zero-carbon alternative, it is corrosive and toxic. Additionally, most ammonia projects are driven by energy majors targeting energy markets rather than maritime applications. Hydrogen faces even steeper challenges: infrastructure remains nascent, safety risks are considerable and deep-sea readiness is not expected.
While these fuels may play a role later in the transition, they are unlikely to deliver meaningful decarbonization before 2040. They remain strategic wildcards that warrant monitoring, but they do not provide a reliable foundation for near-term fleet planning. Any regulatory intervention aimed at forcing their adoption would require such high compliance costs that it risks distorting competitive market behavior.
Figure 2: Total cost of ownership for different fuel options for a Panamax and IMO fuel-related costs [ABS, MSI].
Conversely, liquefied natural gas (LNG) stands out as a relatively clean alternative to conventional fossil fuels. While it may incur higher compliance costs than green fuels in the long term, LNG offers much lower base costs and a more robust global supply chain. Both base cost and future penalties for LNG can be predicted with
relatively high confidence, making it a pragmatic choice for the foreseeable future. Additionally, LNG serves as a strategic enabler in the transition to blue fuels, acting as key feedstock for amine-based carbon capture, while its supply chain lays the groundwork for trading ammonia and hydrogen.
Alternative Fuel Mix (per gt)
In 2024, LNG-capable vessels represented 70 percent of all alternative-fueled newbuild orders. Bunkering infrastructure is now available at more than 170 ports worldwide, supported by more than 50 dedicated LNG bunkering vessels. Shipowners are increasingly
turning to LNG because it offers certainty as a proven fuel with established safety standards and expanding infrastructure. Liquefied natural gas is an affordable fuel option that enables decarbonization even in the hardest to abate ship segments.
Figure 4: Average marine fuel prices (April 2025) [S&P global commodity insights].
1 .3 Energy Efficiency Technologies and Carbon Capture Extend the Runaway
However, LNG’s role in decarbonization has its limitations. It is not a zero-carbon fuel and must be considered within a broader, long-term strategy for emissions reduction.
Energy efficiency technologies (EETs) and carbon capture represent the industry’s “runway extension.”
While they cannot replace the fuel transition, they can help maintain progress until scalable zero-carbon fuels and nuclear options become available.
Energy efficiency technologies such as air lubrication, wind propulsion and other energy improvement measures are rapidly scaling up, with EETs installed on nearly half of the gross tonnage currently in operation. FuelEU Maritime provides direct reward factors for wind propulsion, encouraging uptake. Although onboard carbon capture systems are not yet included in compliance measures, they are progressing toward regulatory integration. Meanwhile, liquefied carbon dioxide (LCO2) carriers are emerging as a key transportation method in the CO2 value chain and the production of blue fuels. However, industry readiness varies significantly by vessel type.
Figure 5: LNG bunker demand (top) and bunker fleet (bottom) up to 2030 [MSI, ABS].
— gt
Policy Alignment (Fleet CII Compliance, 2024)
Alt Fuel Uptake — gt ratio
EETs Uptake — gt ratio
Policy Alignment (Fleet CII Compliance, 2024)
Alt Fuel Uptake — gt ratio
EETs Uptake — gt ratio
Policy Alignment (Fleet CII Compliance, 2024)
Alt Fuel Uptake — gt ratio
Orderbook Current Fleet
Another constraint is shipyard capacity. Under realistic scenarios, global retrofit capacity turns negative by 2028–2030, creating a bottleneck that could leave many owners without compliance options if they delay booking slots.
Figure 6: Industry readiness (policy alignment by vessel number).
Figure 7: Shipyard capacity deficit projection.
1 .4 Nuclear is the Long Game
Looking beyond 2035, nuclear propulsion — particularly using small modular reactors (SMRs) — offers a promising pathway to close the maritime decarbonization gap. Small modular reactors provide near-zero emissions and remain insulated from the volatility of green fuel markets. Early demonstrations of floating nuclear power plants are emerging, potentially paving the way for shipboard integration.
Scaling SMRs for merchant fleets depends on risk underwriting, insurance, an updated code for nuclear merchant ships and public acceptance. Floating nuclear power plants in the 2030s present a realistic entry ramp. However, widespread adoption will require robust insurance mechanisms. While technological readiness is advancing, key barriers remain, including regulatory frameworks and public perception. Notably, the International Maritime Organization (IMO) recently decided to update The Code of Safety for Nuclear Merchant Ships, which was adopted in 1981.
1 .5 Conclusion
Shipping is not yet aligned with the IMO trajectory. Emissions remain above the 2008 baseline, compliance costs are compounding, and the signals shaping investment — regulation, fuel pricing, penalties, availability, scalability — are moving at different speeds. The risk is clear: the industry could end up monetizing carbon without actually delivering decarbonization.
This Outlook outlines a pragmatic course that bridges the gap between ambition and reality. As the 2030s approach, the only bankable path is to protect the bridge (LNG with methane-slip controls and credible bio- or e-LNG pathways), extend the runway (EETs and onboard carbon capture to cut WtW emissions now), and prepare the endgame (nuclear and true zero-carbon fuels when they are safe, insurable and investable at scale).
The priority is to decarbonize safely, credibly and affordably. That means synchronizing frameworks to avoid double charging, derisking retrofits amid yard bottlenecks, and focusing on lanes where vessels, fuel and infrastructure can come together now. It is essential not to over-penalize the solutions that work today, nor to over-promise those that do not yet exist at scale.
By converting monetization into mobilization, backing near-term, measurable reductions and investing with discipline in tomorrow’s options, shipping can meet tightening targets while preserving safety, reliability and trade. Getting this right is not about winning the rhetoric of net zero; it is about building the system that actually delivers it.
2INTRODUCTION SETTING THE SCENE
The maritime sector stands at a pivotal juncture. Decarbonization has shifted from a strategic aspiration to an execution race measured in years, not decades. The central question for the next five years is straightforward:
Can policy, technology and capital mobilize fast enough to bridge the growing gap between climate ambition and operational reality?
This year, ABS’ Outlook, Beyond the Horizon: Vision Meets Reality, answers this question by examining the forces now reshaping shipping. This introduction frames the regulatory context, quantifies today’s emissions gap, highlights emerging market signals, and outlines the converging architecture of risks and opportunities.
2 .1 A Rapidly Tightening Regulatory Net
Global, regional and local measures are converging to create the most demanding governance landscape shipping has ever faced. The regulatory landscape in 2025 is more dynamic, fragmented and impactful than ever before. The following table summarizes the current status.
Global The International Maritime Organization (IMO) Net-Zero Framework (NZF) with checkpoints of -20% by 2030 and -70% by 2040
Greenhouse Gas Fuel Intensity (GFI) A Well-to-Wake (WtW) fuel standard
European Union Emissions Trading System (EU ETS)
100% intra-EU + 50% extra-EU coverage by 2026
FuelEU Maritime
WtW intensity cuts from -2% (2025) to -80% (2050)
Establishes the first binding, sector-wide trajectory and front-loads abatement into the 2025–2030 window
Prices carbon on voyages connected to Europe, materially raising fossil-fuel operating costs
Forces progressive blending or adoption of zero-carbon fuels to avoid stiff penalties
Regional
United Kingdom (UK ETS) Entry 2026
8: Regulatory landscape.
Globally, the International Maritime Organization’s (IMO) revised greenhouse gas (GHG) Strategy adopted in July 2023 (Refer to Figure 1.1) sends an unmistakable signal: net-zero GHG emissions are now a formal ambition for the maritime sector, with key targets of at least a 20 percent reduction from 2008 levels by 2030, 70 percent by 2040 and full decarbonization around 2050.
Mirrors the EU ETS scope and price trajectory for UK-linked voyages
20%, striving for 30%
Reduction of CO2 emissions per transport work, by at least 40%, compared to 2008
Uptake of zero or near-zero GHG emission fuels at least 5%, striving for 10%
While these targets are supported by short-term technical measures such as the Energy Efficiency Existing Ship Index (EEXI) and the Carbon Intensity Indicator (CII), the real shift lies ahead, in the form of a net-zero framework grounded in a WtW life-cycle emissions approach, with the greenhouse gas fuel intensity (GFI) metric at its core.
Reach net-zero GHG emissions by or around 2050
Figure
Figure 9: IMO GHG strategy checkpoints and targets.
The GFI standard is a fuel-based carbon intensity regulation applying to ships of 5,000 gross tonnage (gt) and above. Entering into force in 2027, with the first compliance assessments scheduled for 2028, the GFI represents a foundational element of the IMO’s broader decarbonization framework. It adopts a WtW methodology, capturing GHG emissions across the entire life cycle of marine fuels (from production and transport through to onboard combustion), thereby establishing a comprehensive basis for compliance evaluation.
At the heart of the regulation are two performance benchmarks for the GHG intensity of energy used on board: a base target and a direct compliance target. These targets are designed to decline gradually over time, with the initial reference point set at 93.3 grams of carbon dioxide equivalent per megajoule (gCO2e/MJ). The GFI creates a progressive pathway for emissions reduction across the global fleet. An illustration of this framework is shown in Figure 10.
Tier 2 Compliance
• SUs from other ships (pooling)
• SUs from other period (banking)
• Payment by purchasing RUs at $380 per tonne of CO2e
Tier 1 Compliance
• Payment by purchasing RUs at $100 per tonne of CO2e
Compliance with the GFI is governed by a credit-andpenalty mechanism. Ships that exceed the standard (meaning their attained annual GFI is lower than the direct compliance target minus the Tier 2 threshold) are deemed over-compliant and earn surplus units (SUs). These units can be banked for up to two years or transferred to under-compliant vessels, creating a market-based incentive for early action.
Conversely, ships that do not meet the direct compliance target must either acquire SUs from other operators or purchase remedial units (RUs) through the GFI Registry. The cost of these RUs depends on the degree of noncompliance. If a ship’s GFI falls between the direct compliance target and the base target (Tier 1 deficit), RUs are priced at $100 per tonne of carbon dioxide equivalent (tCO2e) for the excess emissions. If the GFI exceeds both targets (Tier 2 deficit), the penalty is more severe: $100/tCO2e for emissions between the direct and base targets, and $380/tCO2e for emissions above the base target.
To further incentivize low-emission technologies, the regulation introduces a reward mechanism for zero
or near-zero fuels, technologies and energy sources (ZNZs). Such technologies or fuels with a GFI below 19.0 gCO2e/MJ (until the end of 2034) or below 14.0 gCO2e/MJ (thereafter) qualify for financial rewards. The precise structure and pricing of this incentive is expected to be finalized at the IMO’s extraordinary Marine Environmental Protection Committee (MEPC) session in October 2025. Further, a notable feature of the GFI system is its integration of climate finance. Revenue generated through the sale of RUs is reserved for climate-related projects in developing countries.
As global decarbonization ambitions continue to take shape, regional regulations are already exerting tangible impacts on vessel operations. The EU ETS now includes maritime transport, applying carbon pricing to both intra-EU voyages (with 100 percent emissions coverage) and international voyages to or from EU ports (with 50 percent coverage). The phased implementation, covering 40 percent of emissions in 2024 and ramping up to full coverage by 2026, is deeply transforming the economic landscape for operating in European waters.
Figure 10: GFI tier structure and tightening WtW thresholds (2028–2035).
In parallel, FuelEU Maritime entered into force in 2025, introducing a progressively stricter GHG intensity reduction pathway for energy used on board (based on a WtW approach). As illustrated in the figure above, starting with a 2 percent reduction in 2025, the regulation aims to reach an 80 percent reduction by 2050, driving the transition toward low- and zeroemission fuels.
The impact of an increasingly complex regulatory environment is no longer a distant horizon. It is the operating reality for maritime stakeholders in 2025. As
Cargo-owner pressure
Financesector alignment
regulations enter into force and enforcement sharpens, compliance is now a real constraint on commercial decision-making. From ship design and fuel selection to charter terms and investment flows, compliance is embedded into every strategic choice.
2 .2 Market Forces Amplify the Regulatory Push
Cargo owners, financiers, charterers and fuel suppliers are shaping a market where emissions performance is a competitive variable.
The Cargo Owners for Zero-Emission Vessels (coZEV) coalition now covers > 35 million (m) twenty-foot equivalent (TEU); several brands pay green premiums on pilot corridors.
>70% of shipping debt is aligned with climate-linked lending; record volumes of sustainability-linked loans.
Investor signals Sea Cargo Charter doubled signatories; charter-party clauses tie rates to emission trajectories.
Fuel-supplier moves 15 ports now bunkering methanol; 13 liquefied natural gas (LNG)/ammonia hub agreements signed in 2024.
These pressures transform decarbonization from a compliance cost into a strategic revenue and financing consideration.
2 .3 Convergence of Policy, Market and Technology
By mid-decade, combined EU ETS allowances and FuelEU Maritime penalties could lift conventional fuel cost on European trades by ~90 to 120 $ per tonne. Global GFI fees add further cost to high-intensity fuels. Operators that switch to compliant fuels or secure surplus credits can neutralize these charges, making carbon-efficient operations the lowest-cost option.
2 3 1 Shifting Asset Values
More than 50 percent of newbuild tonnage on order is alternative-fuel capable, reflecting the industry’s efforts to futureproof new assets. Eco-design or fuelready vessels typically achieve resale premiums in the order of 5 to 10 percent over more conventional ships. Older single-fuel tonnage risks value erosion and early scrapping.
2 .3 .2 Technology Scale-Up
The adoption of wind-assisted, air-lubrication and other energy efficiency technologies (EETs) is increasing in response to the statutory requirement as well as to maintain the older tonnage under regulatory compliance. Dual-fuel ammonia and methanol engines are entering service, while early onboard carboncapture pilots indicate future pathways to negativeemissions operations.
2 .3 .3 IMO Net-Zero Fund
The IMO agreed in principle to plow back GFI fees into a Net-Zero GHG Fund, supporting research and development, infrastructure and equitable transition measures, which could potentially unlock billions of dollars' worth of pioneering projects. Decarbonization efforts are accelerating and self-reinforcing in a virtuous cycle.
2 .4 The Aim of ABS’ 2025 Outlook
As the maritime industry stands at the onset of a great transition, with decarbonization regulation becoming globally more stringent and the introduction of carbon pricing, compliance costs are projected to increase substantially by 2035. This regulatory pressure will reshape the fuel economics, fleet investment decisions and the market competitive landscape, catalyzing the scale-up of green fuels and advanced technologies as green financing gains ground, offering strategic support to proactive stakeholders.
The 2025 Outlook offers a data-driven perspective on five key areas — regulation, fuels, technology, infrastructure and market dynamics — intending to provide a forecast for the coming decade. It provides a critical analysis of the maritime industry’s progress toward net-zero emissions, evaluating the balance between ambitious goals and actual implementation. The race to decarbonize is already underway; the winners will be those who invest early, learn fast and collaborate across the value chain.
Costs are real and compounding .
A typical 30-ton-per-day ship trading into Europe faces combined compliance costs of $15,000 per day (2028) rising to $45,000 per day (2035) from NZF, EU ETS and FuelEU Maritime. These costs will largely be passed on to the end user, with the risk of becoming de facto trade tariffs rather than decarbonization incentives.
3
MARITIME DECARBONIZATION WHERE WE STAND TODAY
3 .1 Reality Check on Emission Reduction Goals
Despite ambitious targets set by the International Maritime Organization (IMO) and regional bodies, the maritime industry faces significant challenges in reducing greenhouse gas (GHG) emissions. This section provides an assessment of current carbon dioxide (CO2) emissions trends, fleet retrofitting and alternative fuel adoption. It also examines technological, regulatory and economic barriers hindering progress, supplemented by case studies illustrating successes and setbacks.
3 1 1 Decarbonization Scorecard
Before delving into details, an evaluation of the shipping industry’s progress toward decarbonization was carried out, considering the following criteria:
• Adoption of energy efficiency technologies (EETs)
• Adoption of alternative fuels
• Compliance with Carbon Intensity Indicator (CII) emission regulations
• Emissions benchmarking
In Table 2, each of these aspects is associated with a metric to which a score is assigned. This sets the stage for the analysis in subsequent sections.
Shipping’s
emissions
are still rising . In 2024, Well-to-Wake (WtW) CO 2 reached 121 percent of the 2008 level despite intensity improvements, demonstrating that demand growth have outpaced operational efficiencies. The next five years will determine whether the trajectory can be corrected or if the IMO’s 2030 checkpoint will be missed.
Table 2: Annual change in global seaborne trade.
Research
Research
Clarksons Research
Clarksons Research
The evolution of CO2 emissions offers an insightful perspective on the current state of decarbonization. As illustrated in Figure 12, emissions reached an all-time low in 2010, primarily due to a sharp decline in shipping demand following the 2008 global financial crisis. Since then, maritime trade has grown steadily, and emissions have followed suit, surpassing their 2008 levels around 2018 and continuing to rise to reach 121 percent of the 2008 baseline in 2024, where 2008 is the benchmark year for emissions adopted by the IMO. Incidentally, not even a temporary dip in global shipping caused by the COVID-19 pandemic in 2020 was enough to reverse this upward trend.
Emissions have also shown a roughly linear correlation with tonnage on the water: the average yearly rate of growth in emissions (3.7 percent) well correlates to the growth in tonnage capacity (4.0 percent), where the 7.5 percent difference between these two values is attributable to improvements in efficiency due to slow steaming and design optimization.
CO2 Emissions Trends
Shipping accounts for approximately 3 percent of global GHG emissions. Reducing these emissions remains a daunting challenge for the industry, as illustrated in Figure 13. Despite efficiency gains from slow steaming and hull design improvements, the sector’s carbon footprint persists.
When viewed from the perspective of operational efficiency, the emissions relative to capacity-distance (a proxy for transport work) have remained virtually unchanged in the past few years. Figure 14 illustrates a CII bottom-up approach, highlighting that the ratio of CII-compliant vessels (defined as those with estimated CII ratings of A, B or C) is around 65 percent to 67 percent.
Oil Based Methanol LPG LNG Bio/e-diesel
Fleet Retrofits and EETs
Regulatory reforms are supporting retrofits, particularly dual-fuel (DF) engine conversions. Shipowners are increasingly retrofitting vessels to run on liquefied natural gas (LNG) or methanol. Regulations such as FuelEU Maritime and the IMO’s Net-Zero Framework (NZF), approved during (Marine Environmental Protection Committee) MEPC 83, are major drivers for retrofits aiming to change ships’ energy sources to greener pathways. Also, MEPC 83 approved a work plan for the development of a regulatory framework for the use of onboard carbon capture and storage (OCCS), a long-awaited step which is expected to boost adoption in the industry.
Figure 13: Total WtW shipping emissions [MSI, ABS].
Figure 14: CII compliance fleet ratio [MSI, ABS].
Nevertheless, retrofits have been a typical industry approach to compliance with environmental regulations, as well as overall efficiency improvements aimed at curbing fuel consumption, where the number of vessels retrofitted with EETs has been increasing for decades. More recently, larger-scale retrofits focusing on energy optimization, such as wind-propulsion and air-lubrication systems, have been rapidly accelerating, consolidating the industry’s focus on reducing its environmental impact by diminishing its demands on main engines. Apart from EET retrofits, interest in operational efficiency-enhancing measures has tremendously increased in the latest years: concepts such as route and trim optimization have become commonplace for industry stakeholders.
Data from Clarksons Research (refer to Figure 15), indicates that about 11 percent of vessels in the world fleet are fitted with EETs, accounting for almost 43 percent of the world’s tonnage. The current orderbook indicates that about 34 percent of the vessels on order will be fitted with EETs, accounting for 48 percent of the respective tonnage.
Alternative Fuel Adoption
The fuel transition is accelerating. In 2024, 670 vessels with alternative fuel capabilities were ordered, excluding those characterized as alternative-fuel ready, representing about 35 percent of the year’s
Figure 15: Adoption of EETs by gt [Clarksons Research].
orderbook tonnage. As of July 2025, LNG remains the dominant choice, accounting for about 70 percent of alternative-fueled ship orders. Almost 400 LNG-fueled (or LNG-ready) ships were ordered in 2024, outpacing methanol (<130 orders) and ammonia (<30 projects). Methanol’s appeal lies in its compatibility with existing engines, while ammonia — despite its toxicity and handling challenges, is gaining traction as a zero-carbon contender. Figure 16 illustrates those trends.
Figure 16: 2024 Orderbook by gt ratio [Clarksons Research].
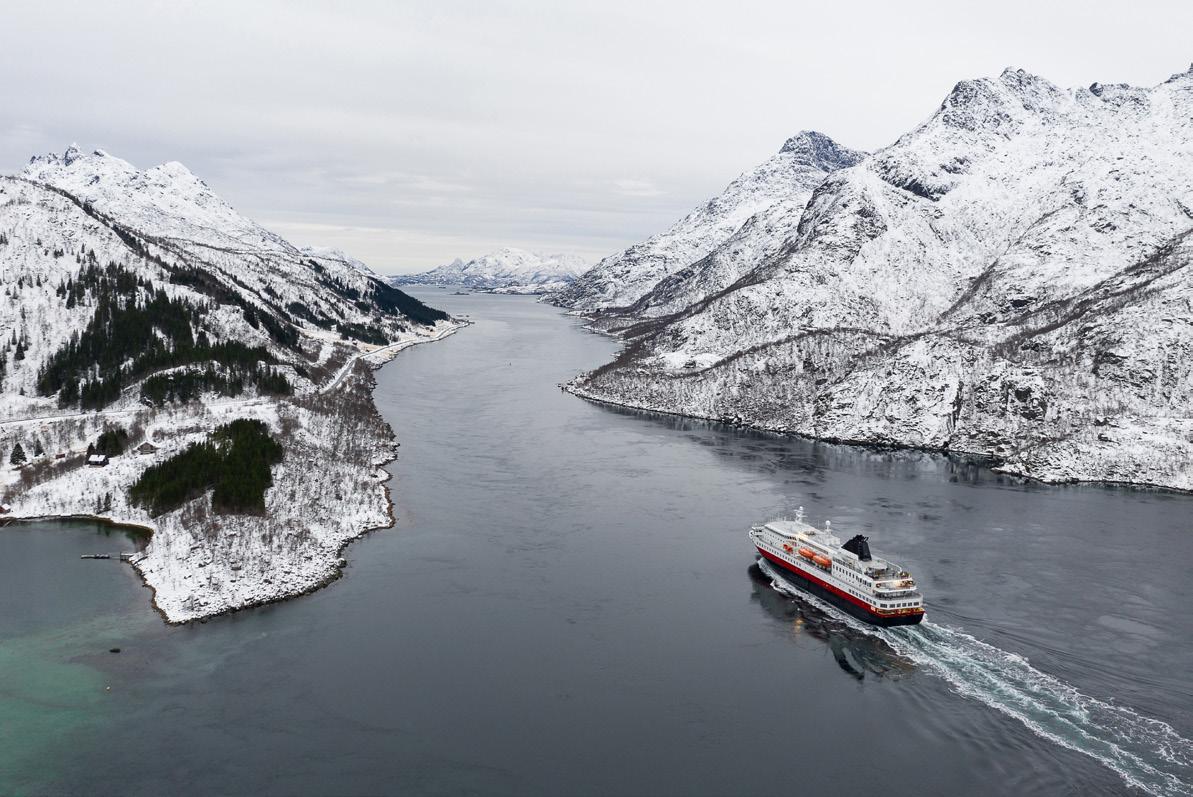
Regulations are proving to be a driver for accelerating the adoption of alternative fuels. Not only international sweeping regulations but also local endeavors are playing a prominent role in route to net zero. For instance, following Norway’s mandate for zero-emission cruise ships in the United Nations Educational, Scientific and Cultural Organization (UNESCO) fjords by 2026, coastal operators have deployed hybrid battery systems and are already slashing CO2 emissions on the fjord routes. This policy-driven model demonstrates how regional mandates can catalyze technology deployment, even in a regional context.
3 .1 .3 Shipping Energy Demand and CO2 Emissions Projections
Population is expected to be stagnant in the developed world in the following decades. The overall growth will
be largely attributed to countries currently characterized as developing (Figure 17). Until those countries tap into their human resources in their most productive age — which could take decades — and reach the income levels of the more developed ones, cargo demand will plateau with population growth. Combined with the expected advancement in the adoption of low-emission fuels and technologies, the total use of fuel is expected to stabilize, and the introduction of alternative fuels is anticipated to reduce overall CO2 emissions by 2050 (Figures 18 and 19).
The pace of adoption of alternative fuel technologies, along with respective infrastructure development, will be crucial in determining whether the IMO’s ambitious target of net-zero emissions in 2050 can be achieved.
Figure 17: World population estimates [United Nations].
Bulker Containership Cruise Gas Carriers
Cargo Ro/pax Tanker
3 .1 .4 Barriers to Emissions Reduction: Developmental, Regulatory and Economic
A. Developmental Limitations
Zero-emission fuels like green ammonia and hydrogen face production, storage and safety hurdles. Infrastructure gaps are equally critical: LNG bunkering is rapidly developing, currently available at about 170 ports worldwide. Ammonia and hydrogen port infrastructure is embryonic. Without ports equipped to handle these fuels, adoption will lag.
B. Regulatory Uncertainty
The IMO’s 2023 Revised GHG Strategy set ambitious targets, i.e., a 20 percent to 30 percent absolute GHG emissions cut by 2030 and net zero by 2050, but implementation is fraught. Its carbon pricing mechanism, set to start in 2028, imposes a levy on emissions exceeding targets based on a two-tier system. The regulations set out in MEPC 83 outline the establishment of a Net-Zero Fund, which will reward the usage of net-zero fuels; however, details are not yet established. Nevertheless, the unique characteristic of
Figure 19: Total WtW shipping emissions (2020–2050 projections, all sectors) [MSI, ABS].
the maritime industry being a trans-national industry regulated by a global organization can be regarded as advantageous, allowing for the implementation of a worldwide common path to decarbonization.
C. Economic Constraints
The green premium for alternative fuels remains prohibitive (Figure 20). Green methanol costs two
to three times as much as conventional marine fuel, and the price of green ammonia is exacerbated by limited renewable energy for production. Blue fuels are expected to provide a valuable transitional tool. Compounding this, slow fleet turnover, ships typically operate for 25 to 30 years, delays the impact of newbuild efficiencies.
3 1 5 Industry Readiness
Regarding the industry’s readiness levels, Figure 21 highlights some of the insights addressed previously for three of the highest-weight shipping segments — containerships, dry bulkers and oil tankers (crude and product). Each segment is assigned a readiness score in three major categories: policy alignment, alternative fuels uptake and EETs uptake, each coinciding with a comprehensive ratio.
The summary of these scores is considered a proxy of each segment’s readiness for the decarbonization path set forward in the next two to three decades. This analysis focuses only on ships; it omits the role of other actors (e.g., ports, bunkering stations, etc.) on shipping’s decarbonization path.
Policy alignment is proxied by CII compliance. While the estimations seem satisfactory, it is crucial to note that CII is an interim measure; starting from 2030, it will be virtually impossible for the industry to keep up with the IMO’s reduction trajectories by simply imposing CII compliance.
The level of alternative fuel uptake is evident in the current fleet and the orderbook data. A few owners have taken steps in this direction, the majority of which are in the containerships market. This trend will continue, as indicated by the containerships orderbook, where almost eight out of 10 vessels will be able to use alternative fuels, although the other segments are picking up momentum.
$/Tonne VLSFOe
Figure 20: Average marine fuel prices (April 2025) [S&P global commodity insights].
EETs Uptake — gt ratio
Policy Alignment (Fleet CII Compliance, 2024)
Alt Fuel Uptake — gt ratio
EETs Uptake — gt ratio
Policy Alignment
(Fleet CII Compliance, 2024)
Alt Fuel Uptake — gt ratio
EETs Uptake — gt ratio
Policy Alignment
(Fleet CII Compliance, 2024)
Alt Fuel Uptake — gt ratio
Orderbook Current Fleet
Figure 21: Industry readiness (policy alignment by vessel number) [EETs and alternative fuel data: Clarksons’ Research; CII data: MSI].
The area where the shipping industry has made significant progress is the uptake of EETs — whether retrofitted or implemented during newbuilding. Unexpectedly, the level of EETs adoption in the orderbook seems to be lower than the level of uptake in the existing fleet. An explanation is that EETs and alternative fuel technologies, due to their common trait of reducing emissions (and, possibly, associated regulatory costs in the near future), partially act as mutually exclusive in this context.
3 .2 The Role of Regulation and Compliance Costs
Both the IMO and the European Union (EU) have created measures designed to incentivize the reduction of emissions. These measures can be split into two broad categories, Tank-to-Wake (TtW) measures, for emissions emitted by fuel combustion on the ship, and WtW measures, for life-cycle emissions (Table 3).
Table 3: Categorization of regulations.
It is worth mentioning that for biofuels, both the IMO and the EU have used a hybrid approach in the CII and Emissions Trading System (ETS) schemes to allow the WtW gains to be reflected in a TtW measure.
TtW compliance can be achieved through efficiency improvements (operational improvements, EETs) and fuel type changes. For WtW measures, due to the Well-to-Tank (WtT) component and the fact that emission intensity is considered rather than the amount of emissions, a change to a fuel with a lower emission
intensity is required for compliance. Certain specific EETs, due to large reductions in TtW emissions (e.g., onboard carbon capture) or special treatment in the regulations (e.g., wind-assisted-propulsion reward factor in FuelEU Maritime), may also facilitate compliance with WtW targets.
TtW measures are relatively more straightforward to comply with, but only WtW measures will promote the reduction in emission intensity which is required by the IMO strategy.
3 2 1 IMO International Shipping GHG Trends
The Story So Far: IMO Short-Term Measures
In line with the Initial IMO Strategy, the IMO adopted the short-term GHG reduction measures at MEPC 76. These measures include Energy Efficiency Existing Ship Index (EEXI) (technical approach) and CII (operational approach), the inclusion of methane emissions and volatile organic compounds and the development of GHG Guidelines.
International shipping GHG emissions (CO2e) increased from 886 million tonnes in 2008 to 900 million tonnes in 2018, but the carbon intensity over the same period decreased as indicated by two carbon-intensity indexes: Annual Efficiency Ratio (AER), which considers deadweight, showing a reduction of 21 percent, Energy Efficiency Operational Indicator (EEOI), which considers actual cargo carried, showing a reduction of 29 percent.
From 2021 to 2023, the application of the short-term measures led to a further decrease of between 8 percent (AER) and 4 percent (EEOI).
Supply-Based Carbon Intensity (AER)
Fourth IMO GHG Study IMO DCS
Based on the 2023 IMO Data Collection System (DCS) data, the CII performance of the global fleet is above par, with over 75 percent of vessels rated C or better as shown in Figure 23 below. It is worth noting that CII is based on the AER, which is a measure of emissions intensity, and not the actual fuel used.
Figure 24 illustrates the evolution of fuel oil usage over the 2019 to 2023 period. The overall fuel oil usage dropped about 1 percent between 2022 and 2023, based on IMO DCS data. Whereas biofuel use shows significant growth over the same period, with a 73 percent increase, although this is still only a 0.2 percent contribution to the overall fuel use.
The Story So Far: EU Measures
Despite the inclusion of monetary penalties in the EU measures, their effects on ship ownership are limited by the following factors:
• Limited geographical applicability (voyages arriving and departing from the EU, intra-EU voyages and port stays).
• EU ETS allowances can be reimbursed by the charterer.
• FuelEU Maritime entered into force only in 2025.
• Uncertainty about the future applicability due to IMO midterm measures.
Figure 24: Conventional and biofuel consumption [MEPC.82/6/38].
Thus, it is more important to analyze the global effects of the upcoming IMO mid-term measures, as they are expected to be a key driver for the widespread adoption of decarbonization technologies, alternative fuel options and related infrastructures.
3 .2 .2 IMO Mid-term Measures
Global Compliance: The IMO Net-Zero Framework
As the only global measure to impose a cost linked to the emission intensity of a vessel, the IMO NZF has the potential to deeply affect shipping and lead the push for the use of lower-carbon alternative fuels.
While similar to FuelEU Maritime, the IMO NZF uses a two-tier approach (base and direct), with two different Remedial Units (RUs). Tier 1 (direct) RUs are priced at $100 per tonne of carbon dioxide equivalent (CO2e), whereas Tier 2 (base) RUs are priced at $380 per tonne of CO2e, fixed until 2030. Reward Units are provided by the regulation for the use of fuels with an emission intensity below 19 grams of carbon dioxide equivalent per megajoule (gCO2e/MJ) (14 gCO2e/MJ for 2035 onwards), to attempt to further incentivize the adoption of very low carbon fuels.
The cost of the RUs is only fixed until 2030, and further details of the Reward Units (cost and process) have not been provided yet, limiting the long-term accuracy of any analysis on the cost impact of the NZF. Nevertheless, a preliminary estimation of the short- and mid-term cost trends ensuing from the NZF can be performed.
Cost of the Net-Zero Framework
The daily NZF penalty projection to 2035 for vessels with a consumption of 20, 30 and 50 tonnes per day of very low sulfur fuel oil (VLSFO) is shown in Figure 25, with the RU costs kept at pre-2030 levels up to 2035 ($100 and $380). It is apparent that the impact on shipowners in the short- to mid-term is substantial, with a penalty of about $2,800 (in 2028) increasing to $10,000 per day (in 2035) for a fuel consumption of 20 tonnes per day, ramping up to about $6,000 (in 2028) and $25,000 (in 2035), respectively, for a fuel consumption of 50 tonnes per day. These costs will increase further if the RU costs increase post-2030.
Figure 25: Daily penalty projections.
Cost Comparison of the Net-Zero Framework and EU Measures
For vessels with intra-EU voyages, from 2028, three different market-based measures could apply simultaneously. The financial burden for compliance is substantial as shown in Figure 26, where the daily compliance costs for a vessel with a 30 tonne of VLSFO per day consumption for GFI (NZF), EU ETS and FuelEU Maritime are presented over the 2028 to 2035 period. With a fixed EU Allowance (EUA) cost of 80 euros
per tonne CO2e, the EU ETS cost is the highest until 2031 ($8,700). From 2032 to 2034, the IMO NZF costs are highest, ranging from $9,600 to $13,400. Finally, in 2035, the cost of FuelEU Maritime reaches almost $21,000. In isolation, they may not seem like dominant factors, but, when combined, they represent a game changer for small to medium shipping companies, with a daily combined cost for all three measures starting at $15,000 in 2028 and reaching $45,000 in 2035.
VLSFO consumption 30t/day — IntraEU voyages
FuelEU penalty annual increase by 10%
EU ETS price: 80 euro/tonneCO2e
Compliance Cost ($)
Figure 26: Daily penalty comparison: GFI vs. EU ETS vs. FuelEU Maritime.
There is now mounting pressure for the EU to rescind the FuelEU Maritime regulation and remove shipping from the ETS to avoid the potential tripling of compliance costs for vessels trading in the EU and the knock-on effects on shipping companies, EU trade and end consumers.
3 .2 .3 Effectiveness of the IMO Net-Zero Framework
Based on the evolution of the base and direct compliance targets and the emission intensity of different fuels, the regulatory balance can be estimated, as shown in Figure 27, while Figure 28 also includes the cost of fuel, assuming the emission intensities and cost differentials in Table 4. The Reward Units (to be awarded to fuels with emission intensity below 19 gCO2e/MJ up to 2034) have not been set in value yet by the IMO, and they are omitted in the present consideration, where green methanol is taken as a reference green fuel, in order to estimate what level of reward would be required to make green fuels competitive before 2035.
Table 4: Fuel cost differential $/tonneVLSFOe. *Methanol used as a reference.
Positive values are savings, whereas negative values are costs, where positive savings, in NZF terms, can be exploited to offset penalties ensuing from more polluting vessels. It is apparent that both LNG and LSFO B30 are robust mid-term solutions, while biodiesel and greener fuel provide longer-term alternatives for compliance with IMO NZF.
Monetization must equal mobilization . The IMO NZF's credit-andpenalty system will generate significant revenues. However, unless reward pricing, revenue recycling and governance are clear — and visibly reinvested in bunkering, safety, training and corridors — carbon will become a cost overlay rather than a catalyst.
Nonetheless, further clarity can be obtained by adding the cost of fuel to the regulatory balance (Figure 28), thus showing that no fuel leads to net positive savings. This constrains the role of clean fuels in facilitating the transition. The combination of emission intensity and fuel price cost (or differential) is the determining factor when considering the economic viability of low-carbon alternative fuels. In particular, for fuels with an emission intensity below 19 g CO2e/MJ, in the present analysis, a suitable Reward Unit to the order of thousands of dollars would be required to fill the spread between green fuels and VLSFO.
3 .2 .4 Key Takeaways
The short-term IMO measures (CII, EEXI) have been moderately successful in reducing the emissions and emission intensity of global shipping. But further reductions mandated by the IMO and EU measures will require a more focused and holistic approach, which includes the adoption of low, near-zero and zero carbon fuels in the coming decades.
The IMO NZF could lead to substantial compliance costs from 2028, and for vessels traveling into the EU, the combination of this measure with the existing EU ETS
VSLFO LNG LSFO B30 Biodiesel Green Methanol
VSLFO LNG LSFO B30
Figure 27: Compliance cost per tonne of fuel, excluding cost of fuel.
Figure 28: Compliance cost per tonne of fuel, including cost of fuel.
and FuelEU Maritime will increase operational costs and affect the cost of goods shipped into and out of the EU with unknown long-term consequences. This is intensifying calls to rescind the FuelEU Maritime and remove shipping from the EU ETS once the NZF comes into effect.
The IMO has created the NZF to attempt to incentivize the adoption of lower carbon fuels, but it is apparent that based on the proposed cost of RUs, the annual reduction factors and the current and projected prices for fuel, the NZF in its present form does not provide an incentive for investing in greener fuels. This may change for zero and near-zero carbon fuels once the price of the Reward Units is set and following the adjustment in cost of the RUs post-2030.
3 .3 Retrofits: On the Path to Decarbonization?
Regulatory pressure from regional (EU) and global (IMO) air emission legislation is the main catalyst for the increased demand in EETs, alternative fuels and onboard carbon capture. While it is generally easier to apply these to new vessels under construction, the long operational life of a vessel, the potential lack of newbuilding capacity and lack of future demand for secondhand vessels may lead to increased demand for retrofits.
As described in the previous section, regulatory measures either aim to reduce TtW emissions or WtW emissions. Multiple options are available for each, depending on a range of factors, such as:
• Vessel type and size
• Vessel age (or remaining time in the fleet)
• Operational profile
• Fleet makeup and overall strategy
EET retrofits, such as ducts, propeller modifications or replacement and air lubrication may increase the efficiency of the vessel, reducing fuel consumption and thus TtW emissions. Similarly, wind propulsion technologies (WPT), such as Flettner rotors, suction wings and rigid sails will also reduce the power required for propulsion, leading to TtW emission reductions.
Converting the vessel to alternative fuels, such as DF LNG, methanol or ammonia will affect the whole of the life-cycle emissions, from production to onboard use and therefore can be used to reduce the WtW emission intensity and potentially comply with FuelEU Maritime and the IMO NZF.
3 .3 .1
Retrofit Analysis
Indicative capex ranges are given in Table 5 for a postpanamax bulk carrier vessel.
Table 5: Approximate capex range for various retrofit options.
3.3.1.1 Dual-Fuel Conversions
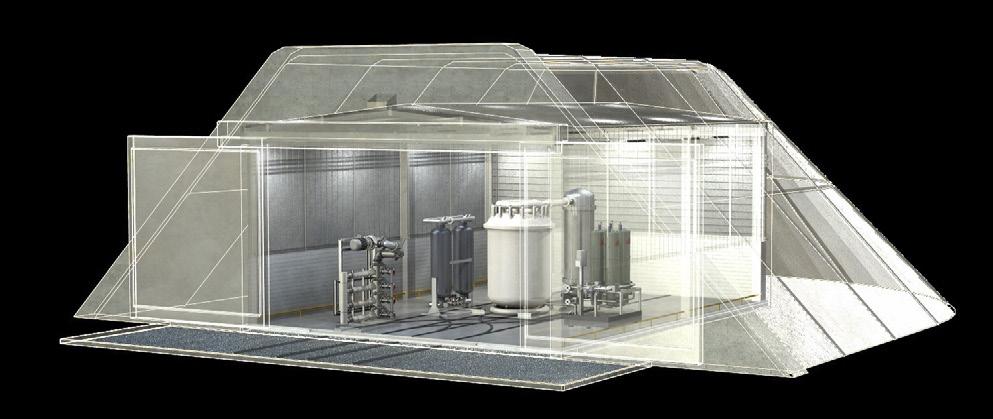
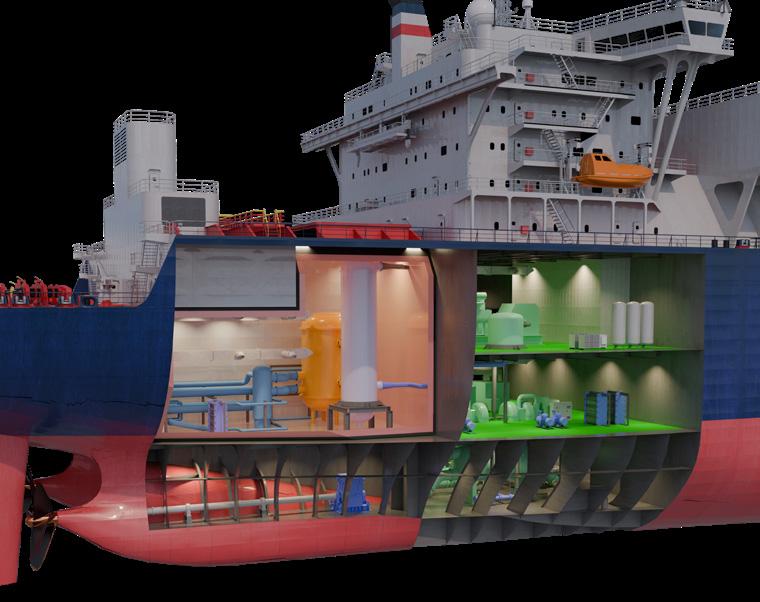
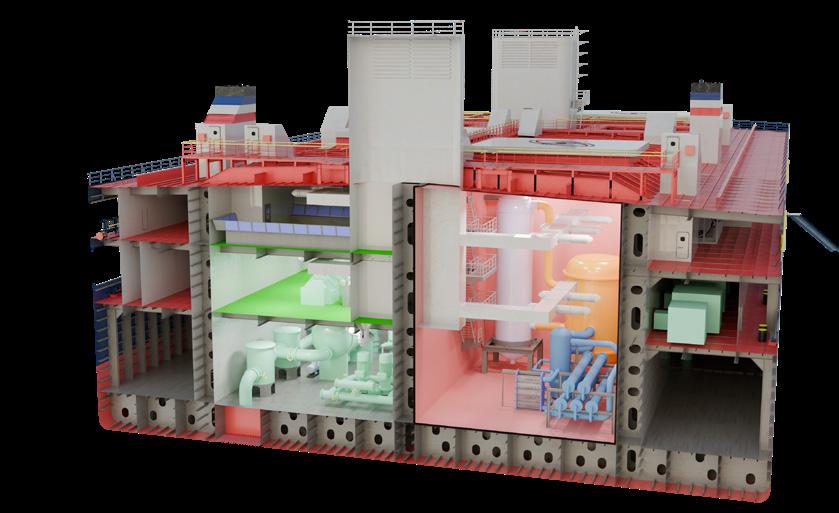
Converting an existing vessel to alternative fuel use (such as LNG, methanol or ammonia) is a costly procedure with a large amount of equipment required to be fitted to the vessel. Figure 29 shows the main items for a DF methanol retrofit.
For the investment to be viable, the additional cost of the conversion and the increased fuel (and other) costs need to be offset by the savings in regulatory compliance costs, where the cost of conversion includes also all the profit loss due to downtime when the vessel is docked for the retrofit operation. Technoeconomic analyses rarely show payback for such an investment, unless conventional fuel costs increase substantially, alternative fuel costs decrease or charter rates for these ships are more attractive, as shown in Figure 28.
System
Figure 29: Typical DF methanol ship.
Fuel Valve Train (GVU)
3.3.1.2 Wind Propulsion Technologies
For WPT, wind is used to supplement the main propulsion system and reduce fuel consumption and the associated emissions. Flettner rotors, wing sails, suction wings and kites can all be used to that effect.
Figure 30 covers the result of one representative technoeconomic analysis of a WPT retrofit, where the
$45,000,000
$40,000,000
$35,000,000
$30,000,000
$25,000,000
$20,000,000
$15,000,000
$10,000,000
$5,000,000
savings from fuel consumption (using the simulation of weather conditions on the expected ship routes) and associated regulatory compliance cost reduction has given a payback of approximately eight years for the system. Depending on the route, vessel type and system type, a potential reduction of 10 to 20 percent in emissions is possible with an associated seven to eight year breakeven point for the investment.
Payback Time: 7.9 years
Figure 30: Cumulative costs and payback time of WPT retrofit.
Base Scenario WPT Retrofit
3.3.1.3 Onboard Carbon Capture and Storage
Onboard carbon capture and storage (OCCS) systems are used to capture CO2 emissions while ships are operating. They require additional energy to capture for the capturing process, leading to a difference in capture rate and an increased operational cost. As such, for the retrofit of an OCCS to be economically desirable, the emissions savings need to be converted into compliance cost savings. The present challenge arises from the lack of clarity in the regulations (FuelEU Maritime, IMO NZF) regarding the inclusion of the savings from OCCS.
By reducing the TtW emissions by the net capture rate factored, the benefit of this technology can be realized and systems become economically viable. Further incentives provided by frameworks such as the IMO Net-Zero Fund to Zero and Near Zero Technologies will support the business case for adopting OCCS on the existing fleet and new constructions.
Figure 31 shows the results of a technoeconomic analysis covering the retrofit of five different OCCSs on a very large crude carrier. One system did not repay the investment required, whereas for the other four, the payback was between five and 17 years.
Figure 31: Discounted payback for five different OCCS systems.
3.3.1.4
Other Retrofits
Other common retrofits include:
• Propeller Ducts
• Propeller Hub Vortex Generator (Boss Cap Fin)
• Rudder Bulbs
Most of these retrofits will provide savings of the order of 1 to 10 percent and as such are mainly considered for existing vessels with a limited remaining useful life. As they only provide moderate savings for TtW emissions, their effectiveness per vessel is limited in terms of global decarbonization, but their low risk due to the short payback (from one to five years in most cases) makes them a first step in the decarbonization strategy for a large number of shipowners.
More costly retrofits such as bulbous bow modifications, propeller replacement and hull air lubrication systems (ALS) have not been adopted in large numbers and in most cases are limited to certain vessel types due to higher value cargo providing higher income and the possibility to pay back the investment in a reasonable timeframe. In addition, for both bulbous bow modifications and propeller replacement, improvements in performance can only be obtained if the vessel’s average speed or draft has been changed compared to the operational profile considered during the design of the hull.
Some of these retrofits, especially if associated with suitable vessel types, sizes and routes, provide higher savings, which will allow longer-term compliance with regulations over the long term.
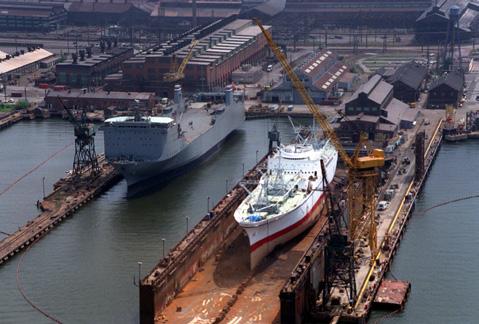
3 3 2 The Case for Retrofits and Shipyard Capacity
The ship repair industry faces a critical question: Can global yard capacity meet the accelerating demand for engine retrofits and EET installations? Both are essential to achieving the targets of maritime decarbonization.
In addition, while shipowners have historically relied on a global network of repair facilities to absorb cyclical peaks, new evidence from market tracking and scenario analysis suggests that yard capacity could become a binding constraint before 2030 [MSI, ABS]. Under the right conditions, this could lengthen lead times, raise costs and shift competitive advantage toward those who act early to secure their slots.
Current investment in retrofits is limited to low-risk, lowcost options that have limited effectiveness in terms of decarbonization and the IMO trajectories. This hesitation is driven mainly by regulatory uncertainty, including:
• It is unclear whether the EU will repeal ETS and FuelEU Maritime by 2028, when the IMO NZF comes into effect.
• The cost of IMO NZF RUs is only set until 2030.
• Lack of clarity on the subsidy value for fuels below 19 gCO2e/MJ up to 2034 (and below 14 gCO2e/MJ after 2035).
For OCCS, a significant breakthrough in the number of retrofits will depend on upcoming regulations to provide mechanisms for considering the CO2 reduction on board. Finally, DF retrofits are expensive and complex, requiring engine, tanks, fuel (gas) supply systems, suitable piping modifications and the safety systems associated with the new alternative fuel selected. Nonetheless, the annual IMO NZF Tier 1 and Tier 2 reduction factors beyond 2035 have not been decided, making it difficult for ship managers to decide on which is the alternative fuel of choice for the retrofit. In most cases, ship managers may prefer to wait and postpone the investment for a DF retrofit or even to sell a vessel and invest in a DF newbuild. Conversely, future lack of availability of new DF tonnage, due to newbuild yard bottlenecks, may force ship managers to undertake these complex retrofits to adhere to the decarbonization trajectory.
3.3.2.1 Workload versus Dry-Dock Time
While EET adoption has surged with over one-third of the fleet now having at least one system installed, yard throughput growth remains moderate. This reflects the fact that many EETs can be installed without extending dry-dock time.
Manufacturers of WPT, for example, report that, with sufficient preparation, installation can be completed in a week outsourcing the task to specialist staff supplied by the manufacturer working along with the yard. Rudder modifications and other common EETs can also be fitted relatively quickly.
As a result, progress in retrofitting certain technologies may be less constrained by yard time than previously assumed. By contrast, complex retrofits (e.g., engine conversions and ALS) require longer stays. ALSs are mainly suited for LNG carriers and ro/ros, while engine retrofits have broader applicability and are central to long-term decarbonization.
3.3.2.2
Geographic Distribution of Retrofit Activity
Overall, the retrofit market is poised for a significant
expansion, driven by regulatory pressure, evolving fuel supply chains and the imperative for decarbonization. In 2022, Chinese yards accounted for just over 56 percent of observed global repair demand; by the first quarter of 2025, that figure had climbed to over 73 percent. No other region has come close to such growth. Europe’s share, for example, fell from nearly 18 percent to 13 percent, while Southeast Asia and the Middle East also ceded ground, as shown in Figure 32, which charts the breakdown by year and region of retrofit activity in gross tonnage per days (gt days) (i.e., the number of days in the facility multiplied by the gt of the vessel). This measure blends vessel size with the time spent in dock, thus giving an accurate representation of throughput, which could not be afforded by a bare vessel count [MSI, ABS].
This shift reflects both the scale and capability of Chinese yards, which have expanded yards to handle a mix of high-volume standard dockings and complex retrofits. For owners, this concentration delivers efficiency and cost benefits but also introduces a singlepoint-of-failure that may be susceptible to geopolitical or operational disruptions.
Figure 32: Regional shares trend [MSI, ABS].
3.3.2.3 Forecasts and Capacity Implications
The forecast for retrofits, still in gt per days, is based upon the following assumptions:
1. Eligible fleet: Vessels built since 2013 with electronically controlled engines.
2. Vessel size thresholds: tankers ≥ 70k dwt ; bulkers ≥ 120k dwt; containerships ≥ 7.6k TEU; Car carriers ≥ 6k CEU ; all ro/ro, ro/pax and Cruise Ships.
3. Oil-fueled vessels from 2025 onward are included.
4. Retrofit demand accelerates post-2030 with the IMO mid-term measures coming into force and peaks in the early 2030s.
5. Newbuild retrofits begin at the first special survey (~2030) and peak in the late 2030s.
6. Average retrofit duration: Indicative averages from tracked projects suggest that full-scope retrofits take around 50 days.
7. The expansion of capacity in China has been accompanied by a sharp fall in activity elsewhere. This suggests that there is a latent capacity of up to 0.6 billion gt/days, and we have accounted for this theoretical max capacity.
Not all retrofits are equal: energy-saving devices such as WPT can often be installed in a week with minimal disruption, while engine conversions or ALSs can add weeks to the schedule.
As more yards globally invest in their retrofit capacities, we can expect to see full project lead times go down from where they are now, at around 18 months, to a goal of about 14 months.
As part of this year’s Outlook publication, two retrofit demand scenarios have been developed (Figure 33).
Scenario 1 — Full Conversion:
This scenario assumes all eligible oil-fueled vessels are converted due to escalating oil costs. It would require yard capacity expansion before 2030.
Scenario 2 — Base Case:
In this scenario, which is deemed the more likely one, around half of the existing eligible tonnage and 80 percent of relevant newbuilds are converted. This would place demand within the range of existing and planned capacity, especially if lead times can be reduced from the current 18 months to a target of 14 months. 0 2,000 4,000 6,000 8,000 10,000
Theoretical Max Capacity
Total Demand (Scenario 1)
Total Demand (Scenario 2)
The steepest climb comes in the late 2020s, as regulatory compliance deadlines, fuel-switch strategies and decarbonization commitments converge. Figures 34 and 35 illustrate the retrofit constraints under the two scenarios investigated.
Figure 33: Total yard demand vs. capacity (2025–2035) [MSI, ABS].
Comparing total yard demand against the theoretical maximum capacity reveals the crunch point. With only modest capacity growth assumed (+1.5 percent per year after 2030), the moderate scenario turns negative in 2029, with a 43 million gt-day shortfall, a gap widening to over 400 million by 2031. In the aggressive retrofitting case, the deficit emerges a year earlier (2028), reaching over 1 billion gt/days by 2030. For owners, this means that the shoulder years just before the deficit (2027 and 2028) will be critical for locking in yard time on favorable terms.
3.3.2.4 Implications for Engine Manufacturers For engine manufacturers, retrofit trends must be
considered alongside alternative fuel newbuild forecasts. Liquefied natural gas DF engine production is already at scale, primarily serving LNG carriers, and as the construction boom in that segment tapers off, production capacity could shift to other vessel types. For methanol and ammonia engines, meeting future demand will require expansion in production capacity. Retrofit forecasts based on Scenario 2 combined with alternative fuel newbuild projections translate directly into engine demand profiles. As one may observe in Figures 36–38, overall, the retrofit market is poised for significant expansion, driven by the imperative for decarbonization and ensuing regulatory pressure and evolving fuel supply chains.
Figure 37: Demand for methanol DF engines [MSI, ABS].
Figure 38: Demand for ammonia DF engines [MSI, ABS].
3 .4 Market Update: Fuels and EETs Adoption
The push toward decarbonization accelerated through 2024 into 2025. Stricter efficiency regulations and fuel costs have spurred unprecedented uptake of alternative fuels in newbuild ordering, alongside a rapid scaling of EET retrofits on in-service ships. Shipping’s green transition has clearly bifurcated into new fuel investments and efficiency enhancements.
3 4 1 Alternative Fuels and Fuel-Ready Newbuilds
The past year set new milestones for alternative fuel adoption. Clarksons’ data shows 50 percent of all tonnage ordered in 2024 was alternative-fuel-capable, an all-time high. In total, 820 vessels, 62.2m gt were contracted with alternative fuel capability in 2024, a record volume. Notably, LNG DF orders surged again (about 70 percent of 2024’s alternative-fueled tonnage),
while methanol-fuel designs, though significant, fell to about 14 percent of that subset (down from about 30 percent the year prior). A smaller number of liquefied petroleum gas (LPG)-fueled ships and even a dozen hydrogen-capable vessels were also ordered, and 25 ammonia-fueled newbuilds were logged, a notable development given that ammonia engines are still in trial stages.
A substantial share of newbuilds are being built with ready fuel notations to hedge against future uncertainty. Approximately 21 percent of tonnage ordered in 2024 (452 ships) carried an alternative-fuel-ready specification. This trend is dominated by ammoniaready and methanol-ready designs: by May 2025 there were about 143 ammonia-ready and 368 methanolready vessels on order indicating owners’ preference to prepare for these fuels even if not immediately adopting them.
The strongest momentum in alternative fuel adoption is seen in gas carriers, vehicle carriers, containerships and cruise ships, which together account for the majority of alternative-fuel-capable orders placed in 2024 and early 2025. By contrast, uptake has remained limited in more traditionally fossil fuel-reliant sectors such as bulk carriers and tankers. Adoption of alternative fuels remains limited in some traditionally fossil-fuel-reliant segments, such as mid-sized bulkers and tankers, many of which continue to be ordered with only fuel-ready
notations rather than full DF capability. In these sectors, owners appear to prioritize long-term flexibility rather than immediate fuel switching. Figure 39 illustrates the orderbook’s alternative fuel mix for the different vessel types in percentage of gt, as of May 2025.
Figure 40 illustrates the DF capable orderbook’s alternative fuel mix for the different vessel types in percentage of vessels, as of May 2025.
Looking ahead, industry projections suggest this momentum will translate into a significantly different fleet composition. Based on the latest data, approximately 18 percent of the global fleet capacity is expected to be alternative-fuel-capable by 2030, up from 8 percent in 2024 and just 2 percent in 2017.
Vessels listed as alternative-fuel-capable are designed or engineered with the necessary specifications, so they can be converted or equipped to run on alternative fuels in the future. Ships classified as alternative-fuelready in the orderbook are delivered fully equipped and prepared to operate using alternative fuels from the outset, as shown in Figures 41 and 42.
The current orderbook for alternative-fuel-ready vessels shows a clear industry focus on methanol and ammonia. An analysis by the number of vessels reveals that methanol is the dominant choice, with methanolready designs accounting for nearly half (49.5 percent) of all ships on order. However, a different picture emerges when viewed by gt, where ammoniaready vessels represent the largest share at 33.6 percent, slightly surpassing methanol-ready vessels (32.8 percent). This data also highlights a significant investment in fuel flexibility, as a substantial portion of the orderbook, particularly by tonnage (17.2 percent), is being designed for readiness in both ammonia and methanol.
A deeper analysis of the orderbook, visualized in these figures, reveals that the choice of future fuel is not a monolithic decision but a highly strategic, segment-specific calculation. Figures 41 and 42
clearly show that different vessel types are placing fundamentally different weights on future fuel adoption. Methanol-ready emerges as the versatile workhorse, demonstrating the broadest appeal across multiple segments; it constitutes a significant portion of the orderbook for bulkers and is the dominant choice for tankers and general cargo when viewed by number of vessels. In contrast, ammonia-ready is the decisive choice for specialized fleets, overwhelmingly dominating the orderbooks for LPG carriers and pure car carriers (PCCs), where its specific properties or energy density are highly valued. The containership segment, a bellwether for global trade, showcases massive investment in gt for both methanol-ready and ammonia-ready designs, alongside a substantial commitment to dual-readiness (ammonia-ready and methanol-ready), perfectly illustrating the industry's high-stakes hedging against the uncertainty of which fuel will ultimately prevail in global logistics.
3 .4 .2 Adoption of Energy Efficiency Technologies
At the same time, there has been a major expansion in EET adoption throughout the fleet. As of May 2025, over 10,360 ships accounting for more than 37 percent of the world fleet tonnage are now fitted with EETs. This represents a sharp rise in just one year (compared to 33 percent of gt a year ago) and underscores how rapidly efficiency measures are being scaled up.
Newbuild vessels continue to be delivered with optimized designs (the share of the fleet equipped with eco high-efficiency engines has climbed above 34 percent), but, critically, retrofits on existing ships have accelerated to bridge the gap on emissions. With the average ship age now at around 13 years and over one-third of capacity falling into the lowest CII ratings (D or E), owners have turned to retrofitting devices like propulsion-improvement ducts, low-friction hull coatings, and waste heat recovery systems to boost the performance of in-service tonnage, as discussed in the previous section.
Tracking reports significant growth in novel tech uptake as well: for instance, more than 580 ships are now using air lubrication systems and at least 145 vessels have WPT installations (e.g., rotor sails or kites) either operational or on order. Figure 43 illustrates these points.
Such growing maturity is evident in several recent retrofit projects that have helped derisk operational performance and demonstrate commercial viability. For instance, Maersk Halifax was successfully retrofitted for methanol propulsion in 2024, proving the feasibility of alternative fuel upgrades on large commercial vessels. Battery-hybridization initiatives have also gained momentum, with AYK Energy deploying largescale battery retrofits on feeder vessels in East Asia. These pilots illustrate how technological collaboration
between owners, shipyards and equipment providers is translating into scalable efficiency gains. Cross-sectoral validation of EET performance especially under real operating conditions is proving critical to broader adoption.
Rudder Bulb
Stator Fin
Propeller Duct PBCF
Rudder Fin Bow Enhancement Hull Fin Air Lubrication System
Figure 43: EET adoption across vessel segments [Clarksons Research].
As shown in Tables 6 and 7, different vessel segments display varying levels of EET adoption, with some segments focused on retrofitting existing ships, such as bulk carriers, while others, like containerships and gas carriers, are increasingly integrating EETs during newbuild construction.
Furthermore, in general, older tonnage sees frequent installations of EETs during repair drydock, while newer ships tend to incorporate multiple efficiency features from the design stage. The deployment of EETs has become a mainstream strategy for shipowners to reduce fuel consumption and meet interim decarbonization targets on existing assets.
Table 6: EET adoption in
3 .4 .3 Readiness Gap in the Existing Fleet
While newbuild orders are shifting toward greener designs, the vast majority of the current global fleet remains reliant on conventional fuels. As of May 2025, only around 2 percent of all active vessels are classified as DF capable or alternative-fuel-ready. This includes 186 LNG-ready ships, 121 ammonia-ready, and 311 methanol-ready vessels, out of a total fleet
exceeding 27,100 ships. The remaining 98 percent of the fleet continues to rely on conventional fuels like heavy fuel oil, marine gas oil and VLSFO.
Given the long asset lifespan and relatively low turnover rate of commercial vessels, a parallel strategy that advances both new fuel adoption and immediate EET retrofits is essential to meeting near-term emissions targets.
Tankers
Bulkers
Total Gas (LPG/LNG)
Containerships
MPP
Reefer
Ro/ro
Vehicle Carriers
General Cargo
Passenger Ferries
Cruise Ships
Figure 44: Existing fleet alternative fuel adoption by number of vessels — May 2025 [Clarksons Research].
As shown in Figure 44, adoption of alternative fuels remains highly uneven across vessel segments. The highest rates of DF adoption are observed in gas carriers (32 percent), vehicle carriers (11 percent), and cruise ships (11 percent), reflecting early alignment with LNG and methanol technologies in these sectors. By contrast, containerships show only about 3 percent DF
penetration, and bulkers and tankers remain under 2 percent. This underscores a core challenge for maritime decarbonization: although newbuild ordering trends are shifting, the vast majority of the existing fleet continues to rely on conventional fuels, reinforcing the urgent need for near-term energy efficiency retrofits.
Alternative Fuels Conventional Fuels
4
THE FUTURE OF FUELS — WHAT WILL POWER SHIPPING?
4 .1 . The Hurdles to Adoption: Safety, Availability, Affordability
The maritime industry's decarbonization hinges on navigating three critical hurdles for alternative fuels: safety, availability and affordability. The challenges they present are significant but not insurmountable.
4 .1 .1 Safety: A Solvable Challenge Demanding New Competencies
While safety is a non-negotiable prerequisite, the associated risks for alternative fuels are manageable through a combination of engineering and operation. The industry is actively developing the necessary solutions, but this will require a fundamental upskilling of crew and a zero-tolerance approach to operational drift.
The safety landscape varies dramatically by fuel. For some, the path is an extension of current best practices. For others, it is a leap into a new territory.
• Manageable Risks with Existing Protocols: Biofuels, specifically hydrotreated vegetable oil (HVO) and methanol represent the most straightforward safety transition. Hydrotreated vegetable oil, is a near drop-in solution with a safety profile comparable to conventional diesel. Methanol, while toxic and flammable, can be handled safely using established protocols from the chemical industry. The solutions, including
specialized personal protective equipment (PPE), advanced fire suppression and double-walled piping, are well understood and are already being implemented on the first generation of methanolfueled vessels. Similarly, liquefied natural gas (LNG) has a mature safety record governed by the International Code of Safety for Ships Using Gases or Other Low-flashpoint Fuels (IGF Code).
• High-Consequence Risks Requiring New Solutions: Ammonia and hydrogen present a significantly higher risk profile that demands purpose-built solutions.
• For ammonia, the primary concern is toxicity. Its lethality at low concentrations requires a paradigm shift in containment and emergency response. The industry is responding with innovations like unattended machinery spaces, advanced sensor networks for leak detection, and comprehensive training modules centered on the use of full protective suits and breathing apparatus. Additionally, ammonia is highly corrosive.
high-pressure state. Its wide flammability range and low ignition energy necessitate sophisticated engineering solutions, such as advanced leak detection, inerting systems and robust tank designs. Stringent operational procedures, currently under development by class societies and the International Maritime Organization (IMO), are key to mitigating these risks.
• Heightened Risks for Nuclear: Nuclear propulsion stands apart, with a strong naval safety record but immense hurdles for commercial adoption. While modern reactor designs offer inherent safety features, the challenges of waste management and nonproliferation require an international consensus that has not been reached yet.
Each fuel's safety profile dictates the level of investment and crew competency required. Notwithstanding, the industry is not waiting, but it is actively building the tools and rules to manage these risks, as detailed in Table 8.
• Stringent containment, advanced gas detection, dedicated ventilation, selfcontained breathing apparatus (SCBA), full protective suits, unattended machinery space per Automatic Centralized Control Unmanned (ACCU) notation
• Multiple safety layers in modern designs, robust containment
• Strict international safeguards and controls
• Public education, transparent regulations
Table 8: Safety constraints and industry mitigation efforts.
4 .1 .2 . Availability: The Green Production Bottleneck
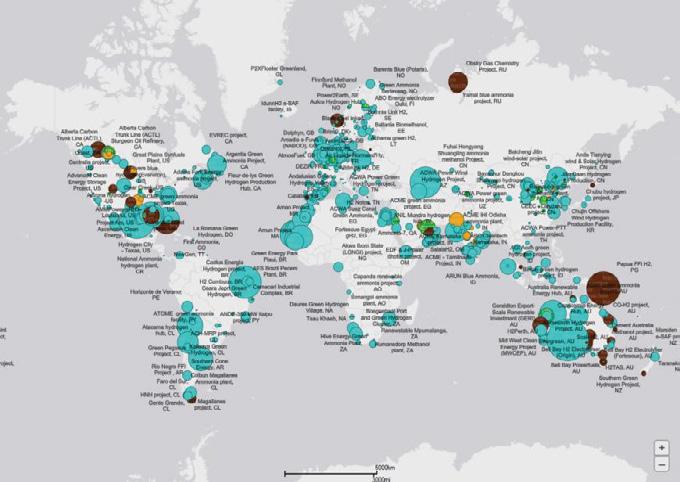
The most significant barrier to the green transition is that sustainable alternative fuels are not yet produced anywhere near the scale required. While fossil LNG has a developed infrastructure, the green versions of methanol, ammonia and hydrogen are in their infancy. This is not a fuel problem; it is a green energy and infrastructure problem.
The core of the availability challenge is a dependency on two limited resources: massive quantities of renewable electricity and a sustainable supply of feedstocks (biomass or captured carbon dioxide [CO2]).
• The E-Fuel Challenge: The production of green methanol, green ammonia and green hydrogen is critically dependent on a massive expansion of renewable energy to power electrolyzers. The industry’s message is clear: shipping cannot decarbonize in a vacuum. The availability of these fuels is directly tied to the global energy transition. Currently, production is limited to pilot projects, and competition for green electricity and hydrogen from other sectors (e.g., steel, aviation, road transport) will further constrain supply.
• The Biofuel Challenge: For biofuels, the constraint is not technology but the finite and contentious supply of sustainable feedstocks. While advanced biofuels can be a key part of the solution, there is simply not enough sustainable biomass or waste oil globally to power the entire maritime sector without creating negative consequences such as indirect land-use change (ILUC) or impacting food security. The industry is focused on developing robust certification schemes to ensure the feedstock is genuinely sustainable.
The industry is signaling its demand through vessel orders and pilot programs, but bridging this availability gap requires unprecedented investment in new global supply chains and bunkering infrastructure, a task far beyond the scope of shipping alone.
The Green Premium Barrier
Green fuels are currently far more expensive than conventional fuels, and market forces alone may be insufficient to bridge this gap. The cost disparity is a universal hurdle. Compared to very low sulfur fuel oil (VLSFO), green fuels carry a significant price premium:
• Biofuels: 1.5–3 times higher
• Green Methanol: 2–4 times higher
• Green Ammonia and Hydrogen: 3–8 times (or more) higher
This premium is driven by the high cost of renewable electricity, capital-intensive production facilities (e.g., electrolyzers) and competition for limited sustainable feedstock. Affordability issues represent the financial counterpart of availability challenges. Additionally, alternative fuels such as LNG, ammonia and hydrogen feature low volumetric energy density, which implies large tanks and reduced cargo space, further chipping away at the vessel's profitability.
Technological innovation in production processes and engine efficiency will help reduce costs over time. However, the industry's unified message is that closing the price gap requires strong regulatory and economic drivers. These include:
• A global carbon price (such as attained annual greenhouse gas [GHG] fuel intensity suggested by Marine Environmental Protection Committee [MEPC] 83) to make fossil fuels more expensive.
• Mandates and subsidies (like the EU's FuelEU Maritime) to guarantee demand for green fuels.
• Book and claim systems to allow the cost of green fuels to be shared across the value chain.
However, this "green premium" is not static. It is currently prohibitive for widespread adoption of green fuels, but there are fundamental dynamics which, if implemented, will cause it to fall significantly, particularly for e-fuels. Two key factors may drive down the cost of green hydrogen, the foundational building block for e-ammonia and e-methanol:
1. Exploiting Low-Cost, Unfirmed Renewable Energy: The cost of renewable energy per se from wind and solar, which is required for the production of e-fuels, is now competitive with, and often lower than, fossil energy. The primary factor making it expensive for the grid is the firming cost of providing backup power (e.g., from gas plants) or large-scale battery storage to guarantee 24/7 electricity, which is the main argument hindering large scale installations. Nonetheless, green fuel production does not require this expensive, firming power. E-fuel plants can operate opportunistically, using renewable energy when it is abundant and cheap (e.g., midday for solar, windy nights for wind turbines). The fuel itself, be it hydrogen, ammonia, or methanol, becomes the energy storage, effectively decoupling its production from real-time grid demand and allowing it to capitalize on the lowest-cost electricity.
2. Economies of Scale in Electrolyzer Production: The capital cost of electrolyzers (Balcombe et al., 2025), a major component of the final fuel price, is set to decrease as production scales up. Even excluding a learning curve in electrolyzer development, economies of scale due to size and power of electrolyzer alone reduce the cost of electrolyzer plants. As shown in Figures 45 and 46, the industry is on the cusp of a dramatic shift in scale — Alkaline Electrolysis (AEL); Proton Exchange Membrane Electrolysis (PEMEL); Solid Oxide Electrolyzer Cell (SOEC).
Announced Projects Projections
Figure 45: Cumulative capacity of modern hydrogen electrolyzers. Note: Historical data from (Buttler et al., 2018) and (IEA, 2020), and future trajectories from (Aurora Energy Research, 2021) and the ETC (8, 11). Projections are from different organizations, so lower capacity in 2040 is due to different assumptions rather than indicating capacity falls after 2035.
Figure 46: Size of individual electrolysis plants. Note: Data from (IEA, 2020) and (Aurora Energy Research, 2021).
Methanol Ammonia Hydrogen Biofuels LNG Nuclear
Figure 47: Comparative rating of alternative fuel constraints.
Note: A higher score (closer to 5) indicates a greater challenge or a more significant constraint. A lower score (closer to 1) signifies a lower degree of constraint.
4 1 4 A Comparative Outlook: Visualizing Fuel Constraints
Figure 47 synthesizes these complex trade-offs to clarify why there is no single silver bullet solution. It immediately reveals three distinct fuel groupings based on their constraint profiles:
• The Medium- and Long-Term Contenders (Ammonia, Hydrogen, Nuclear): These fuels are characterized by large, spiky polygons that extend far out on nearly every axis. They score high on safety, affordability and availability, which underscores their nascent state in the global supply chain. Their promise lies in their long-term potential.
• The Pragmatic, Near-Term Options (Methanol, Biofuels): In stark contrast, methanol and biofuels
display smaller, more contained polygons. They score low on safety and regulatory/tech but high on affordability.
• The Mature Fuel (LNG): LNG has a unique profile that illustrates its role as a bridging fuel. Its primary constraint is identified as the scalability of its green pathway, reflecting the significant challenge and cost of producing sufficient quantities of bio-LNG or e-LNG.
The chart illustrates that while long-term solutions like ammonia and hydrogen hold great promise, the immediate transition is being enabled by more balanced, lower-risk options like LNG, methanol and biofuel blends.
4 .2 The State of the Transition: Fleet, Orderbook, and Future Projections
Having established the critical, the next logical step is to quantify the industry's current state of adoption and the projected future pathway. In order to provide a comprehensive picture, the analysis will consider the present uptake by both the number of vessels and, more critically, by gross tonnage (gt), as this dual approach reveals not only the pace of change but also the scale of capital investment flowing into new energy solutions.
4 2 1 Alternative Fuels Uptake for the Existing Fleet
While the future of maritime energy is a landscape of complex choices, the current reality of the global fleet underscores the sheer scale of the challenge ahead. The breakdown by gt clearly shows that segments with the largest, most modern, and most expensive ships have been the earliest adopters.
• Gas Carriers Lead the Way (62.8 percent): This segment is in a class of its own. With nearly two-
thirds of its entire tonnage capable of using its own cargo (LNG or liquefied petroleum gas [LPG]) as fuel, it represents the most mature alternative fuel market in shipping.
• Public-Facing Sectors Follow Suit: The cruise ship (16.4 percent) and vehicle carrier (14.3 percent) segments show significant uptake by tonnage. These high-value, public-facing vessels have been prime candidates for investment in cleaner technologies due to brand reputation, customer expectations, and operational profiles that often include fixed routes and emission control areas (ECAs).
• The Workhorses Remain on the Sidelines: In stark contrast, the segments that carry the bulk of the world's raw materials, bulkers (1.2 percent) and tankers (2.5 percent), show minimal penetration. The immense volume of their conventionally fueled tonnage dwarfs the initial steps taken, and this lag is a direct reflection of fragmented ownership and unpredictable "tramp" trading patterns.
Signals are pointing in different directions .
Orderbooks are diversifying, with LNG dominating and methanol and ammonia on the rise. Energy efficiency technologies and onboard carbon capture systems are advancing. However, ports remain underprepared with approximately 5 percent having active alternative fuel bunkering, and yard capacity is projected to turn negative from 2028 to 2030, risking stranded compliance plans. This divergence — regulations tightening faster than fuels, infrastructure and shipyards can keep up — defines the current risk.
Tankers
Bulkers
Total Gas (LPG and LNG) Containerships
MPP
Reefer
Ro/ro
Vehicle Carriers
General Cargo
Passenger Ferries
Cruise Ships
Fuels
Tankers
Bulkers
Total Gas (LPG and LNG) Containerships
MPP
Reefer
Ro/ro
Vehicle Carriers
General Cargo
Passenger Ferries
Cruise Ships Alternative Fuels
While the containership segment shows a low adoption rate of 3.4 percent by vessel number, this figure masks the significant investment underway. In absolute numbers, containerships represent the second-largest group of alternative-fueled vessels by number of vessels (234), driven by major carriers investing heavily in dualfuel (DF) tonnage. This sector is a key battleground where LNG is now being challenged by the first wave of methanol-fueled newbuilds (23 vessels), signaling the beginning of a broader fuel diversification.
The story of the current alternative-fueled fleet is, by and large, the story of LNG. Of the 130 million (m) gt
of alternative-fueled tonnage currently in operation, an overwhelming 111m gt is LNG-capable. This dominance reflects LNG's status as the most technologically mature and commercially available alternative fuel over the last decade. Other options, such as methanol (3.1m gt), have a foothold, but emerging zero-carbon fuels like hydrogen and ammonia have a negligible presence in the existing fleet by tonnage.
In summary, the transition has been concentrated in niche segments and centered on a single fuel. This sets a clear baseline from which to measure the diversification and acceleration now evident in the global orderbook.
Figure 48: Alternative fuel uptake in the existing global fleet by number of vessels [Clarksons Research].
Figure 49: Alternative fuel uptake in the existing global fleet by gt [Clarksons Research].
If the current fleet represents the starting line of the energy transition, the global orderbook for new vessels provides a clear and powerful signal of the acceleration to come. This is not a gradual evolution; it is a stepchange in investment and intent, demonstrating that shipowners are committing billions of dollars to a multifuel future.
The data shows that early-adopter segments are cementing their leadership while, crucially, the largest shipping segments are now making significant commitments.
• Market-wide Commitment: The most striking trend is the massive uptake in key sectors. Vehicle carriers and gas carriers have made alternative fuels the default choice for newbuilds.
• The Containership Revolution: Perhaps the most significant indicator of a systemic shift is in the containership sector. With 61.8 percent of the orderbook by vessel number dedicated to alternative fuels (up from just 3.4 percent of the current fleet), the world’s largest carriers are fundamentally reengineering their fleets for a low-carbon future.
• The Workhorses Begin to Turn: The gt metric tells a much more optimistic story for the core of the global fleet. While modest by vessel count, tankers (14.1 percent) and bulkers (13.1 percent) are committing significant tonnage. This represents nearly 16m gt combined, proving that owners of these large vessels are now actively investing in DF technology to hedge against future regulations and fuel prices.
While LNG remains the dominant alternative fuel on order with 1,028 vessels, the orderbook tells a story of increasing fuel diversification.
• Methanol Emerges as a Major Contender: The most significant new trend is the rapid rise of methanol, with 303 vessels on order. This represents a nearly six-fold increase over the existing methanol fleet and establishes it as the clear second choice after LNG, particularly in the container and tanker segments. This validates the industry's view that its manageable safety profile and clearer pathway to "green" production make it a highly attractive option.
• Ammonia and Hydrogen Move from Theory to Reality: For the first time, true zero-carbon fuels are appearing on the commercial orderbook in meaningful numbers. With 40 vessels slated to be ammonia-fueled and 25 designed for hydrogen, the industry is moving beyond pilot projects. These orders, though small, are critical proof points that de-risk the technology and signal growing confidence in their long-term viability.
In conclusion, the orderbook provides a forecast of tomorrow’s fleet, and that forecast is fundamentally different from the fleet of today. It confirms that the transition is accelerating, expanding beyond niche markets, and diversifying away from a single-fuel solution.
and LNG)
Figure 50: Alternative fuel uptake in the orderbook by number of vessels [Clarksons Research].
Figure 51: Alternative fuel uptake in the orderbook by gt [Clarksons Research].
Looking forward, the maritime industry is poised for a fundamental transformation of its energy landscape. Figure 52 provides a demand-based forecast of the fuel mix through 2050, which represents the percentage of energy generated by each fuel per year, assuming all vessels with alternative fuel capability burn exclusively
the alternative fuel (e.g., LNG/heavy fuel oil (HFO) DF vessels burn only LNG, ammonia DF vessels burn only ammonia), as exemplified in Figure 53. Because the forecast is demand-based, it tends to reflect an early adoption of new fuels ahead of actual market conditions, typically some years before supply of new fuels can meet their demand.
52: Demand-based fuel mix [MSI, ABS].
Forecast of Yearly Newbuilds and Scrapped Vessels per Ship Type
Engine Type (Fuel) Share for Newbuilds in each Ship Segment
Forecast of Fleet on the Water
Share of Fuel Type on the Water per Ship Segment — Only Alternative Fuel for Dual-Fueled Ships
Forecast of Seaborne Trade per Year per Ship Segment
Energy Demand Forecast per Ship Segment
Figure
Figure 53: Forecasting methodology [MSI, ABS].
The fuel evolution unfolds in distinct phases:
• The Transitional Phase (Present–2030): Through the mid-2020s, the primary shift is the growing demand for fossil LNG, reflecting the current orderbook. This is supplemented by the increasing use of drop-in bio/e-diesel to reduce the carbon intensity of the existing oil-fueled fleet.
• The Acceleration and Diversification Phase (2030–2040): This decade marks a dramatic acceleration away from fossil oil. The model projects a significant ramp-up in demand for methanol followed closely by ammonia. This projected demand for fuels like ammonia in the early 2030s precedes their widespread availability; it acts as the critical market signal that vessels capable of burning these fuels will be entering the fleet, anticipating that the supply chain will be ready between 2035 and 2040. During this period, bio/e-LNG also begins to displace its fossil counterpart, greening the LNG supply.
• The New Fuel Era (2040–2050): By 2040 and beyond, the energy landscape is fundamentally transformed. Fossil oil is reduced to a minority share. Ammonia emerges as the largest source of fuel demand, indicative of its anticipated role as the primary zero-carbon fuel for deep-sea shipping. Methanol maintains a substantial share, solidifying its
position as a key alternative. The overall mix is highly fragmented, with LNG, LPG, biofuels and even small shares for nuclear and hydrogen creating a true multifuel ecosystem.
Ultimately, this demand-based forecast serves as a critical strategic tool. It translates fleet renewal and engine technology choices into a tangible demand curve for future fuels. For shipyards, it signals the types of engines that will be ordered. For fuel producers and infrastructure developers, it quantifies the scale and timing of the market opportunity, providing the confidence needed to make the multi-billion-dollar investments required to build the global supply chains for fuels like methanol and ammonia.
This shift in fuel is accompanied by a fundamental change in the composition of the global fleet and its energy consumption patterns, as shown in Figure 54.
Historically, fuel consumption has been more evenly distributed among tankers, bulkers and containerships. However, the forecast shows the containership segment is becoming the dominant consumer of marine fuel. This is partly driven by a projected decline in the tanker and bulker fleets, the former being determined by a forecast reduction in trade in fossil fuels. Notably, the
Figure 54: Fuel consumption by ship
chart also reveals that total fuel consumption does not grow indefinitely. It is projected to peak around 2030 before stabilizing and then gradually decrease through 2050. This leveling-off, even amidst underlying fleet growth, is attributed to the widespread adoption and compounding impact of energy efficiency technologies (EETs) across the global fleet.
The projected changes in fuel and fleet composition have a direct and profound impact on the industry's total Well-to-Wake greenhouse gas (GHG) emissions (Figures 55 and 56).
Figure 55: GHG emissions by ship type [MSI, ABS].
Figure 56: GHG emissions by fuel [MSI, ABS].
Ro/pax Other Cargo Gas Carriers Containership Bulker Tanker
4 .3 . Wind Propulsion Technologies for Marine Decarbonization: A relic of the past or the future of ship propulsion?
In an age where reducing emissions and operational costs is critical, wind propulsion technologies (WPT) offer a practical solution for the maritime industry. Blending modern engineering with the timeless principle of harnessing wind power, this technology addresses both environmental and economic challenges. Integrating systems like rotor sails or rigid wings can significantly cut fuel consumption, lower carbon footprints and assist vessels in navigating increasingly tightening environmental regulations by drawing on wind’s vast energy potential.
Wind propulsion technologies harnesses wind energy to generate forward thrust, reducing reliance on traditional engines and supporting decarbonization. Key systems include:
• Flettner Rotors: Cylinders rotated to exploit the Magnus effect, creating thrust perpendicular to wind direction.
• Sails: Adjustable structures (rigid or soft) that function like aircraft wings, generating lift by optimizing their angle to the wind.
• Suction Wings: Rigid wings with blunt body profile, which achieve high thrust by active boundary layer control through fans.
• Towing Kites: Tethered, automated kites deployed at high altitudes to harness stronger winds, producing forward thrust through an oscillatory motion. Their height and position are dynamically adjusted to maximize pulling force.
By aligning wind-derived forces with the vessel’s direction, these systems partially or fully propel ships. This allows vessels to either reduce engine power (lowering fuel consumption and emissions) while maintaining speed or increase speed at constant engine output. Such technologies offer a scalable pathway to cut maritime carbon footprints, leveraging renewable wind energy to enhance operational efficiency.
The global maritime sector is witnessing a profound upsurge in the adoption of WPT, propelled by a confluence of regulatory mandates, economic imperatives, and technological validation. This growth trajectory reflects the industry’s strategic alignment with decarbonization objectives while addressing operational cost challenges:
• Surge in Retrofit and Newbuild Installations
The current orderbook for vessels equipped with WPT stands at 80 units, a figure that more than doubles the number of WPT-fitted vessels under five years of age (36 units). This exponential growth underscores a paradigm shift, as shipowners increasingly prioritize retrofitting existing fleets and integrating WPT into newbuild designs. The momentum signals robust confidence in wind propulsion as a mid-term solution to reduce fuel consumption and emissions, in part fueled by alternative green fuels being in developmental or costly phases.
• Regulatory Frameworks and Economic Incentives
Stringent environmental regulations and evolving market dynamics are accelerating WPT adoption. Key drivers include:
• FuelEU Maritime/IMO GFI: These regulations’ phased emissions reduction targets compel operators to adopt EETs or face penalties, positioning WPT as a viable compliance tool.
• Details of WPT energy contribution incorporation in the IMO GFI are currently under
development, while proposals from bodies such as the International Windship Association (IWSA) are being assessed.
• FuelEU Maritime regulation incorporates savings from wind propulsion through a reward factor. A vessel with 15 percent or more estimated power savings due to the installation of WPT benefits from a 5 percent reduction in its GHG intensity. In practical terms, such a conventionally powered vessel burning typical LFO is expected to remain compliant with the FuelEU Maritime regulation until 2030 without further investments in alternative fuel technologies.
• EU ETS Integration: The inclusion of shipping in the EU ETS has elevated carbon pricing risks, incentivizing investments in emission-reducing technologies to mitigate rising operational costs.
• Green Fuel Premiums: Prohibitive pricing and limited availability of low-carbon fuels (e.g., ammonia, methanol) have amplified the appeal of WPT, which deliver immediate fuel savings without requiring fuel infrastructure overhauls.
• Proven Viability and Industry Confidence
Early adopters of WPT have demonstrated tangible operational benefits, including fuel savings of 10 to 20 percent and corresponding emission reductions. These successes dispel historical skepticism, fostering broader acceptance among shipowners, charterers, and financiers. With the successful implementation of many full-scale deployments, WPT are increasingly viewed not as a niche solution but as a cornerstone of sustainable shipping strategies.
Wind propulsion technologies performance is highly dependent on wind direction and speed. Rotors and wing sails achieve peak efficiency at sidewinds, leveraging lift forces. Towing kites, operating at high altitudes (150–400 m), excel in downwind conditions but lose efficiency at high vessel speeds. Balancing WPT benefits with wave resistance and safety risks (stability, structural stress) during high winds is critical.
Installation on ocean-going vessels (e.g., Atlanticcrossing and east-west bound vessels) allows for increased exploitation of the global wind potential, as opposed to vessels on short, near-shore routes. Different routes will yield different outcomes; a recent study by
ABS, simulating the performance of vessels with WPT on various routes around a whole year, found that a route from South America to the far east led to gains in daily fuel consumption around 60 percent higher than a route from South America to the U.S. West Coast. Furthermore, retrofit installations risk thrust losses due to interactions between WPT units and obstructions, while newbuilds require holistic design integration to maximize wind gains.
Nevertheless, the rapid adoption of WPT has provided valuable experience to all stakeholders; from shipyards to vendors, consultants and engineering firms preparing and supervising retrofits.
Cruise/Passenger
In Service On Order In Service In Service On Order In Service On Order In Service On Order In Service On Order In Service On Order In Service On Order In Service On Order
Figure 57: WPT adoption per ship type [Clarksons Research].
Chasing the wind: Paradigm shifts in navigation where vessels adjust routes to exploit favorable wind conditions can substantially increase utilization factor of WPT. The most critical aspect, however, is to combine maximum efficiency gains with vessel safety.
Image courtesy of bound4blue
4 .4 . Battery-Electric Shipping Feasibility: Can It be Scaled Beyond Short-Sea Transport?
The maritime industry is undergoing a pivotal transformation driven by the need to accelerate its need to decarbonize and the sector is exploring innovative sustainable propulsion technologies. Among these, battery-electric and hybrid systems emerge as viable transformative solutions not only for short-sea but increasingly for long-haul, deep-sea operations.
The adoption of battery systems in the maritime industry is due to three primary motivations (CIMAC and Maritime Battery Forum, 2024):
1. Redundancy and Safety: Batteries provide backup power and enhance system reliability.
2. Operational Efficiency: Load balancing, peak shaving and optimized fuel use that reduces operational costs by up to 15 percent.
3. Environmental Impact: Battery-electric systems can reduce GHG emissions by 20 to 30 percent in hybrid configurations and up to 100 percent in allelectric modes for short voyages. In addition, other environmental benefits are the significant reductions in radiated noise and particulate matter.
Each motivation influences the selection of battery technology and methods of integration into the vessel’s power and distribution plant. Figures 59 and 60 show the number of battery installations on board deep-sea ships by category.
Figure 59: Yearly installations of batteries by deep-sea ship category [Maritime Battery Forum, Ship Register].
Figure 60: Total installations of batteries by deep-sea ship category [Maritime Battery Forum, Ship Register].
4 4 1 Benefits and Challenges of Electrification
Electrifying vessels is crucial for the maritime and offshore industries in achieving established climate goals within the specified time limits set by the various government agencies and regulatory bodies. Despite uncertainties surrounding technologies used in batteries and battery energy storage systems (BESS), electrification is one of the most viable and effective solutions for climate measures in the maritime and offshore sectors, offering substantial potential for rapid deployment, technological advancements and environmental benefits, including those needed for long-
haul, deep-sea shipping. Furthermore, electrification plays a vital role in supporting all other technologies that are being developed and implemented in maritime transport, from new fuels to wind power and new nuclear technologies.
Figures 61 and 62 show installed battery capacity per year and the cumulative capacity installed on board deep-sea ships by category, which gives a clear indication that battery systems are considered as a growing solution in long-haul voyages.
Figure 61: Installed battery capacity per year on deep-sea ships by category [Maritime Battery Forum, Ship Register].
Figure 62: Total installed battery capacity on deep-sea ships by category [Maritime Battery Forum, Ship Register].
Hybrid electric power systems improve safety and reliability and reduce fuel consumption, environmental footprint and equipment maintenance compared to traditional electrical power systems, along with supporting implementation of new fuel technologies. Battery-electric systems in maritime shipping confer many advantages and tangible benefits, not only for vessels but also for ports, port cities, and the maritime industry at large, significantly mitigating air pollutants and GHG emissions. Battery energy storage systems support supports lowering maintenance costs, increasing fuel efficiency, reducing radiated noise and improving electrical load management, while aiding with regulatory compliance. In addition, and despite the diversity of vessel types and operational profiles, several patterns are emerging for the electrification of vessels using battery technologies:
1. Scalability: Modular battery systems allow for scalable integration across vessel classes.
2. Load Stability: Load-following strategies improve fuel efficiency and reduce emissions during variable power demand phases.
3. Onshore Power Supply (OPS): The adoption of OPS, also known as cold ironing, is accelerating in ports with strong regulatory frameworks and infrastructure investment.
Electrification within the maritime and offshore industry encounters significant challenges within a complex interplay of technical, economic and regulatory factors.
These include the selection of proper battery units for the application, considering their chemistry, adequate space for installation, battery weight affecting cargo capacity, charge capacity, C rate and integration complexity while adhering to evolving rules and regulations. Battery technology must provide a high energy supply, extended discharge rates and reduced associated known risks while simplifying the navigation of regulations from classification societies and flag States to ease its implementation in long-haul voyages.
Figure 63: Number of newbuilds vs. retrofits using batteries delivered per year [Maritime Battery Forum, Ship Register].
The technical viability of battery systems for long-haul deep-sea hinges on energy density and weight tradeoffs. Current lithium-ion marine batteries offer energy densities of 0.25–0.3 MWh/m³. For a 10,000 km voyage requiring 20 MWh/day over 20 days, a vessel would need 400 MWh of storage, equating to 1,600 m³ of battery volume. Assuming 6 kg/kWh, the battery mass would be 2,400 tons, potentially reducing dwt by
5–10 percent depending on the vessel type and size. Hence, while batteries present a viable technical and practical solution for long-haul deep-sea voyages, economic considerations pose significant challenges. Additionally, the deep-sea sector encompasses a diverse array of shipping segments, complicating the generalization of currently available specific battery technologies. Even though some commonalities exist between the shipping sectors, developing compelling business cases for each sector is still a formidable task.
Deep-Sea Vessels
Vessels for O shore Activities
Hybrid Plug-in Hybrid Pure Electric
Figure 64: Percentage of deep-sea vessels by technology [Maritime Battery Forum, Ship Register].
Figure 65: Percentage of newbuild vs. retrofits of batteries delivered [Maritime Battery Forum, Ship Register].
Figure 66: Percentage of newbuild vs. retrofits of batteries delivered by operation [Maritime Battery Forum, Ship Register]. 12.8%
4 .4 .3 . Operational Profiles
and Regional Preferences
Another key factor for applications beyond short-haul voyages is the differentiation of operational profiles of short-sea vs deep-sea travel. They play a crucial role in the selection of proper battery technologies and their integration into the vessels’ power and distribution systems. A combination of considerations needs to be taken when selecting battery systems that are heavily dependent on:
1. Power demand (high energy vs. high power)
2. Voyage duration (short sea vs. transoceanic)
3. Port infrastructure (availability of OPS and fastcharging capabilities)
4. The creation of electrification corridors to support long-haul deep-sea voyages.
For example, when selecting batteries, a low C-rate may be most suitable for long-haul voyages where the battery will discharge over a longer period, but they will require longer charging times, creating the need for redundant cascading systems to improve reliability on long-haul deep-sea voyages. Conversely, batteries with a high C rate are suited and needed for peak loads like maneuvering, where fast, high-power delivery is essential. These batteries would be discharged faster but on the other hand, can be charged at the same rate, which may ensure stability of the power plant under various operational conditions.
Figure 67: Ships delivered per year with battery systems by application [Maritime Battery Forum, Ship Register].
A notable challenge for deep-sea applications lies in the existing rules and regulations. While the IMO, along with IACS, provides overarching guidance, regulatory fragmentation among classification societies and flag States remains a barrier. Harmonization and updated standards are essential to accelerate adoption. Regulatory gaps persist in the following areas:
1. Standardized rules for battery integration.
2. Standardization for OPS throughout the EU and other regions.
3. OPS infrastructure in non-EU ports.
4. Crew training and safety protocols.
Consequently, there is an urgent need to review and update applicable regulations as technologies evolve, bridging regulatory gaps while facilitating the growth of the number of ships and offshore units using newer
From over 50 battery-electric vessel deployments globally, several patterns have emerged:
1. Modular battery systems enable scalability across vessel classes
2. Load-following strategies improve fuel efficiency by 10 to 20 percent during the variable demand phase
3. OPS adoption is highest in ports with regulatory incentives and infrastructure investment.
Lessons from projects in Norway, Canada and China also show that early stakeholder engagement and crew training are critical to successful integration. As challenges are addressed and current and emerging battery technologies are further developed for maritime and offshore applications through continued innovations in battery chemistry and integration, the prospect of electric propulsion systems on long-haul deep-sea voyages is becoming increasingly feasible today.
4 .5 . Bunkering Infrastructure: Is the Supply Chain Ready?
The acceleration towards decarbonization within the shipping industry hinges fundamentally on the readiness of global bunkering infrastructure for alternative fuels. LNG, methanol, ammonia and hydrogen each pose unique infrastructure demands, requiring specialized investments and operational standards to achieve
widespread adoption. LNG, biofuels and methanol are becoming mainstream choices for sustainable-focused shipping lines, driven by decarbonization targets and IMO mandates. Major ports are upgrading their capabilities to handle multiple fuel types, enhancing their competitiveness in attracting global fleet operators.
Liquefied natural gas remains the most mature alternative fuel infrastructure, now available in over 170 ports globally, supported by more than 50 dedicated bunkering vessels. Key hubs include Singapore, Rotterdam and Shanghai, strategically located along major trade routes. The rollout has mirrored shipping demand rather than speculative investments, establishing LNG as a dependable transitional fuel.
Figures 68 and 69 illustrate the projected global demand and fleet growth for LNG bunkering vessels up to 2030. The steady increase in LNG infrastructure aligns closely with shipping routes and vessel deployments, reflecting the industry's pragmatic approach in scaling up alternative fuel capacities in key maritime locations. This growth can be supported by firm long-term offtake agreements and port-based policy initiatives targeting greenhouse gas emissions, even though infrastructure limitations also present obstacles, in that while some ports have made progress in LNG infrastructure, many still lack the capacity to offer diversified fuels or meet the volume demands of next-generation vessels. The high capital expenditure required to retrofit or build bunkering terminals for alternative fuels can also deter investment, particularly in less-trafficked ports.
Methanol has emerged as a highly dynamic fuel, benefiting from ease of handling due to its liquid state at ambient conditions. This makes storage and bunkering
infrastructure less complex than alternatives like hydrogen or ammonia. Major ports including Antwerp, Houston, Rotterdam, Singapore and Shanghai have successfully initiated methanol bunkering operations. Notably, Singapore introduced the first national standard for methanol bunkering in 2024, demonstrating robust regulatory support and growing commercial demand. Yet, despite significant developments, the global methanol bunkering infrastructure remains uneven, concentrated primarily in Europe and parts of Asia, creating logistical challenges in aligning bunkering locations with vessel deployment.
The ammonia infrastructure is in a nascent stage. Commercial ammonia bunkering services do not currently exist, with Rotterdam conducting successful pilot operations as recently as April 2025, transferring 800m3 in a controlled environment. These early demonstrations are crucial in addressing ammonia's toxic properties and associated fuel handling technologies, emergency response procedures and transfer protocols.
Hydrogen remains at the research and demonstration stage, with infrastructure development confined to limited pilot projects in advanced innovation zones. Hydrogen, although promising as a non-carbon fuel solution, lacks commercial-scale and bunkering availability today.
Strategic regional investment highlights the geographical focus for infrastructure advancement:
• Europe continues to lead with substantial investments in ports like Rotterdam and Antwerp, spearheading ammonia and methanol infrastructure projects. Rotterdam alone supplied nearly 1.5 million tonnes (Mt) of alternative fuels in 2024.
• Asia, particularly Singapore and China, is expanding rapidly. Singapore surpassed 1 Mt in alternative fuel sales in 2024, while China undertook its largest methanol bunkering operation of 900 tonnes in May 2025.
• North America bunkering hubs offer competitive advantages with the availability of multiple fuel types
and proximity to major industrial zones. The region is also attracting investments for the construction of LNG terminals and biofuel production facilities, highlighting its adaptability to shifting global energy demands.
• The Middle East, notably Sohar Port (Oman) and NEOM (Saudi Arabia), has secured billions in investments for green ammonia and methanol production, crucially positioning themselves as future export and bunkering hubs.
• South America, notably Chile’s Magallanes region, is developing substantial green hydrogen production infrastructure to serve as an emerging export and bunkering hub.
Number of Available Port Infrastructures
Figure 70 underscores the substantial infrastructure investments across global regions, highlighting critical investment disparities and emphasizing the need for targeted financial initiatives to balance global infrastructure development, while Figure 71 provides a breakdown of bunkering readiness by port type and fuel category, showing discrepancies between major global hubs and smaller regional ports: while core hubs are making progress, secondary ports still lack basic facilities. As decarbonization pathways mature, the development of feeder port capabilities will be critical to ensure end-to-end green corridor functionality.
The establishment of green shipping corridors has become essential in driving infrastructure development.
The Asia–Europe and trans-Pacific routes continue to dominate maritime flows, dictating where alternative fuels infrastructure is urgently required. Ports like Singapore and Rotterdam are proactively aligning infrastructure investments with these high-volume trade routes, supported by public-private collaborations to secure fuel supplies and infrastructure readiness. Nonetheless, a significant gap is present between currently available infrastructure and future required capacity across different alternative fuels, thus pointing to an urgent need to accelerate investments in planned infrastructure to meet anticipated demand growth, especially for ammonia and hydrogen, which are critical for future deep decarbonization.
Figure 70: Regional green port infrastructure investments [Clarksons Research, ABS].
Biofuel Bunkering
Hydrogen Bunkering
Ammonia Bunkering
LNG Bunkering
Methanol Bunkering
Number of Available Port Infrastructures
Figure 71: Comparative alternative fuel bunkering capabilities by fuel type [Clarksons Research, ABS].
4
.5
.3 . Challenges and Interdependencies
Despite positive developments, several challenges persist. Infrastructure investment transparency remains limited, complicating large-scale project finance mobilization. Many infrastructure initiatives remain at pilot scale or are structured through joint ventures and memoranda of understanding rather than fully financed projects.
Price volatility in global oil and gas markets is another major concern. Geopolitical tensions, supply chain disruptions, and fluctuating crude prices directly impact the economics of the marine fuel supply. This unpredictability makes it difficult for bunkering providers and clients to plan long-term procurement strategies. On the other hand, emerging fuel technologies are not yet widely available or costcompetitive with traditional marine fuels, slowing their adoption despite regulatory pressure.
Shipyard capacity is also a challenge to keep pace with demand. The dedicated liquefied gas bunker vessel market is competing with the liquefied gas cargo market and the associated construction of liquefied gas carriers. There are limited shipyards with technological capabilities to construct liquefied gas cargo/bunker
vessels, and there is strong competition for shipyard capacity; the more lucrative large gas carrier market strains resources that would otherwise be dedicated to aid available construction infrastructure for fuel bunkering vessels.
The LNG bunkering market is also competing with global demand for LNG energy. The LNG export market and associated marine terminals strain LNG availability for small-scale LNG bunkering, while large LNG export facilities prioritize marine terminal availability for large LNG carriers rather than relatively small-scale LNG bunker vessels. Similar bunker challenges exist for importing nations considering the distribution of imported LNG, which is competing with other national energy demands. This raises obstacles for increasing supply chain availability to the LNG bunker vessels. Standardization and safety protocols pose another significant barrier. Current standards for handling new fuels such as ammonia and hydrogen remain fragmented, necessitating international regulatory alignment to facilitate global adoption. Certification and training for terminal operators, seafarers, and emergency responders will be essential to achieving operational readiness at scale.
4
.5 .4
. Strategic Enablers and Recommendations
The scaling of bunkering infrastructure will require concerted actions:
• Enhanced Public-Private Partnerships: Leveraging combined investments and shared risks through structured partnerships to de-risk infrastructure buildout.
• Harmonized Global Standards: Accelerated adoption of unified international safety and operational standards to streamline cross-border bunkering operations.
• Strategic Corridor Investments: Prioritizing bunkering infrastructure investments along established and emerging green corridors to maximize impact and utilization.
The transition toward alternative fuels is undoubtedly underway, yet bunkering infrastructure readiness remains uneven across fuel types and regions. LNG serves as an instructive model for methanol and ammonia, indicating a likely trajectory from fragmented experimentation to scaled commercial operations. Given the cryogenic nature of LNG, existing infrastructure, including insulated storage tanks, transfer systems, and safety protocols, can serve as a technical and regulatory foundation for handling ammonia, which also requires refrigerated storage. With targeted investments, regulatory support, and strategic alignment of infrastructure with key shipping routes, the maritime industry can ensure infrastructure readiness to support widespread adoption of alternative fuels, vital for achieving decarbonization targets. This compatibility can reduce infrastructure costs and accelerate the rollout of ammonia bunkering in ports that are already equipped for LNG.
4 .6
. Nuclear Propulsion: A Viable Final Answer?
As the shipping industry transitions from fuel oil to clear option in en route to net zero, the hurdles in Figure 47 pose challenges pertaining to fuel availability, safety, readiness of bunkering infrastructure and volatility of fuel prices, all of which can be largely mitigated, if not virtually dispelled, by the application of nuclear propulsion. Nuclear reactors generate energy from the difference in nuclear binding energy between heavy nuclides and fission fragments under controlled chain reactions, without relying on the power-generation mechanism of breaking chemical bonds between atoms that occurs during combustion and which generates CO2 as a product. As such, this process results in GHG-emission-free energy being transferred to a coolant, whence a suitable thermodynamic cycle is used to generate power. Nuclear marine propulsion, when implemented using small-scale modular nuclear fission reactors, can also potentially be costcompetitive if compared to fossil fuels. In addition, where nuclear energy is used to power an electric motor through nuclear-electric propulsion, synergies from electrification and the present hybrid powertrain may be leveraged to maximize return on investment.
4 6 1 Reactor Technologies
The most common nuclear reactor type is the uraniumfueled pressurized water reactor (PWR), using lowenriched uranium as fuel. In PWRs, water is exploited both as a moderator, that is to slow down the neutrons emitted during fission to induce more fission, and as a coolant which transfers the energy released in fission
to a steam cycle power-conversion system for energy production. The enrichment of uranium used in PWRs is approximately 3 to 5 percent of Uranium-235. As an alternative, thorium can also be used to produce nuclear power, its major advantage being that it has high burnup potential and is much more abundant than uranium. Moreover, thorium reactors produce fewer long-lived transuranic elements than those from uranium and have a lower proliferation risk. However, they may require a starter fissile seed to sustain the chain reaction.
Modern nuclear fission reactors are based on a GenIV reactor design philosophy. Examples are small modular reactors (SMR), and microreactors (MCR), as in Figures 72 and 73. SMRs and MCRs are small and modular by design and are best suited for maritime applications. Small modular reactors have a power capacity of up to 300) megawatts of electricity (MW(e)MW[e]) per unit and physically they occupy a fraction of the size of PWRs. Their modularity makes it possible for systems and components to be factory assembled and transported as a unit. Microreactors generate from 1 to 20 MW(e) and are designed to be portable.
Small modular reactors and MCR designs are generally relatively simple in design, and their safety concept often relies more on passive systems and inherent safety characteristics of the reactor. This means that in case of an accident, no human intervention or external power, or force is required to shut down the systems. These increased safety margins may eliminate or lower the potential for unsafe release of radioactivity in case of an accident.
permission of BWX Technologies Inc.].
Figure 72: Example of high temperature gas cooled microreactor — HTGR deployment application [used with
Regulatory Landscape and Current Activities
Merchant marine safety requirements are supported by the IMO Convention for the Safety of Life at Sea (SOLAS) Chapter VIII, which is specific to all nuclear ships except ships of war. Specific risks are addressed by the Code of Safety for Nuclear Commercial Ships (IMO Resolution A.491(XII)), adopted in 1981. The code carries experience from the NS Savannah era (Figure 74) and is strictly applicable to conventional ship types propelled by traditional nuclear propulsion plants with PWRs. Herein, the typically required large emergency planning zones (EPZs) for high-pressure reactors may limit the ability of a cargo or passenger vessel to enter ports. Currently, the World Nuclear Transport Institute (WNTI) and Nuclear Energy Maritime Organization (NEMO), both of which feature classification societies among their key members, are contributing to collaborative industry and regulatory efforts aiming to propose technical updates to Resolution A.491(XII).
Figure 73: Artist’s impression of MCR.
Figure 74: NS SAVANNAH built under President Eisenhower’s Atoms for Peace Program reaching the golden gate bridge of San Francisco (USA) in 1962 [U.S. government — National Archives and Records Administration (NARA)].
SOLAS Chapter IX mandates the implementation of the International Safety Management (ISM) Code, which does not explicitly discuss the operation of nuclear ships. It is expected that in the future the code may be used as a starting point for vessel crew and shipowners to clearly define roles, responsibilities and a novel framework for seafarers in accordance with the Convention for Training, Certification and Watchkeeping (STCW).
The International Ship and Port Facility Security (ISPS) Code as implemented by SOLAS Chapter XI-2 should also be revised to account for “Special measures to enhance maritime security.” It is expected that ship security assessments, planning, recordkeeping, defined roles and responsibilities of onboard personnel as well as the roles of governments and port facilities, will have to be reconsidered within the context of nuclear floating assets and the ports to which a nuclear ship may visit.
In any future merchant ship application of nuclear propulsion, cooperation between the IMO and the International Atomic Energy Authority (IAEA) will be crucial to enable their different and extensive sets of expertise to be reflected in regulations. For instance, the IMO Irradiated Nuclear Fuel Code (INF), reflects IAEA’s requirements and is mandatory for ships carrying packaged irradiated nuclear fuel, high-level radioactive wastes, or plutonium. Provisions under this
code are interlinked with the IMO International Code for the Construction and Equipment of Ships Carrying Dangerous Chemicals in Bulk (IBC) and the International Maritime Dangerous Goods (IMDG). INF, IMDG and IBC, all address risks of relevance to environmental pollution from accidental release. Nonetheless, only radioactive materials packaged as cargo are considered, and therefore ships or offshore units using radioactive material (fuel) for energy production are not applicable. This implies that the risk-based framework should be modernized to allow for the handling of nuclear fuel and other radioactive wastes.
Ships must also abide by local regulations set by the port State. While some countries with existing nuclear naval fleets such as the U.K. or U.S. have already developed regulations on the berthing of nuclear vessels, other countries, such as New Zealand, do not allow nuclear-powered or nuclear-armed vessels to enter their national waters. Due to the possible challenges related to national and international regulatory regimes, early designs may focus on local or national applications, such as Jones Act Vessels in the U.S. Accordingly, the widespread operation of nuclear ships may require that commercial vessels may only be flagged in nations that have mature nuclear and maritime regulators and to which export control restrictions allow transfer of stewardship.
Figure 75: Artists’ impression of ABS and Herbert Engineering concept nuclear power LNGC.
Class societies are developing new class requirements for nuclear power systems and supporting international developments for future nuclear floating offshore installations. Classification requirements for nuclear propulsion, however, may look to the activity and guidance of ongoing international communities in updating relevant design, safety and security codes specific to nuclear-powered assets. Concept vessel designs are also being devised as a means to practically experience the iterative design process at a high level, conceptualize the potential hazards of the new technology and prepare to implement goalbased engineering solutions to address potential risks. Specifically, design experience clarified that nuclearpowered ships and floating assets must be designed within the context of an associated EPZ, which should
With advancements in nuclear engineering and the development of many types of advanced nuclear reactors, there are opportunities to implement the technology in modern commercial vessels and floating nuclear power plants.
be contained within a vessel’s boundaries, to showcase safety and allow access to commercial trade ports. This, however, limits the choice of reactor types.
The maritime industry stands on the brink of a new era. As new nuclear technologies emerge, the sector could potentially tackle the dual challenge of achieving global climate goals while providing a reliable energy source. For this to happen, a fit-for-purpose ecosystem of rules and regulations for nuclear shipping should be established. International efforts to update and develop codes and standards applicable to commercial nuclear shipping are expected to address gaps and develop new regulatory and liability pathways. This is essential for the implementation and widespread adoption of nuclear technology in safe and sustainable ships.
Figure 76: Typical module transverse section of a floating nuclear power plant.
5
THE LOGISTICS OF LOWCARBON SHIPPING — NEW VESSEL DESIGNS AND
FUEL TRANSPORT
5 .1 Hydrogen and Ammonia Carriers: How Will These Fuels Move?
5 .1 .1 Introduction
The global push for sustainability is driving a shift toward clean energy, with hydrogen and ammonia emerging as key energy carriers to decarbonize industries like maritime, power and transportation. Prized for their zero-emission potential, these fuels are critical to meeting regulatory demands and advancing green logistics, particularly in the maritime and offshore sectors.
The following sections examine the role of hydrogen and ammonia as energy carriers, focusing on their benefits, challenges and transportation logistics. It explores the maritime sector’s unique requirements, including infrastructure needs, technical and regulatory barriers, investment trends, and pioneering projects. Actionable recommendations for stakeholders across the energy and maritime value chains are provided to guide adoption.
5
.1 .2
Market Overview and Investment Trends
Investment in hydrogen and ammonia carriers for lowcarbon maritime transport has surged over the past decade, driven by rising demand for clean shipping fuels and stringent regulations. The ambitious goals of the International Maritime Organization’s (IMO) greenhouse gas (GHG) Strategy highlight the growing viability of hydrogen and ammonia as maritime fuels, spurring increased funding and development of infrastructure and technologies to support their adoption.
The global hydrogen market is on the cusp of transformative growth, driven by an urgent push for decarbonization and rapid advancements in clean hydrogen technologies. In 2023, global hydrogen demand reached 97 million tonnes (Mt), predominantly from fossil fuel-based production, with low-emissions hydrogen at less than 1 Mt. However, projections indicate a seismic shift, with low-emissions hydrogen production potentially scaling to 49 Mt per annum (Mtpa) by
2030, a nearly 50-fold increase. This growth is fueled by a doubling of Final Investment Decisions (FIDs) in 2023 to 3.4 Mtpa, evenly split between electrolysis (1.9 Mtpa) and fossil fuels with carbon capture, utilization and storage (CCUS) (1.5 Mtpa). Green hydrogen, powered by nearly 520 (gigawatts) GW of announced electrolysis capacity is poised to dominate due to declining renewable energy costs, while blue hydrogen projects in North America and Europe leverage existing infrastructure. Key developments, such as the European Union’s (EU) Hydrogen and Gas Market Directive introduced in 2025, provide regulatory clarity by mandating a 70 percent emissions reduction for low-carbon hydrogen, unlocking investments. Projects like the Good Earth Green Hydrogen and Ammonia (GEGHA) initiative in Australia, reaching financial close in 2025, and H2Global’s €3 billion supply-side auction for renewable hydrogen and derivatives further signal robust investment momentum.
Hydrogen Type
Blue Green Pink
Turquoise White
Figure 77: Beyond blue and green: emerging color trends in global projects [Rystad Energy].
End Product
78: Ammonia and methanol spearhead the hydrogen derivatives market
79: Project landscape: Dominance of concept-phase initiatives and few progress to FID and construction [Rystad Energy].
Figure
[Rystad Energy].
Figure
Beyond 2030, the hydrogen market’s trajectory hinges on addressing demand uncertainties, financing challenges and infrastructure gaps. Emerging hydrogen types, such as turquoise and white hydrogen, are gaining attention but remain niche, with commercial viability expected to improve post-2030. Regionally, North America and Europe lead in capacity, driven by strong policy frameworks, while Asia, particularly China and India and Oceania, led by Australia’s renewable-rich projects like GEGHA, are poised for significant growth post-2030. India set the ambitious target of a $6-billionworth domestic and export market for green ammonia by 2025. Overcoming regulatory and financing hurdles will be essential to sustain this momentum, ensuring hydrogen’s role as a cornerstone of the global energy transition by 2050.
Hydrogen derivatives, particularly ammonia and methanol, will remain central to scaling the hydrogen economy from 2025 onward, driven by their established industrial applications and efficiency as hydrogen carriers. Ammonia’s high hydrogen density and existing infrastructure make it ideal for expanding into shipping and power generation, with 64 ammonia-fueled vessels ordered by June 2025 and successful bunkering pilots, such as Rotterdam’s 500-ton transfer in April 2025, signaling operational readiness. Methanol is also gaining traction as a clean fuel and chemical feedstock. Projects like Amogy and GreenHarvest’s ammonia-to-power system in Taiwan, set for deployment by 2027, and India’s mega-scale green ammonia projects underscore the derivatives’ mid-term importance. Looking further, emerging technologies like liquid organic hydrogen carriers (LOHC) and synthetic hydrocarbons will diversify the derivatives landscape, addressing storage and transport challenges. Continued research and development investment and policies like the EU’s RFNBO standards and H2Global’s contracts-fordifference mechanism will drive innovation, enabling a robust hydrogen value chain that supports global decarbonization by 2040.
5 1 3 Hydrogen and Ammonia as Energy Carriers
Hydrogen
Hydrogen, the simplest and most abundant element in the universe, holds significant promise as a clean energy carrier. When used as a fuel, either through combustion or in fuel cells, it produces only water vapor as a byproduct, making it an extremely clean energy source with zero emissions at the point of use. It boasts a high energy density and can be produced through various methods, including electrolysis, steam methane reforming and biomass gasification. Consequently, the hydrogen economy is expected to play a critical role in
decarbonizing sectors that are hard to electrify, such as heavy-duty transport and industrial processes. Hydrogen can be produced through various methods, including:
• Steam Methane Reforming: A commonly used method that involves reacting natural gas with steam to produce hydrogen and carbon dioxide (CO2).
• Electrolysis: The process of using electricity to split water into hydrogen and oxygen. This method is particularly promising when the electricity is generated from renewable sources, leading to green hydrogen.
• Gasification: Converting fossil fuels into hydrogen by heating them with steam and oxygen.
Ammonia
Ammonia (NH₃), a colorless gas with a pungent odor, is primarily known and used in the agricultural chemical industry as a fertilizer component. However, its potential as an energy carrier has gained significant traction. This is due to several key attributes, including its high hydrogen content (approximately 17.6 percent by weight), high overall energy density, and relative ease of storage and transport compared to pure hydrogen. Furthermore, ammonia can be synthesized from renewable energy sources through processes like the Haber-Bosch method, which combines atmospheric nitrogen with hydrogen (potentially green hydrogen). Once produced, ammonia can be converted back into hydrogen and nitrogen for use in fuel cells or burned directly in engines or thermal power plants, making it a versatile player in the transition to a low-carbon economy.
However, these conversion processes (both ammonia synthesis and potential cracking back to hydrogen) are energy-intensive and incur efficiency losses. This suggests that minimizing conversion cycles could be advantageous, potentially making direct ammonia combustion or use in solid oxide fuel cells (SOFCs) (which can sometimes use ammonia directly) more energy-efficient pathways than those requiring reconversion to hydrogen, thereby influencing the overall Well-to-Wake efficiency and cost-effectiveness.
Ammonia has several advantages as an energy carrier:
• Storage and Transport: Ammonia can be liquefied under relatively low pressure and at moderate temperatures, making it easier to store and transport compared to hydrogen.
• Established Infrastructure: The existing infrastructure for ammonia production, storage, transportation and trade routes can be adapted and scaled for energy applications.
5 .2 .1 Hydrogen Transportation
To transport hydrogen, various methods have been proposed and implemented, including:
• Compressed Hydrogen Gas: This method involves compressing hydrogen gas to high pressures (typically 350–700 bar) and transporting it in specialized cylinders or tube trailers. While this method is straightforward, it requires significant energy for compression and has limitations regarding transportation distances.
• Liquid Hydrogen: Hydrogen can be cooled to -253° C to form a liquid, reducing its volume significantly. However, the energy required for liquefaction and the need for cryogenic storage make this method costly and complex. Liquid hydrogen is suitable for certain applications, such as space travel. A significant portion of current regulations for handling cryogenics and liquid hydrogen (LH2) are based on NASA standards, including rigorous documentation
TRANSPORTATION
Ammonia Carriers
LH₂ Carriers
LOHC Vessels
KM
Viable option for coastal shipping; effective at a moderate scale and when pipelines aren’t feasible.
Marginally viable; infrastructure-intensive; used only when pure H₂ is required at delivery; losses and boil-off an issue.
Moderate viability: advantage in manageable storage and reduced boil-off, but infrastructure (hydrogenation/ dehydrogenation) costs can be significant.
of lessons learned from incidents and near-misses, as detailed in NASA's ASAP Lessons Learned report, the NASA-STD-8719.22 Safety Standard for Hydrogen and Hydrogen Systems, NASA Technical Memorandums and Reports on LH2, and specific standards and procedures from Kennedy Space Center and Marshall Space Flight Center, which collectively enhance safety protocols. Liquefying hydrogen can consume up to 30 percent of its energy content.
• Hydrogen Pipelines: High-pressure pipelines can transport gaseous hydrogen over long distances. This method is efficient and already in use in some regions, particularly in industrial applications. However, the infrastructure for hydrogen pipelines is still limited and requires substantial investment.
• Hydrogen Carriers: Chemical compounds such as methylcyclohexane (MCH) and ammonia can serve as hydrogen carriers or LOHC. Hydrogen can be released from these compounds through chemical reactions, providing a more efficient means of transportation. Boil-off during storage and transport of LH2 leads to losses that add up to those of liquefaction.
KM
Highly cost-effective; mature infrastructure; lower losses over distance; scales efficiently.
Viable only when endusers demand pure hydrogen and can manage boil-off losses; high energy and infrastructure cost.
Viable; becomes increasingly competitive with LH₂ for long-haul shipping due to stable storage, reduced losses and simpler vessel design.
Preferred choice; best cost-performance at large scales and longhaul shipping; established global infrastructure.
Economically challenged; extremely high shipping and handling costs; technology and infrastructure limitations at a large scale.
Strong option for intercontinental transport; stable storage, minimal losses; scalability and safety advantages outweigh hydrogenation costs over ultra-long distances.
Table 9: Comparison of the different ways to transport hydrogen, assuming distances below 500 km pipelines are utilized.
5
.2
.2 Ammonia Transportation
Ammonia is currently transported globally in large quantities, primarily for agricultural use. Its existing infrastructure provides a significant advantage for energy applications:
• Liquid Ammonia Transport: Ammonia can be transported as a liquid under moderate pressure (e.g., ~10 bar at ambient temperature) or as a refrigerated liquid at its atmospheric boiling point of -33° C. This characteristic makes it significantly easier to handle and store compared to liquid hydrogen, which requires cryogenic temperatures (-253° C), thereby simplifying logistics. Specialized ammonia tankers and railcars are already in widespread use, particularly for the fertilizer industry, making it relatively straightforward to adapt and expand this existing infrastructure for energy transport purposes.
• Ammonia Pipelines: Like hydrogen, ammonia can be transported via pipelines. Advantageously, many countries already possess extensive ammonia pipeline networks, primarily established for agricultural purposes. These existing systems can be leveraged for energy distribution, significantly reducing the need for entirely new infrastructure and the associated investment.
• Storage and Conversion to Hydrogen: Ammonia's
5 .2 .3 Comparative Analysis of Hydrogen and Ammonia as Energy Carriers
Efficiency
The efficiency of energy carriers is critical for determining their viability. Hydrogen fuel cells have an efficiency of about 60 percent, while ammonia can achieve around 40 percent when converted back to hydrogen. However, ammonia's higher energy density means it can transport more energy per volume, making it a competitive option.
Safety Considerations
Safety is a paramount concern for both hydrogen and ammonia:
• Hydrogen: Highly flammable and has a low ignition energy, leading to potential explosion risks.
• Ammonia: Toxic and poses health risks if inhaled, necessitating strict safety measures during handling and transportation.
Infrastructure Requirements
The infrastructure for hydrogen and ammonia differs significantly:
• Hydrogen: Requires specialized storage and transport facilities due to its flammability and low density.
Engine Technical Readiness Level (TRL)
Existing Applications in Deep-Sea Shipping
TRL 6–7: Dual-fuel ammonia engines in advanced testing (e.g., Wärtsilä, Everllence); commercial deployment expected by 2025 to 2026
Tankers carry ammonia as cargo; ammonia-fueled propulsion in development (e.g., NYK Line’s SAKIGAKE tugboat operational in Japan, 2024, M/S NoGAPS planned for 2025)
N/A (focus on cracking technology, TRL ~4–5 for largescale systems)
Carries hydrogen post-cracking, supports hydrogen trade (74% of hydrogen trade via ammonia)
TRL 4–5: Hydrogen fuel cells operational in small vessels (e.g., San Francisco’s SEA CHANGE), internal combustion engines less mature, limited to pilot projects
Liquefied hydrogen carrier completed maiden voyage (Australia to Japan, 2022), limited to auxiliary power in deep-sea, main power in short-sea vessels
Global Fleet on Order (2025)
Projected Fleet (2030)
11 vessels ordered in 2023, 7 ammonia/liquefied petroleum gas (LPG) carriers (25,000–41,000 m³) with WinGD X-DF-A engines ordered by Tianjin Southwest Shipping for delivery by Q3 2026
Significant growth; lowcarbon ammonia to represent 13% of global ammonia supply as fuel (BloombergNEF), Japan imports via METI’s CfD scheme, requiring 20–30 additional carriers
Included in ammonia fuel vessel orders (dual-purpose carriers)
Projected Fleet (2040)
Volumetric Energy
Density (MJ/L)
Storage and Transport
Ammonia and hydrogen could account for 30% of shipping fuel by 2050, implying 50–70 ammonia carriers by 2040 for maritime decarbonization and hydrogen trade
~11.5 MJ/L (liquid NH₃)
Supports hydrogen trade, included in ammonia carrier projections
5 vessels ordered in 2023, primarily for short-sea or auxiliary roles, SECO MARINE’s compressed hydrogen storage system received AP for underdeck integration.
Larger storage volume, requires material modifications for corrosion resistance
Included in ammonia carrier projections for hydrogen trade
Limited growth due to high costs and infrastructure needs, ~10–15 hydrogen carriers projected, mostly short-sea or fuel-cell-based.
Liquid hydrogen carriers could reach ~20 Mtpa trade by 2050, with 20–30 carriers by 2040 in optimistic scenarios, contingent on cost reductions and infrastructure
Same as ammonia fuel, hydrogen postcracking depends on the storage method
Requires cracking infrastructure, hydrogen storage post-cracking is voluminous and complex,
~8.5 MJ/L (liquid H₂)
Requires cryogenic tanks or high-pressure vessels, low density increases storage complexity
Table 10: Comparative analysis of hydrogen and ammonia (fuel and carriers). Continued on next page.
Technology Maturity
Applications
Technical Challenges
Emission Control
Capital Expenditure (Capex)
Infrastructure Availability
Energy Efficiency
Limited research until the 2010s, recent advances in IC engines and fuel cells (e.g., SOFC/PEMFC)
IC engines (prototyped in automotive, 2007), SOFC/ PEMFC fuel cells, marine applications advancing (e.g., ShipFC project)
NO x emissions (>1,000 ppm in some cases), requires engine tuning, dual-fuel systems and SCR units
SCR units needed for NOx, tuning critical to reduce unburnt ammonia and NO x
SCR is cheaper for low NOx (~natural gas levels), costly for high NOx (~1000 ppm)
Hydrogen fuel cells commercially available (e.g., Toyota Mirai, Hyundai Nexo), combustion engines less mature
Table 10: Comparative analysis of hydrogen and ammonia (fuel and carriers). Continued from previous page.
The transition to hydrogen and ammonia as primary energy carriers requires substantial investment in infrastructure. Key areas of focus include:
Hydrogen Infrastructure
The global hydrogen infrastructure market is set for robust growth, driven by the increasing demand for low-emissions hydrogen as a key component in decarbonizing energy, industrial and transportation sectors, with significant investments in pipelines, storage and shipping infrastructure to support this transition. Existing hydrogen pipelines, totaling about 5,000 kilometers (km) globally, primarily serve industrial users, but new projects are emerging to meet rising demand, including Europe’s 9,040 km hydrogen network, with 525 km expected to be operational by 2025, and a 300 km ammonia pipeline in China announced in 2025 to connect renewable ammonia production in Chifeng City to Jinzhou Port. Ammonia, accounting for 85 percent of projected hydrogen trade by 2030, plays a critical role as a hydrogen carrier, with maritime shipping infrastructure expanding through specialized ammonia carriers to enable safe and efficient global distribution. Key projects include the European Hydrogen Backbone, with 30 km of the Dutch network under construction since October 2024, and Canada’s planned electrolytic production plant in Point Tupper, Nova Scotia, targeting 1 Mt of low-carbon ammonia annually by 2026 for export. These developments, supported by government incentives like the U.S. Inflation Reduction Act and the EU’s hydrogen strategy, signal substantial opportunities for investment in hydrogen infrastructure, though challenges such as high production costs, regulatory clarity, and public acceptance remain critical hurdles to address.
Global production of hydrogen is forecast to hit 110 Mt annually by 2030, with 12 percent being green hydrogen from renewables and rise to 240 Mt by 2040. Demand will be led by manufacturing (48 percent), mobility (30 percent), and energy (15 percent) sectors. Electrolysis capacity is expected to reach 119 GW by 2030, far short of the 590 GW needed for the 1.5-degree climate goal, emphasizing the need for robust economic frameworks and policies to accelerate low-carbon hydrogen production and decarbonization.
Low-carbon hydrogen will gain prominence, particularly post-2035, enabling storage of surplus renewable energy (solar, wind, nuclear) for long periods and distances, outperforming batteries. Hydrogen demand will primarily come from transport and specific industrial processes, with limited use in electricity generation via fuel cells, despite some energy loss in conversion.
Other considerations for hydrogen infrastructure are:
• Production Facilities: Scaling up production facilities, particularly for green hydrogen, is essential. This includes investing in electrolyzers and renewable energy sources.
• Transportation Networks: Developing a network of pipelines in case of blending with natural gas, compression stations, distribution centers, carrier vessels and hydrogen refueling stations are critical for efficient hydrogen transport.
• Storage Solutions: Safe and effective storage solutions for hydrogen, whether in gaseous or liquid form, are necessary to manage supply and demand effectively.
Figure 80: Projection for green (left) and low-carbon (right) hydrogen production 2026 to 2050.
Green and Low-Carbon Hydrogen Hype and Cost Realities
In the last half of the decade, hydrogen gained momentum globally as a versatile, low-emission energy carrier with the potential to decarbonize hard-to-abate sectors such as heavy industry, maritime, aviation, and long-distance transport. However, its large-scale deployment, particularly green hydrogen produced via electrolysis using renewable energy, continues to face significant cost challenges, remaining up to four times more expensive than grey hydrogen (approximately $1.06/kg), with distribution and refueling infrastructure accounting for as much as 85 percent of total costs. Across all continents, governments and industry, stakeholders are advancing region-specific strategies to overcome these barriers: Europe is scaling electrolyzer production and cross-border hydrogen infrastructure through initiatives like IPCEI; the U.S. and Canada are offering tax credits and low-carbon hydrogen incentives through the Inflation Reduction Act and Clean Hydrogen Investment Tax Credit; Asian countries including Japan, South Korea and China are investing in hydrogen supply chains and integrating hydrogen into industrial zones; Africa is leveraging its solar and wind potential in early-stage export projects in countries like
Namibia, South Africa and Morocco; Latin America, led by Chile and Brazil, is developing national hydrogen roadmaps based on abundant renewables; and Australia is positioning itself as a major global exporter of green hydrogen. Unlocking hydrogen’s global potential will require continued focus on improving electrolyzer efficiency, reducing reliance on expensive materials through alternatives like nickel-iron alloys, advancing emerging technologies such as solid oxide electrolysis, scaling manufacturing, standardizing components and deploying integrated, site-optimized renewablehydrogen systems. Equally critical is securing affordable, large-scale renewable energy, along with robust government support through targeted research and development funding, market creation mechanisms, infrastructure investment and harmonized regulatory frameworks. A coordinated global response tailored to regional strengths will be essential to reduce costs, scale deployment and establish hydrogen as a key pillar in a sustainable, inclusive and resilient energy future. Figure 81 represents the range of hydrogen levelized cost of production, storage and distribution across several published scenarios over the past years to date.
Compressed Gas (Storage)
Salt Cavern (Storage)
Truck (gH2) (Distribution)
Pipeline (Distribution)
Figure 81: Levelized costs range of green hydrogen production, storage and distribution [R. T. Shafiee, 2024].
The levelized cost of hydrogen for production, storage and distribution shows significant variability, reflecting diverse operational and infrastructural factors. Hydrogen production costs range from $2–19/kgH₂, influenced by high electrolyzer capex ($650–$1,691/kW), fluctuating electricity prices ($0.45–$183/MWh), and utilization rates (6–95 percent). Storage costs vary widely, with salt
caverns at $2–37/kgH₂ due to limited cycles (4–12/year) and compressed gas at $2–4/kgH₂ with higher cycles (20–365/year). Distribution costs are lower, ranging from $1–6/kgH₂ for pipelines (7–500 km, 0.4–15,300 tpd) and $1–5/kgH₂ for trucks (7–300 km, 0.4–100 tpd), highlighting pipelines’ scalability but trucks’ flexibility for shorter distances.
Ammonia Infrastructure
The global ammonia market is poised for significant expansion, driven by the decarbonization of existing supply chains and the rising adoption of ammonia as a zero-carbon fuel and hydrogen carrier, necessitating robust inland and maritime transportation infrastructure, particularly through high-capacity, pressurized pipelines constructed with low-alloy carbon steel and specialized ammonia shipping vessels. Operational pipelines include a U.S. network spanning seven Midwest states, transporting 1.5 Mt annually, a Mexican pipeline connecting the Gulf of America to the Pacific Ocean, and several short-distance European pipelines, such as Italy’s 74 km pipeline handling 0.3 Mtpa. Proposed developments include a strategic long-distance pipeline from the Netherlands to Germany to support energy and industrial demands, alongside a 300 km pipeline announced in 2025 to link renewable ammonia production in Chifeng City to Jinzhou Port in North-East China. Additionally, the growth in ammonia trade will rely on expanding maritime shipping capacity, utilizing specially designed ammonia carriers to facilitate safe and efficient global distribution, presenting significant investment opportunities in both pipeline and shipping infrastructure.
Other considerations for ammonia infrastructure are:
• Adaptation of Existing Facilities: Much of the ammonia production and transportation infrastructure can be adapted for energy applications. This includes modifying existing ammonia plants to produce renewable ammonia.
• Distribution Networks: Expanding the current ammonia distribution network for energy applications, including the establishment of bunkering facilities for maritime use, is essential.
• Conversion Technologies: Developing efficient technologies for converting ammonia back into hydrogen will be necessary for end-use applications. For example, fuel cell to electricity generation modular systems for onboard and onshore applications.
5 .2 .5
Recommendations
• Investment in Infrastructure: Governments and private stakeholders should invest in the development of hydrogen and ammonia infrastructure, including pipelines, storage facilities and transportation networks.
• Research and Development: Continued research into production methods, storage technologies, and safety protocols is vital for improving the efficiency and safety of hydrogen and ammonia as energy carriers.
• Policy Support: Policymakers must create supportive regulatory frameworks that promote the use of hydrogen and ammonia, including incentives for research and deployment.
5 .3 The Carbon Value Chain Enabling Decarbonization Efforts
The CCUS process is a key element of net-zero emissions pathways across different industries, starting with capturing carbon from emissions and extending to transportation, recycling or permanent storage, creating a whole new value chain.
Three crucial factors that should be further analyzed for the success of the value chain are the stakeholders, the business sectors and the technology challenges. Highemitting, hard-to-abate industries, such as oil and gas, cement, and steel, particularly in countries committed to decarbonization, are the main stakeholders. While some projects focus on CO2 utilization to enhance oil production, the main driver for CCUS adoption remains increasingly stringent emissions regulations and taxation initiatives. Over the past decade, several countries have introduced policies, legal and financial incentive frameworks, to accelerate CCUS deployment. Early adopters like the U.S., EU, Canada, and the U.K. lead in implementation, while a second wave of regulatory development is emerging in the Asia-Pacific region to address deployment barriers and scale up investment.
CARBON VALUE CHAIN MARINE AND OFFSHORE
Capturing CO2 at generation points and collecting captured CO2 at hubs
• Oil and Gas
• Power Generation
• Chemicals and Petrochemicals
• Cement
• Iron and Steel
• Shipping — O shore
• Ports — CO2 Hubs
Transporting captured CO2
Onboard Carbon Capture and Storage (OCCS): Capturing CO2 emissions directly from vessel engines and power generators, including those on floating production storage and offloading (FPSOs) units.
Liquefied CO2 (LCO2) Carriers: Vessels designed for the safe and efficient transport of captured CO2, forming the transportation link in the value chain.
Using CO₂ as a feedstock Enabling the production of synthetic fuels
Sequestrating/ Storing CO2
• Pipelines
• Gas Carriers
• Tracks
CO2 floating storage and injection units (FSIUs): Offshore units responsible for the temporary storage and injection of CO2 into geological formations for long-term sequestration.
Table 11: Stages of the carbon value chain.
• Trains (ISO Tanks)
• FPSO
• Drillship
• Rigs
Figure 82: The carbon value chain.
5
.3 .1
CCS Policy Environment: Market Drivers
Carbon capture and storage (CCS) policies are advancing globally, with the Americas leading in policy support and infrastructure. The U.S. has reinforced its CCS framework through expanded tax credits under the One Big Beautiful Bill Act and continued bipartisan backing. Canada is also progressing with new financial incentives like Carbon Contracts for Difference and an Investment Tax Credit. In South America, Brazil is developing legal mandates for CO2 storage through the Fuels of the Future Bill. Meanwhile, the EU has embedded CCS into its climate strategy since 2009, aiming to capture and utilize 450 Mt of CO2 annually by 2050. The EU is also working on regulatory frameworks and cross-border infrastructure, although current Emissions Trading System (ETS) rules limit collaboration with non-EEA countries. The U.K., operating independently, targets 20–30 Mtpa of CO2 capture by 2030.
In the Middle East and Africa, CCS interest is growing, though regulatory frameworks remain underdeveloped. The Middle East Green Initiative supports regional CCS hubs, with the UAE’s ADNOC leading projects like Al Reyadah. In Africa, twelve countries have included CCS in their climate strategies, but only a few are parties to the London Protocol, which governs cross-border CO2 storage. In the Asia-Pacific region, countries such as Australia, Japan and South Korea are forming alliances to leverage cost-effective storage options. Emissions trading schemes in China, Japan and Indonesia could support CCS, but low carbon prices and unclear crediting rules hinder progress. A stable policy and financial environment are essential for unlocking the region’s CCS potential.
REGION FACILITIES IN OPERATION ANNOUNCEMENTS AND DEVELOPMENTS
Americas 27 facilities in operation across the U.S., Canada and Brazil
APAC and India
China
EU and UK
• 1 CCUS facility in operation
• 4 under construction
200 thousand tonnes per annum (tpa) world’s largest oxyfuel combustion project in the cement sector, commences operation January 2024
310 facilities under construction or in the advanced development phase
Japan is exploring the feasibility of 9 CCS networks:
• 5 to store CO2 domestically
• 4 elsewhere in the Asia Pacific Malaysia, Indonesia, Australia, Japan lining up to develop geological storage
1.5 Mtpa world’s largest power station CCUS project on track to complete construction
• 14 cross-border CO2 infrastructure projects selected as Projects of Common Interest and Projects of Mutual Interest
Northern Lights, the first operational CO2 value chain project and transportation with LCO2 Carriers
ME and Africa 3 CCS facilities in operation
• £21.7 billion in funding over the next 25 years for two CCS clusters announced by the U.K. government
• €4 billion Record EC Innovation Fund budget for decarbonization technologies, including CCS
• Release of EU industrial carbon management strategy Enactment of Net-Zero Industry Act
Table 12: Carbon sequestration project development [Global CCS Institute].
5
.3 .2
Status of CCS Deployment
As of mid-2025, 70 carbon capture facilities are operational globally, with a combined capture capacity of 61.49 million tpa. Since February 2025, six additional facilities have entered the construction phase. The global project pipeline now includes over 620 identified projects—ranging from early-stage to advanced development—with a total planned capture capacity exceeding 400 Mtpa.
Notably, Europe and the Asia-Pacific region show strong investment momentum. A significant number of earlystage projects in these regions are expected to reach Final Investment Decision (FID) in the coming years, indicating a robust growth trajectory for the sector. The accompanying graph illustrates the progression of CCS facilities over time, highlighting the distribution of projects by development stage.
Figure 83: CO2 capture capacity of commercial CCS facility pipeline [Global CCS Institute].
Carbon dioxide capture technologies separate carbon dioxide from gas streams, typically achieving over 95 percent purity. While industrial sources such as cement plants and power stations emit CO2 concentrations ranging from 3 percent to 50 percent, ambient air contains only 0.0426% CO2, making point-source capture significantly more efficient than direct air capture.
In the marine environment, the key challenge is adapting mature land-based carbon capture technologies to operate effectively in compact, mobile and harsh offshore conditions. This includes integrating capture units, CO2 conditioning systems and onboard storage within limited space and energy constraints.
5 4 1 Regulatory Framework
At the IMO, during MEPC 83, building on the work carried out by previous Correspondence Groups, several delegations expressed strong support for prioritizing the development of a regulatory framework for OCCS within the IMO’s GHG reduction strategy, along with the development of guidelines on testing, survey and certification of OCCS. The targeted completion for the development of the regulatory framework for the use of CCUS is set by 2028 at the latest.
In addition to these, academic spin-offs and shipyards are exploring alternative technologies such as membranes, solid looping, adsorption and cryogenic separation.
For the EU, while OCCS is not yet explicitly included in the FuelEU Maritime Regulation, Article 30 allows for its future consideration in GHG intensity calculations, pending the development of a verifiable monitoring and accounting method
5 .4 .2 Market Activity and Technology Landscape
Approximately 20 technology vendors are currently developing OCCS solutions, primarily based on chemical absorption using amine systems, the most mature and widely adopted technology and mainly in conventional fuel oil engine types.
Figure 85: Number of identified vendors for exhaust gas treatments.
Table 13: OCCS uptake [Clarksons Research].
5
.4 .3 Challenges
and Enablers
The introduction of the IMO’s mid-term measures included a two-tiered emissions penalty at $100 and $380 per tonne of CO2 equivalent, as well as potential rewards for zero emissions technologies, repositioning OCCS as a decarbonization enabling option. The successful implementation of OCCS in the maritime sector depends on two critical enablers: costeffectiveness and a secure downstream value chain.
As far as CO2 downstream offtakers are concerned, a reliable infrastructure is essential for the offloading, transport and permanent storage or utilization of captured CO2. Without this, OCCS adoption may face operational and societal barriers. Key requirements include:
• Development of port and vessel offloading infrastructure
• Integration with existing and planned CCUS networks
• Standardization of CO2 quality specifications
• Establishment of certification and traceability systems
COST DRIVERS COST REDUCTION STRATEGIES
Installation of capture units and onboard CO2 conditioning systems
Energy consumption for CO2 capture, compression and liquefaction
Technological innovation
System design optimization
Potential fuel efficiency penalties Economies of scale, policy and financial incentives
5 .5 Transport of CO2 and the Role of LCO2 Carriers
Transporting CO2 from capture sites to storage or utilization facilities is a critical component of the CCUS value chain. While small-scale CO2 transport has long supported industries such as food and beverage, largescale CCS projects require infrastructure capable of handling millions of tonnes annually. The commissioning of the first large-scale cryogenic liquid CO2 (LCO2) carriers in 2024 marks a significant step forward in enabling flexible, long-distance marine transport. Terminal facilities will also need to be built, which connect land to subsea pipelines or to ships. Subsea pipeline and termination manifolds, as well as riser connections to fixed or floating offshore platforms, are already being studied as viable options with trials underway.
5 .5 .1 LCO2 Carriers
Although the use of pipelines in the energy sector is well established, they require a continuous flow of compressed gas, and their user costs are highly dependent on distance. Therefore, the shipping industry is increasingly being looked at as the most viable
solution for safely transporting CO2, particularly when in low volumes. In fact, transporting CO2 by ship has been labeled essential by the European Commission’s EU Taxonomy for Sustainable Activities, as well as the EU ETS.
Fleet and Deployment Trends
As of 2025, the global LCO2 carrier fleet remains limited, with only a few vessels in operation. These ships typically have capacities of around 1,700 tonnes and operate at pressures between 15 to 19 bar gauge. However, the launch of the Northern Pioneer and Northern Pathfinder, dedicated LCO2 carriers for the Northern Lights project, marks the beginning of commercial-scale CO2 shipping. These vessels are designed to support the first full-chain CO2 transport and storage initiative in Europe.
There are currently two ships capable of transporting CO2 within a pressure range of 13–18 bar gauge. Recently, the Northern Pioneer and Northern Pathfinder — dedicated LCO2 carriers — have been introduced for the Northern Lights project, the first initiative to offer commercial CO2 transport and storage
Table 15: Fleet LCO2 [MSI].
Table 16: Fleet of LCO2 carriers.
Based on the progression of the projects around the world, the proximity of emitters to sequestration the majority of LCO2 carriers are intended to operate to transport from port terminal to offshore terminals creating mainly carriers’ routes to the north of Europe and to the broader area of APAC.
5 .5 .2 Design Challenges
While transporting CO2 in pipelines requires supercritical conditions to be met, shipping it is more flexible as it can be in liquefied form (LCO2), which means it can be shipped at varying temperatures and pressures. Liquefied CO2 carriers are typically adapted from LPG carrier designs and must comply with the IGC Code. There are three main tank design concepts: low-pressure, medium-pressure and elevated-pressure systems. However, transporting CO2 presents unique challenges due to its chemical properties and potential impurities.
Most designs take into consideration pure CO2 However, the development of LCO2 carriers requires a solid understanding of the behavior of CO2 as cargo.
Impurities that may exist in the mixture of the different capture methods and processes have impacts on:
• Health and safety matters with toxic substances
• Thermophysical properties of CO2 mixture (phase diagram, density)
• Corrosivity and material selection (corrosion through reactions, free water)
• Reliquefication plant design (incondensable)
Corrosion is a serious concern for a tank's structural integrity and, consequently, the vessel's safety. Among the numerous present impurities in captured LCO2, free water, SOx, NOx and oxygen have been studied most extensively. The design pressure of the LCO2 system can also affect the corrosion rate. In low- and mediumpressure systems, liquefaction and refrigeration reduce light elements, such as hydrogen, nitrogen and methane, to levels aligned with their solubility in LCO2, resulting in a purer LCO2 specification. In contrast, high-pressure systems do not remove these light elements, so the resulting post-liquefaction LCO2 specification remains similar to the pre-liquefaction composition.
Table 17: LCO2 designs.
5 .6 CO2 Injection and Offshore Storage
Carbon dioxide injection is practiced many years now in Enhanced Oil Recovery (EOR), that involves the injection of CO2 into depleted oil reservoirs to enhance the recovery of remaining oil reserves. While CO2 EOR can contribute to CO₂ storage, it is not considered neither primary nor reliable method for permanent CO₂ storage. Dedicated CCS projects are designed with the specific goal of long-term CO2 storage and offer more robust and reliable solutions for mitigating climate change.
5 .6 .1 Geological Storage Principles
Carbon dioxide is stored deep underground — typically at depths greater than 800 meters — where it is securely trapped beneath impermeable rock layers known as caprock. These geological formations, such as depleted oil and gas fields or deep saline aquifers, isolate CO2 from the atmosphere and drinking water sources, ensuring long-term containment. The depth and natural barriers prevent any direct escape of CO2 to the surface, making geological storage a safe and permanent solution.
5 .6 .2 Marine Environment Considerations
Offshore CO2 sequestration typically involves two kinds of reservoirs: depleted oil and gas reservoirs and saline aquifers. A saline aquifer is a subsurface geological formation characterized by a high concentration of
dissolved salts in the water, such as sodium chloride, and lacks economic viability for extracting fresh water. The specific strata referred to as “aquifers” consist of porous and permeable rocks saturated with water. These aquifers are frequently examined as potential reservoirs for CO2 injection, owing to their geological characteristics and their capacity to securely retain CO2 over prolonged periods of time.
5 .6 .3 Offshore Injection Scenarios
Three injection facility scenarios are considered the most technically feasible and cost-beneficial options for offshore injection cases where pipeline transportation of LCO2 is not viable, due to factors such as the distance from the shore, subsea terrain, and the associated business risks of higher capital expenditures. All scenarios assume that pure CO2 conditions are obtained at an onshore terminal or cluster hub, and dry highly pure CO2 is loaded onto the LCO2 carrier. This implies that there is no need for purifying facilities onboard the injection unit for any of the scenarios described below.
Types of shipping-based offshore injection models
• CO2 Carrier Direct Injection: CO2 is injected directly from the LCO2 carrier into the seabed well upon arrival at the injection site. While costly buffer storage is not utilized in the direct injection model, it does call for a pre-conditioning facility to adjust the CO2 to the pressure and temperature required for injection
via an injection riser. This injection carrier vessel will eliminate the need for large-scale offshore structures. However, the savings from bypassing the buffer storage injection unit will be offset by the need for at least one additional vessel with a larger capacity than the injection carrier.
• CO2 Carrier to Platform Injection Facility without Storage: A platform equipped with pre-conditioning and injection systems at the injection site for the LCO2 to be offloaded directly onto upon arrival of the LCO2 carrier. This allows CO2 to be injected into the well through the platform, which can be either a permanent fixture on the seabed, or a temporarily moored floating structure. A significant difference between direct injection from LCO2 carriers and the carriers used in this scenario is that the latter may or may not require the pre-conditioning and injection facilities to be on board each vessel. However, like direct injection, the injection facility is assumed to lack buffer storage, so an additional carrier with a larger capacity than the injection carrier will be needed in this scenario, as well.
• CO2 Carrier to Injection Facility with Buffer Storage: In this scenario, the injection facility is equipped with buffer storage, allowing the offloaded LCO2 to be stored directly in tanks located within the floating unit before injection. The unit is also fitted with preconditioning process machinery onboard to prepare the LCO2 before injection, thus relieving the CO2 carriers from the burden of onboard injection and pre-conditioning equipment. The injection facility may take the form of a fixed platform positioned atop the injection well or a semi-permanently moored structure at the site.
The marine sector is becoming a critical frontier for CCS deployment, where LCO2 carriers enable flexible, long-distance transport of captured CO₂, while offshore injection facilities, both fixed and floating, are being designed to store CO2 in depleted reservoirs and saline aquifers. These developments are essential for decarbonizing both onshore and maritime industries, as the transition to net zero is heavy reliant on carbon capture.
6LOOKING AHEAD — THE NEXT FIVE YEARS IN MARITIME DECARBONIZATION
6 .1 . Market Evolution: How Trade Routes and Supply Chains Will Adapt
The global shipping industry is standing at an inflection point, where decarbonization regulations, geopolitical disruptions and supply chains are together reshaping the shipping lanes.
6 .1 .1 . Rerouting to Adapt to Geopolitical and Environmental Shifts
In 2024, the global seaborne trade grew 5.9 percent in tonne-miles, exceeding the growth of 2.1 percent in tonnes (Figure 86). The tonne-mile growth in 2024 represented the fastest rate of expansion in the past 14 years and was mainly influenced by the rerouting decisions aiming to circumvent disruptions in the Red Sea and the Panama Canal, as well as the underlying growth in long-haul trade flows.
6 1 2 The Emission Dilemma of Extended Routes
Vessels rerouting onto longer shipping voyages are facing substantial environmental and economic challenges due to the increased fuel consumption and associated carbon emissions. The extended traveling distance and the potentially increased sailing speed needed to maintain service schedules elevate the operation cost, including both fuel expense and carbon levies.
For instance, a typical voyage for a Suezmax tanker from the Persian Gulf to the Amsterdam-Rotterdam-Antwerp petroleum trading hub (ARA) via the Suez Canal takes approximately 19 days and emits approximately 3,200 tonnes of carbon dioxide (CO2) (Figure 87). If the vessel opts for the Cape of Good Hope route, it takes nearly 35 days to reach the ARA and the emissions will be increased to approximately 5,620 tonnes.
The Cape route has increased the fuel consumption by 76 percent compared to the Canal route. This results in a 76 percent rise in direct carbon emissions and has financial implications under the current and upcoming regulatory frameworks, including (the assumptions on fuel consumption for two routes, prices for fuels and carbon emissions used in the calculation are summarized in Table 18):
• 2024 and afterwards: European Union Emissions Trading System (EU ETS) imposes 76 percent higher compliance cost on the Cape route.
• 2025 and afterwards: FuelEU Maritime adds an extra 76 percent compliance cost on the Cape route.
• 2028 and afterwards: IMO mid-term measures could add a further 76 percent compliance cost on the Cape route.
Thus, in this scenario, the Cape route not only leads
Tonnes Tonne Miles
Figure 86: Annual change in global seaborne trade [Clarksons Research].
Rotterdam Antwerp
Arabian Sea
Suez Canal
Cape of Good Hope
Figure 87: Reroute due to Red Sea disruption.
Route Persian-Suez Canal-ARA Persian-Cape of Good Hope-ARA
FuelEU Maritime Euro 2,400/tonne equivalent very low sulfur fuel oil (VLSFO) and an exchange rate of 1.1 between $ and Euro are assumed
Table 18: Fuel consumption and price of fuels and carbon emissions.
Fuel Cost Carbon Cost
Persian-Suez Canal-ARA
Persian-Cape of Good Hope-ARA
6 .1 .3 . Financial Implications of Adopting Alternative Fuels
Alternative fuels have the potential to mitigate emissions in that the utilization of alternative fuels will bring a two-fold financial benefit, stemming from both carboncost savings and possible earnings from a pooling
mechanism, consequently lowering the operational cost for the vessel.
• From 2025 to 2027: adopting alternative fuels can reduce the compliance costs related to both EU ETS and FuelEU Maritime.
• 2028 and afterwards: in addition to savings on EU ETS and FuelEU, the International Maritime Organization’s (IMO) carbon costs can also be reduced as long as the greenhouse gas (GHG) fuel intensity (GFI) scheme comes into force.
Assuming the Suezmax tanker burns biofuel (e.g., B30) and liquefied natural gas (LNG), when taking the longer Cape route, the operational costs of the vessel, including fuel expense and GHG regulation compliance cost, will decrease proportionally as indicated by Figure 89 (fuelprice assumptions of $750/tonne for B30 and $770/ tonne for LNG):
• B30 can lead to a reduction in operational costs from 2028, with the savings potentially reaching up to 30 percent in 2033 and 2034.
• LNG can lower operational costs starting from 2025, with the savings potentially reaching up to 39 percent in 2028.
As a result, the Cape route remains a competitive option when using alternative fuels compared to the Canal route.
Figure 89: Savings on operational cost (fossil oil vs. B30 and LNG, fossil oil cost set as 100%).
Figure 88: Cost comparison for a suezmax tanker between two routes (Persian-Suez Canal-ARA Cost Set as 100%).
The key consideration for rerouting is to lower fuel and carbon costs by reducing emissions, which can be achieved by reducing fuel consumption and/or utilizing alternative fuels, thus prompting the following corrective measures:
1. Shorten travel distance and reduce waiting time at ports
Under the framework of IMO and EU, vessels will be charged for emissions based on fuel consumption, which is directly related to the traveled distance. Therefore, they will prefer shorter routes whenever possible, which will be the case with the full reopening of the Suez Canal or sufficient water levels
in the Panama Canal. Additionally, congestion at the port will increase fuel consumption during the waiting time, even though the vessel is stationary.
2. Speed adjustment (slow steaming)
To reduce fuel consumption and emissions, ships may adopt slower speeds (slow steaming), especially on long-haul routes. While this extends voyage times, it lowers fuel costs and carbon levies. Figure 90 indicates that the average speeds of typical vessels have gradually decreased year after year. Furthermore, vessels with CII rating D-E tend to operate at lower speeds compared to those rated A-C, reflecting the impact of speed adjustment on regulatory compliance.
Containership Average Speed Capesize Bulker Average Speed
3. Demand for alternative fuel adoption, supply at ports and deployment of bunkering vessels
To mitigate carbon costs, shipowners are expected to accelerate the adoption of alternative fuels such as biofuels, LNG, methanol and ammonia. Looking at recent bunkering trends at the Port of Rotterdam, a shift to alternative fuels is noticed. The port supplied nearly 1.5 million tonnes (Mt) of alternative fuels in 2024, including bio-blended oil, making up a significantly higher share of total marine fuel demand compared to previous years. Singapore has also shown strong development of alternative
Average Speed
marine fuels, again led by bio-blended oil and LNG. The overall trend reflects the growing demand for delivering and scaling alternative fuel bunkering at major ports with more bunkering vessel deployment over the next five years. Figure 91 shows the demand for alternative fuel bunkering in Singapore and Rotterdam, while Figure 92 charts the LNG demand for bunker vessel deployment over the next five years.
Figure 90: Average speed of typical fleet [Clarksons Research].
VLCC
Figure 91: Alternative fuel demand in Singapore (top) and Rotterdam (bottom) [MSI, ABS].
Alt Fuel Share Singapore (RH Axis)
Figure 92: LNG bunker demand (right) and bunker fleet (left) up to 2030 [MSI, ABS].
6 1 5 Evolving Cargo Demand
Heightened regulatory pressure, alongside shifts in cargo demand, will reshape maritime trade patterns. Figure 93 provides a forecast of changes in the demand for energy and fuel as cargo:
1. Declining fossil energy demand
As the global economy transitions towards decarbonization, there will be a downturn in the demand for fossil energies such as oil and coal. This decline is primarily driven by stringent carbon reduction targets and the electrification of road
transportation in developed and developing countries. The volume of fossil energy transported via typical ship types (e.g., tankers and bulker carriers) is expected to decrease after peaking around 2028.
2. Rising demand for clean energy
Meanwhile, there is a growing demand for clean energy, including LNG, ammonia, hydrogen and other low- or zero-emission energy products. This shift in energy preferences will require new specialized ship types and the development of new trade routes and infrastructures.
6 .2 . The Economics of Green Shipping: Who Will Pay?
As geopolitics and decarbonization targets compete to define the current shipping landscape, eventually, it is economic calculus, fuel-cost spreads, carbon pricing, asset risks, and capital access that are determining the speed and shape of the energy transition. At the heart of this evolution lie two central questions:
• Who will ultimately bear the cost?
• Who will capture the upside?
Figure 93: Demand for energy [MSI, ABS].
6 .2 .1 . Carbon Pricing and Fuel Economics: Operational Impacts and Cost Reconfiguration
Market-based measures, most prominently EU ETS and the IMO’s proposed global GHG pricing mechanism, are fundamentally driving cost structures. As of 2024, vessels above 5,000 gross tonnage (gt) calling at EU ports must surrender allowances for 40 percent of their CO2 emissions, rising to 70 percent in 2025 and 100 percent in 2026. At a carbon price of €90/tonneCO2, a 15,000 twenty-equivalent unit (TEU) containership on the Asia–Europe route could incur upward of €1.5 million in annual ETS costs.
Forward scenarios suggest that a global carbon levy of $150/tonneCO2 would raise voyage costs by up to 15 percent for heavy fuel oil (HFO)-powered vessels on long-haul trades such Asia–Northern Europe (MSI, ABS). Conversely, vessels powered by LNG or certified bio-methanol would see significantly lower exposure to penalties. These cost differentials are already materializing in time charter premiums and clause revisions.
As far as cleaner fuel options are concerned, even assuming a persistent $1,000/tonne differential between e-fuels and very low sulfur fuel oil (VLSFO), most of the common fuel-production pathways do not lead to their cost of emission abatement being higher than the penalties. Hence, without complementary mechanisms, e.g., revenue recycling (that is, leveraging carbon revenues not as a tax sink but as a prop for transition by redirecting collected funds towards green-shipping investments) or contract-for-difference schemes, the commercial case for switching remains fragile.
6 .2 .2 . Fuel Economics and Fleet Investment: Capex Risk and Strategic Hedging
As of mid-2025, 53 percent of the global orderbook tonnage is alternative-fuel capable, up from just 8 percent of the existing fleet. Liquefied natural gas dominates (77 percent of new orders), but fuel diversity is broadening, and methanol and ammonia are
The capital expenditure (capex) premium for alternativefuel vessels remains significant, though it varies by ship type, fuel system, and market maturity. For instance, green methanol DF containerships (8,000–9,000 TEU) continue to command a premium of $10 million to $15 million compared to conventionally fueled equivalents. For DF, very large crude carriers (VLCCs) and medium range (MR) tankers, observed premiums also reflect increased demand and evolving technology baselines. Interestingly, ammonia-fuel-ready Newcastlemax bulkers, once expected to be the most expensive due to safety and system complexity, are now priced below initial forecasts and in some cases cheaper than LNG DF variants.
The historical price gap between DF and conventional vessels has started to narrow across sectors, particularly as DF configurations become the reference standard for newbuilds. Yet, owners are still absorbing 10 to 30 percent of the capex differentials, not merely for compliance, but also as a strategic hedge against tightening carbon regulations, evolving fuel cost spreads, and the rising risk of stranded assets. The maturity of LNG and methanol engine supply chains reinforces this positioning, while early ammonia contracts signal growing investor appetite for long-term decarbonization bets.
Fuel optionality is also expanding. In tankers, 29 percent of vessels ordered since early 2024 are alternative-fuel ready, despite the segment’s otherwise conservative stance. However, fuel adoption is still concentrated in container, cruise and select roll on/roll off passenger (ro/pax) vessels, where visibility on route and fuel access is higher.
Overall, implementing the IMO’s 2023 GHG Strategy at the fleet level is estimated to cost $1 trillion to $2 trillion by 2050. Further, port-side mitigation (green fuels, shore power) and adaptation (storm walls, elevation) could add hundreds of billions to trillions of dollars on top of vessel spending by 2050. For example, a single modern liquid-bulk storage tank now costs as much as
6 .2 .3 . Cost Allocation Across
the Maritime Value Chain
The financial burden of decarbonization is being unevenly distributed across stakeholders. Meeting net-zero by 2050 would require $400 billion to $600 billion in additional cumulative fleet investment, 65 percent of which will fall on owners unless new financial architectures emerge.
On the other hand, charterers are cautiously integrating green premiums into charterparty clauses, but true riskpooling remains limited. Cargo owners, though under increasing Scope 3 pressure, are lagging in material engagement. A 2024 BCG survey found that while 82 percent of shippers express a willingness to pay for
Sustainability-linked Loans (SSL), which tie interest rates to emissions intensity key performance indicators (KPIs), are a growing segment. Hafnia’s $374 million SLL, for instance, links pricing to targets beyond Poseidon Principles’ thresholds. Yet, such products require strong verification and trajectory alignment, which many small or non-rated players struggle to meet.
Transition finance and export credit support are also playing catalytic roles. Multilateral banks like EIB and JBIC are bundling corridor-aligned loans covering vessels, port infrastructure and fuel production, creating vertically integrated investment frameworks.
Nonetheless, according to the Climate Bonds Initiative, just 8 percent of maritime debt globally qualifies as green under existing criteria, highlighting the untapped potential if alignment on design, emissions and fuel life cycles improves. For a vessel to be eligible for certification under the Climate Bonds Standard and Certification scheme, the following applies:
• The bond issuer should demonstrate to Climate Bonds that the ship is aligned with the IMO decarbonization trajectory for the lifetime of the bond up to 2050.
• Ships that are not zero-emission must provide a managed reduction plan detailing how emissions are to be curbed.
• Ships that are primarily dedicated to the transport of fossil fuel and/or otherwise support the fossil fuel sector are excluded.
In general, green bonds may apply to vessels, retrofits or infrastructure (e.g., bunkering, port electrification), and issuers must clearly allocate funds to eligible green assets and commit to reporting the environmental impact.
An underlying regional split of available financial instruments can also be observed. Europe hosts ~62 percent of all identified financial programs, Asia-Pacific 15 percent, and North America 16 percent. Latin America and Africa combined reach only 7 percent, underscoring an emerging-market financing gap (Figure 95).
Financing opportunities arise from a wide range of sources, including private institutions, development banks, public-private partnerships and national or supranational programs. These sources encompass both sector-specific programs, designed specifically for the maritime industry, and broader initiatives that include maritime projects as part of wider efforts to drive sustainability and green transitions.
Share of Available Financial Programs
6 .2 .5 . Ports: From Bottlenecks to Catalysts
Shoreside readiness remains a critical constraint. As of 2024, only 5 percent of global ports have active alternative fuel bunkering, primarily for LNG. Methanol and ammonia bunkering remain largely precommercial. The above leads us to believe that green fleet renewal without complementary shoreside investment risks under-delivering on emissions reductions.
5 percent of ports with active alternative fuel bunkering.
Supplying green marine fuels alone will demand $30 billion to $90 billion every year through 2050, on top of vessel spending.
However, momentum is building in key hubs. The EU’s Connecting Europe Facility (CEF) Transport program has allocated over €600 million to maritime alternative fuel infrastructure since 2022. Rotterdam alone has
committed €125 million to expand methanol capacity, while Singapore plans ammonia bunkering trials by 2027.
Notably, 29 percent of global tonnage now calls at ports with some form of alternative fuel bunkering, which is a fivefold increase since 2015. However, this progress is regionally uneven and requires policy support to unlock scale and commercial confidence. Ports in developing economies already move ~55 percent of exports and ~61 percent of imports worldwide, so resilience and decarbonization in those regions are system critical.
On the side of funding, blue/water bonds have raised approximately $7 billion since 2018 (Figure 96). These bonds are use-of-proceeds debt labels under the broader GSS+ (social, sustainability and sustainabilitylinked) umbrella. The invested funds must target marine or freshwater-related outcomes (coastal resilience, wastewater, mangrove restoration, port dredging, etc.). Only a fraction of the $7 billion cumulative market is shipping-specific, and most of that finances port-side projects.
6 .2 .6 . Green Corridors: From Signaling to Operationalization
Green corridors are proliferating, but not all are equal in strategic or economic impact. For analytical clarity, they can be broadly divided into two categories: Signal Corridors and Operational Corridors.
Signal Corridors are declarations, often backed by memoranda of understanding between port authorities or governments. Their function is to align intent and catalyze coordination, not to move emissions abatement at scale. These corridors usually sit in the feasibility or exploratory stage, with technical assessments, stakeholder dialogues and early regulatory scaffolding underway. Infrastructure buildouts and vessel commitments are limited, and commercial pricing or customer uptake remains untested.
For example, the Halifax–Hamburg corridor received CA$22.5 million in public funding to accelerate studies and readiness planning, yet current annual throughput (~15 Mt) and alternative fuel availability remain modest. Similarly, the Tyne–Ijmuiden route is valuable as a regulatory sandbox but still lacks scale. The Los Angeles–Singapore corridor, widely publicized since 2022, continues to center on pilot efforts, but concrete vessel alignment or bunkering capacity still has to materialize.
Operational Corridors, by contrast, are already reshaping the economics of shipping decarbonization. These are high-traffic, highreadiness trade lanes where real capital is deployed, vessels are on the water, and alternative fuels, such as LNG, methanol and ammonia, are being bunkered or contracted. Operational corridors typically feature deep institutional alignment, port retrofitting and early-stage pricing and risk-sharing mechanisms among owners, fuel providers and charterers.
A prime example is Rotterdam–Singapore, anchored in Maersk’s methanol DF fleet, with over 300 LNG DF vessels already operating and methanol bunkering underway. Rotterdam alone has signed ammonia and hydrogen agreements with India’s AM Green, while Singapore crossed 1 Mt in alternative fuel sales in 2024. Similarly, the North Sea Corridor (e.g., Antwerp–Gothenburg) is gaining traction through dense ro/pax traffic and EU-backed infrastructure, while Vancouver–Yokohama–Shanghai is advancing through bilateral cofunding for hydrogen bunkering and pilot projects.
These distinctions matter. Signal corridors are essential to leverage public-private momentum and shape earlystage frameworks. But it is operational corridors that are now defining the real-world asset investment timeline and customer pricing dynamics. Moreover, operational corridors are also triggering vertical integration across the value chain, such as Maersk’s $100 million equity commitment to a Louisiana green methanol plant, or UniBarge’s execution of methanol deliveries in key European ports.
In short, the corridor landscape is maturing but also diverging in function. Signal corridors serve as coordination mechanisms, while operational corridors act as live laboratories for decarbonization economics. Hence, stakeholders must distinguish between the two to allocate capital, build infrastructure and assess competitive exposure appropriately. As decarbonization accelerates, the corridors that transition from “announcement” to “throughput” will shape not just emissions outcomes but the strategic architecture of global shipping.
Long-term viability will depend on several reinforcing factors:
• The differential of green fuel cost premiums
• The expansion of green finance access beyond toptier owners
• The internalization of carbon risks across chartering and cargo procurement processes
• The maturing of corridor ecosystems into stable low-emission networks
Ultimately, the transition will not be evenly distributed. Competitive advantage will accrue to those who align fuel strategy with capital access and policy positioning, enabling them to monetize early compliance, secure customer premiums, i.e., higher freight rates willingly paid by charterers or cargo owners for verified low-emission shipping services, and avoid regulatory liabilities.
Novel financial instruments, such as blue bonds, whose issuance has climbed from zero to $7.2 billion in just seven years, are gaining momentum, but still remain a rounding error compared with more traditional tools such as green bonds in energy or transport, indicating vast potential for contriving and commercializing new schemes.
6 2 8 Strategic Recommendations
The economic case for green shipping is becoming clearer, but not simpler. Stakeholders must treat decarbonization not as a compliance exercise but as a capital allocation challenge with sector-specific trade-offs.
Key recommendations include:
1. Adopt corridor-aligned fleet strategies: Prioritize early deployment on routes with regulatory clarity, fuel access and cargo-owner support.
2. Structure financing around lifecycle costs: Use green finance tools to offset capex premiums and derisk opex volatility.
3. Engage in upstream partnerships: Secure long-term green fuel offtake agreements to improve vessel bankability and reduce price risk.
4. Push for harmonized regulatory baselines: Global coordination (especially on carbon pricing and fuel GHG standards) remains critical to prevent distortion and leakage.
5. Integrate data and digitalization: Emissions transparency will be both a compliance and commercial requirement. Real-time voyage data, transparency across the fuel supply chain and verified GHG intensity will underpin future contract structures.
6 .3 . Five Major Trends Shaping the Next 5
6 .3 .1 . A Shift from Operational to Technological Measures Decouples Decarbonization from Sea-Trade Dynamics
The next five years will be critical in determining how close international shipping can come to meeting the 2030 emissions targets and in preparing for the steeper GHG reductions required thereafter. Historically, emissions declined between 2008 and 2013 (Figure 97), primarily due to reduced ship speeds following the 2008 global financial crisis (Figure 98), but rose again as trade volumes recovered, only partially offset by further moderate speed reductions. To date, improvements in carbon intensity have largely been driven by operational measures, such as slow steaming, and market-driven trends leading to an increase in average vessel size (Figure 99), which improves transportation efficiency. However, rising trade volumes (Figure 97), longer voyage durations due to geopolitical disruptions (e.g., Suez Canal blockage, Panama Canal drought), and stagnating improvements in speed and efficiency have pushed net GHG emissions back to 2008 levels. This underscores the limitations of operational measures and the urgent need for technological measures to decouple emissions from sea-trade dynamics.
Wind Propulsion Technologies (WPT) are a prime example of robust decarbonization technology that is effectively independent from sea-trade volumes, as it generates no direct emissions, and which also decouples sustainability efforts from the price of green fuels, which are generally available at a premium accounting for their CO2 abatement cost. Consequently, the next five years are forecast to witness a pronounced uptick in WPT installations (Figure 100). However, WPT
partly shifts dependency of emissions from sea-trade dynamics to factors such as navigation, routing, and crew proficiency. For example, WPT can achieve energy savings exceeding 20 percent, but only when effectively integrated with control algorithms that optimize propeller power by controlling course, speed, and wind-assisted device operating parameters (Guzelbulut, 2025). Without proper integration and operational alignment, their performance may decline considerably. Analogous conclusions hold for hybrid propulsion. Therefore, system integration and optimization are and will be key focus areas in the next five years.
Onboard Carbon Capture and Storage (OCCS), whose application is also expected to grow in the coming years (Figure 101), particularly in mature configurations like amine-based post-combustion and oxyfuel precombustion systems, offers significant potential to decouple greenhouse gas emissions from maritime trade volumes — when the ship speed rises to meet high trade demand, the engine operates at a higher load, which improves the CO2 concentration in the flue gas. This, in turn, enhances the efficiency of the OCCS system. This dynamic creates a self-balancing effect: during periods of intense trade activity, the OCCS performance naturally improves, provided the system’s operational parameters are flexibly managed. As with WPT, the effectiveness of OCCS hinges on seamless integration and system-level optimization.
Further GHG reduction can be achieved only with the adoption of alternative fuels, as the prime technological measure, which will be responsible for up to 65 to 70 percent of the decarbonization effort (ABS’ estimate based on maximal historical performance of operational measures and expected application of alternative fuels in conjunction with operational measures).
Figure 98: World fleet speed [Clarksons Research].
Figure 100: Ships with WPT installed each year.
Figure 101: Ships with OCCS installed each year.
Figure 99: World fleet size [Clarksons Research].
Note:
6 .3 .2 . Ever-Growing Multilayered Fragmentation Presents Both Challenges and Opportunities for Shipowners
Shipowner Fragmentation
While the development and testing of alternative fuels is underway, widespread adoption across all ship types and sizes remains a significant hurdle. As of May 2025, the top 10 and top
50 shipowners collectively accounted for 30 percent and 60 percent of the global orderbook, respectively (Figure 102), yet they were responsible for 50 percent and 70 percent of the alternative-fuel tonnage (Figure 103). This indicates a strong concentration of decarbonization efforts among large owners, who benefit from economies of scale and preferential access to financing and public funding.
Figure 102: Owners’ size and orders [Clarksons Research, ABS].
Figure 103: Owners’ size and alternative fuel on order [Clarksons Research, ABS].
Ship-Type Fragmentation
Adoption of low-carbon technologies is also uneven across ship types. Vehicle carriers and containerships lead in alternative-fuel uptake (Figure 104), largely due to their high emissions intensity driven by elevated service speeds and traffic volumes. Bridging this gap and ensuring equitable access to clean technologies
across all vessel types is essential to democratize sustainability in shipping. This trend, consisting of crude tankers and bulkers embracing the alternative-fuel shift, has recently taken off, as highlighted in Section 4.2.2, and it is expected to become prominent in the next five years.
Figure 104: Fuel by ship type in % of gt [Clarksons Research].
The oil tanker segment exemplifies the operational inefficiencies caused by fragmentation. Many operators manage small fleets, as exemplified in Figure 105 (Bimpikis et al., 2025), showing a median fleet size of 3 vessels per fleet over a sample of around 6,000 vessels,
Occurrence
resulting in a utilization rate of 60 percent (Figure 106), hence a high proportion of ballast time (40 percent). Specifically, ballast voyages are driven primarily by trade imbalances, but also by fragmentation and market uncertainties such as delayed cargo fixtures or lack of information on the next cargo.
Figure 105: Fleet size histogram [Bimpikis et al., 2025].
Figure 106: Fleet utilization histogram [Bimpikis et al., 2025].
While trade imbalances are structural, fragmentationrelated inefficiencies can be mitigated, and their mitigation leads to an improvement in carbon intensity per unit of transport-work, and in a reduction in GHG emissions. Pooling as few as 20 vessels into a fleet managed by a single operator yields a reduction in fragmentation and an improvement in utilization rate such that GHG emissions and fuel consumption are reduced by around 4 percent on average.
Supply-Chain Fragmentation
Unlike sectors such as automotive, where vertical integration enables data sharing and feedback loops between operations and research and development, the maritime industry suffers from a heavily fragmented supply chain. Engine manufacturers, for instance, often lack access to high-frequency operational data, hindering innovation.
Thriving in a Fragmented and Uncertain Market
While mergers and acquisitions are common in the containership sector, and project-based consortia are prevalent in maritime nations such as Japan, South Korea, and China, pooling is a third way offering the benefits of consolidation, albeit at a lower risk and with increased flexibility. On the one hand, ownership of large fleets through mergers and acquisitions may entail high ownership risks due to, for instance, the lack of diversification in shipyard selections or vessel segments that frequently accompanies economies of scale or else because of tariffs and sanctions targeting only a few ships negatively affecting the whole organization in today’s volatile geopolitical climate. Consortia, as an alternative, generally involve the development of technical solutions to be commonly adopted by consortium members, but they generally do not encompass joint commercial operations. On the other hand, pooling allows small and medium shipowners to share resources and reduce exposure to macroeconomic shocks while giving them the option to leverage regional market discrepancies for arbitrage opportunities and flexibly switch between pools. It not only reduces costs and emissions but also empowers smaller shipowners in hard-to-abate segments by enabling shared resources that can be invested in decarbonization.
Larger owners, meanwhile, may increasingly rely on chartering vessels built to their specifications but owned by smaller players, improving margins and accelerating green technology adoption without additional ownership risk. In this context, fragmentation, when strategically managed, can become a source of profitability and innovation for flexible agile players willing to collaborate and consolidate operations.
6 .3 .3 . Expanding LNG Supply: Paves the Way for Blue and Green Fuels
Driven by rising fuel costs, largely due to EU and IMO regulations penalizing fuel oil, LNG is projected to remain the most cost-effective marine fuel until around 2036.
Figure 107 shows the total cost of ownership for a representative Panamax bulk carrier for LNG and other alternative fuels as a fraction of its value for fuel oil (inclusive of capital expenditures attributable to alternative fuels distributed over a lifetime of 25 years, operational expenditures and accounting for fuel pricing and IMO fuel penalties, exclusive of FuelEU and EU ETS costs).
The band of values for other alternative fuels in Figure 107 represents, for each year, the range between the cheapest and the most expensive options among clean ammonia (blue and e-ammonia), clean methanol (bio-methanol and e-methanol) and clean LNG (bio-LNG, e-LNG).
• Pinpointing accurate values is not possible, not only because of the unpredictability of the cost of energy from renewable sources, but also because the energy required for production is dependent on advances in electrolyzer development, availability of biofuel feedstock and abrupt fluctuations in commodity value, as witnessed in the past five years for LNG.
• Uncertainties on the cost of compliance also come into play: in the present analysis, a constant Surplus Unit value of $304/tonneCO2e (80 percent of the Tier 2 Remedial Units) is assumed, together with a Reward Unit value of $1,000/ tonneCO2e, which, however, has a little impact on the outcome, as the only fuels that are eligible for a reward are only barely below the reward target. Additionally, only e-fuels are expected to generate so low Well-to-Tank emissions as to be granted a reward.
Consequently, even though such predictions are subject to high uncertainty, it can be observed that in 2028 biodiesel and LNG are forecast to be more economical than VLSFO, with LNG then becoming the most cost-competitive fuel in the early 2030s up to 2036, year beyond which, because of the increase in fuel penalties, greener alternatives take center stage. Nonetheless, the price of LNG still features in the lower half of the price range of alternative fuels up to around 2050.
Besides its favorable pricing, LNG also offers a critical advantage: availability. Its well-established global infrastructure, supported by robust trading networks across the U.S., EU and Asia, makes it resilient to geopolitical disruptions and increasingly accessible at major bunkering ports, both at bunkering stations and through bunkering vessels (Figure 108). Investing in LNG-compatible vessels, particularly those with a “ready” notation for alternative fuels, is a relatively low-risk strategy, especially for hard-to-abate ship segments. This conclusion is consistent with the previous analysis on carbon pricing and fuel economics (Section 6.1).
Furthermore, biofuel blends, while not included in the present analysis, are expected to be cost-competitive if compared to VLSFO but not, in general, when compared to LNG up to 2035 (see Figure 89 for an operational cost comparison with VLSFO, LNG and B30), albeit this conclusion shows variability for specific vessels running on certain fixed routes.
Contrary to the perception of competition between LNG and blue or green fuels, natural gas is in fact a foundational feedstock for blue fuels. Blue hydrogen is produced from natural gas via steam-methane
reforming, and blue ammonia is synthesized using hydrogen derived from the same source. The CO2 generated in these processes is typically captured using amine-based systems, where amines themselves are often derived from natural gas, further reinforcing LNG’s role in enabling blue fuel production. Importantly, the development of a blue fuel market is essential to catalyze demand and infrastructure for its green counterpart in the long term. This upstream synergy supports cost-effective decarbonization and positions LNG as a steppingstone toward cleaner fuels.
Figure 107: Total cost of ownership for different fuel options [ABS, MSI].
Figure 108: LNG bunkering status [Clarksons Research].
Market expectations also reflect this trajectory: LNG is the dominant alternative fuel in the orderbook, followed by methanol and ammonia (Figure 109). Industry surveys also show LNG being the most expected main fuel until mid-2030s, with ammonia as the most likely candidate to replace it. With the first ammonia engines expected to enter commercial service by 2026 to 2027, many vessels on order, even if not ammonia-capable, are being designed for future conversion.
Over the next five years, LNG will play a leading role while blue fuels begin to scale, laying the groundwork for a broader shift to renewable-based alternatives.
Denmark (Emitter)
Poland (Emitter)
Norway (Emitter)
Sweden (Emitter)
Germany (Emitter)
Finland (Emitter)
Japan Emitter)
Netherlands (Emitter)
Research].
6 .3 .4 . A Growing Fleet of LCO2 Carriers Supports the Expansion of Carbon Transport Infrastructures
Despite regional differences in energy resources and decarbonization strategies, Asia-Pacific, Europe and North America all demonstrate strong and growing support for carbon capture, utilization and storage (CCUS). This momentum is closely tied to the rising demand for blue fuels and aligns well with the expanding LNG infrastructure. Given the limited geological storage capacity in several countries, the need to transport captured CO2 across borders is expected to drive moderate but steady growth in CO2 shipping (Figure 110).
Nevertheless, the key challenge of securing both storage and emitters and harmonizing cross-border operations remains a crucial hurdle for large-scale implementation of a CCUS infrastructure. Hence, projects expected to come online in the next five years, led by major energy companies managing both a small pool of emitters and the storage plant itself, are expected to be the right size to effectively kick off a relatively small and manageable CCUS infrastructure that will scale up in time.
France (Emitter)
Australia (Emitter)
Belgium (Emitter)
United Kingdom (Emitter)
Italy (Emitter)
South Korea (Emitter)
Greece (Emitter)
Denmark (Receiver)
Norway (Receiver)
Malaysia (Receiver)
Japan (Receiver)
Australia (Receiver)
Netherlands (Receiver)
United Kingdom (Receiver)
Italy (Receiver)
Saudi Arabia (Receiver)
Greece (Receiver)
Figure 110: Proportional representation of likely shipping CO2 routes in 2030.
Figure 109: Alternative fuel orderbook in % gt [Clarksons
LNG Methanol LPG Ethane Ammonia Others
6 3 5 Small Modular Reactors: The Final Piece of the Decarbonization Puzzle
Nuclear propulsion offers a near netzero Tank-to-Wake emissions profile, as nuclear fission itself produces no GHG gases. The only emissions associated with nuclearpowered vessels stem from indirect sources such as reactor operation, fuel production and waste disposal. Historically, the adoption of nuclear propulsion has been driven more by the need for high power output and long endurance at sea than by decarbonization goals.
Reactors currently in use for naval purposes are designed for specialized vessels with operational profiles that differ significantly from the broader merchant fleet, such as aircraft carriers. Notwithstanding, many of the technical challenges they face, such as load following, energy storage, and system stability, bear similarities to those encountered in hybrid propulsion systems for commercial applications, thus showing the viability of this solution. Additionally, although capital expenditures for nuclear-powered vessels can be up to an order of magnitude higher than for conventional ships, operational expenditures are significantly lower (ABS et al., 2024), mainly due to the long refueling period (Low Enriched Uranium below 20 percent enrichment requires refueling every 5 to 10 years). Hence, nuclear propulsion not only offers conclusive decoupling of emissions from sea trade, which we have previously observed to be the key trend thwarting all decarbonization efforts this far (Section 6.3.1), but it also has the unique advantage of decoupling fuel consumption from fuel-price market volatility, which will be exacerbated for green fuels highly dependent on renewable electricity for production. Accordingly, the total cost of ownership for nuclear vessels becomes increasingly competitive, and
nuclear propulsion presents itself not just as viable, but also as a financially cost-effective alternative over the medium- and long-term, especially for ship types such as large containerships (Figure 111).
Nonetheless, despite its promise, the most pressing barrier to the widespread adoption of Small Modular Reactors is the absence of a comprehensive regulatory framework. Current international and regional regulations are fragmented or inconsistent, and while the IMO regulates nuclear fuel as cargo, IMO regulations for nuclear merchant ships date back to 1981, namely Resolution A.491(XII), and require significant gap analyses and revision.
In parallel, floating nuclear power plants (FNPP) as stationary power-generation units are being explored for deployment in the early 2030s to supply electricity to data centers and coastal regions, especially at port where vessels will require shore power supply or in isolated areas where full-scale power plants are impractical (currently, there is only one FNPP in operation, the SMR Akademik Lomonosov in Russia’s Far East, while two approval in principles have been issued to Korean Shipbuilders, and several studies aiming for final investment decisions in the coming years are ongoing). Because the floating unit is stationary in territorial waters, the regulatory burden is significantly reduced, while operational experience is acquired for floating power in preparation for future propulsion applications. The next five years (Figure 112) are expected to bring significant progress in this area, including detailed techno-economic assessments and movement toward final investment decisions by 2030, suggesting that the race to revolutionize shipping through nuclear propulsion has just begun.
111: Fuel mix based on the main-engine fuel type for the containership forecast fleet [MSI, ABS].
Gen I Early Civilian Reactor Prototypes
NAUTILUS (First Nuclear-Powered Vessel)
SAVANNAH (First Nuclear-Powered Merchant Ship)
Propulsion for Civil Applications (Mainly Icebreakers)
(First FNPP)
Gen II Commercial Power-Plant Reactors with Dedicated Active Safety Design Gen IV Sustainability, E ciency, Low Risk of Proliferation and Small Footprint Gen III and III+ Increased Fuel E ciency, Streamlined Construction Processes and Passive Safety Design SMR’s for Containerships Propulsion Land Based Floating
Expansion; Regulation Development Framework
112: Land-based and floating nuclear power overview.
AKADEMIK LOMONOSOV (FNPP)
Figure
Figure
REFERENCES
Section 4
Balcombe, P., Chatenet, M., Deseure, J., Schäfer, H., Staffell, I. "Markets and Costs for Hydrogen Electrolysis.” In: Bullerdiek, N., Neuling, U., Kaltschmitt, M. (eds) Powerfuels. Green Energy and Technology. Springer, Cham. 2025.
Buttler, Alexander, and Hartmut Spliethoff. “Current Status of Water Electrolysis for Energy Storage, Grid Balancing and Sector Coupling via Power-To-Gas and Power-To-Liquids: A Review.” Renewable and Sustainable Energy Reviews 82 (3): 2440–54. 2018.
IEA. “Hydrogen Production and Infrastructure Projects Database.” 2020.
Aurora Energy Research. “Hydrogen market attractiveness report (HyMAR).” 2021.
ETC. “Making the hydrogen economy possible: accelerating clean hydrogen in an electrified economy.” Energy Transitions Commission. 2021.
CIMAC and Maritime Battery Forum. “Environment for the Use of Batteries in Deep-Sea Shipping.” 2024
Section 5
Roxana T. Shafiee, Daniel P. Schrag. “Carbon abatement costs of green hydrogen across end-use sectors.” Joule, Volume 8, Issue 12, 2024, Pages 3281–3289. 2024.
Section 6
ABS, CE Delft and Arcsilea. “Potential of Wind-assisted Propulsion for Shipping.” 2023.
Cem Guzelbulut, Timoteo Badalotti, and Katsuyuki Suzuki. “Impact of Control Strategies for Wind-Assisted Ships on Energy Consumption.” Brodogradnja 76 (1): 1–14. 2024.
Bimpikis Kostas, Giacomo Mantegazza, and Salomón Wollenstein-Betech. “Market Fragmentation and Inefficiencies in Maritime Shipping.” Proceedings of the 25th ACM Conference on Economics and Computation, July, 3–3. 2024.
ABS, Texas A&M University, ARCSILEA. “Potential Use of Nuclear Power for Shipping.”