CONFERENCE DATA SUMMARY

Prepared Exclusively For: © 2023 Association of African American Financial Advisors | 1050 Connecticut Ave. Suite 500| Washington DC 20036 |(202) 572-1019 AAAA 2023 NATIONAL V.I.S.I.O.N.
Conference Registration
• 1,100+ General Registrations
⚬ (140+ Executives, 90+ Speakers)
⚬ (552+ Licensed B/AA Professionals + 322 Next Gen./Career Changers)
• 111% Increase from 2022
04
• 55 Sessions
⚬ 23 C.E. Eligible Breakout Sessions

⚬ 21 Professional Development Breakout Sessions


⚬ 11 General Sessions
02 Conference Session Data Corporate & Strategic Partners
• 32 Corporate & Strategic Partners

• 25 Corporate Partners
• 7 Strategic Partners
• 322 Registrations (Next Gen & Career Changers)
⚬ 23 Colleges & Universities
⚬ 4 HBCUs in Attendance
*Note: AAAA’s 2023 V.I.S.I.O.N. conference saw a 111% increase in attendance numbers compared to AAAA’s 2022 V.I.S.I.O.N. conference attendance numbers.


Demonstrating the rising prominence and value of AAAA’s professional development conferences, attendance numbers have seen an outstanding leap year over year. For example, in 2022, AAAA welcomed a substantial inperson audience of 525 attendees to our annual V.I.S.I.O.N. conference in Atlanta, GA.
In 2023, AAAA more than doubled it’s record 2022 attendance numbers, with attendance numbers eclipsing of over 1,400 participants combined*, at AAAA’s regional and annual V.I.S.I.O.N. conferences. This 111% increase YoY not only reflects the growing interest in AAAA’s professional development conferences but, also reinforces our commitment to delivering unparalleled value to our attendees.

*Note: 2023 Attendance numbers include 2 Regional Conferences.
*Note: Virtual Conferences occurred during pandemic years 2020 & 2021.
AAAA’s V.I.S.I.O.N. Conferences serve as a platform for diverse representation within the Financial Services industry. Demographic data from the attendance shows, 87% were Black/African-American, , 8% Hispanic or Latinx, 4% White/Eastern European and 1% Asian/Pacific Islander highlighting a need for a big tent approach to expanding access to the Financial Services Industry.
/NATIONALITY
BLACK/AFRICAN-AMERICAN HISPANIC/LATINX

The gender distribution was notable as well, 43% of attendees identified as female, showcasing the rising influence of black women in the financial sector. Male attendees comprised 57%, emphasizing the continuing role of black male professionals. The data portrays a comprehensive picture of the conference's commitment to inclusivity and the evolving landscape of the industry.
43% Female Attendees
WHITE/ EASTERN EUROPEAN
57%
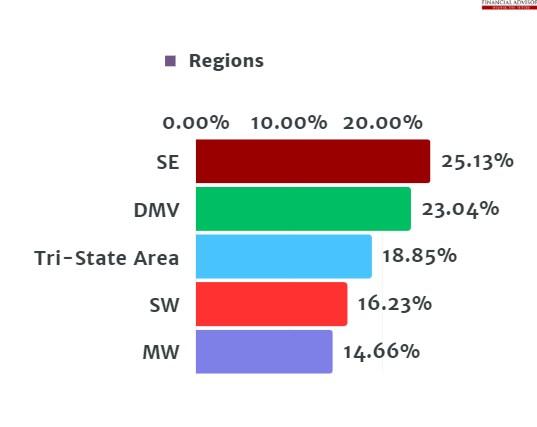
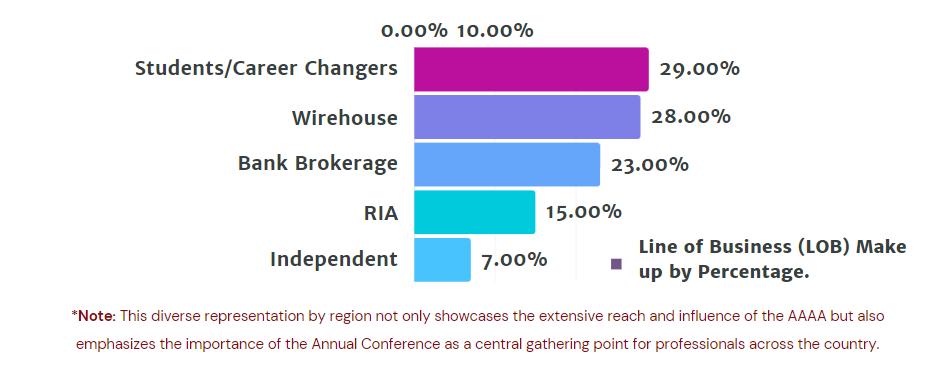
We observed a diverse regional participation that enriched the overall experience. Leading the pack were attendees from the Southeast (SE) region, constituting 25.13% of the total attendees. They were closely followed by those from the DMV (DC, Maryland, and Virginia) area, who comprised 23.04% of the participants. The Tri-State Area, covering New York, New Jersey, and Pennsylvania, contributed to 18.85% of the attendees. Meanwhile, the Southwest (SW) region was represented by 16.23%, and the Midwest (MW) brought in 14.66%.
*Note: This diverse representation by region not only showcases the extensive reach and influence of the AAAA but also emphasizes the importance of the Annual Conference as a central gathering point for professionals across the country.

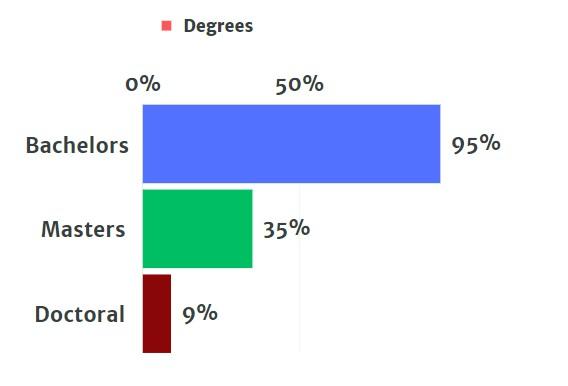
Degrees & Advanced Certifications of Licensed B/AA Professionals in Financial Services
Educational qualifications of AAAA’s 2023 V.I.S.I.O.N. conferences attendees represent the depth and breadth of academic achievements represented by B/AA professionals in the financial services industry.
A summary of educational attainment showsofV.I.S.I.O.N.conferenceattendees
95% holda Bachelors degree
35% with Masters degree
9% obtaineda Doctoral degree
*Note: The presence of these degrees and advanced certifications not only underscores the commitment of our members to continual learning but also emphasizes the value they bring to the industry.
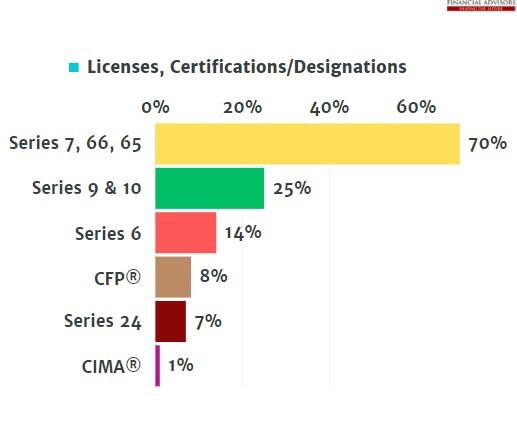
The data aggregated from registration to AAAA’s V.I.S.I.O.N. conferences reveals key insights regarding licensed B/AA Professionals in the Financial Services Industry.
In summary:
70% of attendees had Series 7, 66, or 65 securities licenses
25% of attendees had the Series 9 & 10 securities licenses
7% had the Series 24 securities license
8.2% had the Certified Financial Planners (CFP®)
1% of attendees had the Certified Investment Management Analyst (CIMA®) designation.
These data points underscore opportunities available to increase the numbers of B/AA financial professionals eligible for leadership roles in the Financial Services Industry.
*Note: AAAA’s network of qualified professionals not only showcases the depth of expertise but also signifies the potential of Black/African American financial advisors in driving strategic industry transformations.

*Note: The Career symposium gives career changers and next gen. talent opportunities to interact with many of AAAA’s corporate Partners.


AAAA V.I.S.I.O.N. conferences attracts a college students and career changers. AAAA also reviews majors of students and has tracks majors of students interested in careers in Financial Services.
CHARTSUMMARY
A visual of attendance for students and career changers
86% CAREER CHANGERS
STUDENTS
A visual of College majors represented at AAAA’s V.I.S.I.O.N. conference by students and career changers
24%