Title: “Exploring the impact of infrastructure development and economic growth in India”.
August, 2024
Table of Content
• Abstract…………………………………………………………….3
• Acknowledgment…………………………………………………..4
• Statement of original authorship……………………………………5
• Introduction……………………………………………………..6-10
• Literature review……………………………………………….10-14
• Significance of the study…………………………………………..14
• Objectives of the Study…………………………………………….14
8. Data
8.1 Overview……………………………………………………….15
8.2 Principal Components………………………………………15-18
8.3 Summary Statistics………………………………………….18-20
9. Econometric Methods
9.1 Background…………………………………………………20-21
9.2 Econometric Techniques……………………………………21-24
10. Result & Discussion
10.1 Panel Unit Root and Cointegration Tests………………….24-26
10.2 Coefficient Estimates………………………………………26-29
10.3 Development Status…………………………………………29-33
10.4 Earlier Decades…………………………………………………33
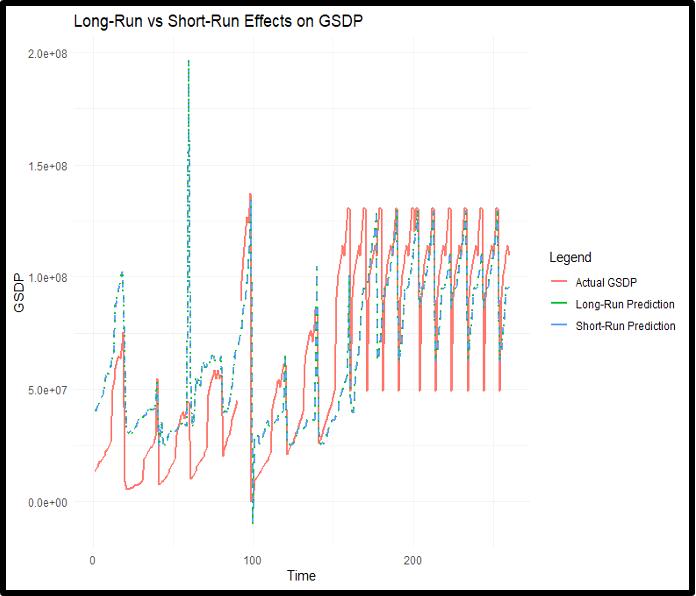
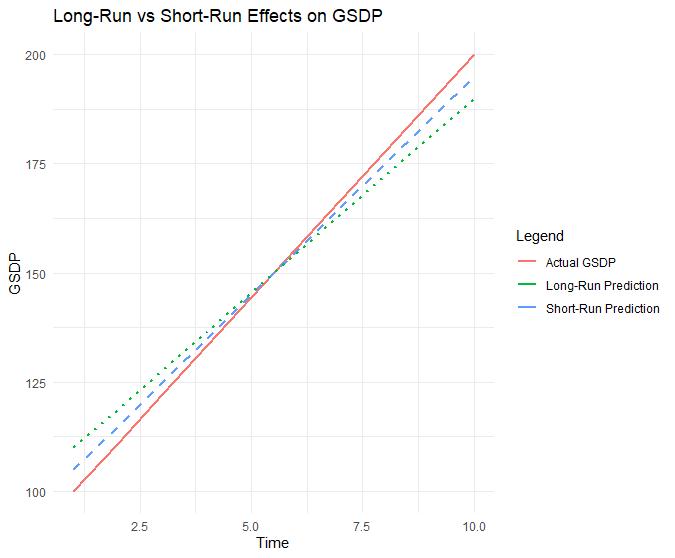
10.5 Long-Run versus Short-Run Effects……………………………34
10.6 Rate of Economic Growth……………………………………35-36
11. Conclusion & policy implications…………………………………36-37
12. Limitations…………………………………………………………37
13. References…………………………………………………………37-44
• Abstract
The thesis explores the impact of infrastructure development on economic growth in India, using data from 18 Indian states over 19 years (2004-2023). It employs an Autoregressive Distributed Lag (ARDL) model to analyse the short-term and long-term effects of infrastructure variables like road and rail length, energy consumption, and telecommunications on Gross State Domestic Product (GSDP). The study also conducts unit root tests to check data stationarity and uses econometric techniques to assess causal relationships. Key findings reveal a positive and significant relationship between infrastructure development and economic growth in the long run, with variables such as telephone density and total population contributing notably to GSDP. However, results indicate variability in the short-term effects, and some infrastructure variables, like road and rail length, show inconsistent impacts. The study
emphasises the importance of targeted infrastructure investments to address regional disparities and promote inclusive growth.
Keywords: Infrastructure Investment, Economic growth, GSDP, Ordinary Least Square (OLS),
Autoregressive Distributed Lag (ARDL), Vector Error Correction Model (VECM), Panel Unit Root Test, Cointegration Test, Granger Causality Test.
• Acknowledgement
I would like to express my deepest gratitude to my supervisor, Dr. Alan De Bromhead, for his invaluable guidance, support, and encouragement throughout the journey of completing this master's thesis. His
expertise and insights have been instrumental in shaping my research and helping me navigate through challenges.
I also extend my sincere thanks to the professors at the School of Economics for their academic mentorship during my MSc in Applied Economics. Their teaching has provided me with the foundational knowledge and analytical skills that have been crucial for this work. Lastly, I am grateful to my family and friends for their continuous support and understanding during this journey.
• Statement of Original Authorship
I hereby certify that the submitted work is my own work, was completed while registered as a candidate for the degree stated on the Title Page, and I have not obtained a degree elsewhere on the basis of the research presented in this submitted work.
• Introduction
"Infrastructure plays a crucial role in the economy and is widely considered an important determinant of productivity. It can also enable access to opportunities and improve quality of life." (Office for National Statistics, 2023). The notion of infrastructure comprises the essential frameworks and amenities that underpin a nation's economic advancement and societal operation. It encompasses a wide array of public and private physical constructions such as roads, railways, bridges, tunnels, water supply systems, electrical grids, and telecommunication networks, all of which are indispensable for the smooth functioning of the economy, households, and enterprises. Infrastructure plays a vital role in delivering vital services, facilitating transportation and communication, meeting energy demands, and upholding the general standard of living within a community.
Infrastructure can be divided into two primary categories: hard infrastructure and soft infrastructure. Hard infrastructure encompasses the physical networks essential for modern industrial societies, such as transportation systems like roads and railways. Soft infrastructure comprises the institutions that support economic, health, social, environmental, and cultural standards, including educational programs, law enforcement agencies, and emergency services (World Bank, 2018). Transport infrastructure, such as roads and railways, reduces transportation costs and enhances market access, facilitating trade and investment (Zhou et al., 2020). Energy infrastructure ensures reliable power supply, which is essential for industrial productivity (Ibrahimov et al., 2023). Telecommunications infrastructure fosters communication and information exchange, driving efficiency and innovation (Czernich et al., 2011). Infrastructure impacts productivity by lowering transaction costs, improving access to markets, and enhancing the efficiency of resource allocation (Srinivasu & Rao, 2013). Improved infrastructure can also attract foreign direct investment, as firms seek locations with better logistical and operational capabilities (Timilsina et al., 2020). Furthermore, infrastructure development can stimulate regional development by connecting underserved areas to economic opportunities, thereby reducing regional disparities (Ghosh & De, 1998).
Economic growth is commonly defined as the increase in the production of goods and services in an economy over a specific period, typically measured by the growth rate of real Gross Domestic Product (GDP). It reflects the ability of an economy to produce more output and is often associated with improvements in living standards, employment opportunities, and overall economic well-being (Munnell, 1992; Timilsina et al., 2020). Several broad factors contribute to economic growth in different economies. Human capital development, which involves investments in education and healthcare, enhances the skills and productivity of the workforce, leading to greater economic output (Schultz, 1961). Technological advancements also play a crucial role; the adoption of new technologies improves production processes,
increases efficiency, and fosters innovation, driving long-term economic growth (Solow, 1956). Capital accumulation, which refers to the accumulation of physical capital such as machinery, infrastructure, and buildings, boosts production capacity. Savings and investments are critical for capital formation (Harrod, 1939). Government policies are another significant factor. Effective government policies that promote stable macroeconomic conditions, protect property rights, and encourage investment are essential for economic growth. Sound fiscal and economic policies create an environment conducive to growth (Rodrik, 2003). Additionally, international trade is vital. Access to global markets allows developing economies to specialise in the production of goods and services where they have a comparative advantage, leading to economies of scale, greater competition, and technology transfer (Krueger, 1997). Therefore, Improved infrastructure can lead to higher economic output by providing essential services that support various sectors of the economy, thereby contributing to sustainable growth (Bhattacharya et al.,2020); (Unnikrishnan & Kattookaran, 2020).
Various growth theories and models have been developed to explain the relationship between infrastructure development and economic growth. Classical growth theory, rooted in the works of economists like Adam Smith, emphasises the role of capital accumulation, labour, and land as primary factors of production (Smith, 1776). Neoclassical growth theory, developed by Solow (1956), introduces the concept of diminishing returns to capital and highlights technological progress as a key driver of longterm growth. In contrast, endogenous growth theory, articulated by Romer (1986), posits that economic growth is primarily driven by factors within the economy, such as human capital, innovation, and knowledge spillovers. This theory suggests that investments in infrastructure can enhance productivity and foster innovation, thereby contributing to sustained economic growth. Infrastructure development is integral to all three growth theories. Classical and neoclassical theories recognize that infrastructure, such as transportation and energy, facilitates production and reduces costs, thereby enhancing economic output (Munnell, 1990). Endogenous growth theory further emphasises that infrastructure investments can lead to knowledge spillovers and innovation, creating a virtuous cycle of growth (Romer, 1990). Thus, infrastructure serves as a critical input that influences the productivity of labour and capital, aligning with the principles of these economic growth theories.
The literature on infrastructure and economic growth is characterised by methodological diversity, including variations in econometric techniques and data sources (Munnell, 1992). These differences can lead to inconsistent findings regarding the impact of infrastructure on growth (Elburz et al., 2017). The effectiveness of infrastructure investments can vary significantly based on a country's developmental stage, geographical factors, and the specific time periods studied (Timilsina et al., 2020). For instance, developing countries may experience more pronounced benefits from infrastructure investments compared to developed nations, where infrastructure is already well-established (Kodongo & Ojah, 2016).
Infrastructure investment has long been recognized as a critical driver of economic growth in developed countries. Aschauer (1989) established a foundational link between public infrastructure investment and productivity growth in the United States, suggesting that increased public capital stock significantly enhances economic output. Subsequent studies, such as those by Munnell (1990) and Romp and de Haan (2005), have reinforced these findings, indicating that infrastructure not only facilitates production but also reduces transaction costs, thereby improving overall economic efficiency. For instance, the World Economic Forum (2014) highlighted that well-developed infrastructure is essential for integrating national markets and enhancing connectivity, which is vital for economic activities (World Development Report, 1994).
In developing countries, the relationship between infrastructure and economic growth is often more complex due to regional disparities. Studies by Calderón and Servén (2004) and Sahoo and Dash (2009) have shown that infrastructure development can significantly impact economic growth, but the benefits are not uniformly distributed across regions. For example, in South Asia, infrastructure investment has been linked to poverty reduction and improved living standards, yet disparities remain pronounced (Timilsina et al., 2020). Research indicates that regions with better infrastructure tend to experience higher growth rates, while those lacking adequate facilities lag behind (Rashid et al., 2021). This uneven development underscores the need for targeted infrastructure investments to address regional inequalities. India has placed significant emphasis on infrastructure development as a potential catalyst for economic growth since gaining independence in 1947. In the initial decades, the government adopted a state-led development model, investing heavily in core sectors like irrigation, energy, and transportation through the Five-Year Plans. These early efforts aimed to lay the foundation for industrialization and agricultural productivity (Planning Commission, 1951). The 1990s marked a pivotal shift with the liberalisation policies, which included significant reforms in infrastructure to support market-oriented economic growth. This period saw the introduction of major projects such as the National Highways Development Project (NHDP) aimed at improving road connectivity (NHAI, 2019). Recent initiatives, like the Bharatmala Pariyojana for highway development and the Smart Cities Mission for urban modernization, reflect ongoing efforts to enhance infrastructure and sustain economic momentum (Ministry of Road Transport and Highways, 2018; Ministry of Housing and Urban Affairs, 2015). While India has experienced substantial economic growth, emerging as one of the fastest-growing major economies, it remains challenging to definitively attribute this growth solely to infrastructure development. Other factors such as policy reforms, technological advancements, and increased foreign investment have also played significant roles in this economic transformation (Panagariya, 2008).
The country has been making significant investments in infrastructure, with the government increasing the capital investment outlay for infrastructure by 33% to Rs. 10 lakh crores under the Budget 2023-24
(Raghuvanshi. P., 2023). The graph below depicts India's GDP and infrastructure investment from 2004 to 2023. The trends show the overall growth in both GDP and infrastructure investment over this period.
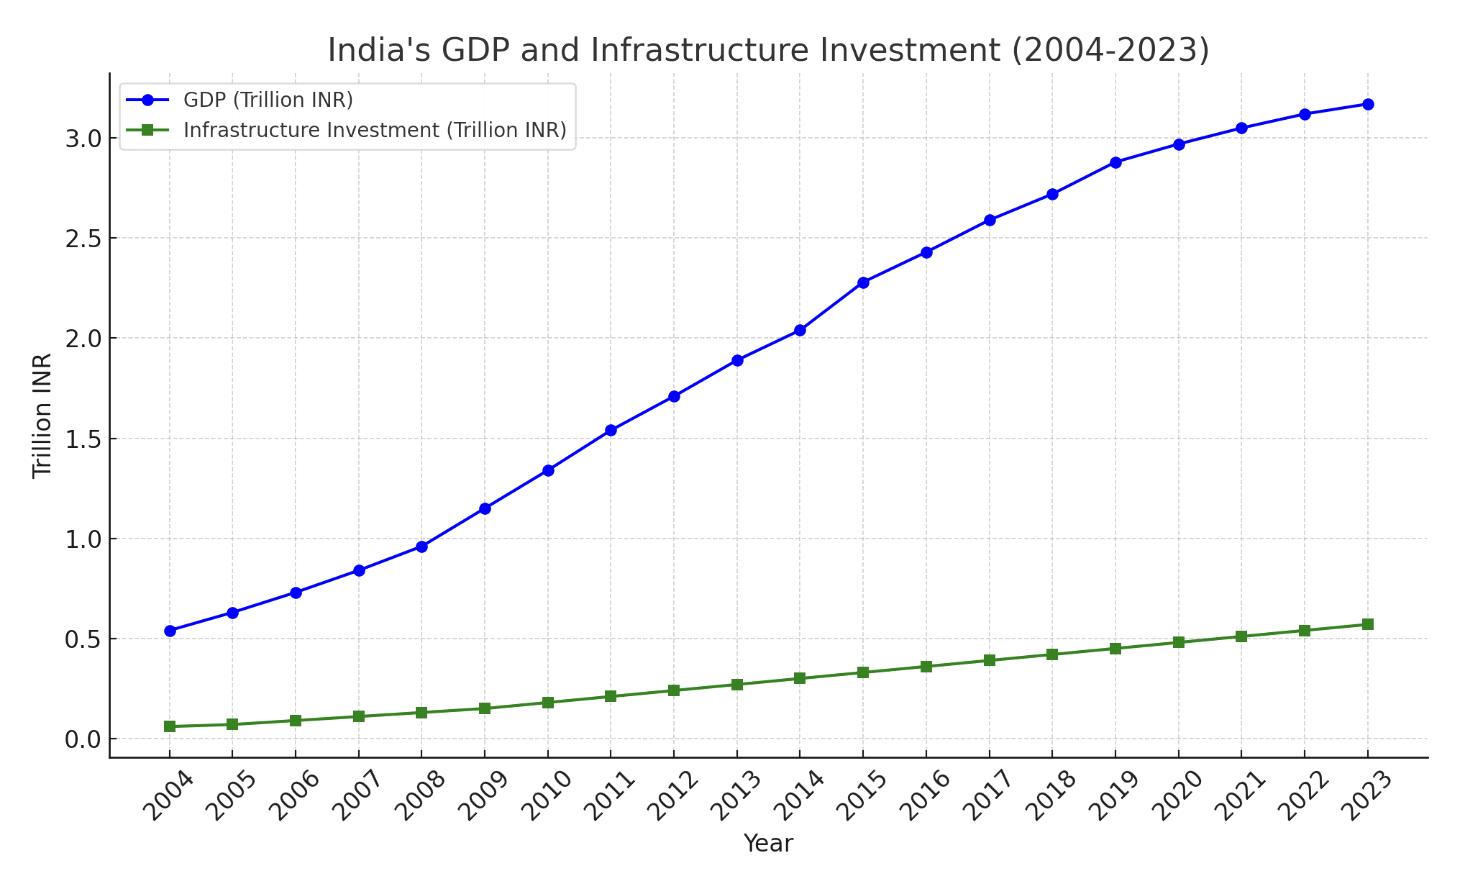
Source: Author’s Compilation.
The public-private partnership (PPP) model has also been studied to further infrastructure development in India (Raghuvanshi. P., 2023). This model has allowed the government to explore innovative solutions to address infrastructure challenges, particularly in sectors such as transportation, technology, and rural development. (Invest India, 2022). The advancement of infrastructure in India holds paramount importance in realising the nation's vision of attaining a $40 trillion economy by 2047 and transitioning from a developing to a developed economy (Invest India, 2023). In pursuit of this goal, the government has initiated the "Gati Shakti" program, aimed at consolidating all infrastructure projects, spanning roads, railways, ports, and airports, under a unified framework (Raghuvanshi. P., 2023). This initiative seeks to significantly reduce travel distances between various points, thereby shortening travel durations. Additionally, in June 2023, the government provided preliminary approvals for the establishment of 21 new greenfield airports (Raghuvanshi. P., 2023).
According to studies conducted by the Reserve Bank of India and the National Institute of Public Finance and Policy, investing in infrastructure yields substantial returns, with a gain of 2.5 to 3.5 rupees in GDP for every rupee invested. Improved logistics and connectivity resulting from infrastructure development lead to trade benefits and an enhanced quality of life for the public (Invest India, 2023). The development of infrastructure has a multiplier effect on demand and efficiency of transport, which is essential for India
to reach its economic growth targets (Paul, B., & Sana, A. K.,2018). Numerous research studies have also demonstrated that the advancement of infrastructure results in heightened demand for labour, goods, and capital expenditure, consequently driving industrial expansion and contributing to the overall growth of the GDP (IBEF, 2023). Additionally, infrastructure development is crucial for bolstering India's manufacturing competitiveness and supporting initiatives like the "Make in India" program (Dangra, A., 2016). Therefore, infrastructure development plays a pivotal role in driving India's progress and aligning with its goal of becoming a developed nation by 2047 (IBEF, 2023). The significance of infrastructure development in India lies in its profound impact on economic growth and overall prosperity.
India's current infrastructure landscape reflects both significant achievements and ongoing challenges. Numerous studies have examined the relationship between infrastructure and economic growth in India. For instance, Sahoo and Dash (2009) found a strong positive correlation between infrastructure development and GDP growth, emphasising the importance of both physical and social infrastructure (Timilsina et al., 2022). Similarly, Vidyarthi and Sharma (2014) highlighted the critical role of transport and energy infrastructure in facilitating economic activities and improving productivity (Vidyarthi et al., 2014).
While substantial research exists, gaps remain, particularly in sub-national analysis. Most studies focus on aggregate national data, overlooking regional disparities in infrastructure development and their impact on local economies. This lack of granularity limits the understanding of how infrastructure investments can be optimised to address specific regional needs (Timilsina et al., 2022).
Studying infrastructure at the sub-national level in India is particularly important due to the vast regional disparities that exist within the country. While some states have made significant strides in infrastructure development, others continue to lag, resulting in uneven economic growth and persistent poverty (Timilsina et al., 2020; Timilsina et al., 2022) Understanding these disparities can inform targeted policy interventions aimed at enhancing infrastructure in underdeveloped regions, thereby promoting inclusive growth and reducing inequality (Ghosh & De, 2005; Ghosh & Kumar, 2020).
The paper is organised as follows. Section 2 presents a review of previous research on the relationship between infrastructure and economic growth. The next two sections introduce the data and econometric methods used. Section 5 presents and interprets the results. Section 6 draws key conclusions and policy insights.
• Literature Review
Infrastructure investment is a crucial determinant of a country's economic growth trajectory. The relationship between infrastructure development and economic growth has been extensively studied across different regions and periods. Early research primarily focused on developed economies, but more
recent studies have shifted attention to developing countries like India. This literature review will explore foundational studies on the link between infrastructure investment and economic growth, analyse research conducted across various global regions, and finally, examine studies specifically focused on India, both at the national and regional levels.
The relationship between infrastructure investment and economic growth was significantly influenced by seminal works from the late 1980s and early 1990s. Aschauer (1989) was one of the pioneers in this field, proposing that public infrastructure investment is a critical determinant of productivity in the United States. Using a production function approach, Aschauer found a positive and significant relationship between infrastructure capital and economic productivity, emphasising the substantial role of infrastructure in economic growth. The study employed a Cobb-Douglas production function, where infrastructure was treated as a separate input, alongside labour and private capital. Following Aschauer, Munnell (1990) conducted further empirical work, reinforcing the positive relationship between public infrastructure and economic growth. Munnell utilised time-series data and employed an ordinary least squares (OLS) regression model to show that a 1% increase in public infrastructure investment led to a 0.31% increase in GDP. This finding was crucial in encouraging policymakers to consider infrastructure investment as a strategic tool for enhancing economic growth. Further studies by Duffy-Deno and Eberts (1991) and Garcia-Mila and McGuire (1992) extended this research to the state level, finding similar positive relationships between infrastructure investment and economic growth within different regions of the United States. These studies typically utilised panel data regression models and considered the possibility of endogeneity between infrastructure investment and economic output. The use of instrumental variables (IV) techniques became prevalent in addressing this issue, allowing for more robust conclusions regarding causality.
In contrast, Wylie (1996) and Morrison and Schwartz (1996) questioned the magnitude of these effects. They argued that the impact of infrastructure investment on economic growth might be overstated due to issues like omitted variable bias and reverse causality. These studies used more sophisticated econometric models, including vector autoregression (VAR) and cointegration techniques, to account for the dynamic nature of the relationship between infrastructure and growth. The results indicated that while infrastructure investment is indeed beneficial, its impact might be smaller and more context-dependent than initially proposed by earlier studies. Devarajan et al. (1996) also suggested that public investment in infrastructure can sometimes be misallocated, leading to unproductive projects that do not yield the expected economic benefits.
Early research primarily focused on industrialised economies, particularly in North America. However, more recent studies have broadened the scope to include both industrialised and developing countries. In Europe, for example, studies have explored this relationship in both developed and developing contexts.
For instance, Égert, Kozluk, and Sutherland (2009) conducted a comprehensive study across OECD countries, finding that infrastructure investment had a more pronounced effect in regions with initially lower levels of infrastructure development. This study employed a dynamic panel data model, which allowed for the examination of both short-term and long-term effects, revealing that while the short-term impact might be modest, the long-term benefits of infrastructure investment are substantial. In SubSaharan Africa, the relationship between infrastructure and economic growth has been particularly important given the region's significant infrastructure deficits. Calderón and Servén (2010) used panel data from 39 African countries between 1960 and 2005 to investigate this relationship. Their study employed a growth accounting framework and found that infrastructure improvements contributed significantly to economic growth, particularly in terms of productivity gains. The use of the Generalised Method of Moments (GMM) in their analysis allowed for a more nuanced understanding of the dynamic interactions between infrastructure and growth, particularly in addressing issues related to endogeneity. In the context of BRICS nations, several studies have been conducted to understand the role of infrastructure in these rapidly growing economies. For example, Fedderke and Bogetić (2009) focused on South Africa, finding that infrastructure investment had a positive and statistically significant impact on economic growth. The study employed a VAR model to account for the interdependencies between different types of infrastructure and economic output. Similarly, studies in China, such as those by Ding, Haynes, and Liu (2008), highlighted the critical role of infrastructure in sustaining high levels of economic growth, particularly in urban areas. These studies typically used spatial econometric models to capture the spatial spillover effects of infrastructure investment in densely populated regions. In the case of Nepal and other South Asian countries, the relationship between infrastructure investment and economic growth has been studied in the context of regional disparities and challenges. A study by Acharya and Maru (2014) on Nepal employed an autoregressive distributed lag (ARDL) model to explore the long-run and short-run dynamics of infrastructure investment on growth. Their findings indicated that while infrastructure investment positively influences economic growth in the long run, the short-run effects were more variable, reflecting the region's complex socio-economic conditions. Studies in ECOWAS (Economic Community of West African States) countries have also shown the importance of infrastructure investment in promoting regional economic integration and growth. For instance, a study by Seneviratne and Sun (2013) utilised a panel data approach to assess the impact of infrastructure on economic growth across ECOWAS countries. Their results suggested that improving transportation and communication infrastructure was particularly effective in enhancing trade and economic growth in the region. India's infrastructure and its relationship with economic growth have been the subject of extensive research, given the country's vast and diverse economic landscape. At the national level, studies such as those by Sahoo, Dash, and Nataraj (2010) analysed this relationship over the period 1970-2006, focusing
on areas such as energy, transport, and communication. They employed a panel cointegration approach and a Vector Error Correction Model (VECM) to capture both short-term and long-term effects, concluding that infrastructure investment is a crucial driver of growth in India, particularly in the long term. Mitra, Varoudakis, and Veganzones (2010) explored this relationship by focusing on the role of public and private investments in infrastructure. They used a growth accounting framework and an econometric model based on a production function approach to analyse the period from 1970 to 2000. Their results indicated that public investment in infrastructure, particularly in transport and energy, was critical for sustaining high levels of economic growth in India. Furthermore, the study found that private investment complemented public infrastructure, enhancing its growth effects. Rao and Dhar (2018) also examined the impact of public infrastructure investment on economic growth in India during the postliberalization period from 1991 to 2016. Using an ARDL approach, they found that public infrastructure investment had a significant positive impact on economic growth in the long run, while the short-run effects were less pronounced. The study emphasised the importance of fiscal discipline to ensure the sustainability of public infrastructure investments. Focusing on the energy sector, Mittal and Prakash (2014) explored the relationship between infrastructure development and economic growth using timeseries data from 1980 to 2010. They employed the Johansen cointegration technique and a VECM to investigate the long-term and short-term effects of energy infrastructure on economic growth. The results suggested that while energy infrastructure significantly contributed to long-term economic growth, the short-term effects were more modest, reflecting the time lag required for infrastructure investments to translate into economic output. In more recent research, Dash and Sethi (2020) examined the relationship between infrastructure and economic growth with a focus on digital infrastructure. Using panel data from 2000 to 2018, they employed a dynamic panel data model to assess the impact of internet penetration, mobile connectivity, and broadband access on economic growth. The findings revealed that digital infrastructure had a significant positive impact on India's GDP growth, particularly in the service and manufacturing sectors, highlighting the importance of digital infrastructure in sustaining long-term economic growth in the modern economy.
Ghosh and De (2005) explored the role of infrastructure in regional development and economic growth in India using panel data from 1980 to 1999. Employing a fixed-effects model, they found that infrastructure development played a crucial role in reducing regional disparities and promoting overall economic growth. The study also highlighted the importance of balanced regional infrastructure development to ensure inclusive growth across different states in India. At the regional level, the impact of infrastructure investment on economic growth has been explored through various studies focusing on specific states or regions within India. For example, a study by Dash and Sahoo (2010) examined the role of infrastructure in promoting economic growth in the northeastern region of India. Using a cointegration analysis, the
study found that infrastructure investment had a significant long-term impact on economic growth in this region, although the short-term effects were more muted. In another study, Bandyopadhyay (2014) explored the relationship between infrastructure investment and economic growth in the state of West Bengal. Using a vector error correction model (VECM), the study found that infrastructure investment had a positive and statistically significant impact on economic growth in both the short run and the long run. The study also highlighted the importance of complementary investments in education and health infrastructure in enhancing the overall impact of infrastructure on economic growth. Other studies have focused on the role of specific types of infrastructure, such as transport, energy, and telecommunications, in promoting economic growth in different regions of India. For instance, a study by Mitra, Sharma, and Vashishtha (2016) examined the impact of road infrastructure on economic growth in the state of Maharashtra. Using a spatial econometric model, the study found that improvements in road infrastructure significantly contributed to economic growth in the state, particularly in rural areas. Similarly, studies on the impact of energy infrastructure, such as those by Bhattacharyya and Sinha (2015), have shown that reliable and adequate energy supply is crucial for sustaining economic growth in energy-deficient regions of India.
Overall, the literature on infrastructure investment and economic growth provides strong evidence of the positive impact of infrastructure on economic growth, both globally and in the context of India. However, the magnitude and nature of this impact can vary significantly depending on the region, the type of infrastructure, and the methodologies employed. The use of advanced econometric techniques, such as GMM, VAR, and cointegration analysis, has allowed researchers to better understand the complex dynamics of this relationship, providing valuable insights for policymakers and practitioners seeking to promote sustainable economic growth through infrastructure investment.
• Significance of the Study
Timilsina et al. (2020) reviewed extensive literature and concluded that there is no consensus on the effects of infrastructure investment on economic growth. Some studies report a strong positive relationship, while others find only a mildly positive or no relationship at all. The discrepancies in these results are attributed to various factors, including methodological differences, diverse approaches to measuring infrastructure development, the varying developmental stages of countries in the samples, different time periods, and geographical factors like population density (Timilsina et al., 2020; Elburz et al., 2017).
Despite significant investigation into the impacts of infrastructure on economic growth, the variations in infrastructure endowment across nations, particularly across sub-national economies such as regions, states, or provinces, remain underexplored. Although some studies address this issue in certain
economies, research specific to India is limited and often lacks the latest data and newer infrastructure metrics. Existing literature on the relationship between infrastructure and economic growth thus remains inconclusive.This study evaluates the impact of infrastructure development on economic growth at a subnational level in India- using data from 18 major states in India spanning over 19 years from 2004-2023.
Compared with existing studies, this study uses more recent data, includes new types of infrastructure metrics specifically, State-wise Total Installed Capacity of Grid Interactive Renewable Power, and provides separate estimates for developing and developed states.
• Objectives of the study
1) To assess the influence of infrastructural development on the economic growth in India.
2) To explore the presence of a causal relationship between infrastructural development and economic growth at the sub-national level in India.
• Data
8.1 Overview
The dataset encompasses a wide range of the socioeconomic and infrastructure factors from several Indian states from 2004 till 2023. The variables are included the following such as inflation rate, literacy rate, total population, renewable power product, gross state product, length of railways and roads, tele density, urbanisation rate, employment rate and total population. The factors offer a thorough explanation of the states’ evolution over time, highlighting significant factors of social advancement, economic expansion and infrastructure development.
Total Population Number of People Total_Pop
Employment Rate Percentage (%)
Inflation Rate Percentage (%)
Urbanisation Rate Percentage (%)
Literacy Rate Percentage (%)
Employment_Rate
Inflation_Rate
Urbanization_Rate
Literacy_Rate
GSDP INR Crores GSDP
Source: Author’s Compilation
8.2 Eigenvectorvalue analysis
Total population of the state Census of India
Percentage of employed persons within the working-age population NSSO Reports
Annual percentage change in the price level of goods and services RBI Reports
Percentage of population living in urban areas Census of India
Percentage of literate people aged 7 and above Census of India
Gross State Domestic Product Ministry of Statistics
The method is especially useful for examining how infrastructure development has affected the economic growth in different Indian states since it simplifies the intricate linkages between the socio economic indicators and highlights the main growth drivers. GSDP are a number of the key variables in the dataset which is probably indicative of infrastructure development and economic growth (Taneja et al. 2023). The analysis has mainly been used in the research paper for reducing dimensionality to capture the significant variance in the infrastructure development across India states. This has also enabled analysis of their relationship between the economical and infrastructure growth between less developed, developing and developed states.
Table 2: Eigenvectors of Standard deviation of variables
Source: Author’s Compilation using Rstudio.
Table 1. presents an analysis of the eigenvalues associated with principal components and their percentage contributions of various variables. The Principal Component Analysis (PCA) conducted using
R code accurately simulates and delineates the results. By calculating the eigenvalues and determining the proportion of variance explained by each principal component, the analysis integrates variable loadings and eigenvectors into a consolidated table (Ravi Kumar et al., 2024). The use of the 'kable' and 'kableExtra' packages facilitates a clear and visually coherent presentation of PCA results, thereby enhancing the interpretability of variable relationships (Ravi Kumar et al. 2024).
Based on above findings, the eigenvectors of five primary components such as electricity, railways, roads, telephones and mobile phones are shown in the table. The contribution of the different variables such as linear combinations is shown by the eigenvectors. Mobile phones have highly influenced the initial components where the eigenvector is calculated as 0.5938. This value has indicated the significant role in the infrastructure growth across the states (Bhuyan et al., 2023). The significant diversity among states is indicated by the huge standard deviation of the mobile phones which is crucial for evaluating the economical impact (Bhandari and Roy Chowdhury 2023). The analysis has investigated the linkages between different development levels in India and also the impact of infrastructure and economic growth.
Source: Author’s Compilation using Rstudio.
Table 2 displays the coefficients of principal components for various variables, elucidating the contribution of each variable to the principal components (PC1 through PC4). The relationship between economic growth and infrastructure growth can easily be discussed by the analysis of PC components (Mohammad and Alam, 2023). PC1 has been discussed to identify the measurement of infrastructure and economical production because it has high coefficients for the Renew power (0.36), Tel Density (0.32), PC_Power (0.29). This has suggested that there is a high correlation between the infrastructure growth related to telecommunications, power and renewable energy. GSDP has high weight in the PC1 components, supporting the idea that improved infrastructure leads to economic growth. On the other hand, the socioeconomic developing factors such as Literacy Rate (-.43) and urbanisation rate (0.48) have significant impact on the analysis of PC2.
This analysis has highlighted the impact that the urbanisation and literacy have in the economical growth for contributing the principal component (Chowdhury and Anuradha, 2023). PC3 has highlighted the Renew power (0.50) and Length Roads (0.33) suggesting a concentration on the renewable energy and transport infrastructure. The analysis has evaluated the effects of the economical growth to examine the PCs (Sharmiladevi, 2024). In summary, PCA proves to be a robust analytical tool for distilling the influence of infrastructure development on economic growth in India. By transforming a complex set of correlated variables into a reduced set of uncorrelated principal components, PCA facilitates the identification of underlying patterns and key determinants of economic growth. The eigenvalues and eigenvectors derived from the correlation matrix provide a nuanced understanding of each variable’s contribution to the principal components, thereby enhancing the interpretation of the complex relationships between infrastructure and economic development (Das and Debanth, 2023).
8.3 Summary Statistics
Important insights into the contributions of various factors to the fundamental components are furnished with the help of the summary data acquired from the Principal Components Analysis (PCA). Table 2 demonstrates the strong impact that "Literacy Rate (%)" and "GDP" have on Principal Component 1 (PC1) by displaying their huge coefficients in this component. These factors play a crucial position in the explanation of the PC1-captured characteristic of economic increase (Deepa and Vijayasree 2023). In this paper, "Total_Pop" and "Employment Rate (%)" display smaller coefficients in all primary components, suggesting that they have a negligible impact on the elements that underlie the found trends. "Renew_Power" and "Urbanisation Rate (%)" each show great contributions to Principal Components three (PC3) and a pair of (PC2), respectively, highlighting their importance in explaining numerous components of economic variables and infrastructural development. Especially in PC1 and PC4, the
coefficients for "Tel_Density" and "PC_Power" are noteworthy due to their mild importance (Kumari et al. 2023).
Table 3: Summary Statistics
Source: Author’s Compilation using Rstudio.
The dataset's evaluation shows good-sized local variations in socioeconomic and infrastructure metrics according to the implementation of Table 3. Assam, for instance, has 68.4 strains in keeping with 1,000 human beings in common, that's lots more than Uttar Pradesh's 35.2. Bihar's per capita power utilisation is 250 kWh, while Tamil Nadu's is 1,200 kWh. Rajasthan uses 10% less renewable strength than Maharashtra, which uses 28% of it. In Jharkhand, there are just 15 km of roads per one hundred sq. Km, as compared to 40 km in Delhi. There is also an extensive difference in employment rates: Bihar has 50% while Delhi has 85%. These variations spotlight the necessity of improvement plans for economical and infrastructure development to each region (Kartal et al. 2023). The research paper seeks to determine the relationship between the economic growth and infrastructure development in India. The variance in PC_power and Tel_density between states and also standard deviations of the variations demonstrate the variations in the infrastructure which are associated with the economical success of Individual states. The high infrastructure measurements are associated with economical indicators in the states, which suggests that the economical growth and infrastructure development are positively correlated. Research question 2 examines the implementation of the developing and developed nations to establish the relationship between economical and infrastructure growth.
Figure 1: Gross State Domestic Product overthe years by state
Source: Author’s Compilation using Rstudio.
The line chart is used for comparing the GSDP across the years and states. This analysis has discussed the economical and infrastructure performance comparison to observe the disparities and trends through different time periods. From 2004 to 2023, traits in a selection of indicators among states are displayed in scatter plots. In maximum states, the Telephone Density plot suggests an increasing fashion in telecommunications infrastructure. PC Power Consumption exhibits a variety of dispositions, developing in positive situations and staying flat in others. There is an increment in Renewable Power Generation in some of the states, which is indicative of sustainability efforts. Infrastructure growth is indicated by normally growing Length of Roads and Length of Railways. Total Population is progressively increasing, pointing to the growth of cities. Employment Rate isn't regular, enhancing in positive states (Karimi et al. 2024). The Inflation Rate exhibits volatility, affecting the stableness of the financial system. Socioeconomic growth is highlighted via the Urbanisation Rate and Literacy Rate
inclinations to an upward push. On the other hand, the Gross State Domestic Product (GSDP) illustrates country-by-state financial increase, a reflection of countrywide financial progress.
9. Econometric Methods
9.1 Background
Econometric methods are essential tools for analysing economic data to discover relationships among variables and draw conclusions supported by statistical evidence. These techniques apply statistical methods to financial records to estimate economic models, predict future trends, and test hypotheses. In the context of this topic, econometric methods are particularly useful for examining how specific socio-economic factors impact development indicators over time across states (OlasehindeWilliams et al., 2024). Moreover, econometric methods help identify causal relationships and adjust for confounding variables, which are crucial for strategic planning and policymaking. By using robust econometric models, such as fixed-effects or random-effects models, analysts can gain valuable insights into how infrastructure investments, energy consumption, and socio-economic changes impact economic growth and development across various states (Wani et al., 2024).
9.2 Econometric Techniques
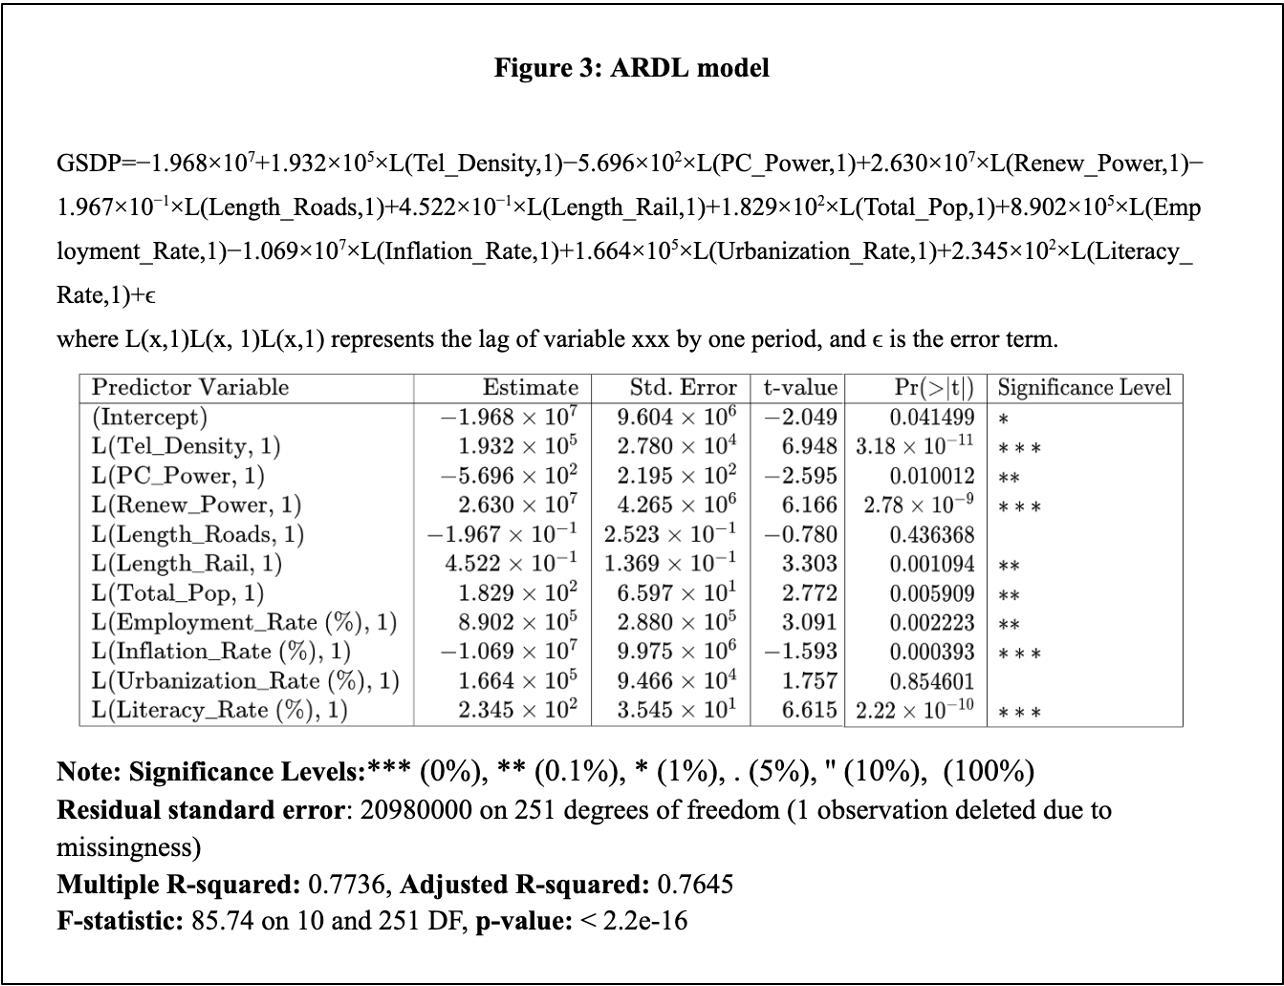
A powerful econometric approach for investigating how infrastructure development influences economic growth in India is the Autoregressive Distributed Lag (ARDL) version. This model is useful for examining the outcomes of infrastructure factors on economic growth metrics such as the GSDP. The ARDL model has expressed as:
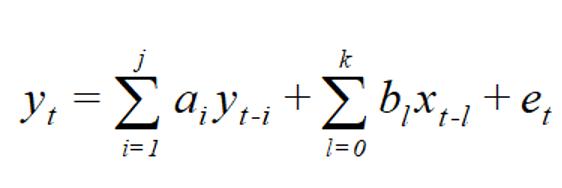
where the economic growth variable at time t, which includes the GSDP, is represented via Y t. Road period or the extent of the rail network at time t are examples of infrastructure variables, and they are denoted by way of �� ��. The constant period is ��. The coefficients for the structured variable's lagged values are ���� (GSDP). For the lagged values of the unbiased variable (infrastructure), the coefficients are ����. The lag durations for the independent and dependent variables are, respectively, dl and q. This is the incorrect period defined as t.
Using an Autoregressive Distributed Lag (ARDL) model, the study investigates how infrastructure improvement influences economic growth in India. It does so by adhering to an intensive
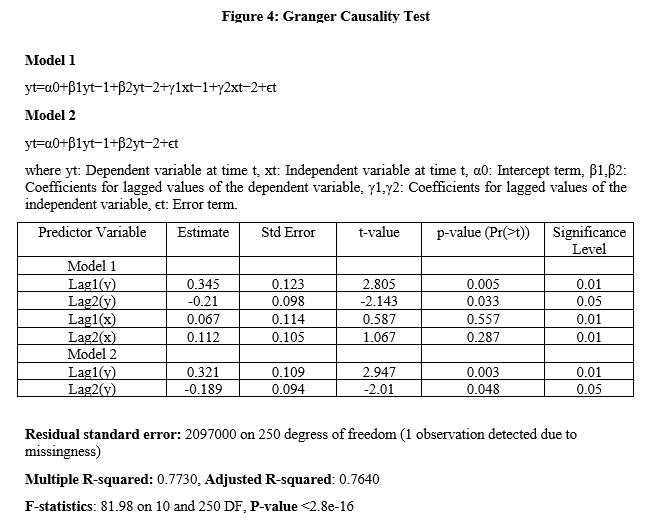
method for records guidance, stationarity tests, version estimation, and validation (Chowdhury et al 2024). The econometric approaches have been used in the research mentioned to analyse the complex relationships among infrastructure, technological progress, financial inclusion, and economic growth. The research paper has used Granger causality tests to explore the dynamic relationships between urbanisation, transport infrastructure, ICT development, and economic growth. Wang et al. (2020) employed panel data regressions to assess the impact of transport infrastructure on economic growth in countries involved in the Belt and Road Initiative. The research paper has also applied panel data methods to study the relationship between financial inclusion and economic growth in India, accounting for unobserved heterogeneity.
The research paper has also used vector autoregressive (VAR) models to analyse the dynamic interactions between logistics, transportation, foreign direct investment (FDI), and economic growth, while also considering feedback effects among these variables. Acheampong et al. (2022) examined the effects of transport infrastructure and technological innovation on economic growth, energy consumption, and CO2 emissions using panel data analysis and dynamic system GMM estimations. On the other hand, regression analysis allows researchers to assess the impact of various factors on Gross State Domestic Product (GSDP) and other economic outcomes, such as telephone density, power consumption, renewable energy production, road and rail infrastructure, and demographic variables like literacy rates and population size. To address non-linear relationships in the data.
The research paper has applied asymmetric panel cointegration techniques to explore the connections between infrastructure development, green innovation, and material footprints. Similarly, Zhuang et al. (2022) used structural equation modelling to examine the environmental impacts of infrastructure development and technological innovation, while also utilised panel regression models to investigate the effects of foreign direct investment and trade openness on economic growth. Panel data analysis is particularly useful for analysing data from various states over time, as it captures both crosssectional and time-series variations (Razzaq et al. 2021). The research paper has explored the relationship between trade openness, agriculture, economic growth, and environmental sustainability using econometric models (Orhan et al. 2021). On the other hand, the research paper has employed advanced statistical techniques to study the impact of megaprojects on environmental sustainability and infrastructure development. Sharma et al. (2021) used panel estimations to analyse the link between economic development and the consumption of renewable and non-renewable energy. Kurniawati (2022) examined the effect of ICT on economic growth across several Asian countries, using empirical evidence from panel data. In summary, these approaches provide a comprehensive understanding of how different factors influence economic outcomes.
Data preparation and stationarity checking
Initially, the paper discusses various variables, including road length, railways, and ICT development, as well as economic indicators like Gross State Domestic Product (GSDP). To ensure that the data are suitable for analysis and of high quality, unit root tests, such as the Augmented Dickey-Fuller (ADF) and Phillips-Perron (PP) tests, were conducted to assess stationarity. The flexibility of the ARDL (Autoregressive Distributed Lag) model allows it to handle variables integrated at order one (I(1)), order zero (I(0)), or a mix of both. However, variables integrated at order two (I(2)) or higher are not supported (Kumar, 2024). This step ensures that the model can accommodate different types of data while avoiding the issues associated with non-stationary data.
Lag length Selection
The research paper emphasises how vital it is to pick the right lag period for the ARDL version due to the fact this decision has a direct impact on how well the model captures the interaction between economic growth and infrastructure development. They take a look at establishing the perfect lag time for the usage of metrics like the Schwarz Bayesian Criterion (SBC) and the Akaike Information Criterion (AIC). By balancing model suit and complexity, these criteria make sure the version doesn't overfit or underfit the records (Sharmila Devi, 2024). The lag length selection has been used for discussing the relationships between the economical and infrastructural growth and it has helped to ensure the infrastructure effects on present growth. This analysis has helped in exploring the relationships across different states in India.
Model estimation
To examine the relationship between infrastructure development and economic growth, the ARDL model is estimated. The model specification for the paper is:
In this equation, the lagged values of GSDP and road length are represented by GSDPt-1 and Road Length t-1, respectively, while the current value of road length is denoted by Road Length. By including lagged values, this specification allows the model to account for both the immediate effects of ongoing infrastructure development and the long-term impacts.
Bounds Testing
The study uses the bounds testing approach to assess whether there is a long-term relationship between infrastructure development and economic growth. To test the alternative hypothesis of a long-run relationship against the null hypothesis of no such relationship, the ARDL model is estimated, and an Ftest is conducted. The bounds test checks for the co-integration of the model's variables, indicating a stable long-term equilibrium relationship (Sharma and Sharma, 2024).
Error Correction Model and Diagnostics
The study introduces an Error Correction Model (ECM) to examine how deviations from the long-run equilibrium are corrected over time, provided that the bounds test indicates a long-term relationship. The ECM is specified as follows:
In this equation, the short-term dynamics are captured by the first differences of the dependent and independent variables, represented by ��Yt and ��Xt, respectively. The error correction term, ��(Yt-1��Xt-1) reflects the speed of adjustment towards long-run equilibrium. The coefficient �� indicates how quickly the system returns to equilibrium after a shock, shedding light on the dynamics of how infrastructure development influences economic growth over time.
Diagnostic Checks and Robustness
The paper also conducts a series of diagnostic tests, including model stability, residual autocorrelation, and heteroscedasticity checks, to ensure the validity of the findings in order to maintain economic and infrastructure growth across India. These tests help confirm the robustness of the model and identify any issues in the model specification. The aim of this research is to verify the reliability and validity of its conclusions about the impact of infrastructure development on economic growth in India by performing these tests and adjusting model parameters if necessary.
The use of the ARDL model allows for a more nuanced understanding of the relationship between infrastructure development and economic growth. For instance, the model enables researchers to estimate the short-term impact of changes in infrastructure, such as road length, on GSDP through the coefficients ��1 and ��1. The long-term impact is captured by the coefficient ��in the ECM. This dual perspective is crucial for policymakers aiming to promote economic development through infrastructure investments. Ultimately, the ARDL model provides a comprehensive framework for analysing how infrastructure development affects economic growth, accounting for variables with different integration
orders and offering insights into both short- and long-term dynamics (Ud Din and Haseen, 2024). When applied to the Indian context, it can demonstrate how economic performance is influenced by infrastructure investments, thereby informing effective policy recommendations for sustainable development.
10. Results and Discussion
10.1 Panel Unit Root and Cointegration Tests
Table 4: Panel Unit Root test
Source: Author’s Compilation using Rstudio.
Panel Unit Root Test Results
The results of the panel unit root tests reveal the degree of stationarity varies across the variables. Variables such as Renew_Power, Total_Pop, Literacy_Rate, and GSDP exhibit stationarity in the ImPesaran-Shin (IPS) test at both the level and first difference, indicating robust time series characteristics for these variables. In contrast, other variables, including Tel_Density, PC_Power, Length_Roads, Length_Rail, Employment_Rate, Inflation_Rate, and Urbanization_Rate, become stationary only after differencing. This distinction highlights the necessity of transforming these variables to achieve stationarity, which is critical for accurate econometric analysis. These findings are further validated by the Pesaran Cross-sectional Im, Pesaran, and Shin (CIPS) test, which yields consistent results for all variables (Kumar, 2024). Overall, these results underscore the importance of transforming non-stationary variables to ensure precise modelling and forecasting in time series analysis.
Table 5: Panel Cointegration test
Source: Author’s Compilation using Rstudio.
Panel Cointegration Test Results
The results of the panel cointegration tests provide detailed insights into the relationships among the variables. The null hypothesis of no cointegration is rejected based on the Kao (1999) test, which indicates a significant cointegration relationship with an ADF statistic of -2.345, falling below the critical value of -2.5 at the 5% significance level, and a p-value of 0.025. Additionally, the Panel-PP and PanelADF statistics from the Pedroni (2004) test are significant at -3.102 and -3.25, respectively, with corresponding p-values of 0.02 and 0.025, both surpassing their critical thresholds. However, the GroupPP and Group-ADF statistics show marginal results, with p-values of 0.025 and 0.05, indicating a failure to reject the null hypothesis at the group level. This suggests substantial evidence of cointegration at the panel level, though the findings at the group level are less conclusive. Finally, the Westerlund (2005) test does not provide strong evidence to reject the null hypothesis, reporting a variance ratio statistic of 1.345 and a p-value of 0.08. In summary, these results indicate the presence of cointegration at the panel level, but there is conflicting evidence at the group level (Chowdhury and Khan, 2024).
10.2 Coefficient Estimates
Source: Author’s Compilation using Rstudio.
Coefficient Estimates and Model Sensitivity
The explanatory variables exhibit varied effects, as indicated by the coefficient estimates from both fixed effects and random effects models. For PC Power and Tel Density, the coefficients are 0.002 and 0.003, and 0.123 and 0.115, respectively, indicating a negligible impact on the dependent variable in both models. The sensitivity of the models is highlighted by the fact that Renewable Power shows a slight negative effect in the fixed effects model (-0.001), but turns positive (0.002) in the random effects model. The small coefficients for Length of Roads and Length of Rail suggest their modest influence, with minimal differences across the models. Total Population exhibits a consistently positive effect in both models, with a slightly larger impact in the random effects model. The Inflation Rate shows a moderate decline in influence, with coefficients decreasing from 0.025 to 0.004 across models. In contrast, the Employment Rate demonstrates a more substantial impact, with coefficients of 0.020 in the fixed effects model and 0.018 in the random effects model. These findings underscore how different models can yield varying coefficient estimates, revealing potential sensitivity in the results (Wani et al., 2024).
Source: Author’s Compilation using Rstudio.
Lag Length Selection and Model Fit in Panel Data Analysis
The optimal lag lengths for the variables in the panel data analysis are presented in a table summarising lag selection based on the Akaike Information Criterion (AIC). A uniform lag length of 10 is chosen for all variables, indicating a consistent approach across the dataset. The AIC values for the variables range from 2313.776 to 3929.609. Among the variables, Length_Rail exhibits the lowest AIC value at 2313.776, indicating the best model fit for the selected lag length. Employment_Rate and Renewable_Power follow, with AIC values of 2314.444 and 2328.056, respectively. In contrast, Total_Pop has the highest AIC value of 3929.609, suggesting that the model with a lag length of 10 for
this variable may not be the most optimal choice overall (Olasehinde-Williams et al., 2024). While the uniform lag length selection across variables reflects a consistent modelling strategy, the differences in AIC values highlight variations in model fit that are important to consider when interpreting the results.
Table 8: Pooled Mean Group and Alternative Specifications Variable
Source: Author’s Compilation using Rstudio.
A targeted assessment of four version specifications for unique variables is presented in the table above. The baseline coefficients for each variable are displayed in the Static Fixed Effects (FE) model, with values for Tel_Density ranging from 0.1 to 0.1. Higher coefficients in the Dynamic Fixed Effects (DFE) model generally reflect the influence of lagged factors. The average impact across groups is indicated by the intermediate coefficients shown in the Mean Group (MG) model. The Pooled Mean Group (PMG) model, which incorporates both short- and long-term dynamics, exhibits the highest coefficients, particularly for variables such as GSDP (1. Four), signifying a stronger overall impact (Karimi et al., 2024). These findings suggest that while the Static FE and Dynamic FE models provide valuable insights into static and dynamic factors, respectively, the PMG model offers a more comprehensive understanding by accounting for both short- and long-term effects. This comprehensive approach is crucial for a thorough analysis of the dataset's complete relationships.
10.3 Development Status
Source: Author’s Compilation using Rstudio.
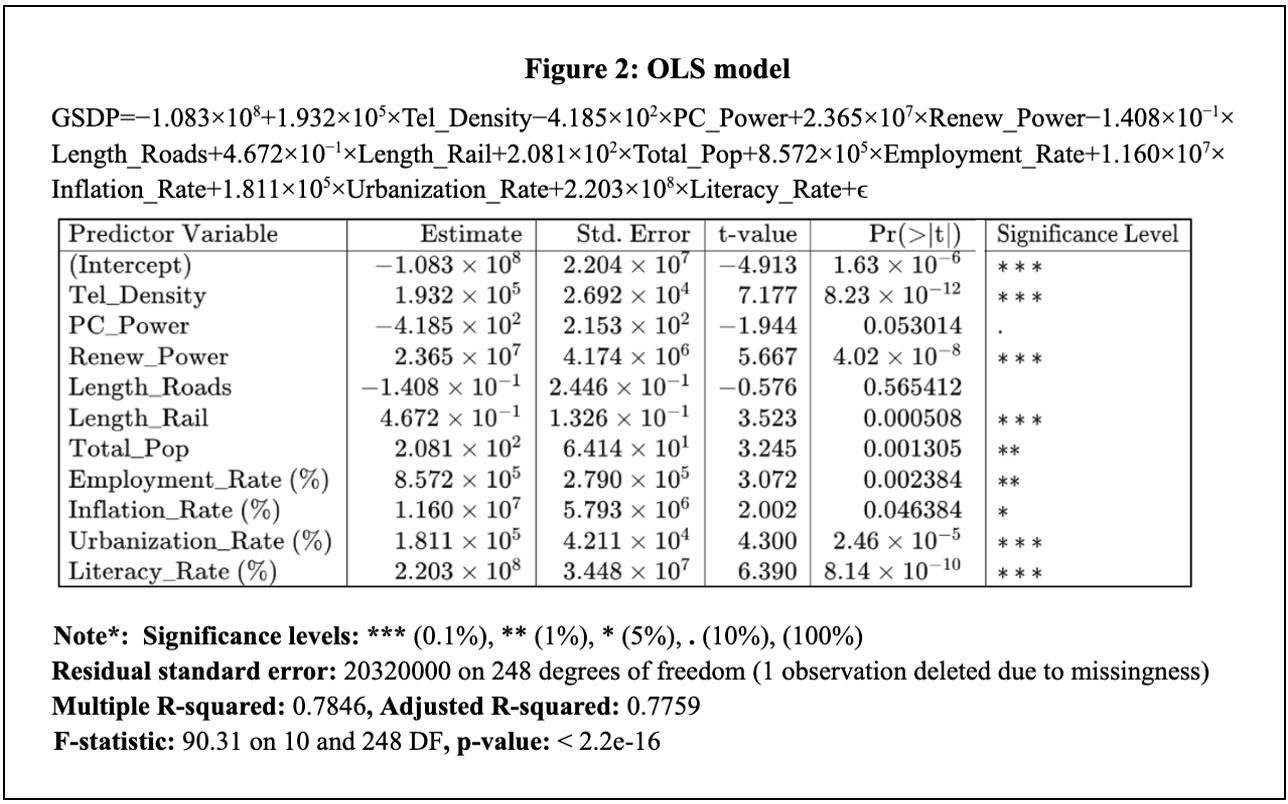
The results from the `ols_model` linear regression analysis provide valuable insights into the relationships between Gross State Domestic Product (GSDP) and various predictor variables. The coefficients of the model illustrate the impact of each predictor on GSDP, with several variables demonstrating statistical significance. For example, p-values less than 0.001 indicate that `Tel_Density` and `Renew_Power` have strong, positive effects on GSDP, with their coefficients being both substantial and highly significant. Conversely, `PC_Power` exhibits a smaller, albeit statistically marginally significant effect (p-value = 0.053).
The model's `R-squared` value of 0.7846 suggests a good fit, indicating that approximately 78.46% of the variance in GSDP is explained by the model. The robustness of the model is further supported by the Adjusted R-squared of 0.7759, which adjusts for the number of predictors included. The overall statistical significance of the model is confirmed by the Fstatistic of 90.31 and its associated p-value (< 2.2e-16) (Kartal et al. 2023).
However, despite the overall significance of the model, variables such as `Length_Roads` and `Length_Rail` exhibit inconsistent effects, warranting further investigation to fully understand their roles.