HAOHENG TANG
Selected Works
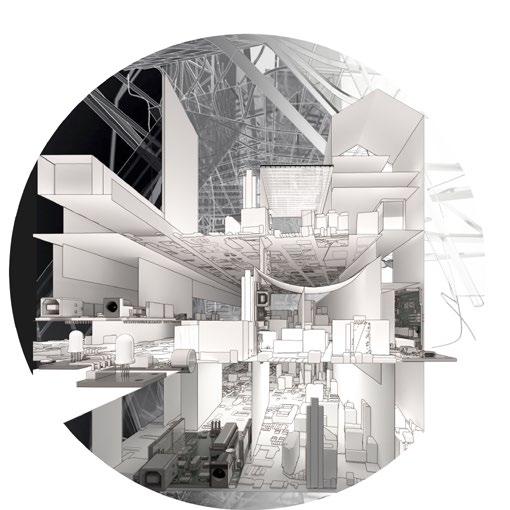
PORTFOLIO
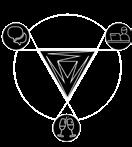
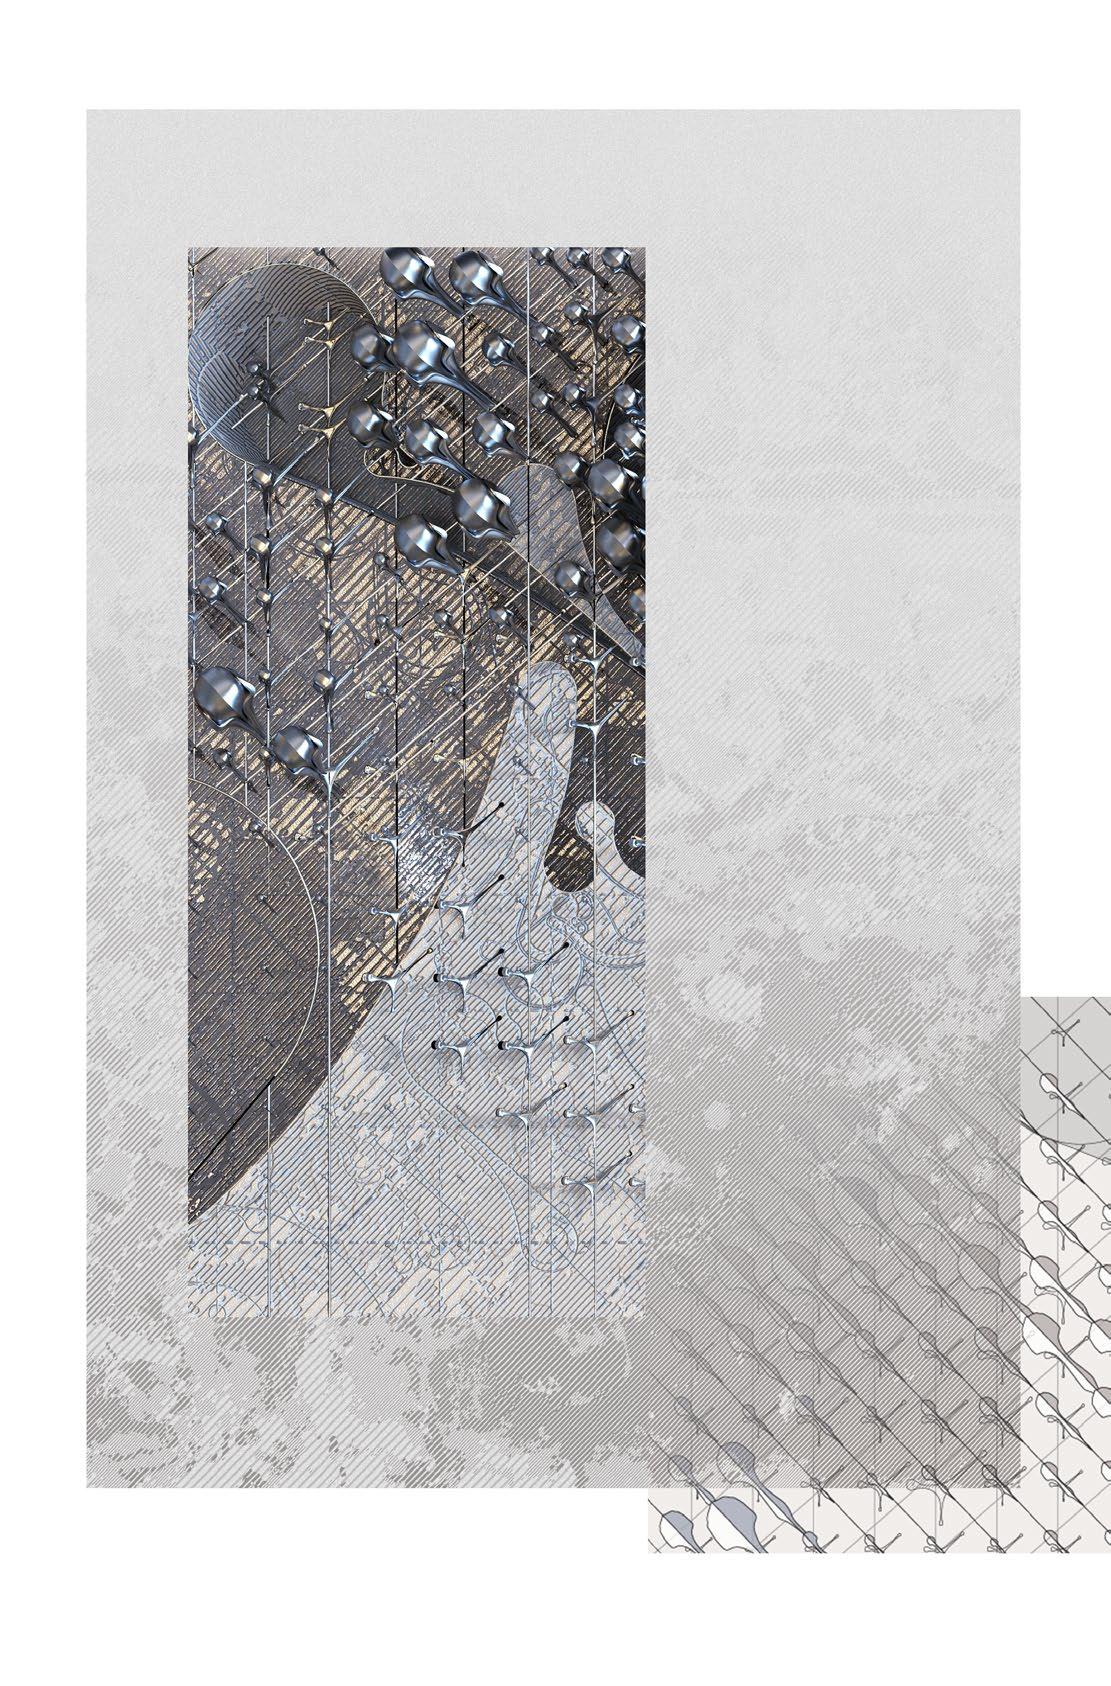
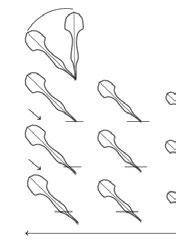
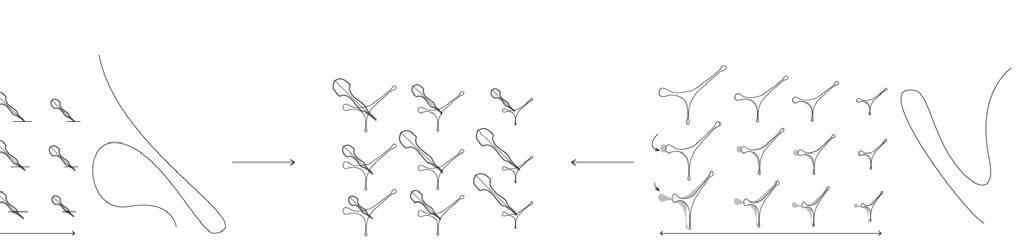
Seen from above any form is susceptible to any exogenous forces. Seen from below, it features a complex network of interaction underlying it.
Top-down
Bottom-up
Physical Digital
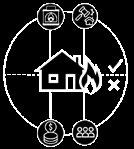
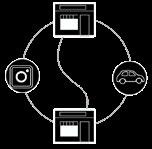
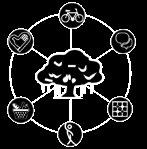
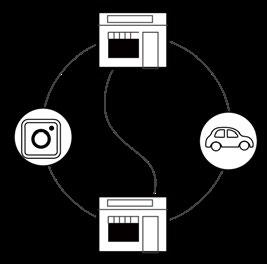
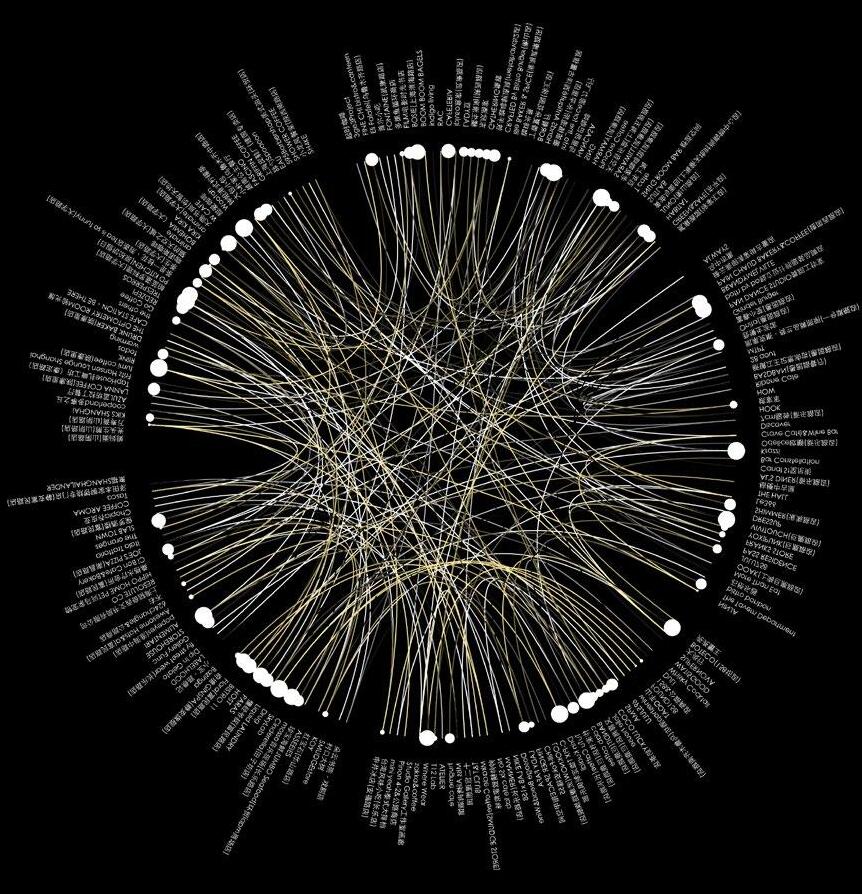
Tree’s Breath Architectural Skin Iris Kiosk Physical VS Digital Network Fire Response API & App
Conrad H. Waddington, Strategy of the Genes, Epigenetic Landscape
CONTENTS 01 TREE’S BREATH 02 IRIS KIOSK Trees Structure Parcel Responsive Environment Architecture Patterns Activities Activities Fire Risk Real-time Info Physical Network Technique 1 Digital Network Technique 2 03 PHYSICAL VS DIGITAL NETWORK 04 ARCHITECTURAL SKIN 05 FIRE RESPONSE API & APP
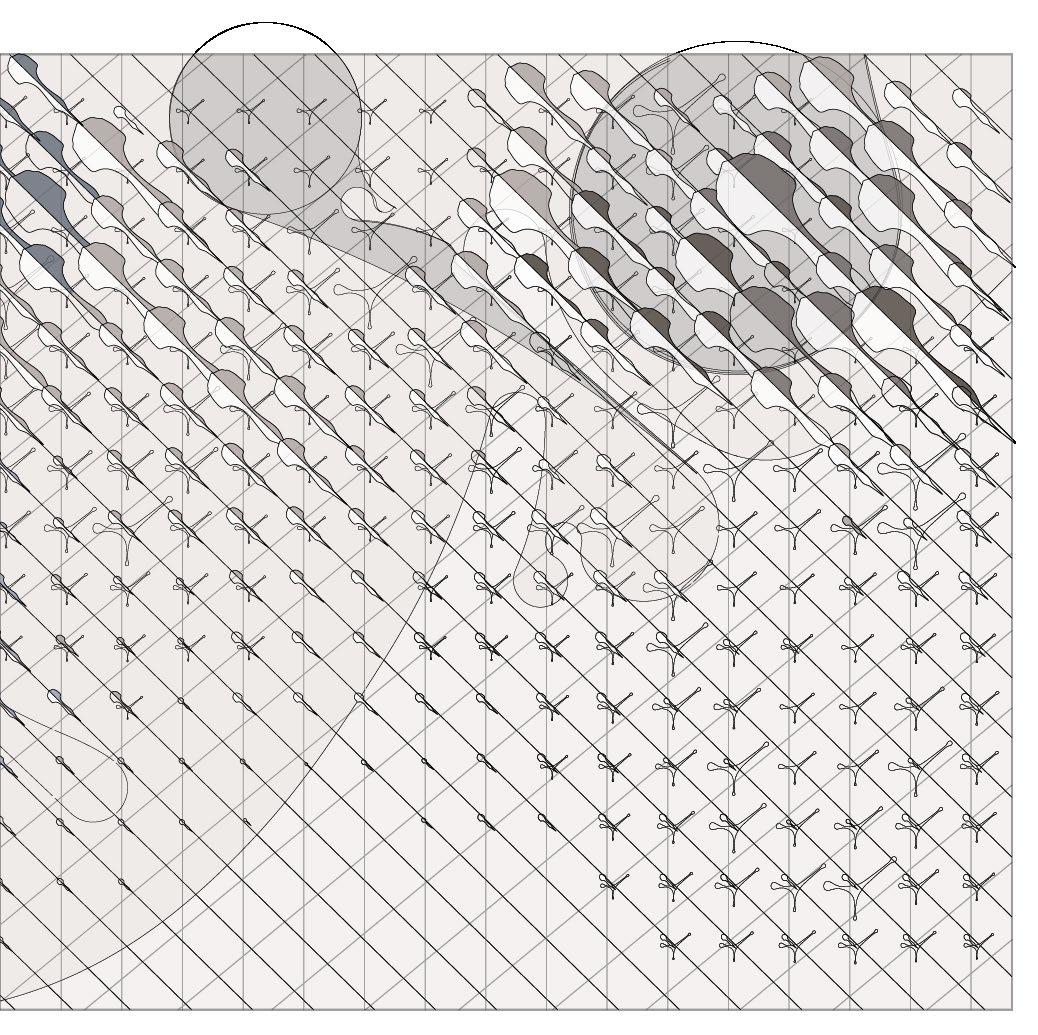
Exogenous Forces
Network
Form: Light
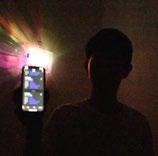
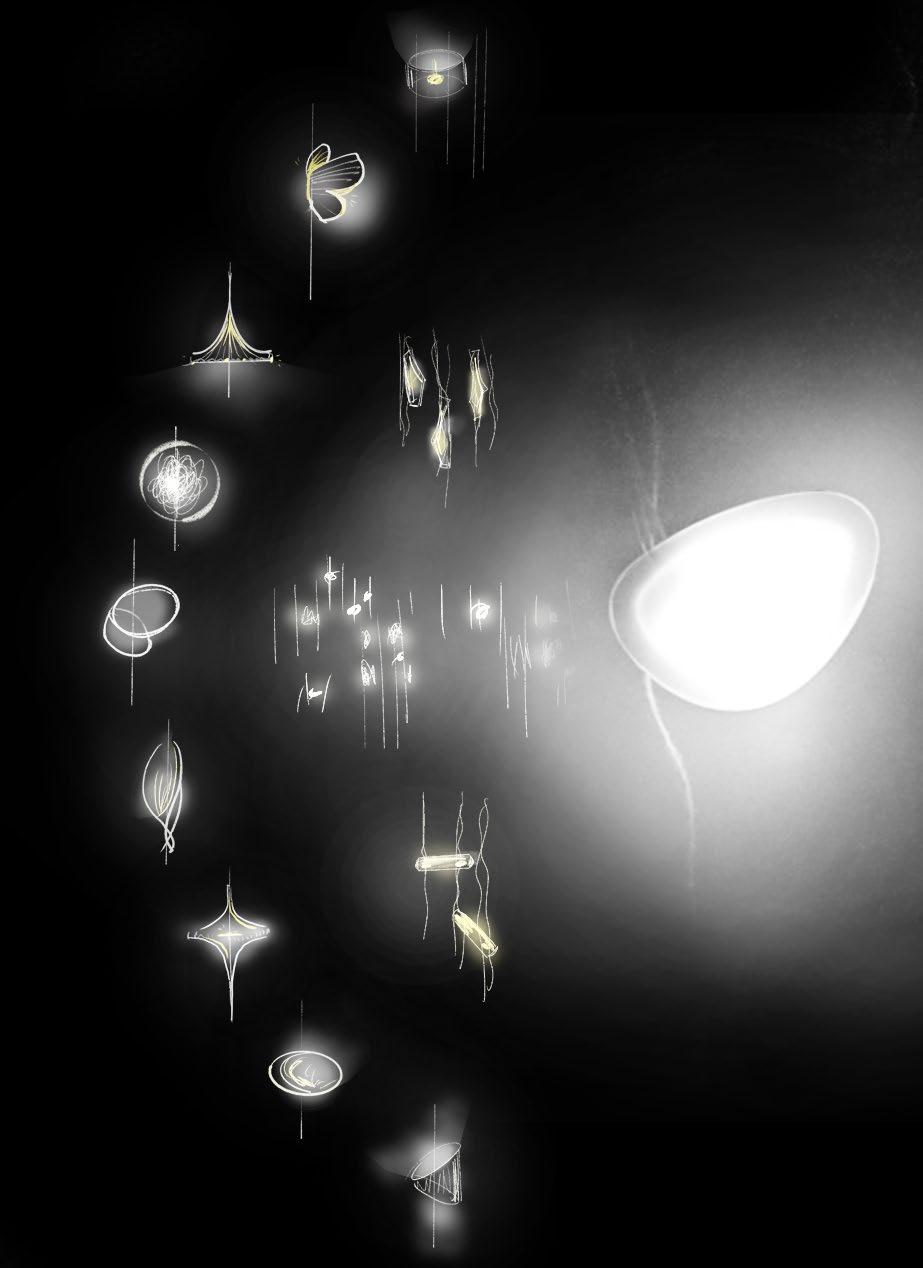
TREE’S BREATH
Interactive Art Installation Design
Aug to Oct, 2021
Personal Project Instructor: Xun Liu, Zihao Zhang
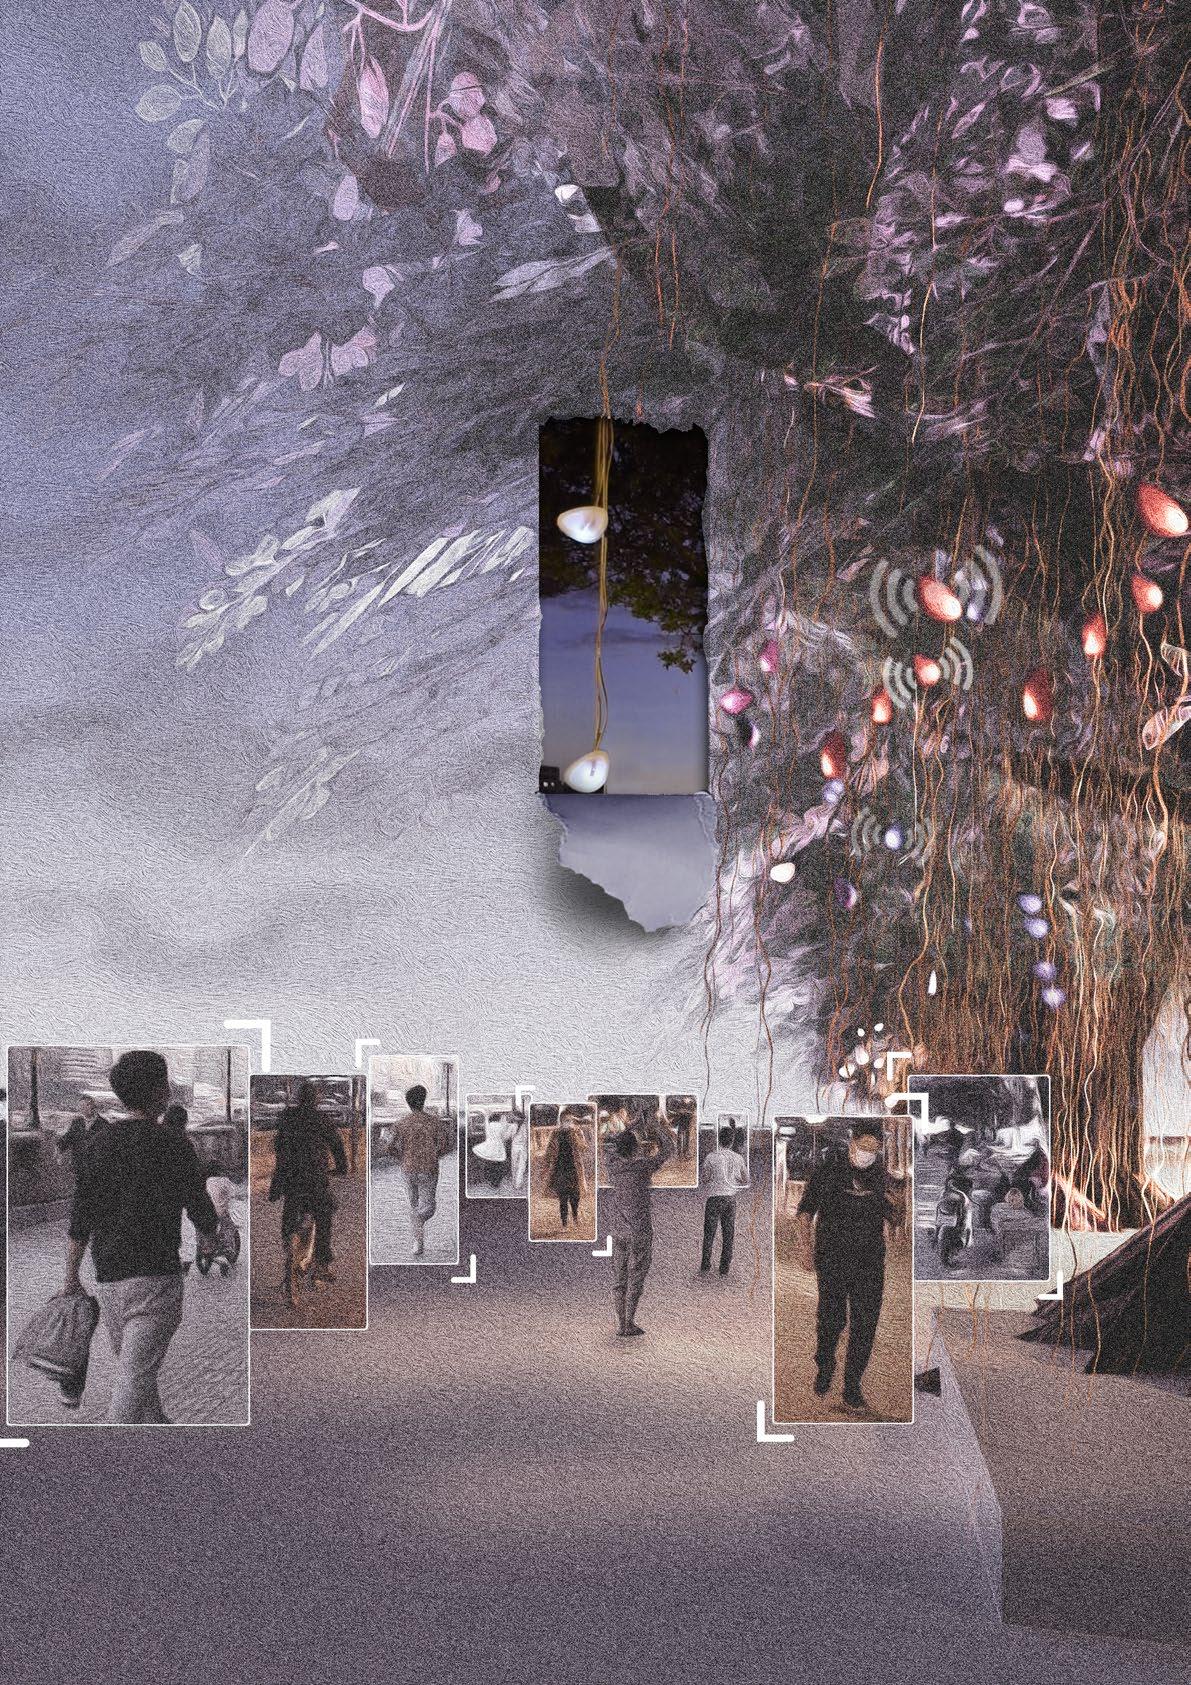
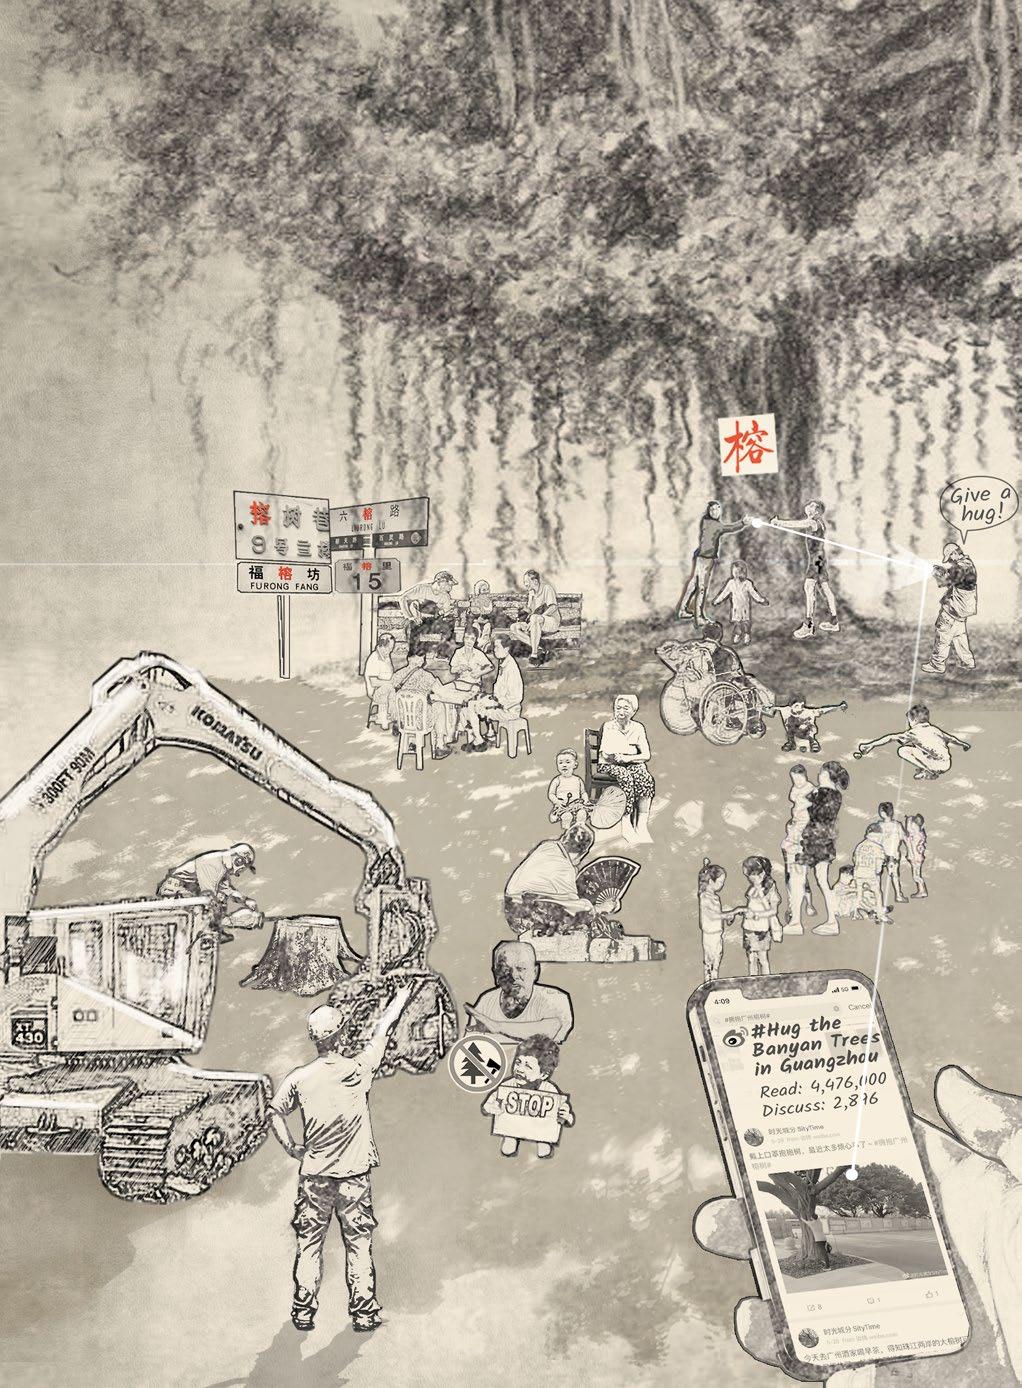
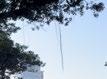
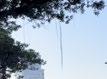
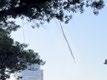
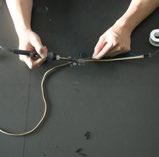
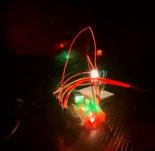
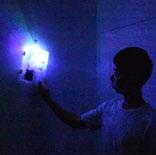
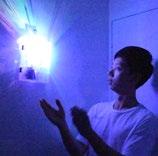
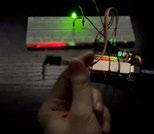
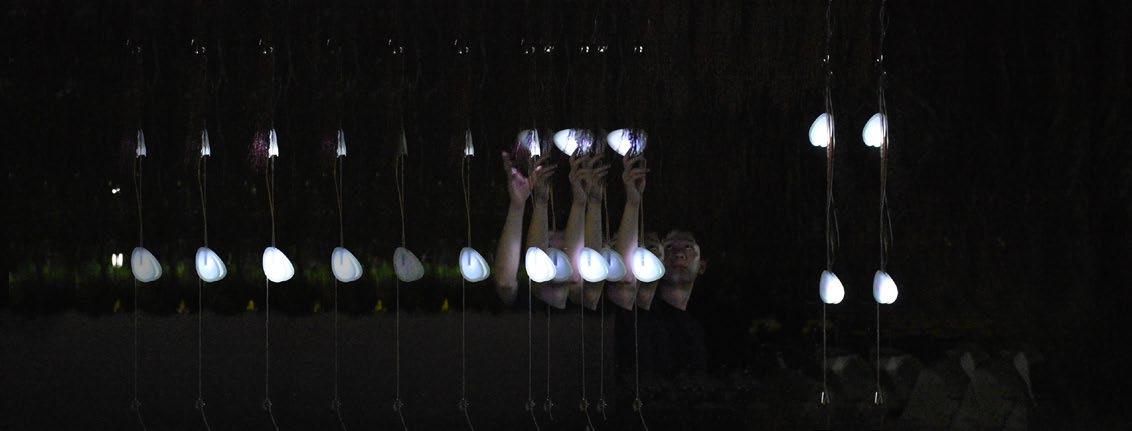
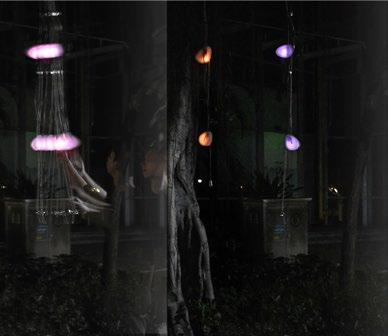
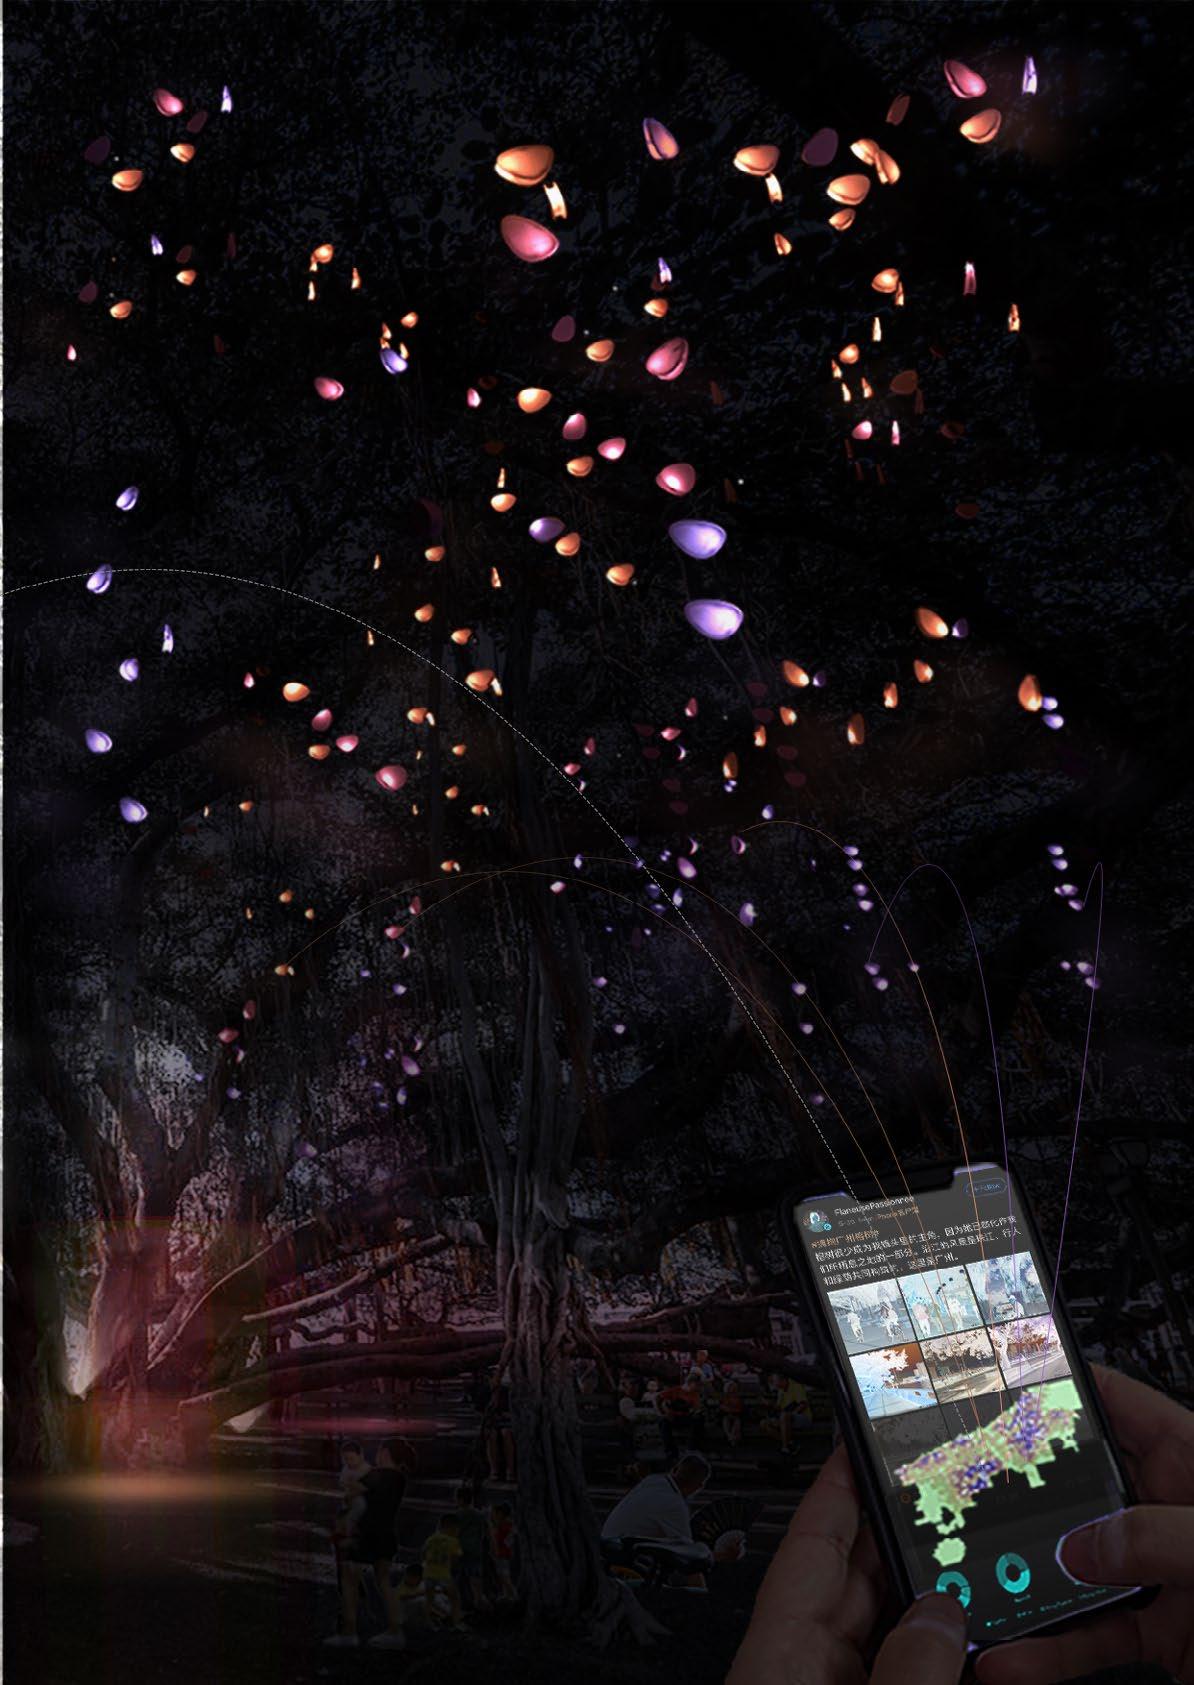
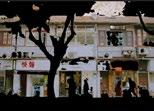
A lighting art installation on banyan trees is designed in response to citizens’ protests over the government’s decisions on removing old banyan trees in Guangzhou. The sensors in it sense and respectively count different activities under the trees while the microcomputer gives feedback by changing LEDs’ color and “respiratory rate” and post on social media every time the counts reach the threshold. Using the toolkits that
I shared online, citizens can make more devices like that and install them on banyan trees anywhere. The banyan trees are able to tell all the people, visually or through words, that so many activities happened in their shadows. Through intended interactions or unintended activities, citizens transform the looks of these art installations, demonstrating the important roles of banyan trees in their lives.

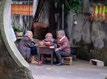
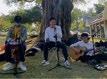
Activities & Protest Over Cutting Trees
Having seen more and more old banyan trees being cut by the government, citizens in Guangzhou engaged in an event tagged by “Hug the Banyan Trees in Guangzhou” on Weibo (social media similar to Twitter) in May 2021, which asks people to take photos of themselves hugging the banyan trees to show their love to them.
1. BACKGROUND
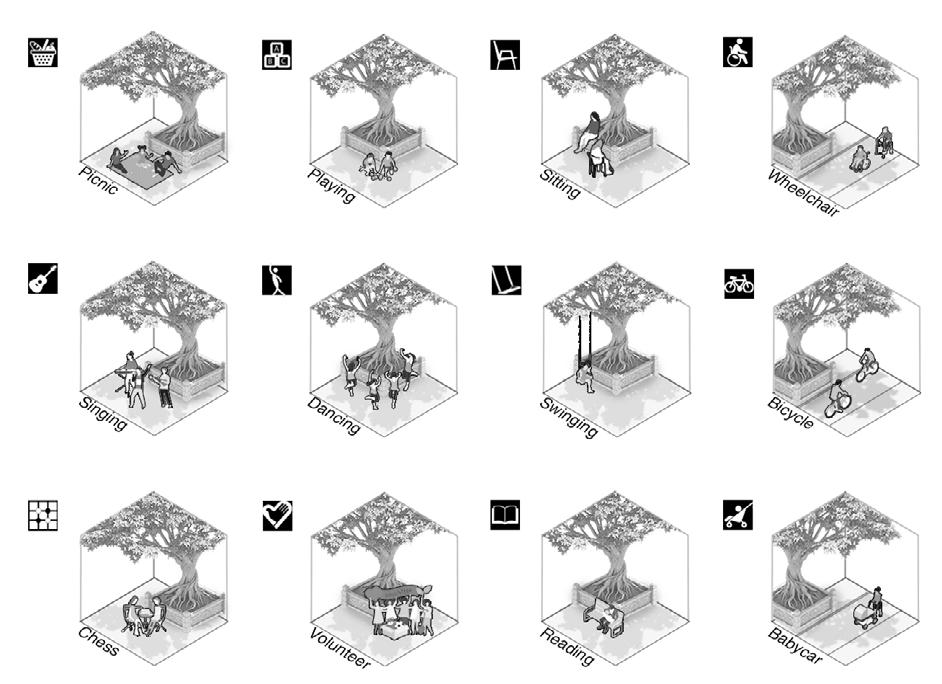
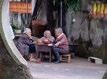
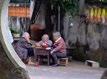
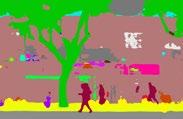
Typical Activities Under the Banyans Trees in Guangzhou
For centuries, banyan tree has become a symbol of Guangzhou culture. As the climate in Guangzhou is hot all year, people like staying under the shadows of banyan trees and have a strong bond with the trees.
 Ancient Banyan Trees
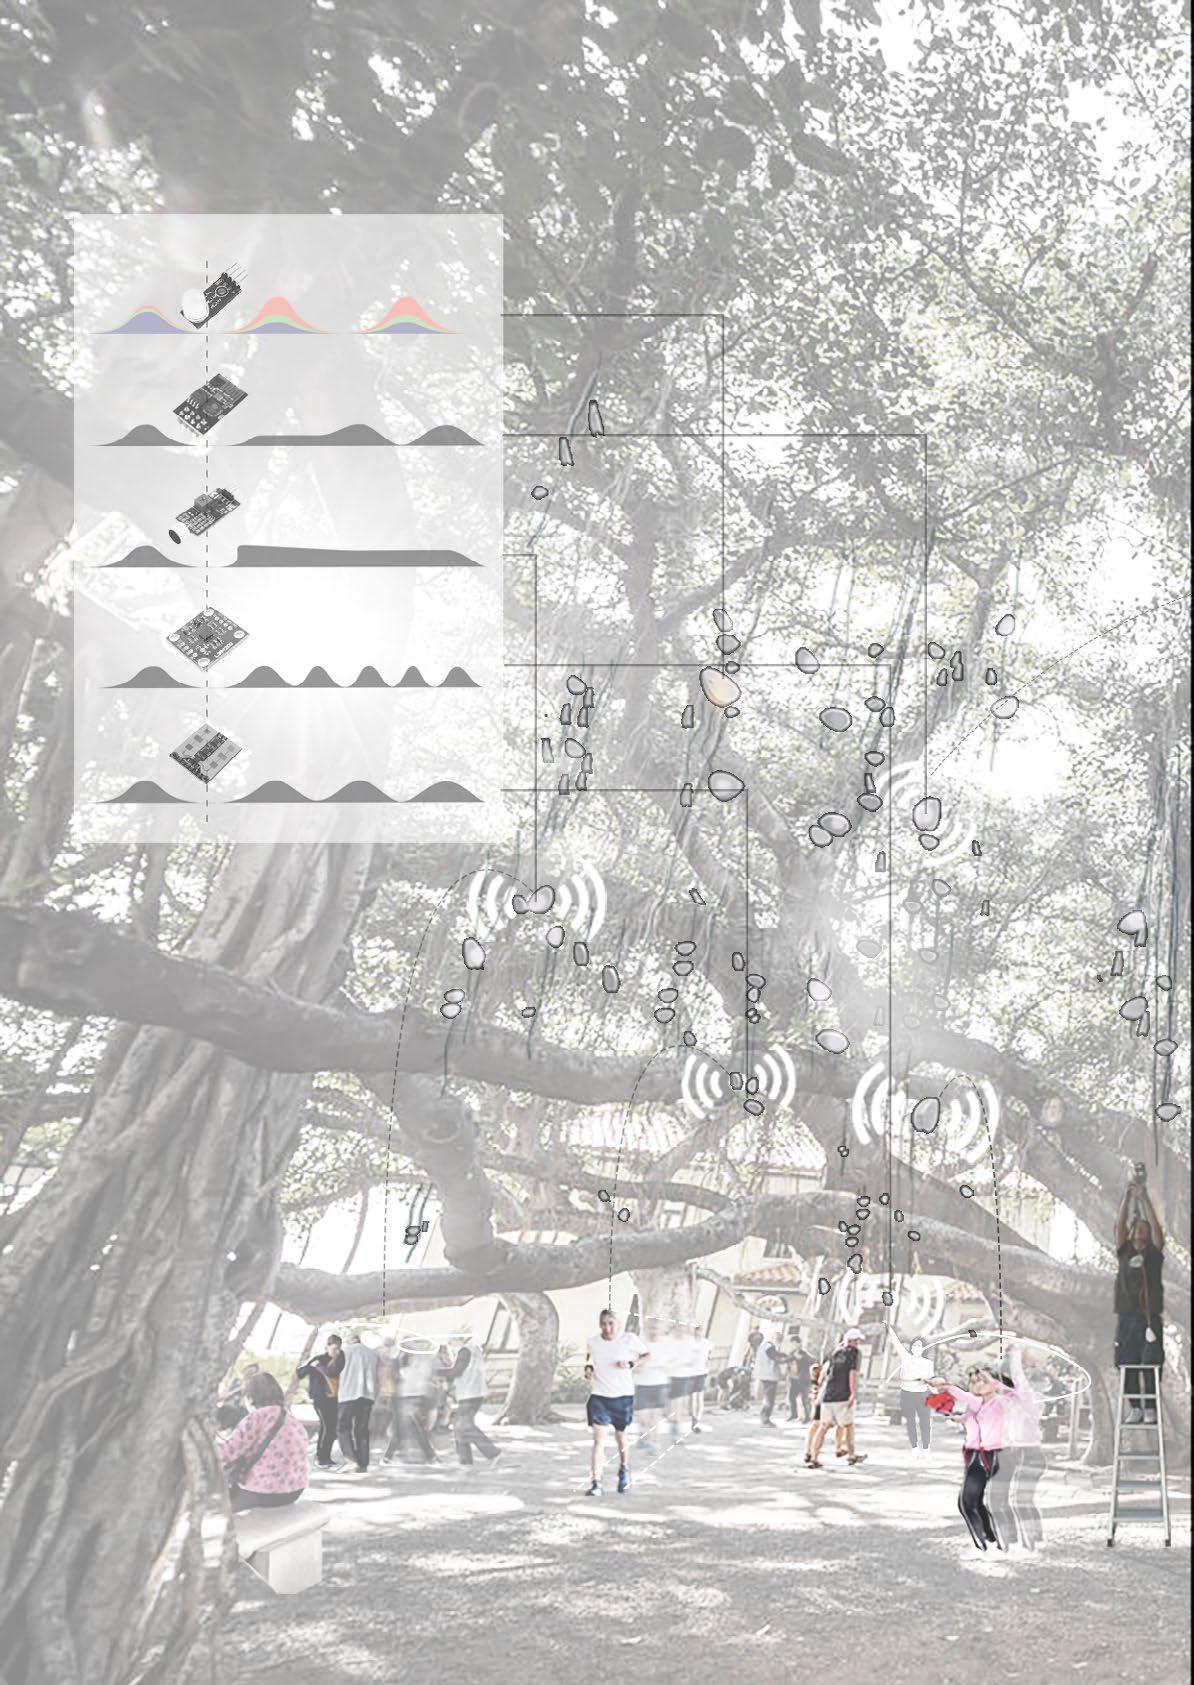
2. SYSTEM DESIGN


Collect data of activities under the banyan trees and describe it visually or with words to demonstrate the irreplaceable roles of banyan trees


Stimuli Sensor


Reading

Dancing


Physical Exercises
Chatting


Singing


Touching
Swinging


Blowing Talking


ON Dura�on <4096 >4096 & >10240 ON Dura�on OFF Interval OFF Interval ON Dura�on ON Dura�on OFF ON <500 OFF >500 breathing
Sensing
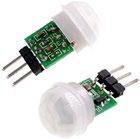
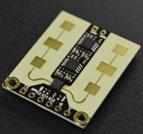
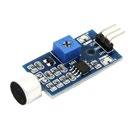
Wind Gyroscope IR sensor
mmWave Radar
Sound sensor Running Sitting
The government cut banyan trees because they assumed the banyan trees are not so important to citizens and
could be replaced by other kind of trees that look nicer. However, once the banyan trees at a place are cut,
citizens cannot enjoy the shading by them and spend substantially less time at the place.
The installation is connected to the public Wi-Fi in the city through a Wi-Fi module. It can post on social media showing the count of each kind of activity.

Actua�on Dura�on < 25s < 10240 Dura�on > 25s < 10s > 10s Dura�on < 30s Dura�on > 30s
breathing rate Change color RGB LED Module Wi-Fi Module Shorten interval Be bright Post on social media
Increase
Actuator
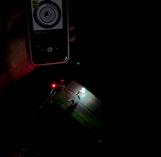
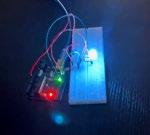
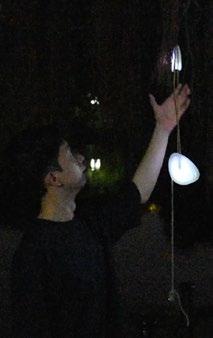
Testing Sensors and Actuators
Once sound is detected by the sensor, brightness = intensity of sound The sensor can detect any human existing around within a distance of 2m, even he or she is static.
Multiple RGB

LED modules can be integrated can work simultaneously.
The LED, gyroscope and sound sensor are working well.
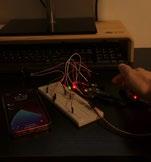
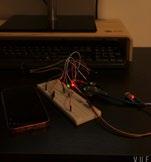


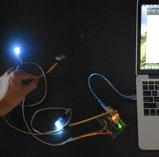

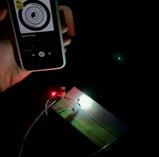
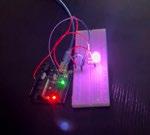

The sensor can detect any human moving around within a distance of 2m.
The module can connect to Wi-Fi and have access to the Internet.
All the sensors and actuaters are integrated into one box and powered by a battery. The LED and sound sensor are working well.
The infrared sensor, LED and Wi-Fi module are working well.
3. PROTOTYPING RGB LED
module gyroscope
sound sensor
infrared sensor
and
mmWave radar Integrating
testing
Wi-Fi module
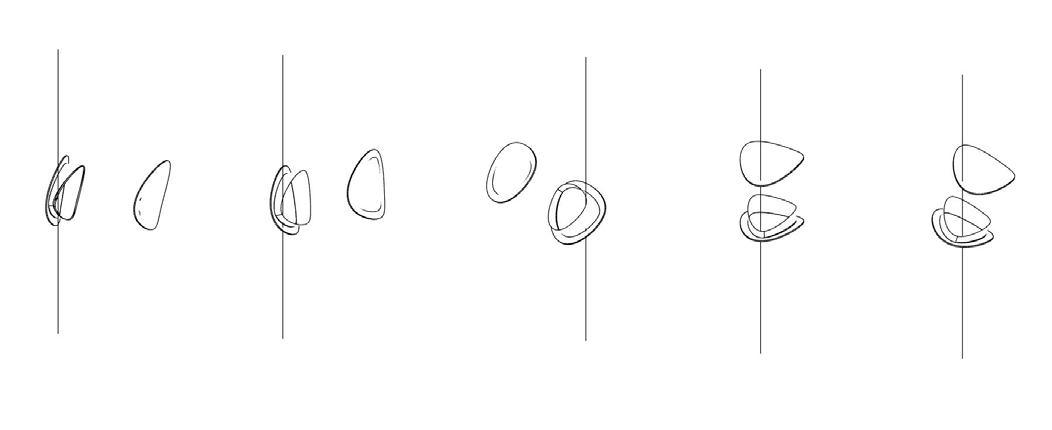
Design of Shell
These schemes propose to create a
translucent lampshade.
These schemes propose to create a full transparent lampshade.
These schemes propose to create a translucent lampshade.
The schemes at the bottom of this page propose to create
an opaque lampshade with reflecting material like metal.
The selected one creates a shape like the wing of a butterfly. It’s digitally modeled and finally 3D-printed.
4.1 Several Ways to Attach a Device to Aerial Roots

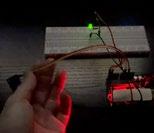
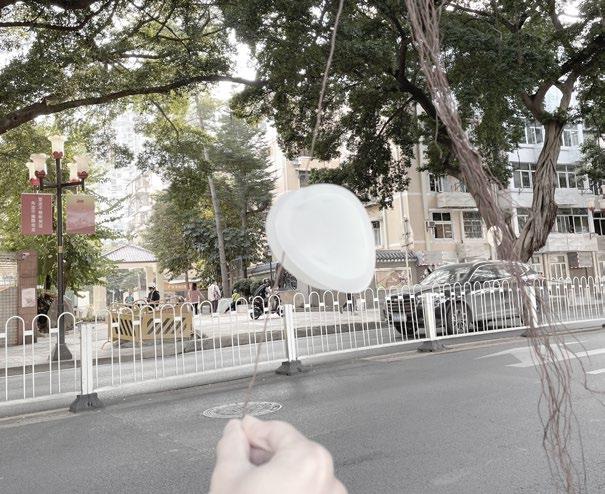
The art installation is designed to attach to the aerial roots of a banyan tree. There are several ways to do so. The purpose is that citizens can 3D print the model, choose any part of the aerial root and install the installation in any way they want. This will create a vivid artwork in public spaces.
 94.98mm
21.38mm
The device is attached to the aerial root of a banyan tree.
Shells are 3D printed and assembled.
Sensors and actuators are placed in the shell.
94.98mm
21.38mm
The device is attached to the aerial root of a banyan tree.
Shells are 3D printed and assembled.
Sensors and actuators are placed in the shell.
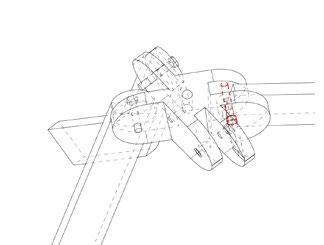
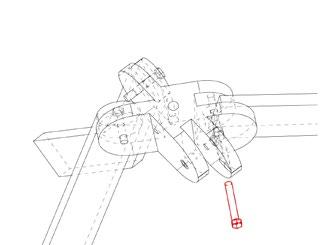
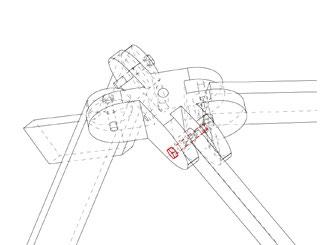
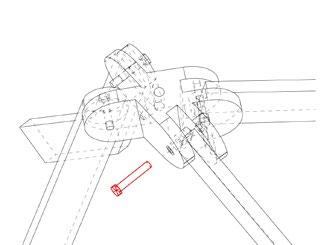
4. DETAIL
Section 1-1
1 2 3 4 5 1 1
4.2 Internal Components
Devices on a bunch of aerial roots share an Arduino board and are connected through wires.
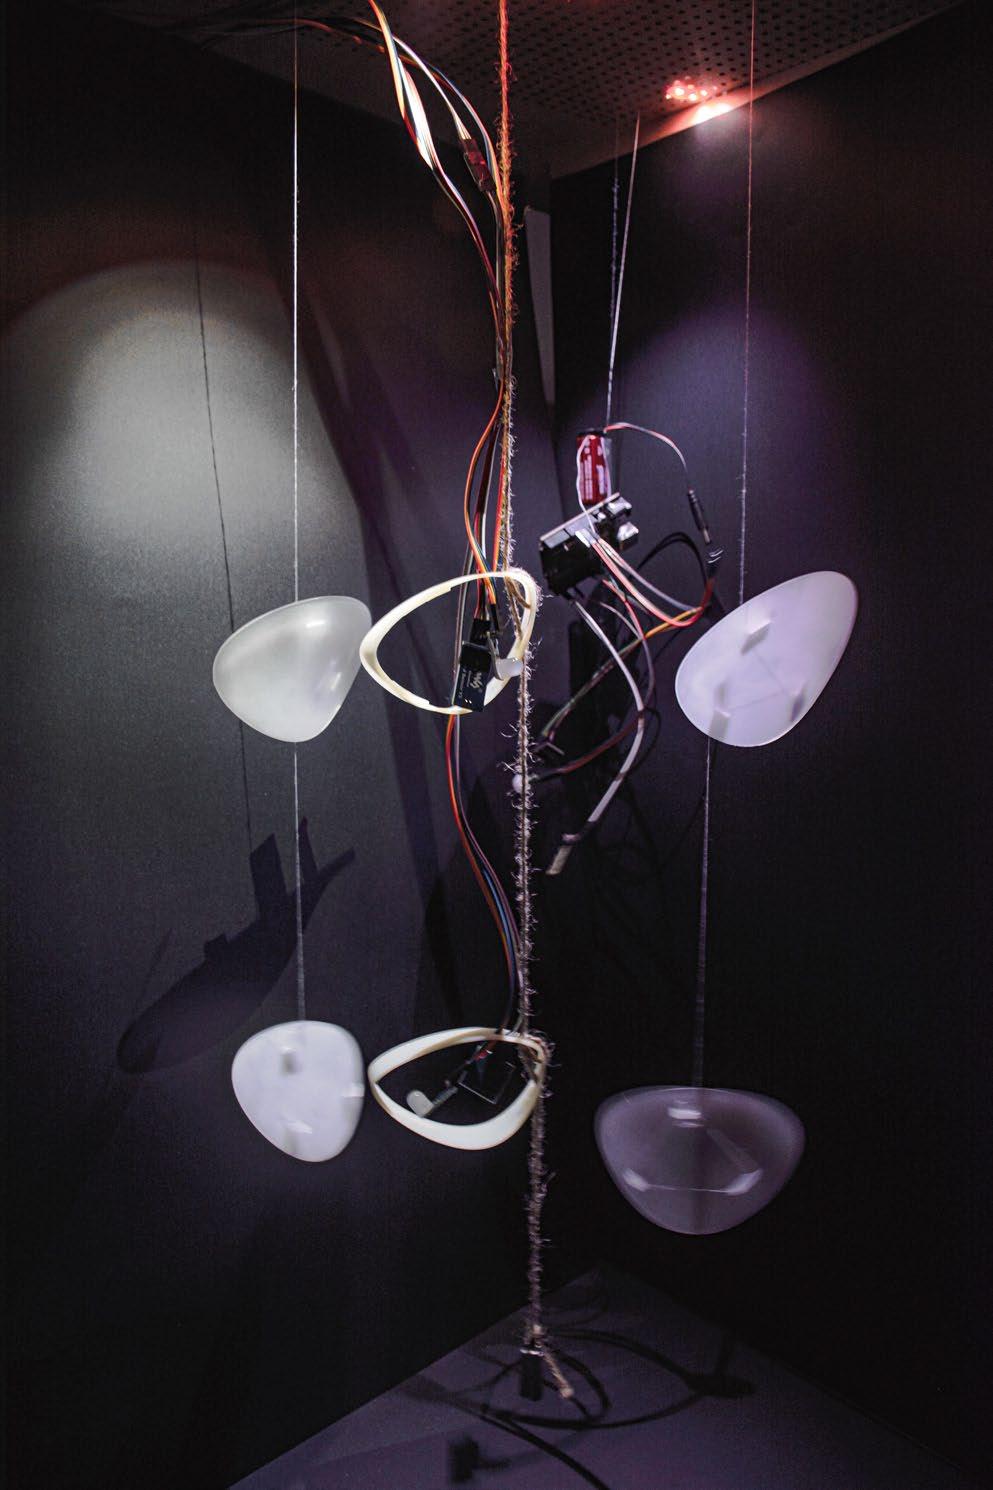
Battery
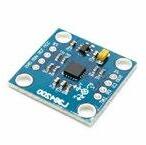
Arduino Uno R3 Board
RGB LED module
Sound Sensor
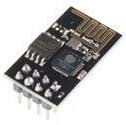
ESP8266 wifi module
Infrared Sensor
mmWave Radar
Gyroscope
RGB LED module
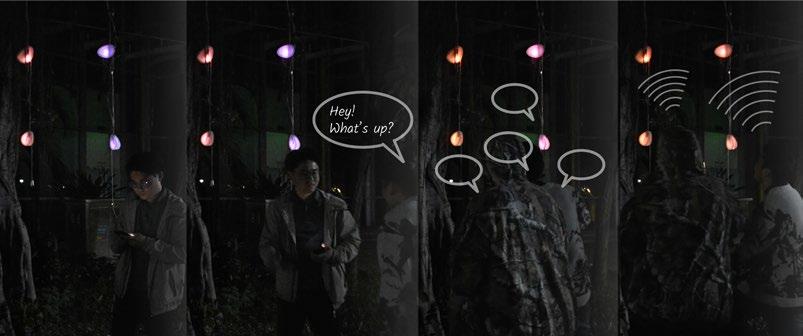
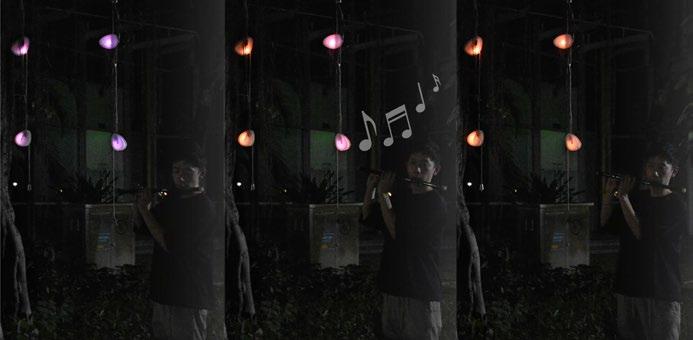
Swing the root would substantially speed up the “respiratory rate” of the lights.

Sensing no mode, which
Sounds not only make the light bright in a sudden, but also change the color into orange gradually.
Swinging into purple
5. INSTALLATION AND INTERACTION R G B R G B R G B R G B R G B R G B R G B R G B R G B R G B R G B R G B R R R G B R G B R G B R G B R G B R G B R G B sound sensor RGB: G = R * 0.57 B = R * 0.37 Sound count +1: G = G * 0.94 B = B * 0.86 Gyroscope G = B = gyroscope gyroscope > 1m
Installed on the arial root of a banyan tree
no one within 1m, the devices are switched to sleep which means longer interval between each breath
It is connected to public Wi-Fi in the city and can post on social media every time the counts reach the threshold.

the aeriel roots of the tree wll turn the light color purple gradually.
All the transformations are reversible and sensitive to the stimuli in the environment. Thus it can visualize diverse activies.
on social media... ESP8266 R G B R G B R G B R G B R R R B R G B R G R G B R G B R G B R G B R G B R G B R G B R B R B R G B R G 1 Sound count +1: G = G * 0.94 B = B * 0.86 RGB: G = R* 0.1 B = R * 0.01 Gyroscope count +1: G * 0.97 B * 1.02 count +1 count +1 count = threshold RGB: G = R * 0.1 B = R * 1.3 sound sensor mmWave radar 1m sleep mode
Post
Installations keep collecting data in the real world
Stimuli
RGB LED
Wi-Fi Module Sound Sensor Gyroscope mmWave Radar
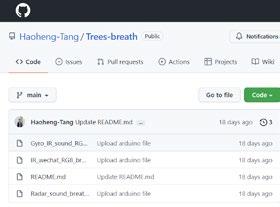
Using the toolkits that I shared online, people can make more devices and install them on banyan trees anywhere. The toolkits can be found at: https://github.com/ Haoheng-Tang/Trees-breath
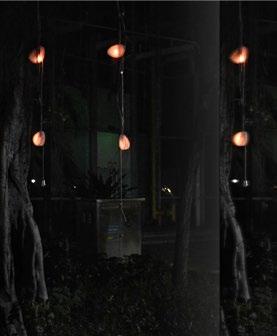
6. RENDERING
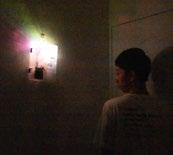
Installations visualize data at night and online
A Weibo account is created for each banyan tree and an online platform integrates all the data posted by the devices.
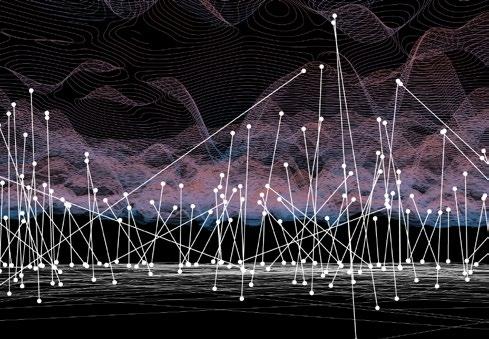
Exogenous Forces
Form: Structure Network
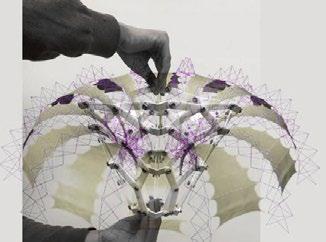
IRIS KIOSK
Transformable Structure Design & Fabrication
Oct to Dec, 2022
Collaborative Academic Project
Teammate: Alex Yang
Instructor: Chuck Hoberman
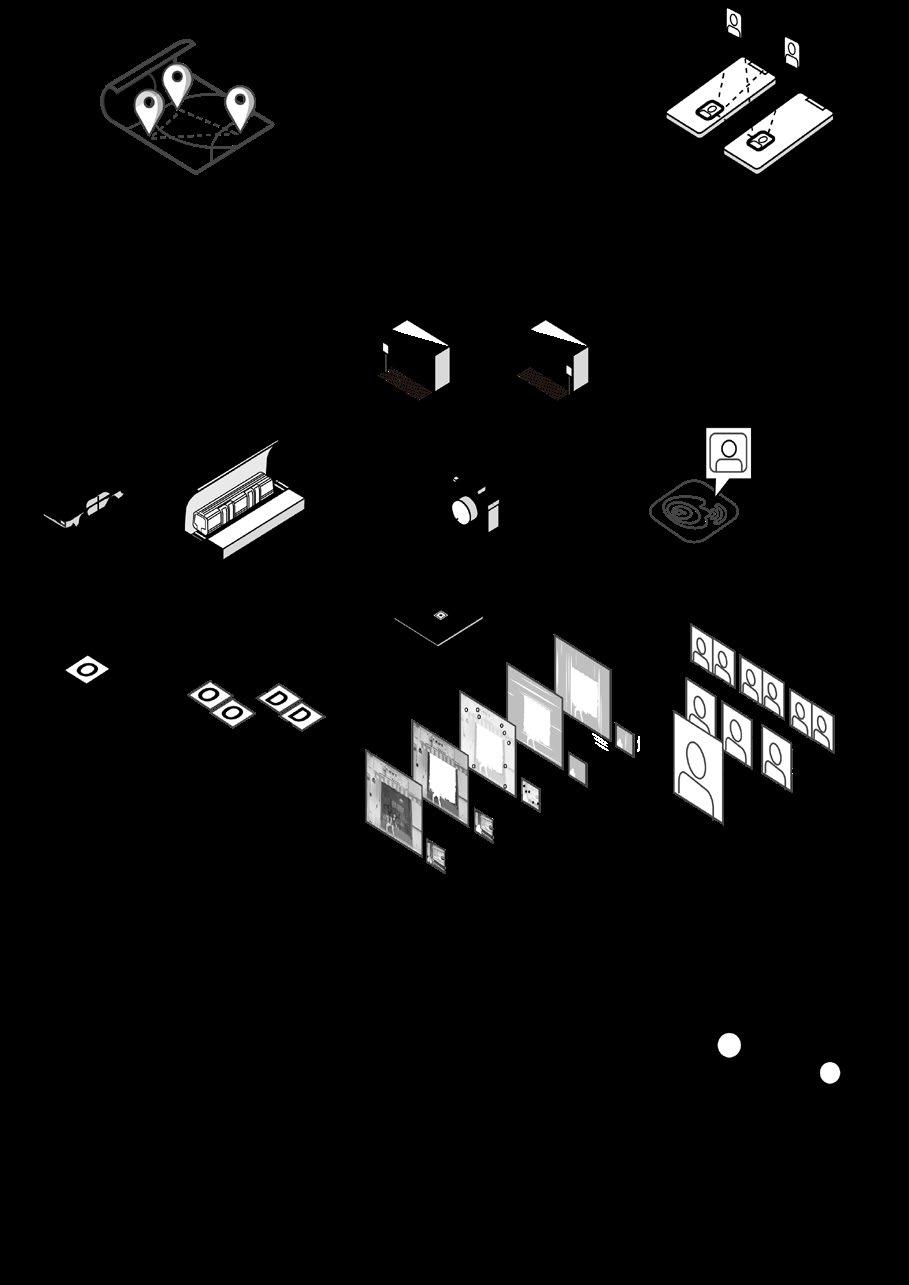
Responsibility: Project proposal, writing grasshopper scripts to simulate the movement of the structure and to easily tune the parameters, designing hubs so that they can stack up perfectly, designing the horizontal linkages at the base to stabilize the structure, physical & digital model, fabrication, drawings.
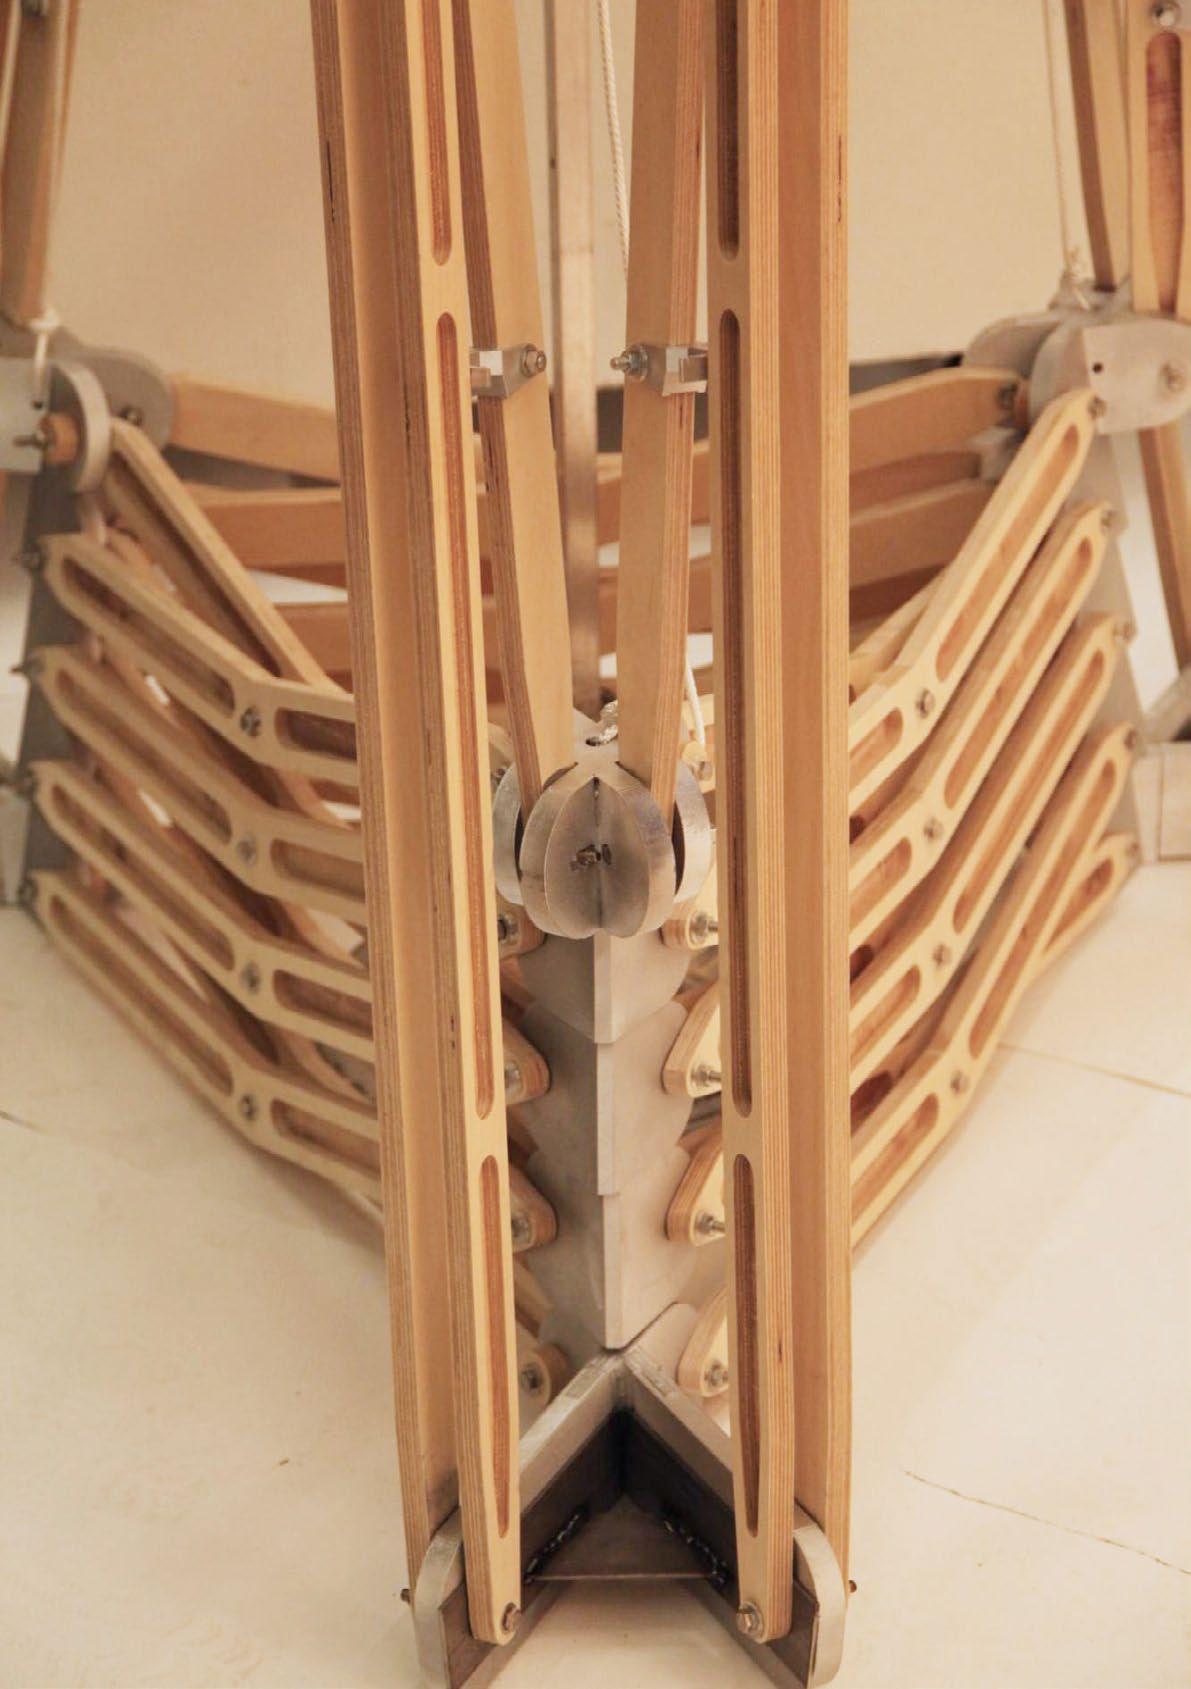
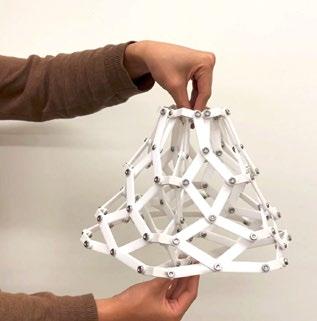
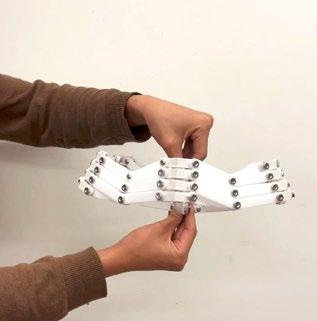
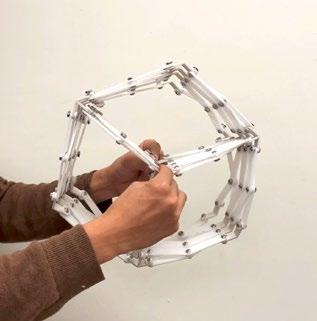
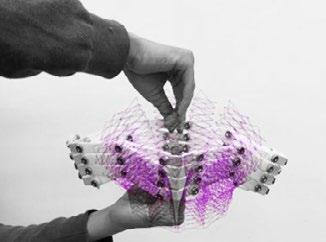
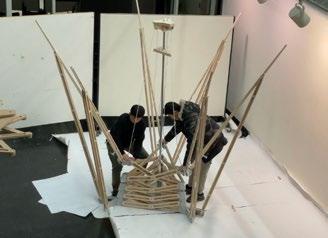
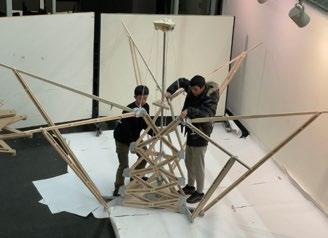
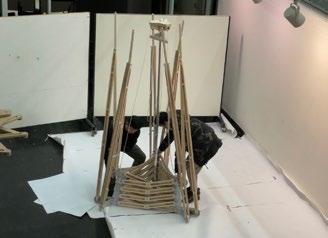
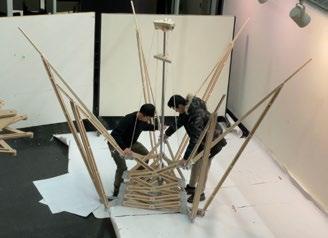
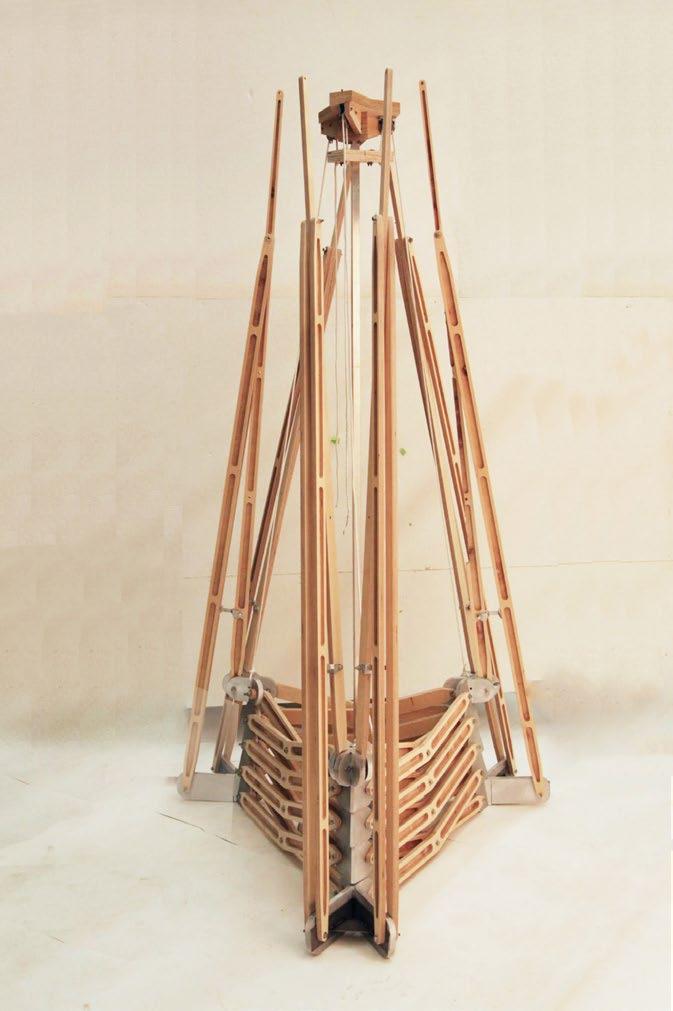
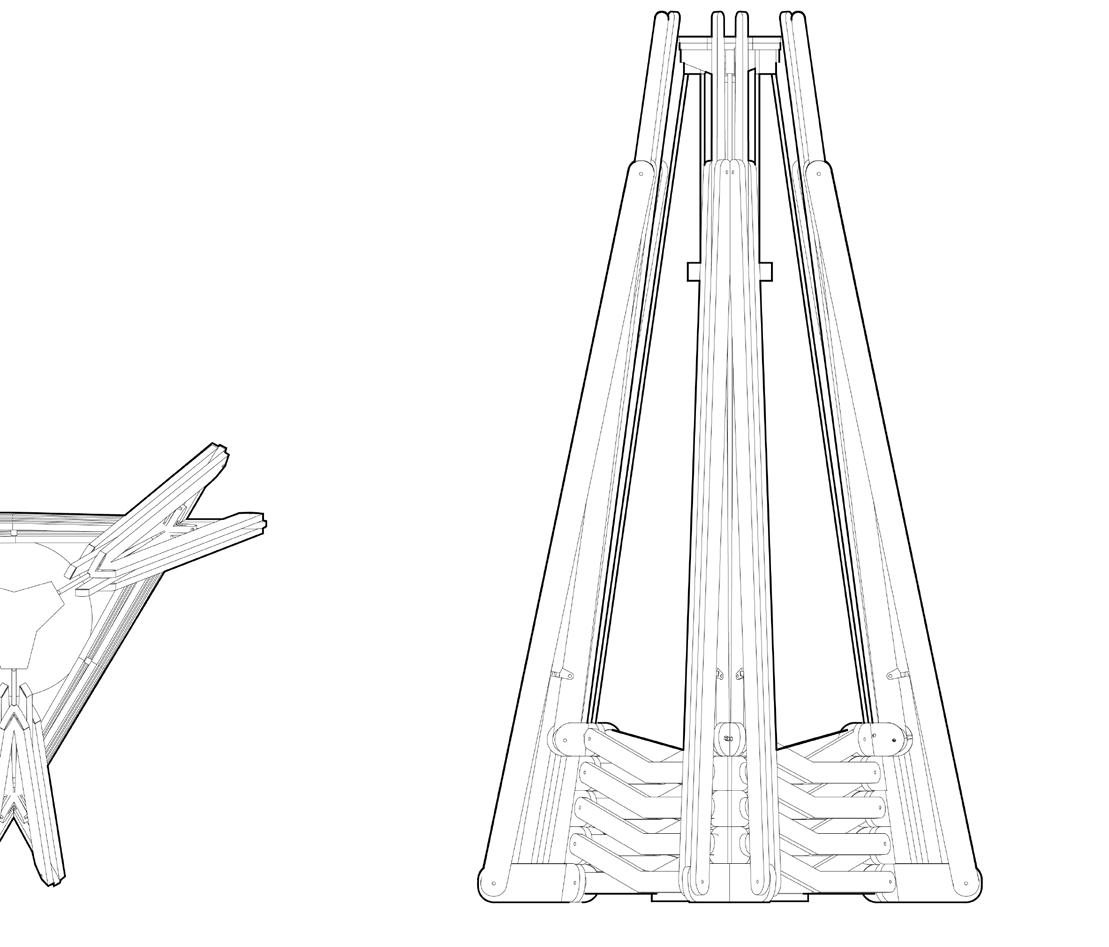
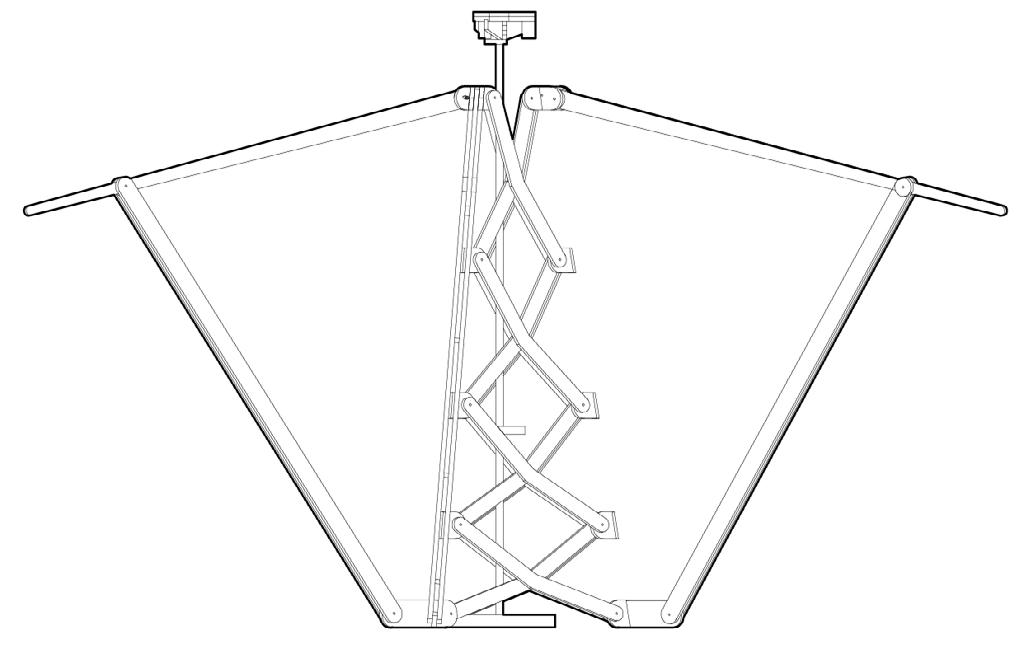
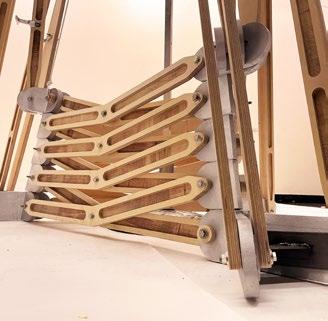
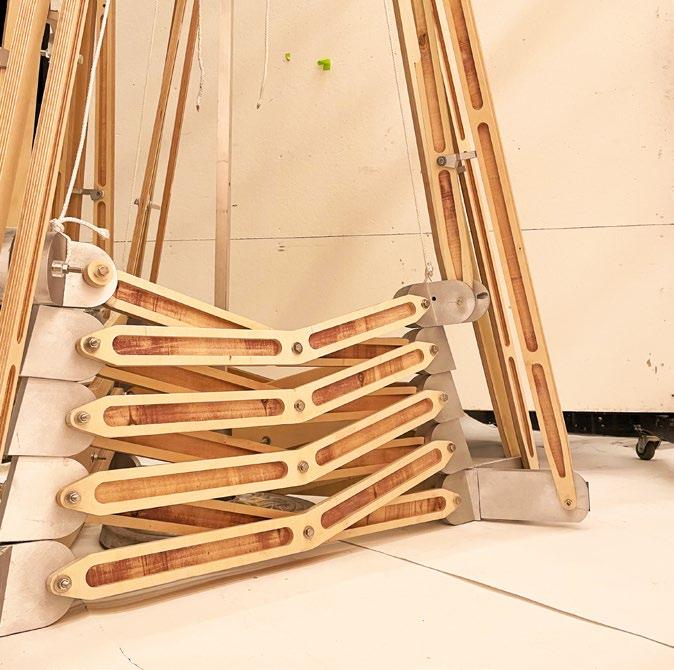
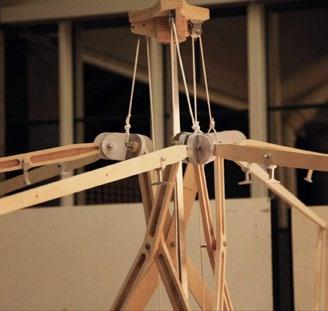
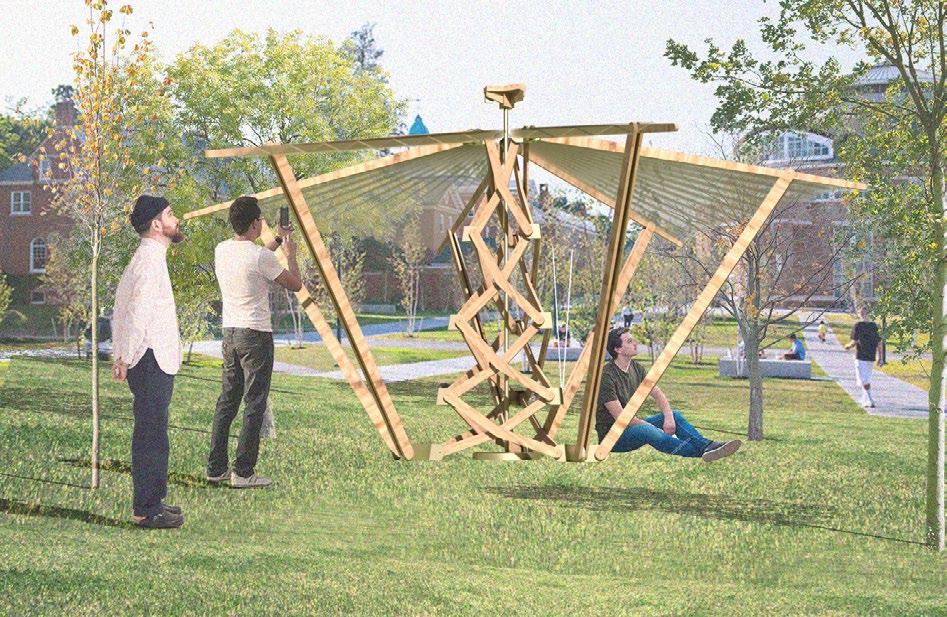
The Iris Kiosk is an interactive installation serving as a gathering point on Harvard Campus. The design is inspired by the Iris structure commonly found in nature. The installation is primarily made of plywood. Using a transformable structure made of angulated scissorlinkages, it can be expanded to
different extents to accommodate at most 15 people and can easily stay at different states. The multi-functional kiosk is designed to serve different purposes, such as exhibitions, popups and semi-private workspaces. It can easily be transported to any place when it is contracted.
SYSTEM
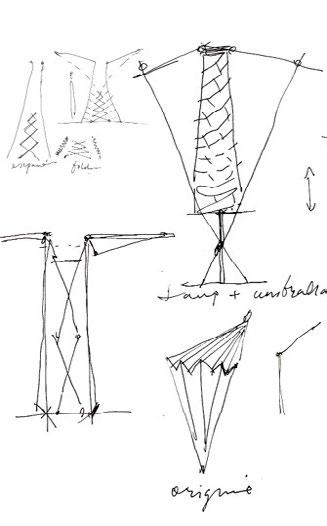
1.1 Scissor Linkage & Iris Structure
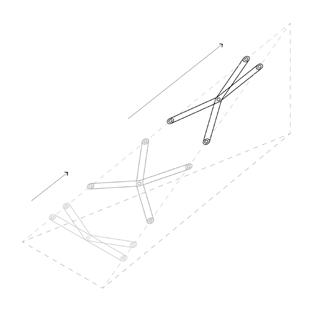
The planar scissors are made of straight links and therefore have collinear pivots. i.e. the paths of the pivots of linkages are parallel.
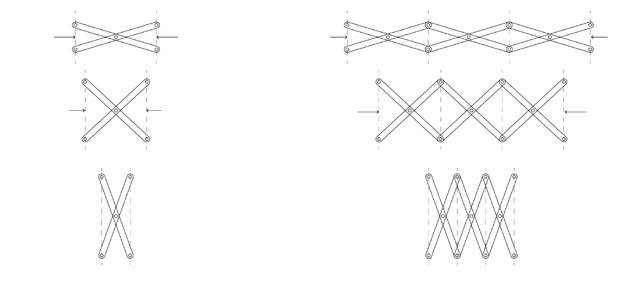
The angulated scissors are made of bent links and therefore have non-collinear pivots. The paths of the pivots of linkages converge at a single point.
The geometry of the link determines the movement of the linkage.
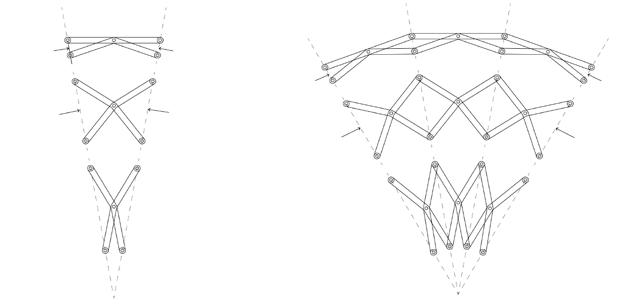
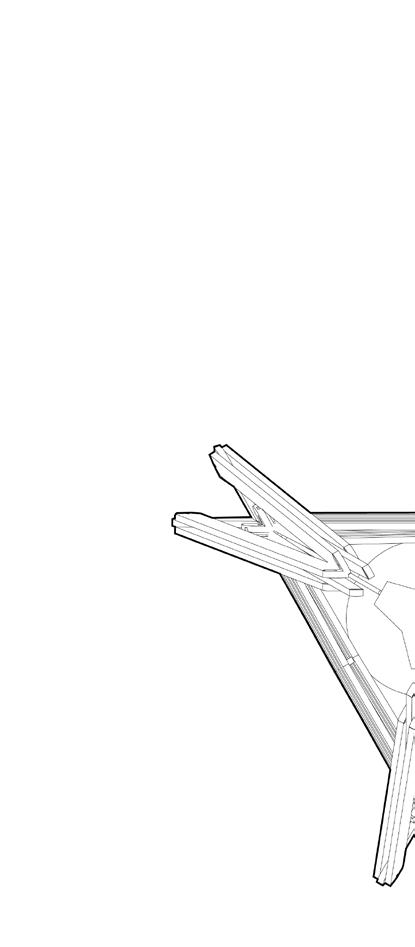
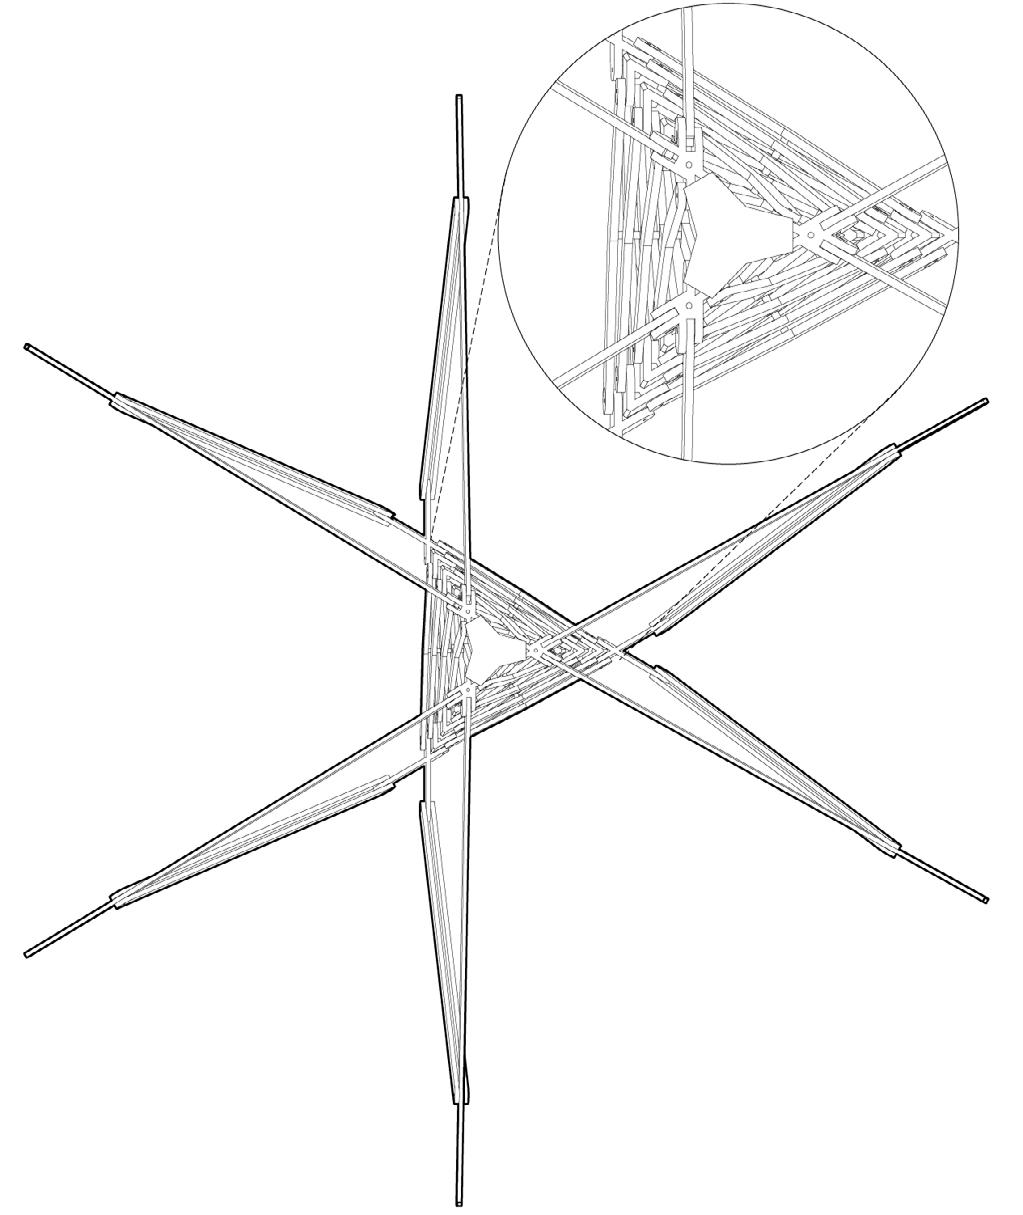
The planar angulated scissors can be projected to the surface of a cone and form a three-dimensional structure. The paths of the pivots converge at the peak.
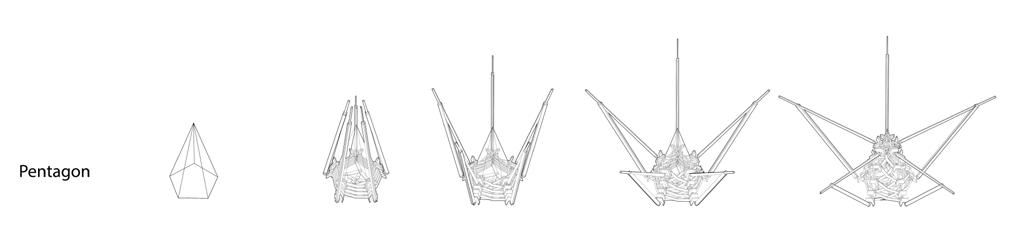
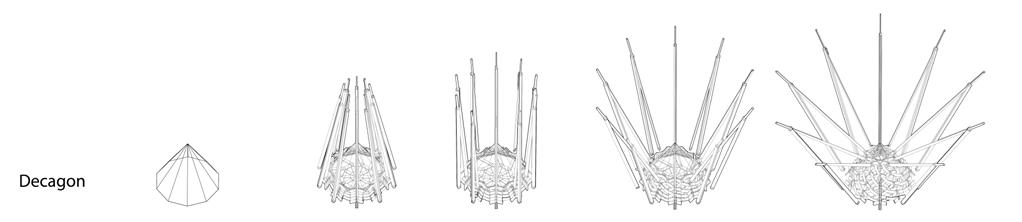
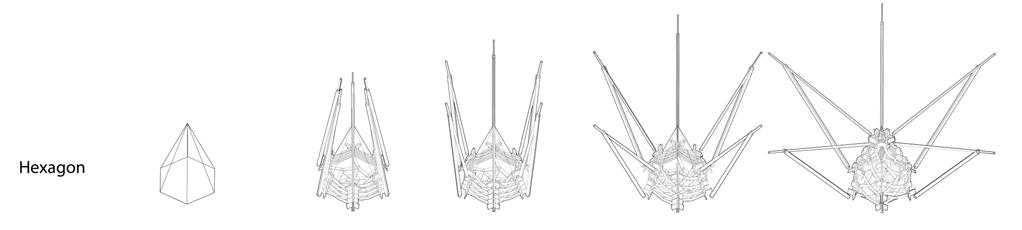
The structure with a radial pattern is symmetric, like the pattern of iris. Hence, it is named as iris structure. The iris structure can have any number of edges larger than three and any number of layers.

1. MECHANICAL
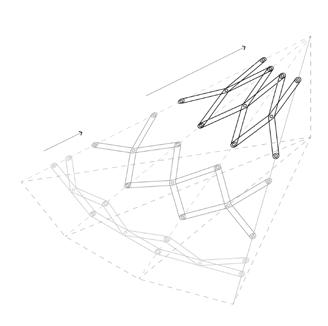
This radial aperture is an innovative technology by Professor Chuck Hoberman. We tried to modify it by adding three groups scissor linkages to the core.


1.2 Play with the Three-dimensional Iris Structure
Hexagon Base
3*6 + 3*3 = 27 scissor pairs
The three-dimensional structure can consist of three layers of angulated scissors. Outer pivots of the inner linkages connect to inner pivots of the outer linkages. The path of the pivots converge at the peak. The structure becomes a cone when expanded.
1 1 2 2 3 3
2.1 Adding “Wings” Around the Core Structure
2.2 Polygons: Typology
2. ITERATION
3.1 Expanding Process

3.2 Contracting Process
1 1 4 4 2 2 5 5 3 3 6 6 3. TRANSFORMING
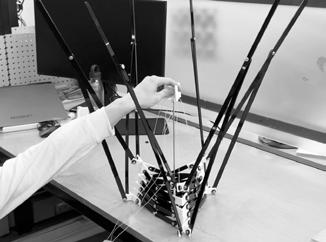
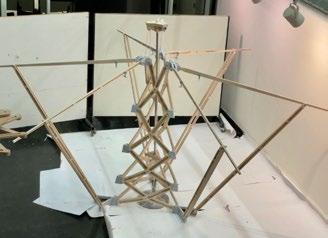
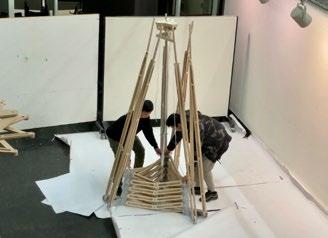
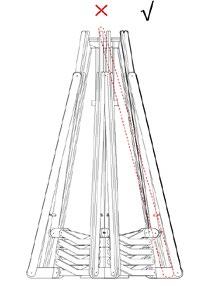
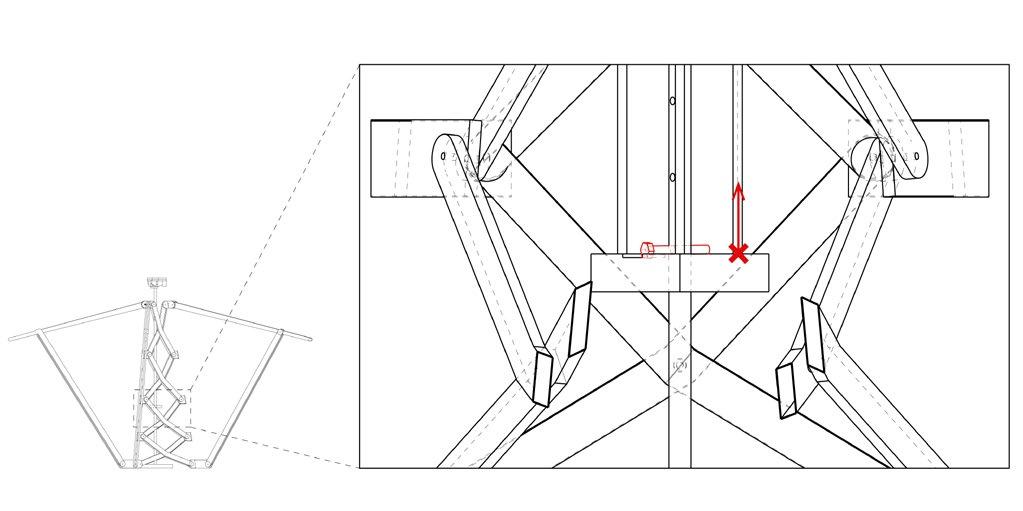
4.1 Contracted
The Iris Kiosk can be fully contracted to a closed position, just like a cone. It is around 55 inches in width and 99 inches in height when contracted. The small dimension facilitates its transportation from one place to another.
Top View
1. “Wings”
2. Column capital
3. Base 1 1
4. Lock 5. Wing’s support 6. Hub C 1 0 5 10 20
4. PLOTTING
The three hubs on the bottom extend a bit outside. Thanks to this design, the pivots of the six “wings” converge on the top of the installation when it is closed. In this position, the installation is more like a sculpture than a pavilion.
The hubs on the four layers are well refined to be able to stack up perfectly. They varies in heights. The hubs, from bottom to the top, are 4.40’’, 4.24’’, 4.15’’, 3.89’’ and 3.83’’ in height respectively.
View
Front View
7. Hub B1
8. Hub B2
1 1 4 5 6 7 8 9 10 2 3 1 40
9. Hub B3 10. Hub A
inches
View 1 1 1 1 1 2 1
4.2 Expanded
Top
1. “Wings”
2. Column capital
3. Base
4. Lock
5. Wing’s support
6. Hub C
7. Hub B1
8. Hub B2
9. Hub B3
0 10 20 40 60
10. Hub A
inches
4. PLOTTING
Front View 3 4 5 6 7 8 9 10
5. DETAILING
5.1 Contracted
5.2 Expanded
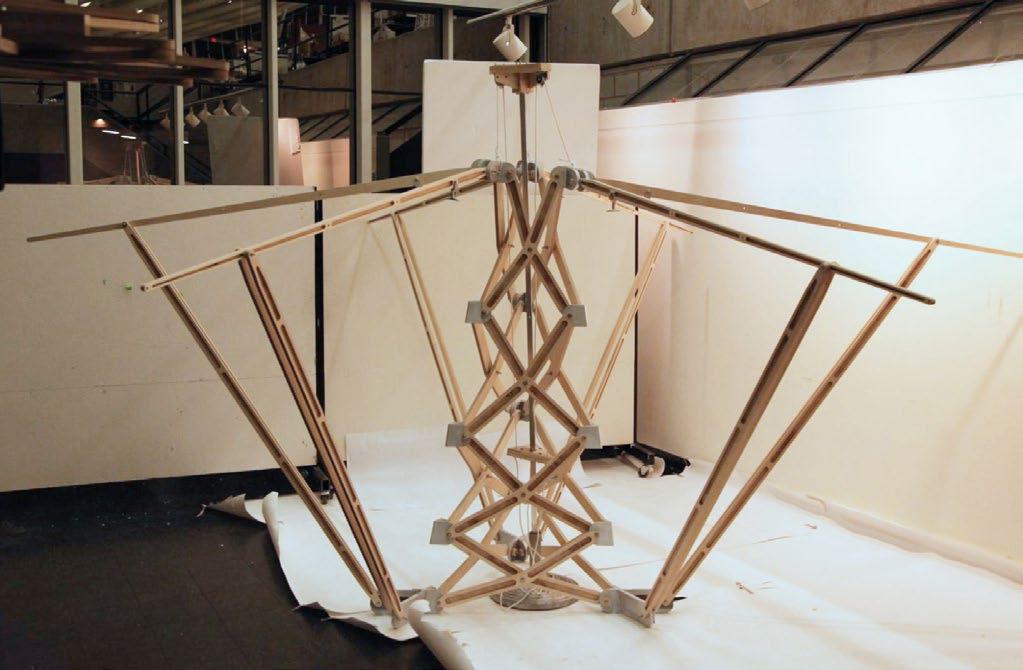
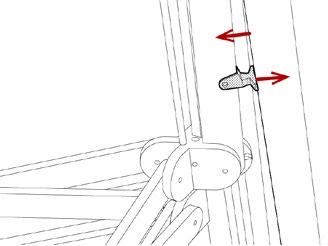
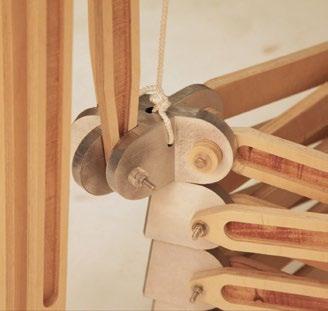
Once we insert the bolt in one of the bolt hole, the wood board tied with strings will be locked and the whole structure will stay at a particular state.
 Hub C Bolt 1
Hub C Bolt 2
Wing’s Support
Hub C Bolt 1
Hub C Bolt 2
1. Lock
2. Bolt
3. Bolt hole
4. String
Hub C Bolt 1
Hub C Bolt 2
Wing’s Support
Hub C Bolt 1
Hub C Bolt 2
1. Lock
2. Bolt
3. Bolt hole
4. String
1 2 4 4 3 3
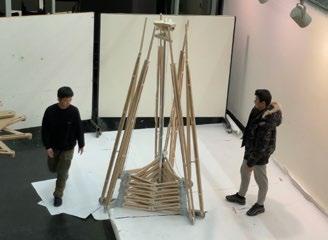
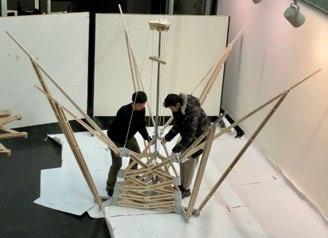
5.3 Photographs
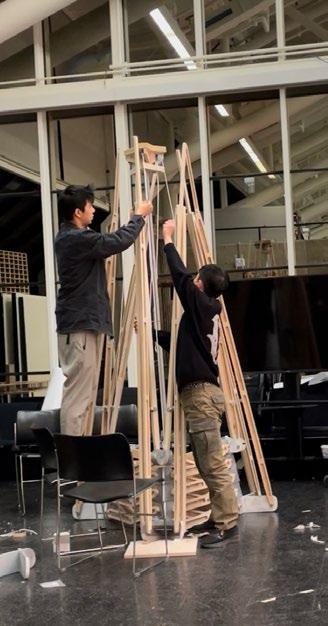
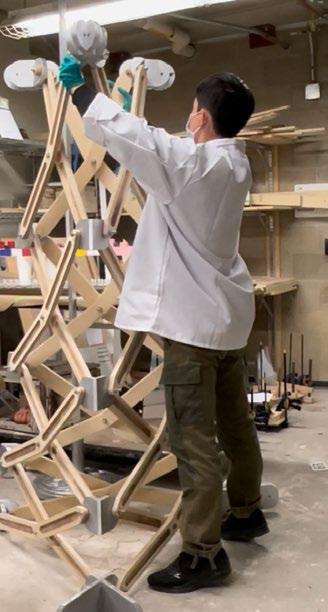
1. Plywoods and PLA hubs stack up at the closed position.
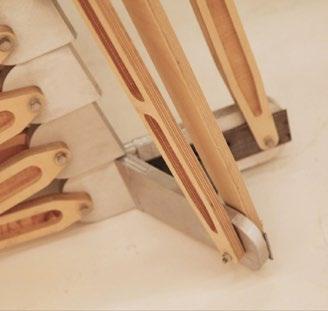
2. Hubs stack up perfectly.
3. A support installed on one wing holds the other at the closed position.
4. The hubs on the top is tied with strings to mobilize the structure.
5. The hubs at the bottom extend a bit outside and is reinforced with iron hubs.
6. The strings go through the pulleys attached to the capital of the column.

1 2
4
6
3
5
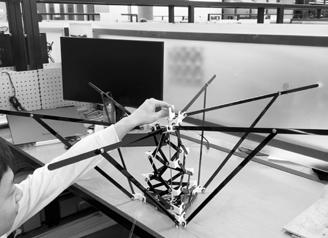
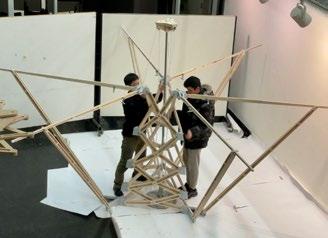
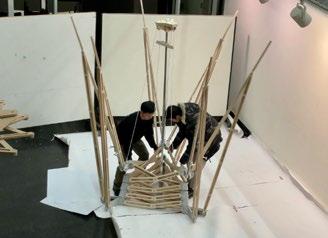
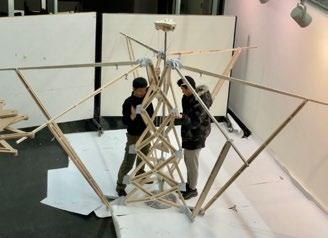
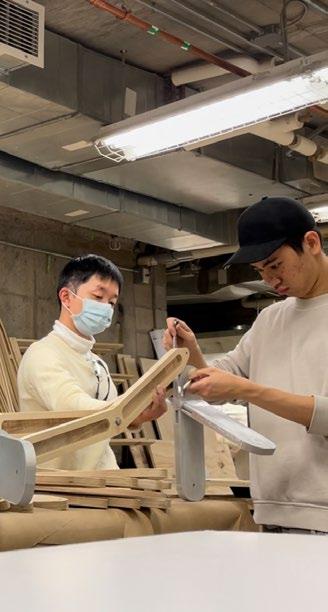
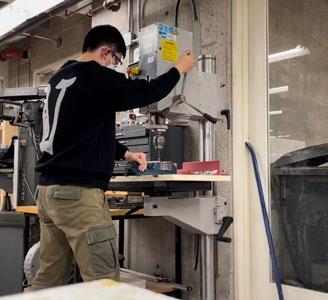
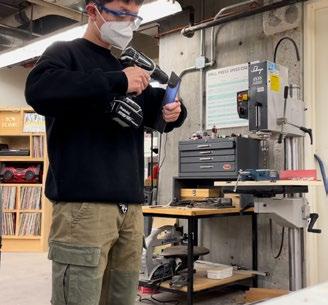
The process of making included CNC, 3D printing, spraying, drilling, sanding, welding, cutting and assembling. It took 5 days in total.
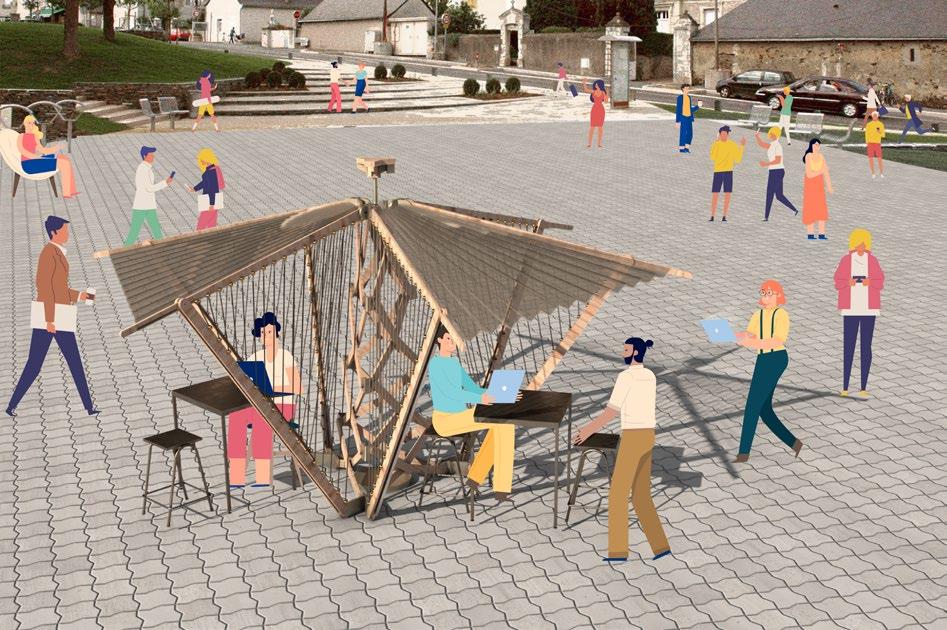
Ideally, ETFE faces will be attached to the wings to provide shelter for users and the installation will be placed at the yard and plazas in Harvard University.
When expanded, the installation provides semi-private spaces for citizens. This kind of space is perfect for picnic, gathering or simply sitting around. It can also be used as outdoor co-working space to pop up at the yards, just as what L.L.Bean’s has already done at the Navi Yard1 It’s cool to “be an outsider at work”!
1 https://www.phillyvoice.com/outdoorcoworking-space-the-navy-yard/
6.
PROCESS OF MAKING
7. RENDERING
Spaces for picnic, gathering or simply sitting around
Outdoor co-working space to pop up at a yard
Exogenous Forces
Form:
Architectural Style Network
Exogenous Forces
PHYSICAL NETWORK VS DIGITAL NETWORK
Urban Analytics
Nov, 2021
Personal Project Instructor: Wenjing Li, Waishan Qiu
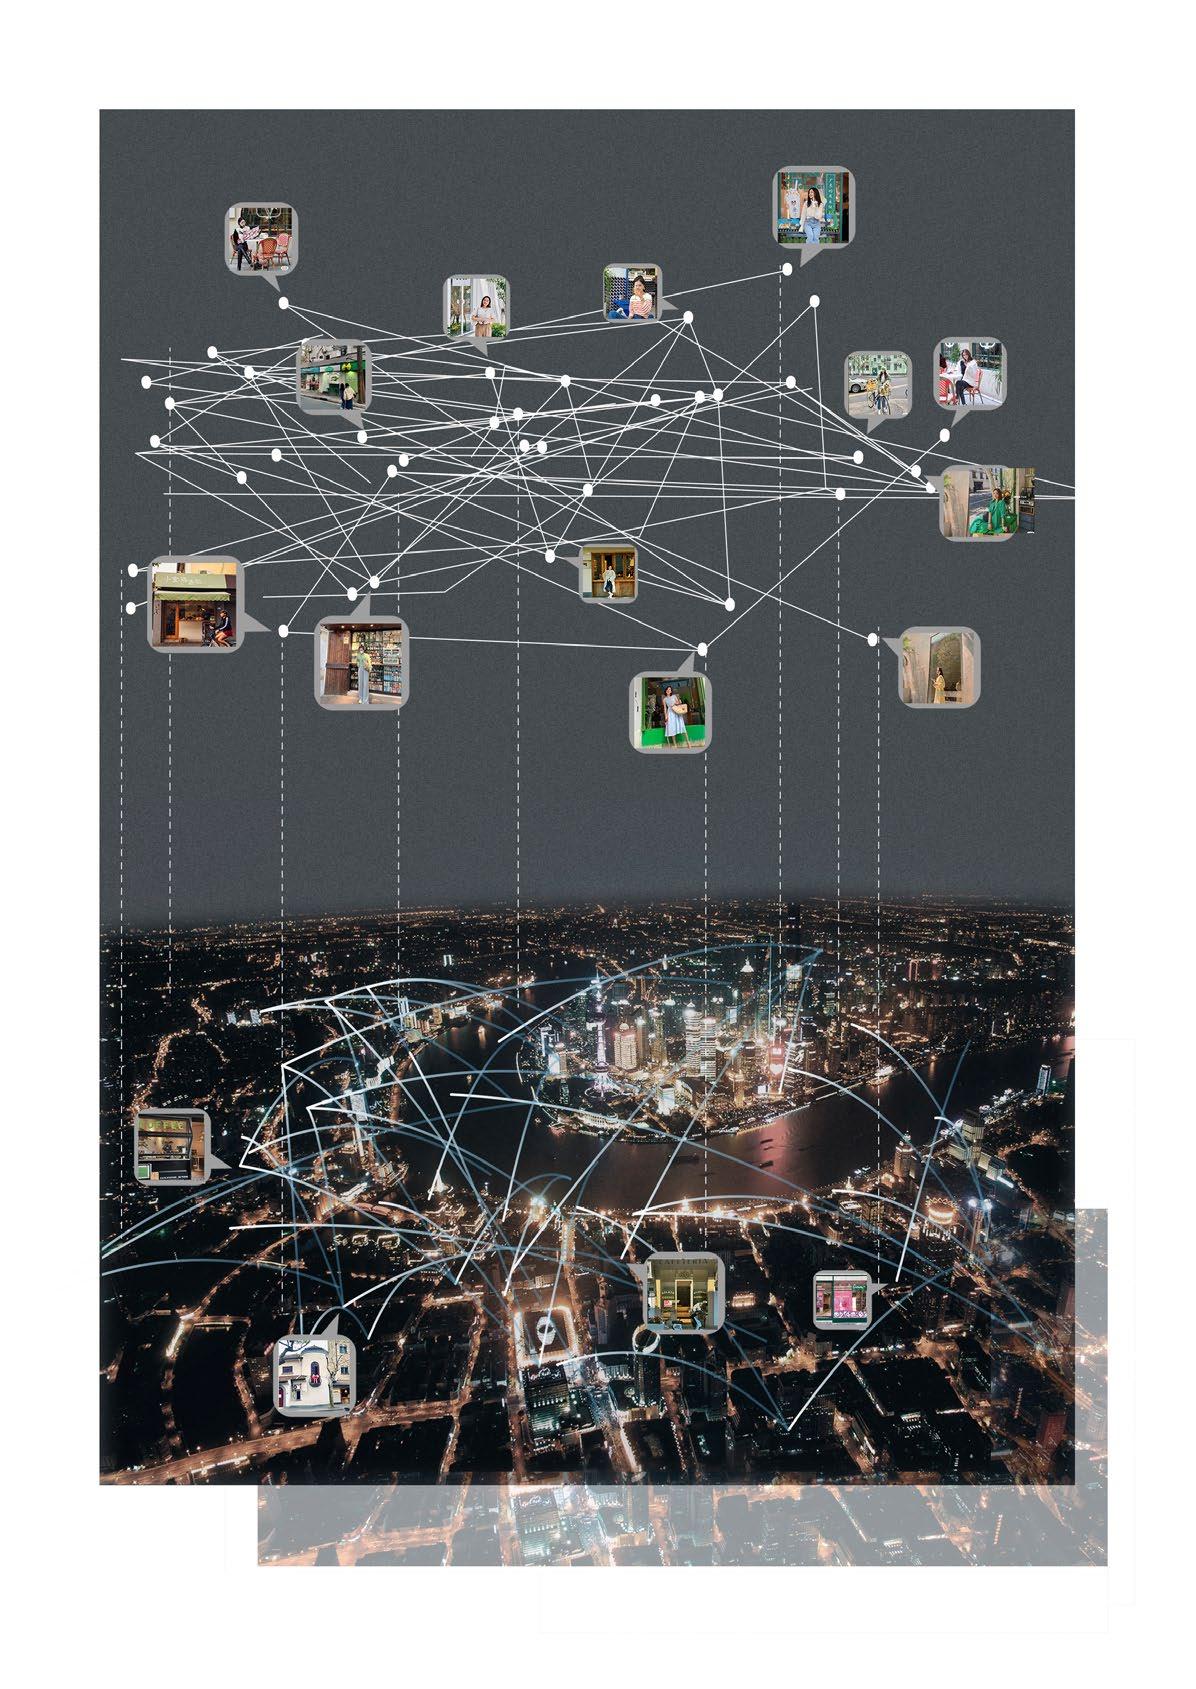
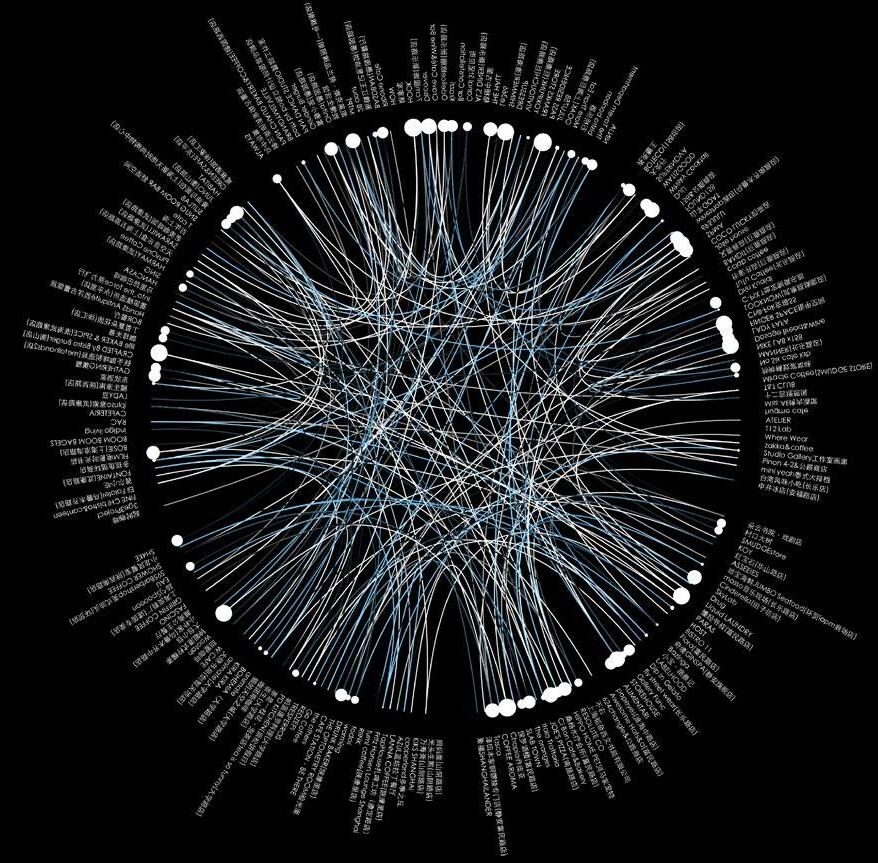
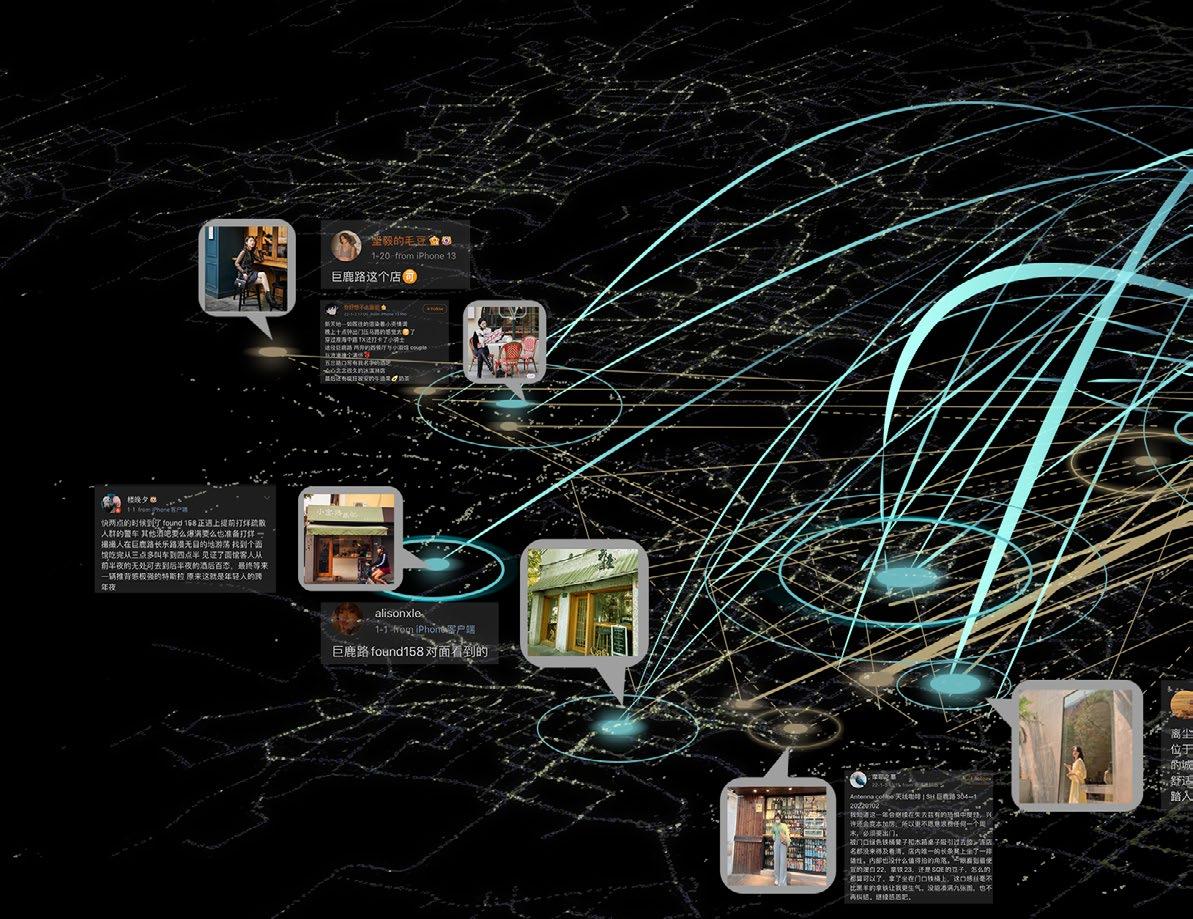
Photos on social media show similarity in the architecture styles of different commercial spaces in Shanghai. To find out whether physical connection or digital connection is more effective for the architectural spillover effect, the study quantify and compare three network: similarity, physical and digital network with the use of photos on social media, metro’s OD data, taxi’s GPS data and Weibo
users’ relationship, respectively. The study drew a conclusion that the digital network play a more important role in the spillover effect, which is also an evidence of the arrival of the image era . Architecture designs are wide spread by image on the Internet and architects tend to create “flatten spaces ”, changing 3D spaces back to 2D images to pursuit good looks in the tiny images on screens.
They look the same but are from different places!


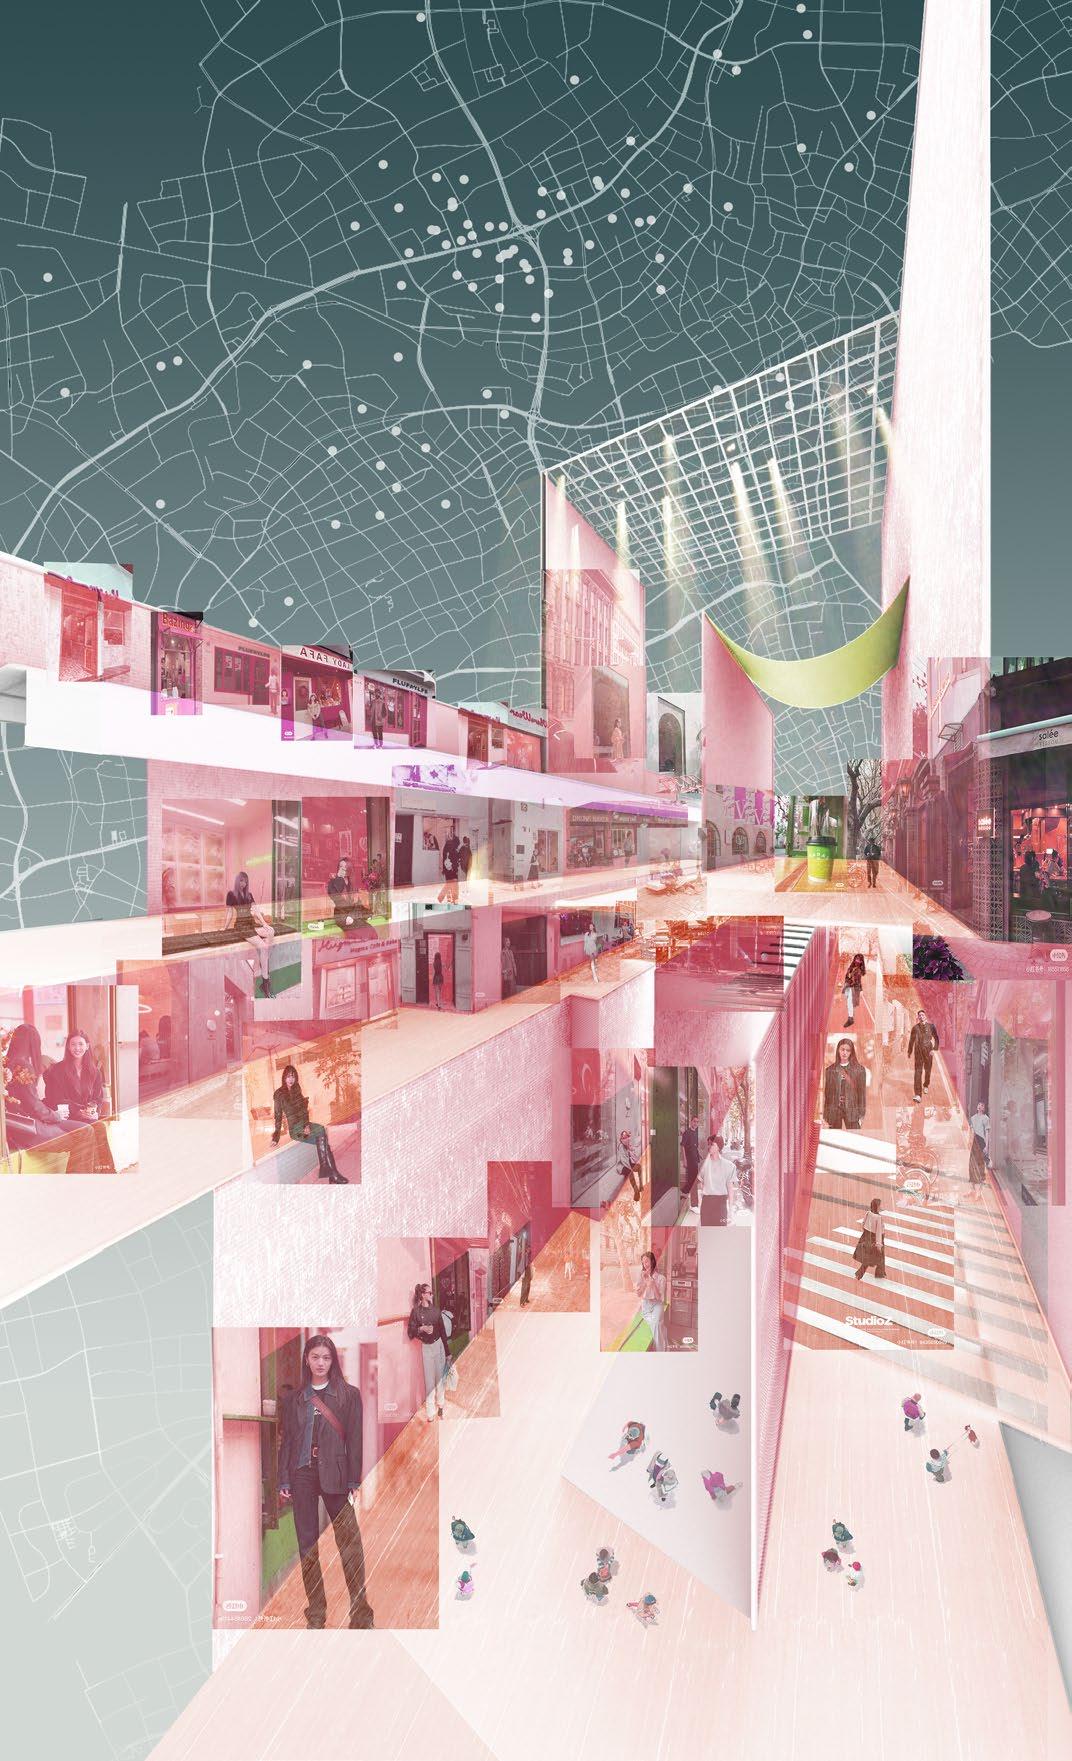
Cyberstreets
0. RESEARCH FRAMEWORK
Physical network or digital network, which is more effective for the architectural style spillover effect?
Photos on social media show similarity in architectural renovation style among commercial spaces in historical areas in Shanghai even if they are far apart. ①Data
②Processing
③Network
④Comparison & Conclusion
Similarity Between Different Commercial Spaces Based on Social Media Photos and Computer Vision


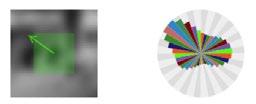
SIFT Key Points
Clustering Analysis and Calculate the Euclidean Distance of the Main Color
Horizontal Pattern


SimilarityAB SimilarityAC SimilarityBC
Thousands of photos posted on the social media were collected. Computer vision helps make quantitative comparison between each pair of photos from different places. The aim is to calculate the similarity between each two commercial places.

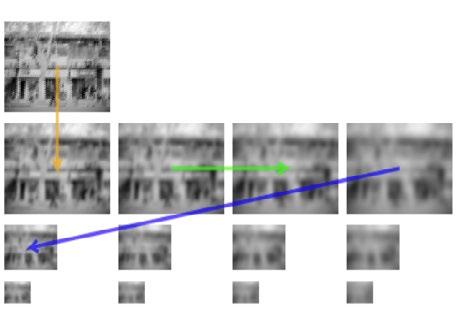
For each two places, each of their photos were paired and calculated from each aspect listed above. The overall similarity is an average of all feature differences for each pair.
1. SIMILARITY NETWORK
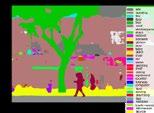
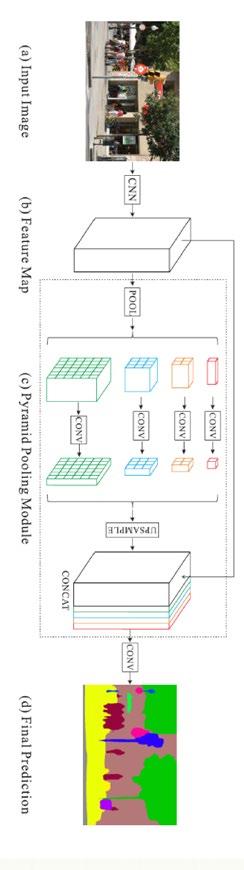
Original Input Image
PSPNet Semantic Segmentation
Mask
Image A Image B Image C
Input Image
Feature Map
Pyramid Pooling Module
Final Predic�on
The Architecture of PSPNet
The Working Principle of SIFT
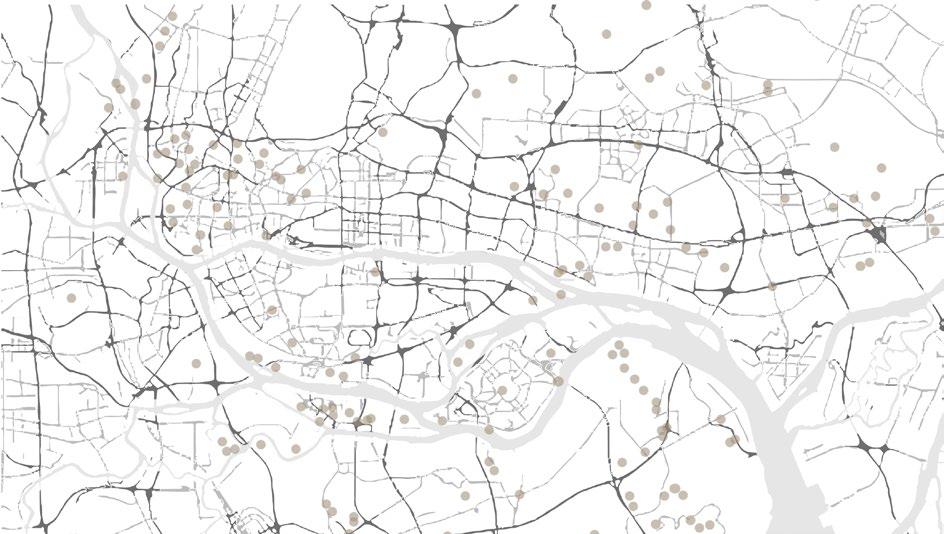
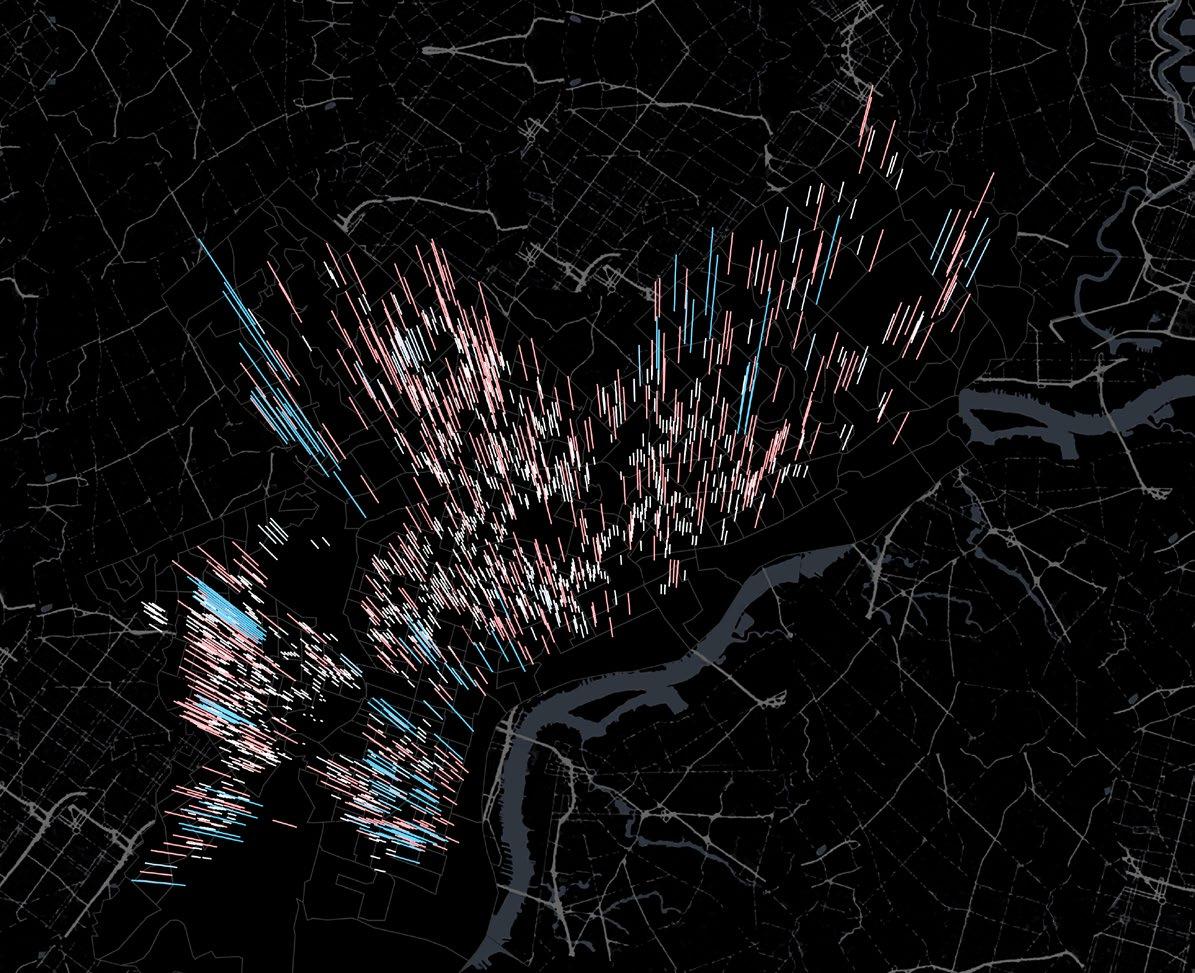
Similarity Network Visualized on Map
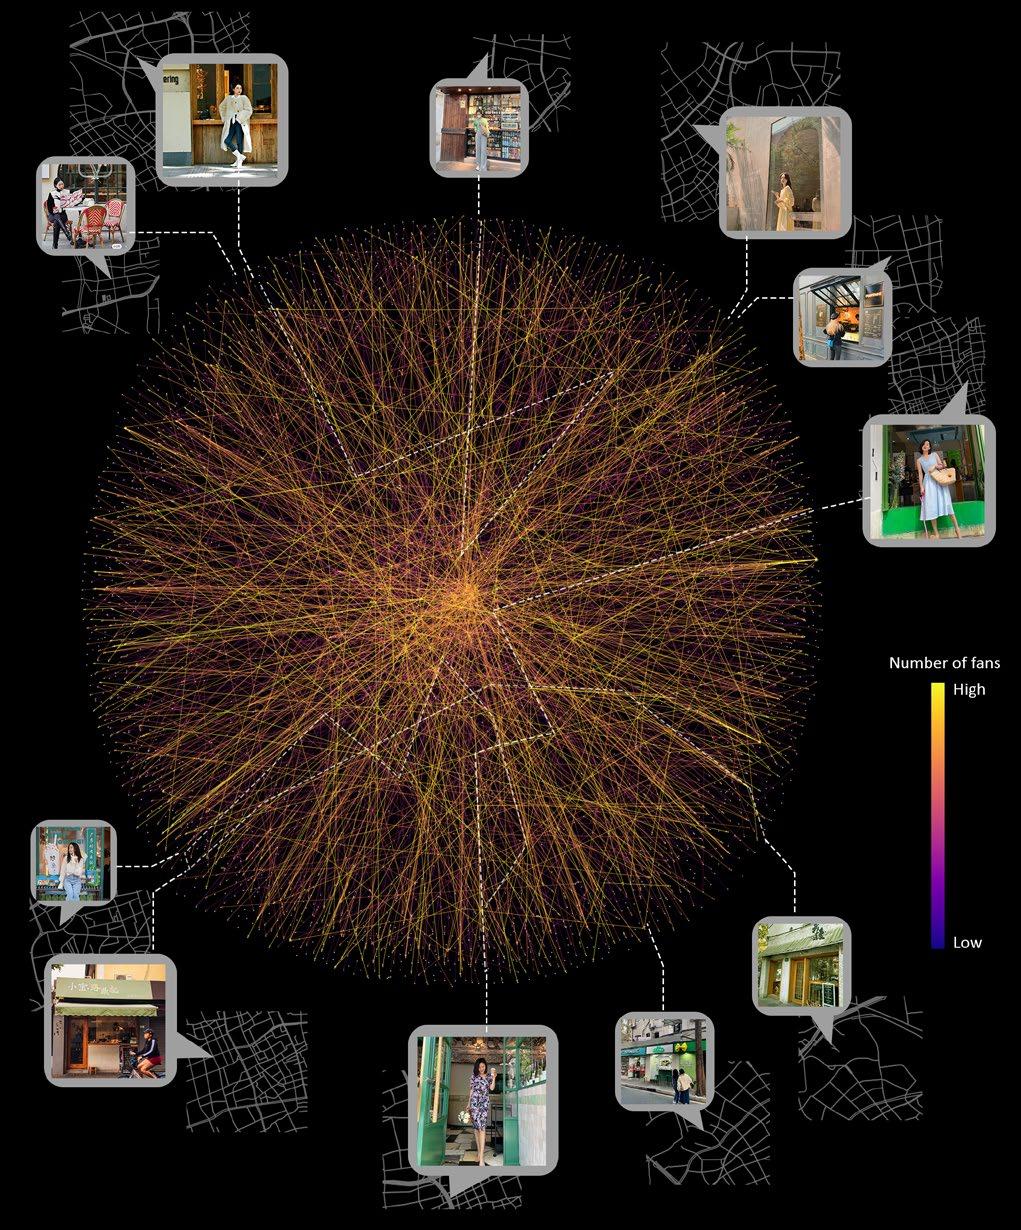
Each line connects one commercial space to another.
The result of the quantitative analysis is a similarity index for each pair. The higher the index, the higher the similarity. The similarities among places form a network, which is visualized on a map.
The data visualization shows that the similarities go beyond space: even commercial spaces far apart from each other are similar in architectural styles. However, whether the physical/ digital connection between two places is high or not still needs to be tested.
Similarity lower than 95 are left out.
RESOLUTE CO
RAC COFFEE
Trees Coffee
Canal St
Bazinga FONTAINE
Go Coffee
Gallery Func
PARAS ipluso
2. PHYSICAL NETWORK
2.1 Metro Commuting Network
Space connection between two places can be quantified using metro passengers’ trip (OD) data and its timestamp. The more passengers going from one place to another and the less time it takes, the stronger connection are established between them.
The impact of the connections between metro stations on each shop will be quantified with an Inverse Distance Weighted (IDW) method.
15,772,842 Metro OD Data in Jun, 2016
MetroA→B = ∑(1/TimeA→B) = ∑(1/Timemetro + DisttoStation/ Vwalk) ID#1 ID#1 ID#2 ID#4 ID#4 ID#3 ID#3 ID#2 Metro ride OD data
2.2 Taxi’s Ride Network
Space connection between two places can also be quantified using GPS data of taxis which take passenger from one shop to another. The less time it takes to go from one place to another, the stronger connection are established between them.
GPS Data on September 13rd, 2016
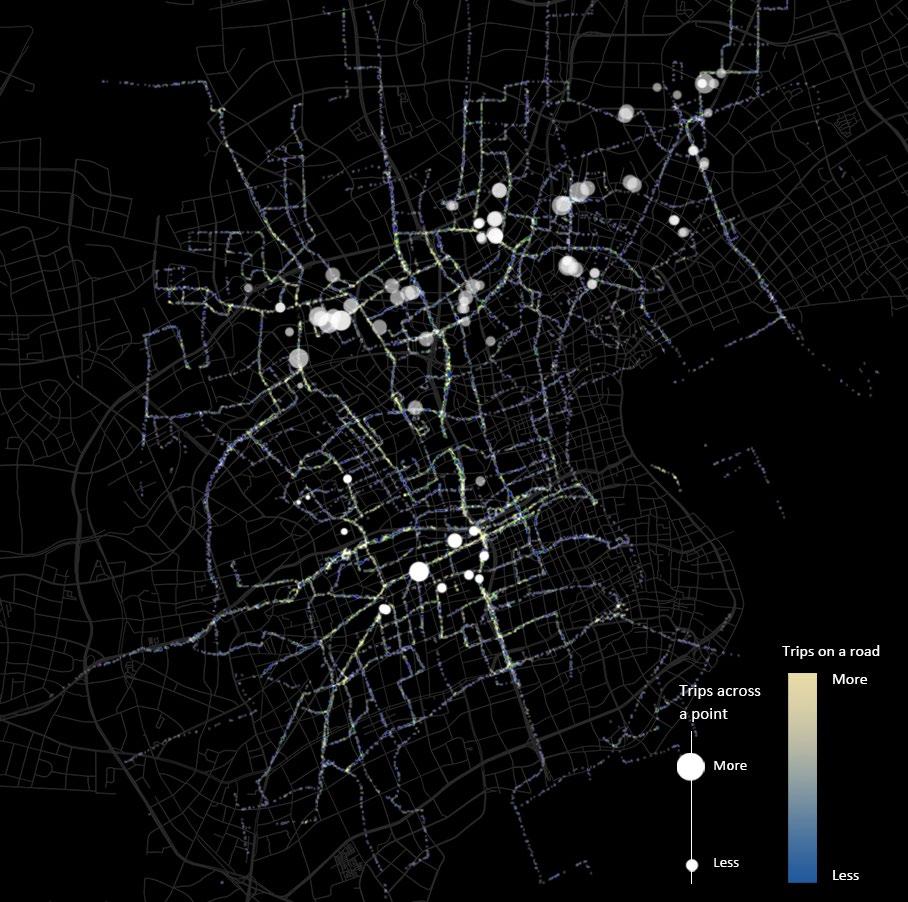
→B = ∑(1/Time 2016-09-13 10:55:42 11:00:31 10:59:22
TaxiA
Data of a taxi ride
2.3 Combining Metro Commuting Network and Taxi’s Ride Network
The values of normalized physical connection cluster around 0 and 100 because commercial spaces are either located on the same street or far apart. Data transformation using logarithm makes the values Gaussiandistributed, which facilitates comparisons in the next step.
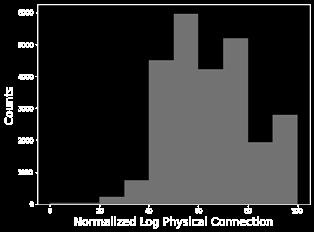
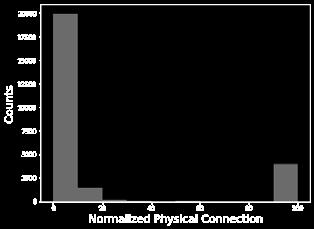
Raw data Data transformation Physical
2. PHYSICAL NETWORK ConnectionA→B = (ln(MetroA→B + TaxiA→B)- min_val) / (max_val - min_val)*100 Logarithm Normalize WHATISGOOD GATHERING PARAS RAC COFFEE
connections lower than 95 are left out.
2.4 Comparing Physical Network with Similarity Network
① For these commercial spaces, the similarity network looks overlapped with the physical network.
Scatter plot shows little correlation between the physical network and the similarity network.
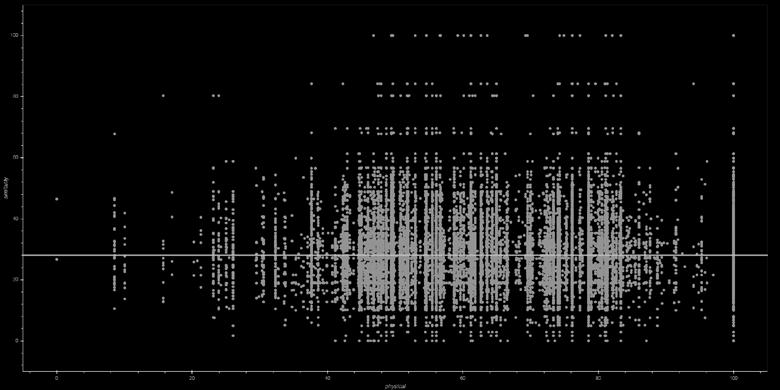
Physical Similarity Values below 95 are left out. — Strong Physical Connection — Strong Similarity Commercial space (Physical) Edges Less More
RAC COFFEE GATHERING
PARAS
WHATISGOOD
①
3. DIGITAL NETWORK
3.1 Weibo Users’ Relationships
The distance of the shortest path from one specific node (user) to another will be calculated and used as an index for digital network connections. The shorter the path, the stronger the connection. The Data was obtained through scraping weibo user’s fans ID and name
First, search a street name on Weibo.
Second, get all posts that mention this street name.
Third, get the user’s name, texts and photos for each post.
Fourth, match each user with the commercial space he/ she mentioned.
User 1@ GATHERING
User 2 @ WHATISGOOD
User3 @ PARAS
User4 @ GoSlow Tea
User 5@ RAC COFFEE
User 6 @ Xiaobao· Lu Dingji
User 7@ Sawada Honka Dorayaki
User 1
User 2
For these commercial spaces, the similarity network looks overlapped with the digital
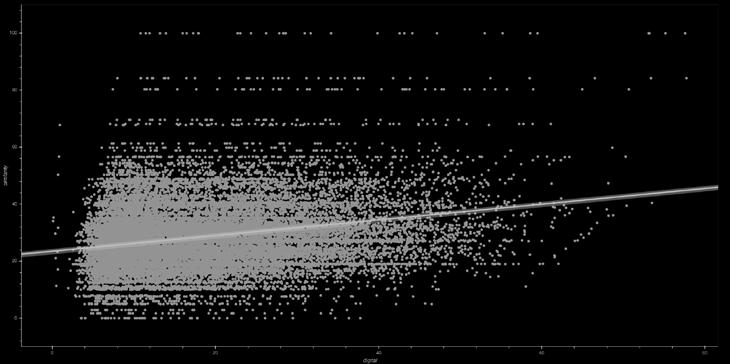
— Strong Digital Connection — Strong Similarity Commercial space (Digital) Edges Less More
digital
Scatter plot shows some correlation between the
network and the similarity network.
PARAS
GATHERING Digital Similarity Values below 95 are left out.
network. RAC COFFEE
WHATISGOOD
4. Conclusion: Digital Network > Physical Network
Scatter plot of three variables- similarity, physical and digital connections
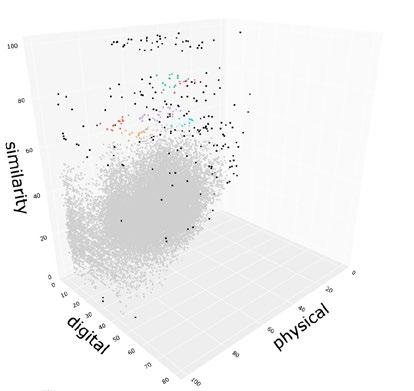
Methods:
(1) Plot all the points in a 3D space
(2) Find out several groups through DBSCAN clustering
(3) Screen out points that represent high similarity(>70) between two places.
Digital Physical
For each ‘high-similarity’ point, which connection is comparatively stronger?
Results: For points whose similarity is high, more of them exist with digital connection order higher than physical connection order when physical and digital connection values are both ordered from low to high.
In the era of social media, a new requirement for architectural design emerges, which is, pursuing the spread of images Internet. Architects tend to create spaces”, changing 3D spaces back to pursuit good looks in the tiny images screens. These good-looking buildings
Digital network
5. Discussion: The Image of Architecture
Architecture
Simple geometries, bright colors, and reflecting materials become common in architecture,
SimpleGeometry
BrightColor
Physical network
requirement which on the create “flatten
to 2D images images on buildings are
generally not considered as good ones since they ignore the quality and experience of space itself and even compromise on functions. However, it should be noted that the spread of images of architecture has a positive impact on the building and the city it locates in. The Guggenheim Museum in Bilbao helped
because these elements bring attractive looks in the tiny images on social media.
ReflectingMaterial
Traditional Architecture
widespread the image of the city. It soon became one of the most prestigious museums in Europe and attracted numerous tourists to visit Bilbao every year. Is the emphasis on images a disaster or a revolution for architecture? It is still an open question.
Form: Scale, Position
Network
Exogenous Forces: Pattern
Form: Scale, Position
ARCHITECTURAL SKIN
Composite Facade Design
Feb to May, 2021
Collaborative Academic Project
Teammate: Ana Celdran
Instructor: Hina Jamelle
Responsibility: 2D diagram, 3D diagram, parametric modeling, parts of the rendering
The project aims to create a architectural skin which is composed of 2D line works, 2.5D and 3D model. It’s like a transition from 2D to 2.5D to 3D. It is initially inspired by an image of rust which consists of 5 phases. Diagram was drawn and structural techniques
were designed. Though organizing the structural techniques, we created an elaborate spatial structure with variations in it. Elaborate work on materiality created a skin with aesthetics and aura.
1. DIAGRAM
An image of rust is translated into diagrams.
There are multiple phases of rusting in the image.

Crawling, spreading
Blending, dirty
Blasting, blooming, kernel
Overlapping, merging, collision
Intense areas in the image are found. Those areas grab our eyes when we look at the image and they impact the pattern of our diagram.
There is a typography for our diagram. Each 2D technique is put on the grid and form the skeleton of this work. The colors of the original image are mapped but are changed into more pale ones.
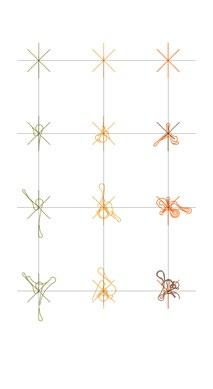
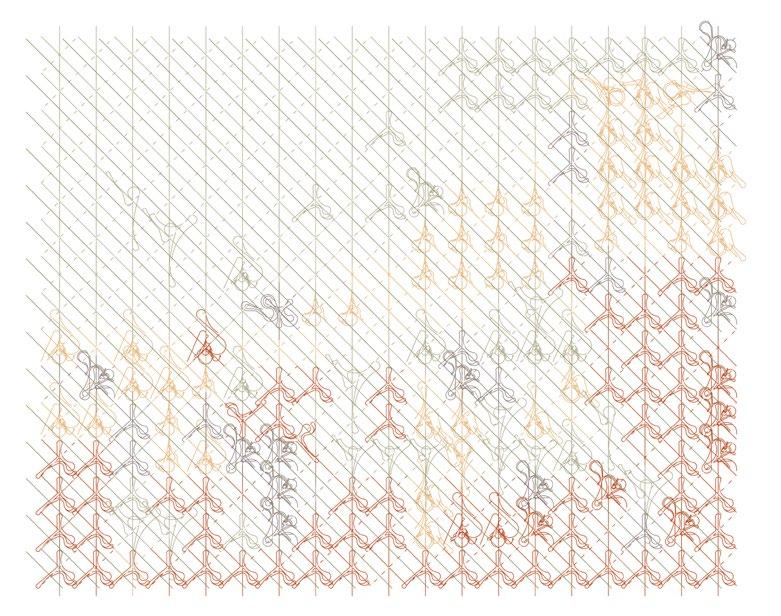 Diagram 1
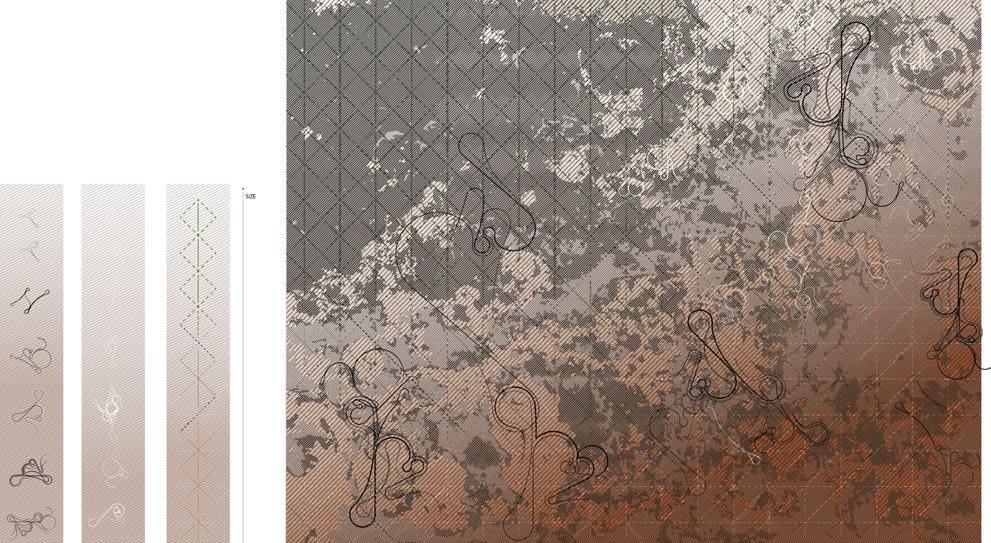 Diagram 2 (Credit to Ana Celdran)
Diagram 3 = Diagram 1 + Diagram 2
Diagram 2 (Credit to Ana Celdran)
Diagram 3 = Diagram 1 + Diagram 2
2. SPACE STRUCTURE

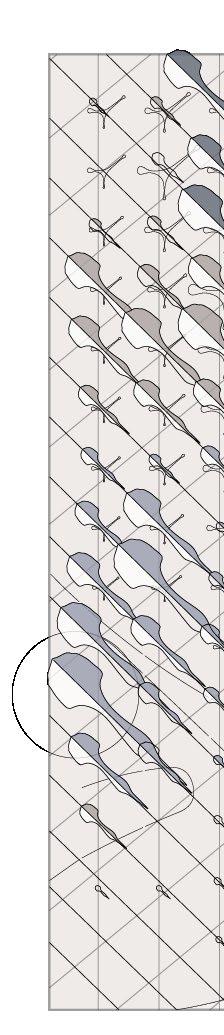
Several structural technique schemes are drawn. Three of them are used in the next step and will be organized in a spatial structure.
The locations of intense diagram affects the Techniques are scaling distance to intense
 Distance
intense areas in our form of techniques. scaling according to their area and the color of
ground where they stand. At the intense areas, the techniques become smaller, showing the diagram in the background. At the most intense area, curves on the
diagram show up. I refined the positions of techniques which are close to these curves to create an interaction between them. That’s where a 2.5D space appear.
Intense Area Intense Area Distance Combination
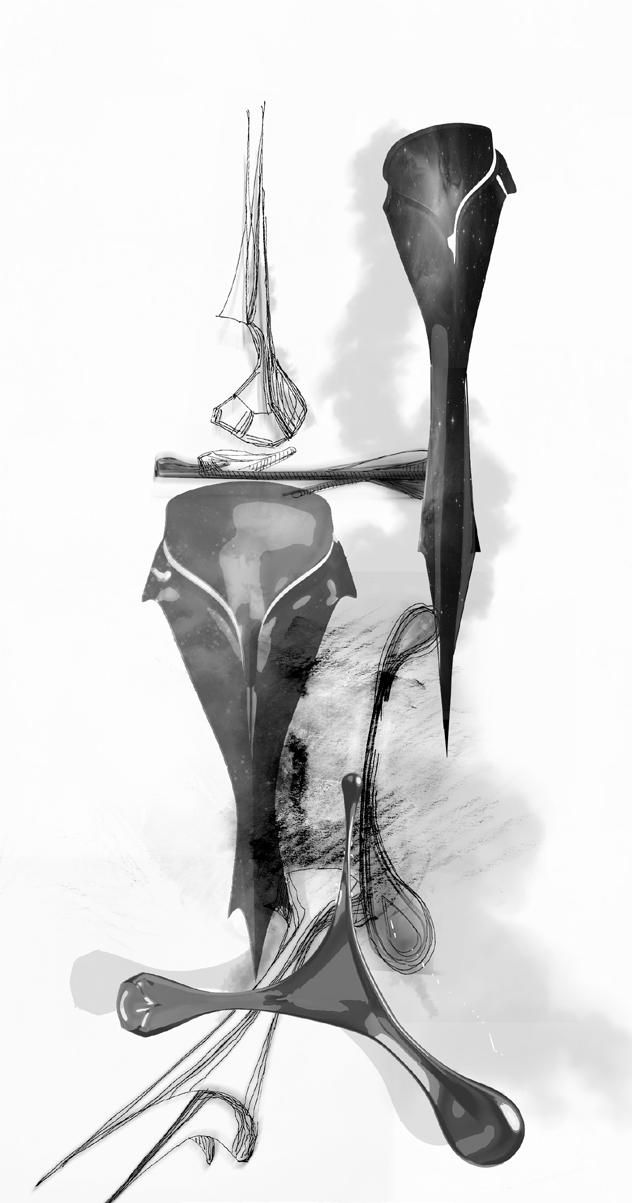
3. AESTHETIC MATERIALITY


The material used on the architectural skins are inspired by objects in the nature and elements in artworks.

The use of 2D diagram as the texture creates a feeling like soil on the ground.
The use of reflecting material created an aura like the space.
 Rendered by Ana Celdran
Rendered by Ana Celdran
Rendered by Ana Celdran
Rendered by Ana Celdran
Rendered by Ana Celdran
Rendered by Ana Celdran
Rendered by Ana Celdran
Materials, Textures and Aura
The projections, the 3D objects, the lines and the textures are blended and become hard to distinguish.
Different scales bring out different details and so we can read different information when we zoom in and zoom out.
This is not common in architecture but is needed. Even each of the moment can be built as a complete project.
Rendered by Ana Celdran
Rendered by Ana Celdran
Rendered by Ana Celdran
4. COMPOSITE SKIN
Audience should have a look on how the objects cluster and how they disappear at places where the techniques become too tiny to see. The gradient is well organized parametrically and under control. Each part, each moment of the
project shows a transition from 2D to 2.5D to 3D and an interaction or conversation between them. So many things happened at a single point: a technique nested to another, the seam continues to the object.
Each of these images is like an artwork when we add a frame around it but each is just a part of a single project. Through the contrast of dark and light, smooth
and rough, we create a vivid surface that arouses different emotions when being watched from different angles.


Form: Digital Interface
Exogenous Forces
Network
FIRE RESPONSE API & APP
A Practical Tool to Provide Fire Department with Situational Awareness
Jan 2021 - May 2021
Academic but also practical project in cooperation with Philadelphia Fire Department
Instructor: Ken Steif, Michael Fichman, Matthew D. Harris, Nathan Zimmerman
Teammate: Huidi Hu, Zirui Chen
Responsibility: Build the API and run it in the cloud (by myself) . Build a web app. Exploratory data analysis. Data wrangling.
For years, the fire department in Philadelphia suffers from lack of the latest information of the property when they get a fire call. This resulted in unnecessary injury in the rescue process. The project presents the methodology of an analysis of property fire risk in Philadelphia and an API & App tool that aims to improve the fire department’s situational
awareness . This new tool can provide real-time information and a relative fire risk prediction for any single property in the city. Though the project is used for Philadelphia only, the approached proposed in this project could help create useful fire response situational awareness tool in any other city around the world.
1. BACKGROUND
Structure fire is one of the most common yet destructive urban disasters. On Nov. 21, 2020, two children were killed in a fire in Philadelphia’s Grays Ferry neighborhood despite rescue efforts by Philadelphia firefighters and desperate neighbors. The fire was reported at about 1:15 a.m. Although firefighters responded within two minutes, the row home was consumed by fire when they arrived.
A New Fire Response Tool
The unfortunate incidents were partly caused by the lack of situational awareness of a property that is on fire. Without latest information of a property, fire fighters could not prepared before their rescue.
Lack of SITUATIONAL AWARENESS
Unnecessary Injury
Succeed in Rescue
Currently, the Fire Department has little ‘situational awareness’ of fire risk for a given location when an emergency call comes in.
Philadelphia Fire Department
Fire Response Situa�onal Awareness API
Previous Fire Data
Exploratory Data Analysis (EDA)
We aim to help the fire department by creating a new API tool that can provide real-time information and fire risk predictions at a fine scale.
Modeling
VariableDependent IndependentVariable ?
Assessment
Feature Engineering
Test locally
Make a predic�on
Applica�on
Parcel level informa�on
We trained a model to predict whether the relative fire risk is high or not for any property in the city. Additionally, we built an API tool that demands an address as an input, requests relative data from other sources, parse all the
Build a docker container
Run in the cloud
data, make a prediction ont the fire risk and output all this information in a clean format. We also created an app as the front end of the API tool.
2. FRAMEWORK
3. ALGORITHM 3.1 Exploratory Data Analysis
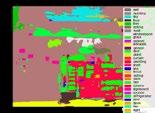
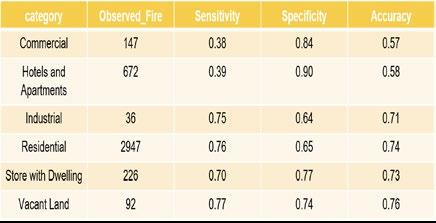
Dependent Variable: Fire Risk ABOVE or BELOW Average
We first did exploratory analysis on the previous fire data in the Philadelphia. We looked into all the parcels in Philadelphia to examine whether there is a higher percentage of fire occurrence in the properties with certain features and found a higher percentage of fire occurrence in parcels with commercial or hotels and apartments properties and those with buildings of RM1/CMX2 category.
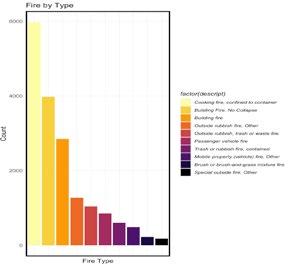
Most fire are caused by cooking fire, which indicates that we should pay attention to the equipment condition in the kitchen for each property when predicting the risk. The fire incidents substantially increased in 2018 an 2019. The data set lacks some fire data in 2020 due the impact of the pandemic.
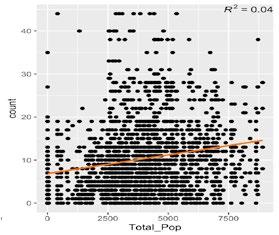
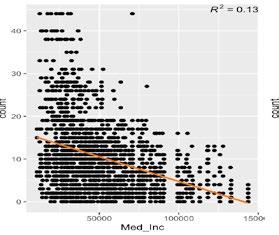
The scatter plot on the left shows clear relationship between fire counts and the median income of a census tract: The lower the income, the more fires took place. The relationship between fire count and population is not that clear. It seems the areas with highest or lowest population are less likely to suffer from fires.
 Alley light outage Parcels with commercial properties
Parcels with CMX2 zoning type
Alley light outage Parcels with commercial properties
Parcels with CMX2 zoning type
No
heat
Parcels
with RM1 zoning type
Risky
factors
Parcels
with properties below average
Infestation
Parcels
with structurally compromised properties
Parcels
with unsafe structures
Building dangerous Parcels with hotels & apartments Parcels with fire equipment problems
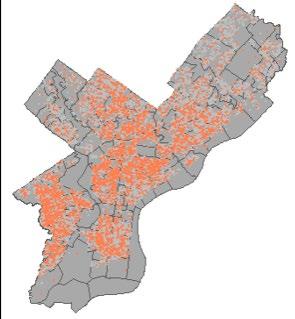
Has Fire No Fire Previous fires as points Fires by years
Scatter plot of fires & median income by census tract
Fires across census tracts Fire Property on Fire More Less
Scatter plot of fires & total pupulation by census tract
Fires by type
Demographic Characteristics <---> Previous Fire
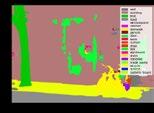
Total Population by Tract
The northwest and northeast of the city have the highest population. Most Whites gather at the east and the west of the city.
Percentage of Whites by Tract
Median Age by Tract
The west and northeast corner live more elder people.
Median Income by Tract
The median income is highest at the northwest corner of the city.
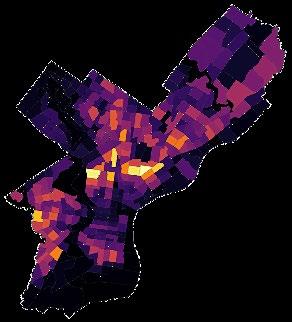
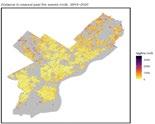
Past Fire Count by Tract
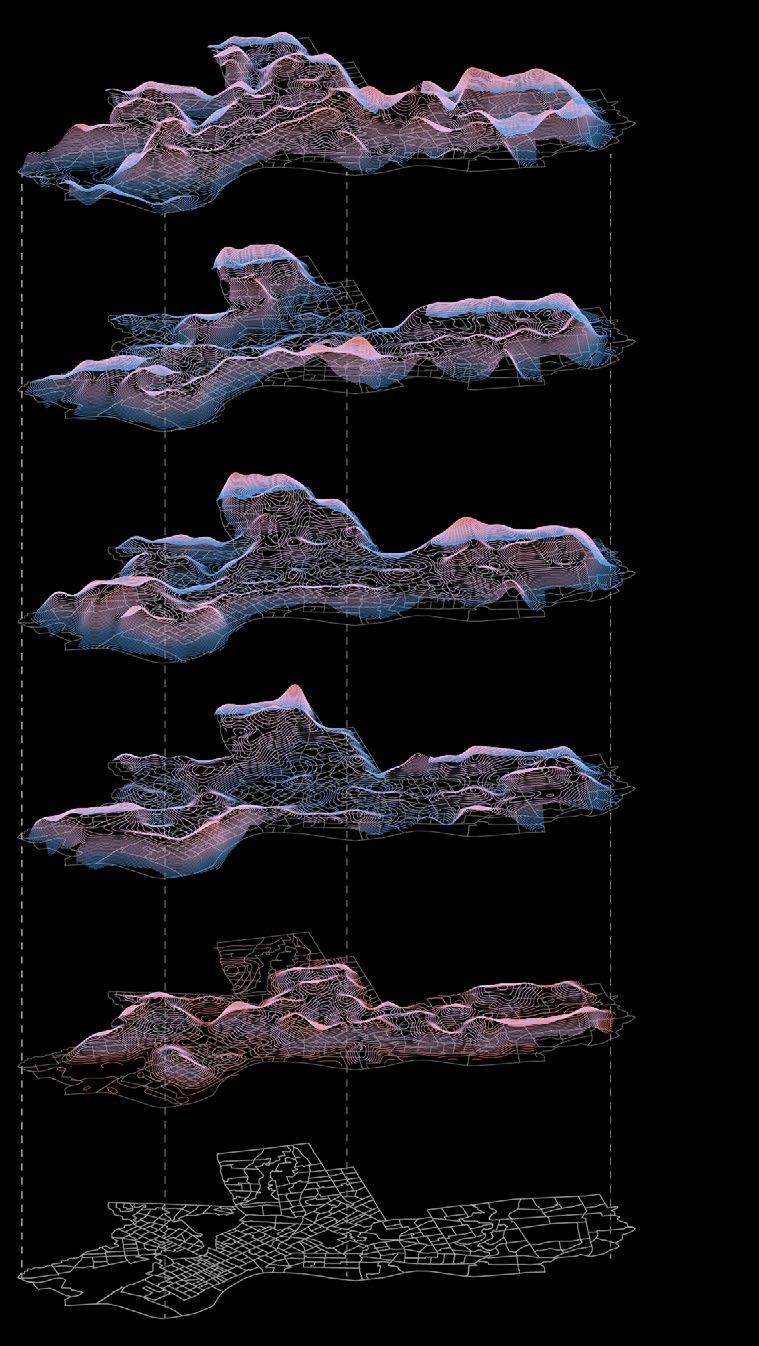
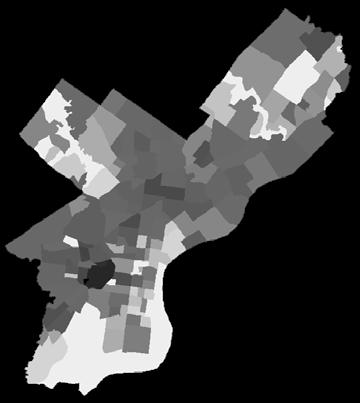
The pattern of fire count across census tracts can be compared directly with the demographic characteristics above.
Census Tract
All the visualizations above are based on data aggregated into census tracts.
3.2 Feature Engineering
Having explored the relationship between various features and the past fire events, we proceeded to build our model to predict the fire risk for each property in Philadelphia.
3.3 Training
The final predictor variables are classified into 4 categories: fire feature, demographic feature, property feature and risk factor (on the right I show only part of the significant variables). The goal of our model is to learn from observed fire events to predict the relative fire risk for all parcels. We resampled the dataset until the catching-fire percentage raised to 20%, i.e., once in every 5 properties. This resampling processed helped to improve the model accuracy. However, it also distorted the probability of buildings catching fire. In other words, our model tends to predict more buildings fires than in reality. With our final predictor variables determined and training set resampled, we proceeded to test different algorithms to identify which
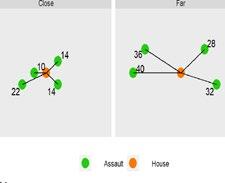
Searching radius: Only return information of the properties within the circle.

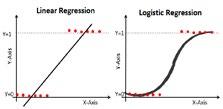
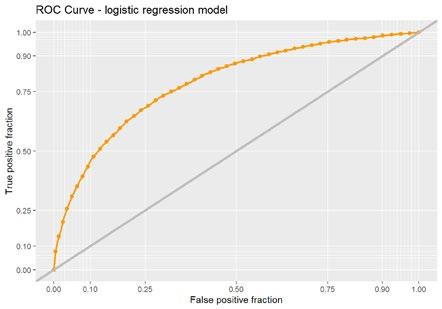
would be the best in predicting property fire risk in Philadelphia. We developed a generalized linear regression model (GLM) and a random forest model (RF). As we compared the model criteria, we found that the RF model showed no significant superiority compared to the GLM model in terms of sensitivity and specificity. Thus, we decided to adopt GLM as our final model, for its relative simplicity ensured higher interpretability.
for Training Set
Outcome Before Resampling Before Resampling After Resampling After Resampling
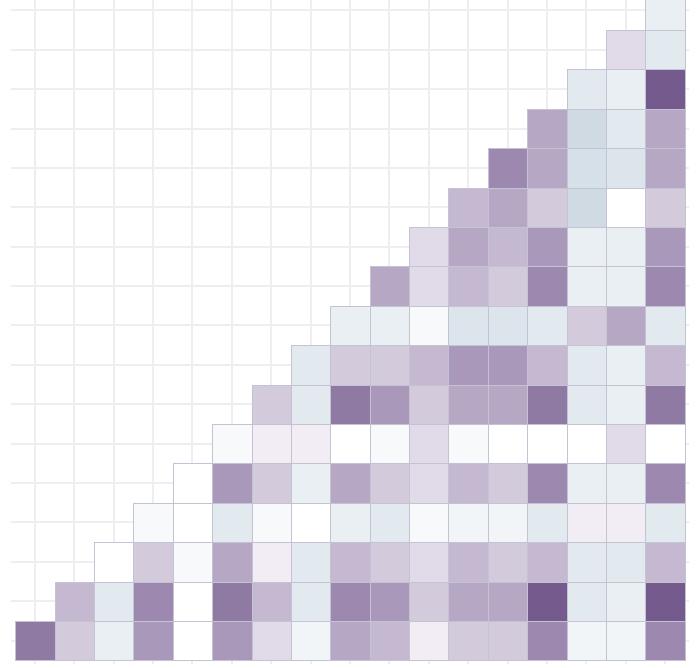
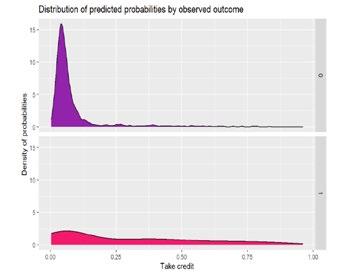
Correlation Matrix Resample Data
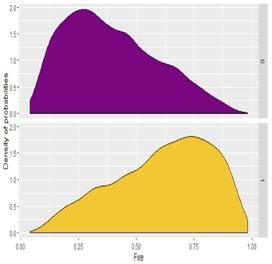
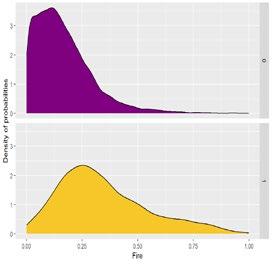
Distribution of Predicted Probabilities by Observed
3. ALGORITHM LagFire.nn5 311Requestnn5 RM1zoningtype Building Age BuildingAge Neighborhood ID NeighborhoodID Problems with Fire Equipment Problems ProblemswithFireEquipment Total Population Total Population Alley light outage Alleylightoutage Category Category Building dangerous CMX2 zoning type Building dangerous Interior condition Interiorcondition Census Tract ID CensusTractID Unsafe Structure UnsafeStructure Median Income MedianIncome No Heat NoHeat Percentage White PercentageWhite Infestation Infestation Zoning type Zoningtype nn5 measurement:
the geospatial
To measure
impact of a factor To predict a bivariate variable
Logistics regression
3.4 Prediction & Assessment
Accuracy:
75%
of the properties that are predicted to be high risk based on data in 2018 did catch fire in 2019.
Unpredicted Fire
Correctly Predicted Fire in Neighborhood with High Accuracy
Correctly Predicted Fire in Neighborhood with Low Accuracy
Generalizability Across Space
We tested our model’s generalizability across land use types. Our model works best on residential properties.
The hotel and commercial properties seem to have very different characteristics.
Accuracy Across Building Type Correctly Predicted Area Incorrectly Predicted Area
4. API CONSTRUCTION
4.1 Introduction to API
4.2 Local & Cloud Construction
First, the API we built can provide real-time data. It requests the latest data only when getting an input.
Second, the API integrates data from diffuse data sources of the city. It’s convenient to use

it because it gives us all the information we want in only one request.
Third, the API provided clean and consistent data for us. It means the API gives back data without redundant or irrelevant
An API is an interface that defines interactions between multiple software applications. When someone uses an application on his or her device, the application connects to the Internet and sends data to a server. The server then retrieves that data, interprets it, performs the necessary actions and sends it back to the device. The application then interprets that data and presents the information in a readable way.
4.3 API Example
information. It also structures it to make the response highly readable.
Last but not least, the API facilitates developments of multiple apps without conflict. Apps can use the same API to get data.
Input an address in Philadelphia Get the output:
Data1 Data2 Data3 Data4 Data1 Data2 Data3 Data4 R Package1 R Plumber Docker Container Docker Hub Internet EC2 Instance Virtual Machine port:8000 Apache Reverse Proxy h�ps h�p Local host port:8000 R Package2 R Package3 R Package4 Backend API Delete Put Get Post Custom
INPUT 09:00:51

4.4 The Architecture of Fire Response API


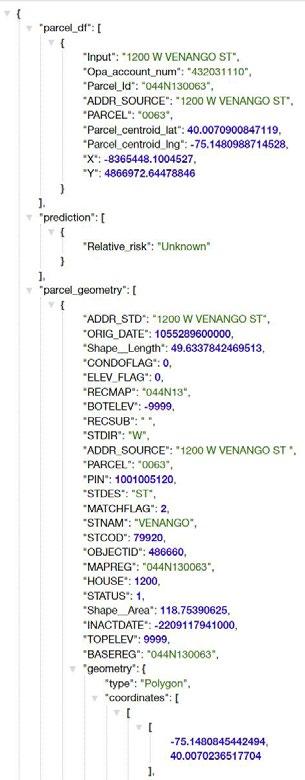
The API get an address as input, request basic information and data needed for prediction. It outputs all the inttegrated data and the relative fire risk prediction in a clean format.
CensustractnumberCensusblocknumber ParcelID


To get the basic informa�on of a property
Access to the API: https://www.fireapi.me/ parcel_info?addr=1911 S GALLOWAY ST
could be any address in Philadelphia
Propocessedlagfire Distancetothenearest fivepastfire
Parcelgeometry Codeviola�on
Codeviola�on
OpenPhilly|DOR,Proper�es& AssessmentHistory,L&Idata,311Request Parcelinforma�on

311requestlastmonth
311requestinpast2years
Popula�onBlackMedianIncome popula�onWhitepopula�on
CensusAPI
OpenPhilly|Proper�es&AssessmentHistory
"#of_rooms", "year_built"...viola�on_df:"viola�oncode","viola�on_summary","viola�oncode�tle", "viol_count"... census_df:“census_tract”, “census_block”, “popula�on”, request311_within100m“white_popula�on”... request311.nn5, nearby_parcel_df: cartodb_id, opa_account_num, Parcel_Id, zoning...
OUTPUT09:00:55
nearby parcel_df: "Opa_account_num", "Parcel_Id", "Parcel_centroid_lng","X","Parcel_centroid_lat", "Y"...
parcel_geometry proper�es_df: "frontage" "#of_bathrooms""number_stories", "#of_bedrooms”, "#of_rooms", "year_built"... viola�on_df:"viola�oncode","viola�on_summary","viola�oncode�tle", "viol_count"... census_df:“census_tract”, “census_block”, “popula�on”, “white_popula�on”... request311_within100m request311.nn5,.
Rela�vefireriskpredic�on
nearby parcel_df: "Opa_account_num", "Parcel_Id", "Parcel_centroid_lng","X","Parcel_centroid_lat", "Y"...
311requestwithin100m parcel_df:"Opa_account_num", "Parcel_Id", "Parcel_centroid_lng","X","Parcel_centroid_lat", "Y"... parcel_geometry proper�es_df: "frontage", "#of_bathrooms""number_stories", ,"#of_bedrooms”,
nearby parcel_df: "Opa_account_num", "Parcel_Id", "Parcel_centroid_lng","X","Parcel_centroid_lat", "Y"... parcel_geometry proper�es_df: "frontage" "#of_bathrooms""number_stories", "#of_bedrooms”, "#of_rooms", "year_built"... viola�on_df:"viola�oncode","viola�on_summary","viola�oncode�tle", "viol_count"... census_df:“census_tract”, “census_block”, “popula�on”, “white_popula�on”... request311_within100m request311.nn5,.
parcel_geometry proper�es_df: "frontage" "#of_bathrooms""number_stories", "#of_bedrooms”, "#of_rooms", "year_built"... viola�on_df:"viola�oncode","viola�on_summary","viola�oncode�tle", "viol_count"... census_df:“census_tract”, “census_block”, “popula�on”, “white_popula�on”... request311_within100m request311.nn5,.
nearby parcel_df: "Opa_account_num", "Parcel_Id", "Parcel_centroid_lng","X","Parcel_centroid_lat", "Y"... parcel_geometry proper�es_df: "frontage" "#of_bathrooms""number_stories", "#of_bedrooms”, "#of_rooms", "year_built"... viola�on_df:"viola�oncode","viola�on_summary","viola�oncode�tle", "viol_count"... census_df:“census_tract”, “census_block”, “popula�on”, “white_popula�on”... request311_within100m request311.nn5,.


Parcelgeometry within50m Algorithm
To know the rela�ve fire risk
010001100101001010001100101001 010001100101001 010001100101001
Atlas|phila.gov
Get the ID of a property Request real-�me data
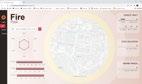
We created an web app which serves as a front end of the API tool. Access to it: https://haoheng-tang.github.io/fireapp21/
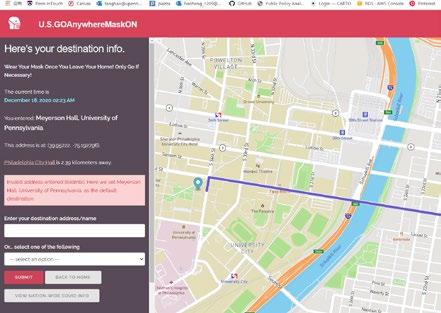
It’s just a sample product that use the API to grab data and visualize them on the user interface. How does the app work? When getting a fire call, officials in the fire department can input the address and hit “go” button, then the input parcel will show up on the map. On the left sidebar, information for this parcel is provided. First look at the upper-left corner. It says above average. That’s the relative fire risk assessment for this parcel. Why above average? Well, it’s calculated by our model which uses the data we
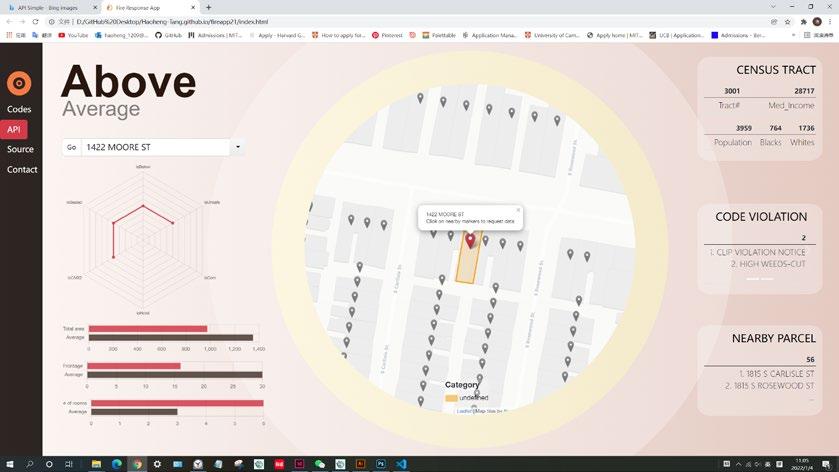
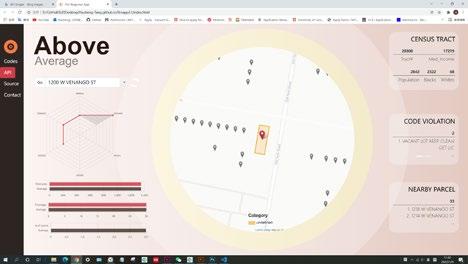

grab. I show most of the data on the web interface. It includes total area, frontage(or the width of a parcel facing the street), the number of rooms. On the right side, there are census data, 311 request and nearby parcels’ information. Since all the data grabbed from other places is up-to-date, the information and risk assessment is real-time updated. Don’t be surprise by the change of it when doing daily inspection, it indicates that the change of situation in the real world.
5. WEB APP
The responsive design of the website makes it easy to adapt to different devices.
Fire fighters can search for information of the properties which are close to the on-fire one when heading to the site.

Besides the input address, the parcels within 50 meters also show up on the map. It’s important to know whether the fire will spread to these parcels, and which of these parcels are likely to catch fire. Click on one of these markers, the web page will change and provide information for that parcel. By doing so,
you will know the risk assessment of those parcels close to the one on fire and decide whether to pay more attention on them. You see, all the information changed to that parcel’s, and as is shown, its relative risk is also above average.
Other works
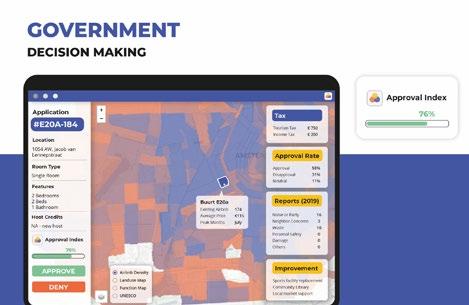
A Participatory Decision Platform with An Algorithm to Forecast Airbnb Revenue in Amsterdam
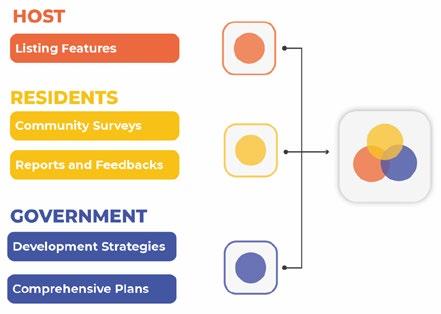
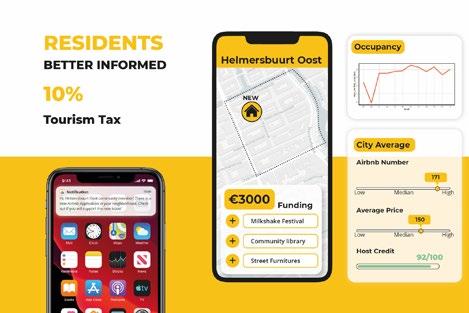
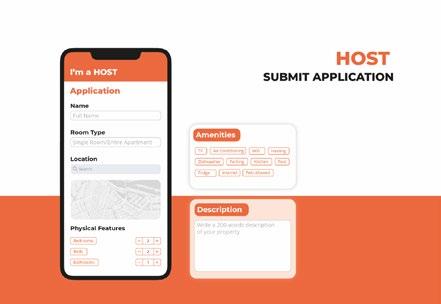
Teammate: Yihan Zhang
Building A Web App
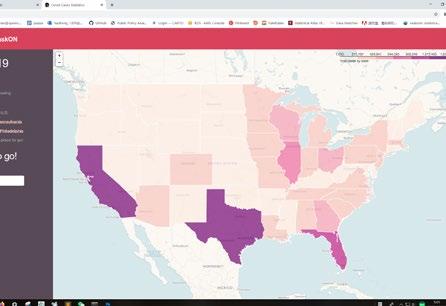
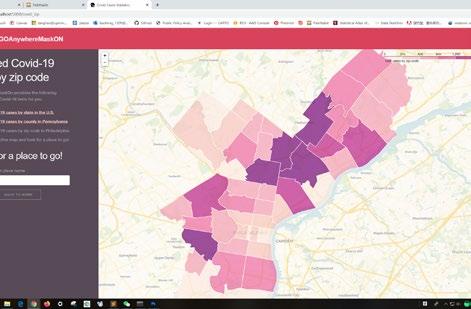
A Web App to inform users about COVID 19 info and to provide navigation.
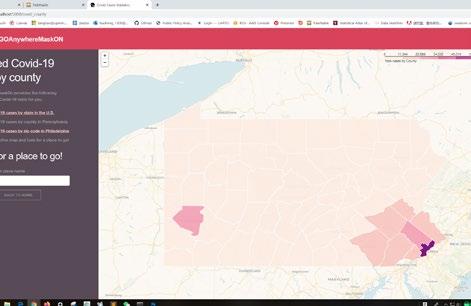
Teammate: Zhijie Zhou
UX & UI Design
Data Science Plot
Suitability Evaluation For A Drone Base
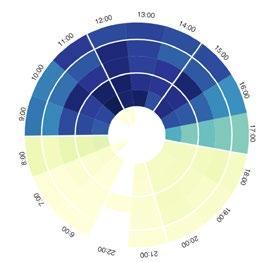
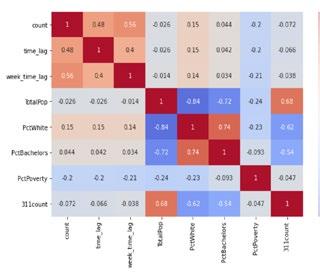
Correlation Matrix Parking Pattern Across Time
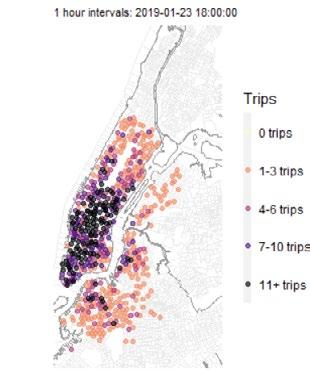
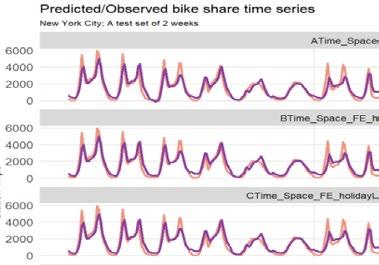
York Citi Bike Number Prediction- Distribution Across Time
New
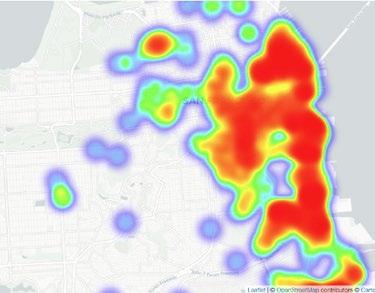
Car Crash Heatmap
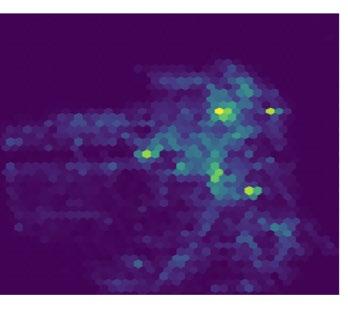
Tree Distribution- Aggregated in Hexagon
Potential User’s Subscription Possibility Prediction
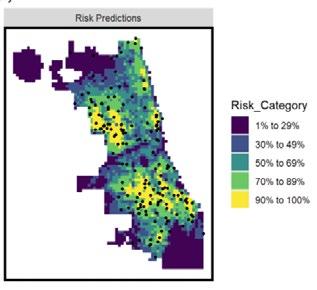
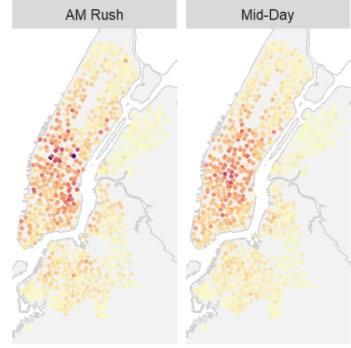
York Citi Bike Number Prediction- Distribution Across Space R R Chicago Burglary Risk Prediction R R
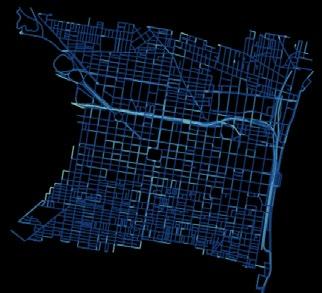
Car Crash Distribution- Aggregated on Street
New
Phython
ArcGIS Python
Python Python Python
