
www.idosr.org
©IDOSR PUBLICATIONS
Aryamanya etal
International Digital Organization for Scientific Research IDOSR JOURNAL OF COMPUTER AND APPLIED SCIENCES 7(1):61 79,2022. ISSN: 2579 0803 Efficiency Improvement in Solar Power Generation
*Edwin Aryamanya, Kalyankolo Umar and Kalyankolo Zaina
Department of Electrical & Telecommunications Engineering, School of Engineering &Applied Sciences, Kampala International University, Uganda.
Email:aryamanyaeddy@gmail.com,Contact: +256758947526
ABSTRACT
Design and implementation of an automated self cleaning solar panel. The panel detects the presence of an obstruction shading a cell, and actuates a cleaning mechanism that cleans off the obstruction and, therefore, restores the panel to normal capacity. To power the cleaning mechanism, a power supply which is supplied by a 12V battery was built. When required, this battery is charged by solar power when the cleaning mechanism is idle. Routine solar cleaning was time based, thanks to an interfaced real time clock module. The control mechanism triggered remotely using an RF remote control module operating at a short range distance. To power the cleaning mechanism, a power supply with capacity to regulate 5V from 12V battery was built. When required, this battery will be charged by solar power when the cleaning mechanism is idle. The fully assembled system was able to detect a shaded cell from debris. Furthermore, it initiated the wiper motion down and up the panel to clear the debris. Also, the system maintained the battery charged when there was no cleaning and sufficient power was available. More importantly, the project decreased the daily energy lost compared to the case where the PV panel was left shaded for an entire day. In order to determine energy savings, the PV Panel was placed under a solar test bed under identical conditions to test the energy loss from one half shaded cell. The losses due to shading alone was determined by taking the difference between the maximum power of the unshaded PV Panelandthemaximumpowerof withonePVcellhalfshaded.The powerlossesof theentire Automated Self Cleaning Solar Panel was also measured. Energy loss was normalized for one day of operation with one cleaning cycle.
Keywords: Solar panel, PV panel and Power generation
INTRODUCTION
It is estimated that some 73 percent of the Uganda’spopulationliveinruralareasand less than 7% of the rural population have access to electricity (NPA, 2015). Over the past years, Uganda has seen a large increase in the reliance on solar power as a source of energy. Mr. Dirk Kam, the Barefoot Power Uganda managing director, says not more than 5 per cent of Ugandan households that are not connected to the national grid, have access to solar power. There has been a steady and significant growthinuptakeandusageofsolarenergy solutions in Uganda over the past few years and that the number of players dealing in solar has increased to about 50. It was estimated that about 600 kilowatt peak (kWp) 1 megawatt peak (MWp) of
solar capacity is imported into Uganda on a monthly average, up from about 50 100kWp per month in 2002.
Solar energy as a mode of power generation is said to be a cost effective sourceofoff gridenergyasopposedtothe conventional way where huge capital investments have to be made in putting up transmission and distribution networks.
For instance, Umeme, Uganda’s largest electricity distributor’s capital expenditure which includes putting up a distribution network and maintenance, stood at about Shs78 billion in 2011, up from Shs51 billion in 2010 .
According to the Electricity Regulatory Authority (ERA), Uganda's energy development program conveyed 30 MW of
www.idosr.org
new solar power supply into the national grid by end of year 2018. This particular development is now strengthening the base pyramid of energy consumption in the country, where actual
Aryamanya etal
penetration of usage is under 10%. With the above statistics, it is worth noting that majority of solar users are rural people in dust enriched areas of the country.
METHODOLOGY
The solar panel cleaning system consists of two basic system unit depending on their functioning, namely Locomotion Unit and Cleaning Unit.
Locomotion Unit:
Locomotion Unit is responsible for the movement of robot on the surface of the solar panel. Since the solar panels are mounted at an angle to ground level so as to capture maximum solar irradiance, the robot cannot rely entirely on the conventional wheel based system for its movement. The inclined surface of the solar panel demands for a movement mechanism that can stick to the surface of the panel and prevent the robot from sliding on the surface. So the pneumatic suction system was used along with a double rack and pinion mechanism. The design consists of two legs present at the top and bottom of the robot. Each leg has two moving platform which move parallel to each other with the help of a double rack and pinion mechanism.
CleaningUnitisresponsiblefortakingcare of the cleaning action of the robot. It is placedperpendiculartoboththelegs.Both the legs are present in at the opposite end of the cleaning unit. Cleaning unit consists of two main parts, namely, Linear Actuator and the Rotating Brush.
Linear Actuator
Linear actuator is an actuator that creates motion in a straight line, in contrast to the circular motion of a conventional electric motor. Linear actuator is used in machine tools and industrial machinery, in computer peripherals, in valve and dam anddampers. Thereare Brush,the brushis responsible for scrubbing and dusting away of the dust accumulated on the surface of the solar panel. It is attached to the v slot gantry plate platform which moves in the linear actuator. The brush is mountedonradialbearingwhichisrotated with the help of a 12
Microcontroller
The Microcontroller chosen is the ATMega328P PU. It is specifically chosen because it has 16MHz speed and we need upto20I/Opins.Itispoweredfroma3.3V source.
PV Panel
The PV cells were chosen to provide the series combination of voltage and current at peak power. Additionally, the PV Panel provides 6 differential voltages from the PV Cells. The differential voltages provide boththesignalsandsourceofpowerto the DMU. A glass and metal frame was manufactured by ECE Machine Shop to protect the PV Cells from the cleaning operation. The spray and wiper mechanism perform the cleaning operation on the PV Panel.
Differential Measurement Unit
The only method to convert the cell voltages was to use op amps in either an instrumentation or difference configuration. The difference configuration was chosen since low input resistance was not a concern. Also, the difference configuration used far less resistors and op amps [2].
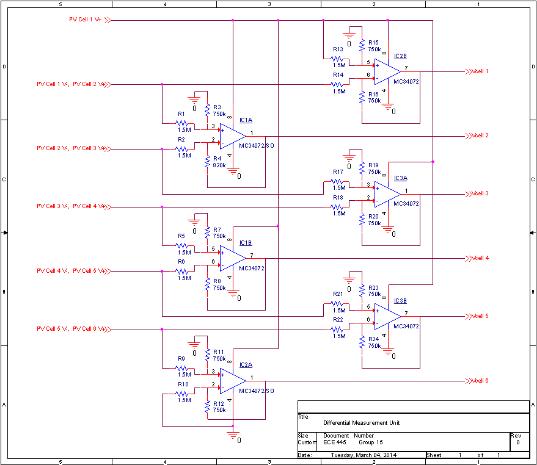
The DMU uses 6 operational amplifiers connected in a difference amplifier configuration as shown in Figure 3 [3] [2]. According to Equation 1, R1 was chosen to be 1.5MΩ to have a large input resistance. If the assumption of Equation 2 is true, each difference amplifier changes the differential voltage input from a PV cell to a ground referenced voltage according to Equation 3. R2 was chosen based on Equation 4. The 0.5 ratio was selected to keep a maximum 6V PV cell voltage from exceeding the maximum 3.3V input rating of the microcontroller. Figure 4 shows the complete design of the DMU.
Figure 1. Operational Amplifier i
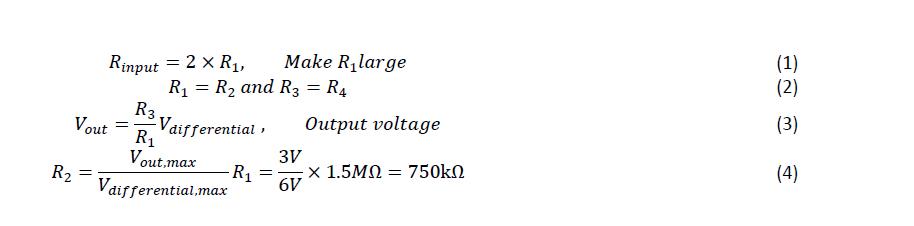
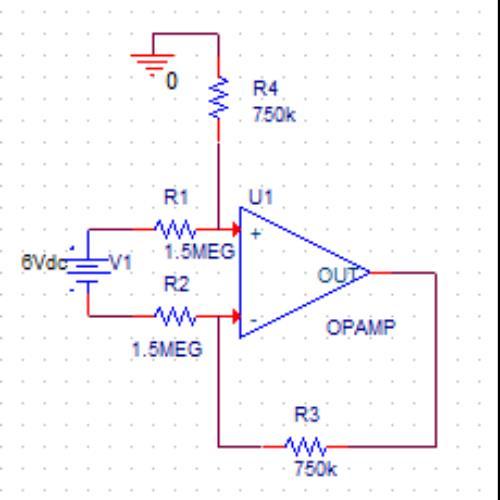
Figure 2. Differential Measurement Unit Schematic
POWER SUPPLY
Battery Charger
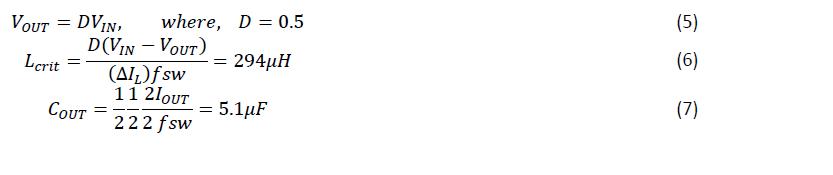
The battery is charged at 15V. The charger takes a 30V nominal input from the solar panel.Buildingabuckconverteristhebest
fit for this situation because the output of the charger has lower voltage than the input. The input of the charger is limited to greater than 28V otherwise the converter shuts down from the microcontroller. This is because at approximately 28V, the solarpanel voltage drops out. The switching frequency is
selected to be 50kHz as supplied by the chosen microcontroller. Equation 5 describesthebuckconverterdutyratio.An important aspect of selecting the inductor is its current rating and its size.
The current rating needs to be able to handle the output current limit. If the input current drawn from the panels is around 0.3A, then the inductor current rating needs to be at least 0.6A.
The size of the inductor is also important because it smooth out the output current
www.idosr.org Aryamanya etal
spikes and make sure the current does not go towards discontinuous mode. The critical inductance is shown in Equation 6. The output capacitor is important to the
design because it controls the output voltage spike. The output capacitor is determined by Equation 7 [4].
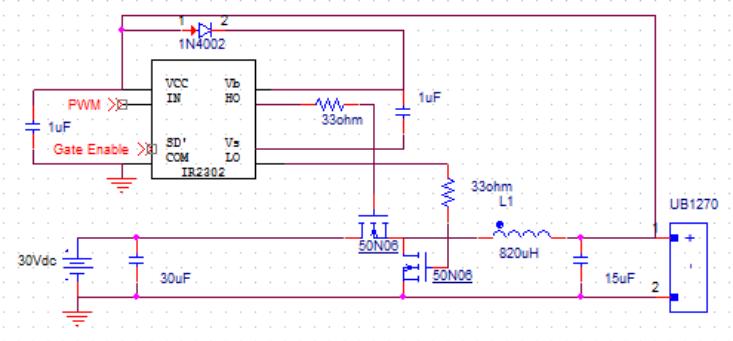
Our initial design was an N MOSFET with a Schottky diode as the switches, where the MOSFET is placed on the high side and the Schottky diode on the low side. The Schottky diode was selected because of its low voltage drop and fast recovery time. This would improve the switching efficiency of the converter. The most important aspect of the converter is driving the switches with the required gate voltage. A gate driver was selected to boost up the voltage from a signal of 3.3V from the microcontroller to 12V from the battery. The MOSFET would need a high enough gate to source voltage in order to be on.
The final implementation of the buck converterisshownonFigure 5.The output capacitor and the inductor are both sized up to further reduce the respective voltage and current spikes. The inductor value is 820μH and the output capacitor is 15μF. The Schottky diode was replaced by a second NMOSFET making this converter a synchronous buck converter. The gate driver, powered by the battery, is capable of shutting down when the gate enable bit from the microcontroller sends a low signal. To drive a synchronous buck converter, this gate driver also has a high side and low side signal.
Figure 3. Final Buck Converter Schematics
Battery
The battery chosen is the UB1270. The UB1270 lead acid battery connected to the output of the converter is to be charged with output of 14.7V±2% from the
converter. When the battery is not being charged, it is to output 12.38V±7% [5].
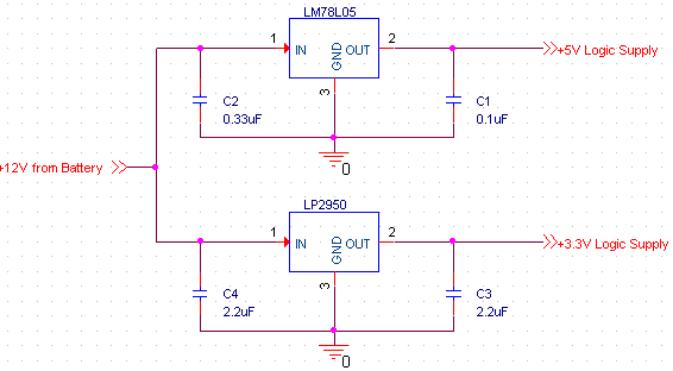
Logic Power Supply
The Logic Power Supply uses two linear regulator IC’s to step a nominal 12VDC down from the Battery to the two logic
www.idosr.org
level voltages (3.3VDC and 5VDC nominal) needed by the various other IC’s in the system.
Each linear regulator can handle up to 100mA of load current. The expected load current is less than 50mA for each linear regulator. The 3.3V regulator was chosen because it needed to have a tolerance of less than 1%. This tolerance ensured that the voltages measured referenced to 3.3V on the ADC of the microcontroller, when considered with the 1% measurement
Aryamanya etal
tolerance of the DMU, would not erroneously show a 10% drop in a PV Cell voltage. The +5V regulator did not need to have as tight of a tolerance. Therefore, the 5% tolerance of the +5V regulator was acceptable. The input and output capacitors for both regulators were selected based on datasheet recommendations [6] [7]. See Figure 6. Logic Power Supply Schematic for the circuit level schematic.
Figure 4. Logic Power Supply Schematic
Motor Power Sup
The MPS is a switched mode DC/DC buck converter that steps a nominal 12VDC down from the Battery to the nominal 7.2VDC motorvoltage.Sincethis converter did not need to be controlled by the microcontroller a buck regulator IC was chosen with an integrated power MOSFET to simply design. This IC does have an enable that allows the microcontroller to turnoff theMPS whennotneeded topower the DC motor.
It was expected that on average the motor could draw as much as 1.5A load based on a no load current of approximately 0.5A and the wiper weight being negligible. The MPS component values were calculated using switched mode power supply
analysis methods for an asynchronous buck converter [4].
The inductor current waveform was chosentobeonthevergeofDiscontinuous Mode to reduce its size with an average load current of 1.5A. The input voltage ripple was chosen to be less than 0.2V to keep the input voltage one order of magnitude below the expected Battery voltage range of 12.38V±7%.
Output voltage was chosen to be less than 0.02V to be one order of magnitude smaller than the average output voltage specification. Cb was chosen as recommended by the datasheet [8]. The initial calculated values of the L, CIN, and COUT are shown in Equations 8, 9, and 10 respectively. Except for the inductor L,
www.idosr.org
actual parts used in the circuit may have higher component values due to cost and ratings.
The inductor L value was increased to reduce output current spikes which would trigger the LM2678 current limiting
Aryamanya etal
function. The output voltage was set be regulated according to Equation 11 given by the LM2678 datasheet [8]. The R2 value was made by 2 resistors in parallel. See Figure 7 for the circuit level schematic.
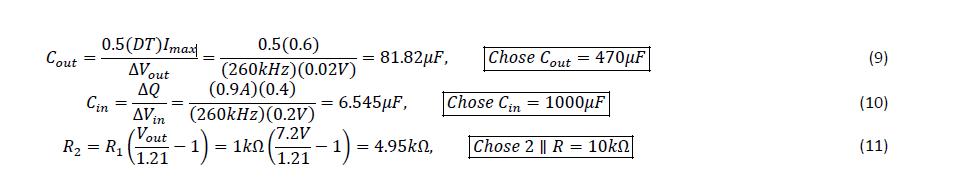
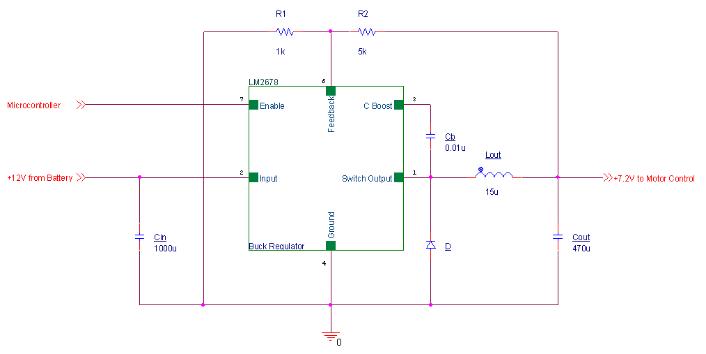
Figure 5. Motor Power Supply Schematic
MOTOR AND VALVE CONTROL
Motor Control
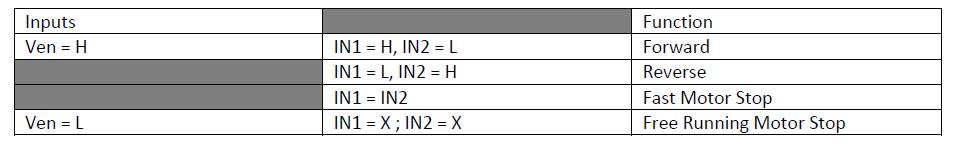
The DC motor needs to have its own separate control circuit. The main component of the control circuit is a L298NH BridgeDriver.TheL298Nisahigh voltage, high current dual full bridge driver. The full bridge will be required to switch the direction of motor rotation with
input combinations according to Table 1. The L298N IC needs to be supplied with 5V±5% for logic supply and 7.2V±0.1V for the motor supply. Both these supplies are designed separately. We initially designed the motor control circuit to include a rotary encoder. The rotary encoder serves the purpose of
www.idosr.org Aryamanya etal
signaling to the microcontroller that the direction of the motor needs to be changed. This is done by counting the number of rotations the rotary encoder goes through. After a certain number of rotations, which signals the end of the panel, the rotary encoder sends a signal to
the microcontroller that the direction of the motor needs to be changed. Fly back diodes are used to prevent a strong electrical pulse from being sent throughthe circuit. The enable pin and the input pins come in from the microcontroller.
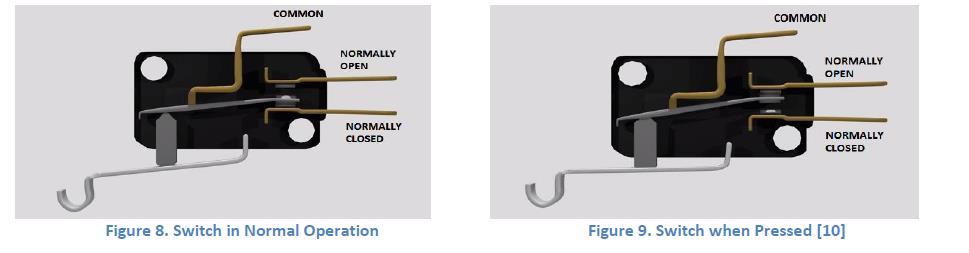
Table 1. Combinations of Inputs for Motor Control [9]
We started off with the initial design that we had proposed in the design review. The L298N IC was set up exactly as proposed and the power supplies, that we designed, successfully provided the logic power and motor power requirements. However, when we were about to design the setup for the rotary encoder, Scott from the ECE Service Shop advised us to use two mechanical switches at each end of the panel to determine the position of the wiper. This idea appealed to us as it was simple to implement, and much more reliable.
Figure 8 and Figure 9 show the position of theswitchesinnormaloperationandwhen pressed, respectively. The Common terminal is connected to a 3.3V power supply from the microcontroller. When the switch is pressed against by the wiper, the voltage goes through the Normally Open terminal, which is connected as an input to the microcontroller. This signals the microcontroller to change the direction of the motor direction. The final implemented design of the motor control circuit is shown in Figure 10.
Figure 10. Final Design Schematic of Motor Control [11]
Valve Control
A solenoid valve is used to control when water is sprayed onto the panel. It is actuated at 12VDC, but according to the distributor, can also work down till 6VDC too [12]. Figure 11 shows how the valve will be connected into the circuit. It will be supplied with a voltage of 12VDC ± 10%. The N channel MOSFET is connected between the valve and the ground and will
work as a control to open and close the valve.
Whenever the N Channel MOSFET gets a high input from the microcontroller, greater than 3VDC, it will cause the valve to open. The valve will only be opened for about 2 3 seconds before being closed again.
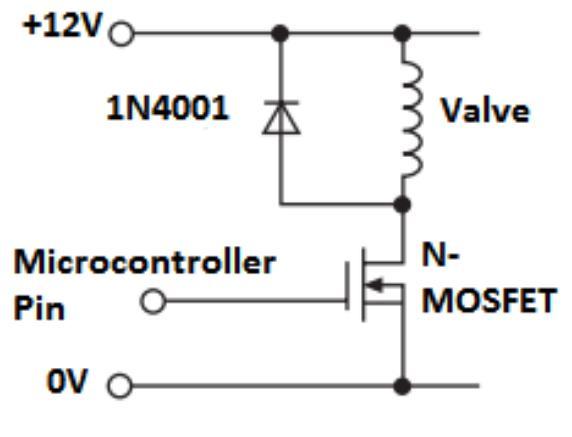
This timing of the duration will be done through the microcontroller.
Figure 11. Solenoid Valve Circuit [13]

We implemented the valve control circuit exactly as we had initially proposed. We testeditwithapowersupplysupplyingthe required voltages of 12V and 3.3V, and it seemed to actuate properly. However, when we tested it by powering the N
Channel MOSFET through a microcontroller, the solenoid valve didn’t actuate. We later realized that the gate current provided by the microcontroller was insufficient to actuate the N Channel Power MOSFET. We needed to insert a gate
www.idosr.org
driver to solve this problem. But this issue was discovered after our demo, so we will keep it in mind for future considerations.
Cleaning Mechanism
This block of the project takes care of the required cleaning functions. The sprayer sprays water onto the panel, and the wiper mechanism wipes the panel.
Wiper
The wiper mechanism, which wipes the PV Panel in a linear motion, was fabricated by the ECE Machine Shop. The wiper mechanism consists of a linear actuator, along the center of the panel frame, driven
Microcontroller
Aryamanya etal
by a DC motor. One wiper bar is connected at the actuator and stretches on both sides ofthe PVPanel. Itisdrivenbythethreaded rod’srotation.
Sprayer
The spray mechanism consists of pipes stretched along both sides of the panel. A sprayer nozzle for each solar cell is present on the pipe. This nozzle has an optimal spray angle. The solenoid valve controls the flow of water through the pipes. The source of wateris a pressurized publicwatersupplyconnectedwithahose. This was fabricated by ECE Machine Shop.
RESULTS
We observed all the actions happening according to Figure 2. All requirements are met on Table 13 with exception to the encoders.
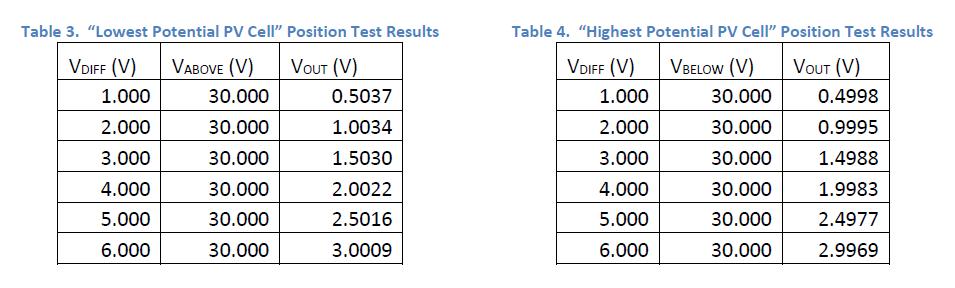
PV Panel
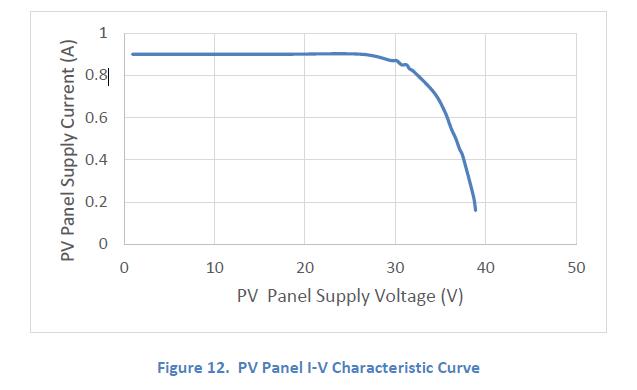
Load testing was performed on the PV Panel to test for the requirements of the Design Review. The test was performed according to the Design Review Verification with two exceptions. First, the sunlight was artificially simulated in the
PV Panel using a PV emulation technique [14]. Second, an electronic load was used to find the I V curve of the PV Panel, which includes the open circuit voltage. The short circuit current was based on a single PV cell held directly up to a spot light: ISC = 0.9A. The test results are shown graphicallyinFigure 12 andnumericallyin Table 2. All Design Review requirements were met.
The Design Review requirements and verification for the PV Panel are listed in Table 14 in Appendix A.
Differential Measurement Unit
The testing done on the DMU was different from the method specified in the Design Review. First, since all of the difference amplifiers are identical, only one sample needed to be tested to verify that it meets the tolerance requirement. Second, in order to fully test the difference amplifier it would be tested in the two extreme cases: the amplifier at the highest PV Panel potential and amplifier is at the lowest PV
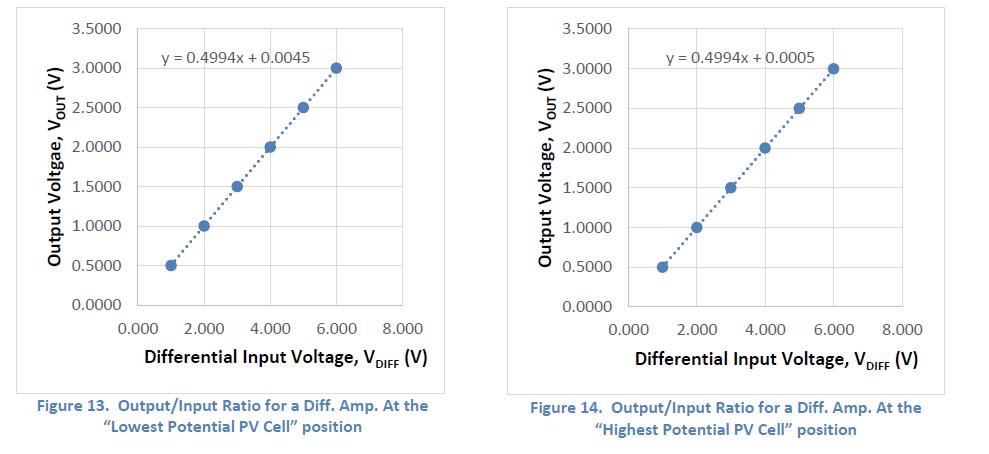
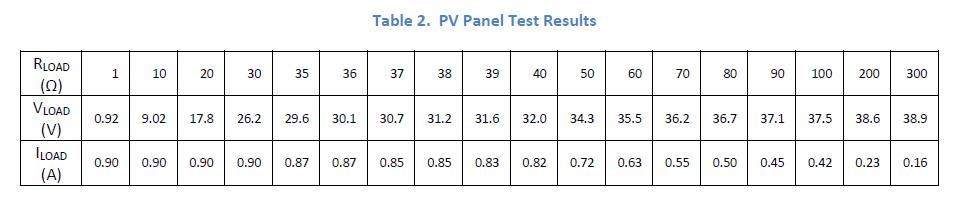
Panelpotential.Inthecaseofthecellatthe highest potential, the non inverting terminal is connected to the highest PV Panelpotential(VCC).Inthecaseofthecell at the lowest potential, the inverting terminal is connected to the lowest PV Panel potential (ground).
The test results are shown graphically in Figure 13 and Figure 14, and numerically in Table 3 and Table 4.
POWER SUPPLY
Battery Charger
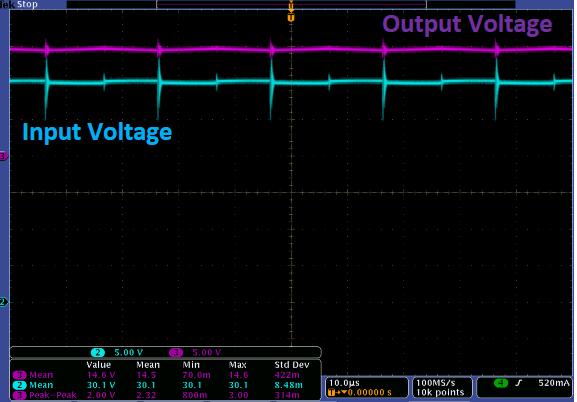
Thebuckconverteristestedwith30Vfrom the Agilent E3631A power supply. The 50% PWM signal is generated by the MSP430G2553. To see the actual output voltage, a 15Ω powerresistoris used atthe output replacing the battery. Figure 15 verified that the input and output voltages 30V and 15V, respectively. Figure 16 proves that the inductor current is in
 Aryamanya etal
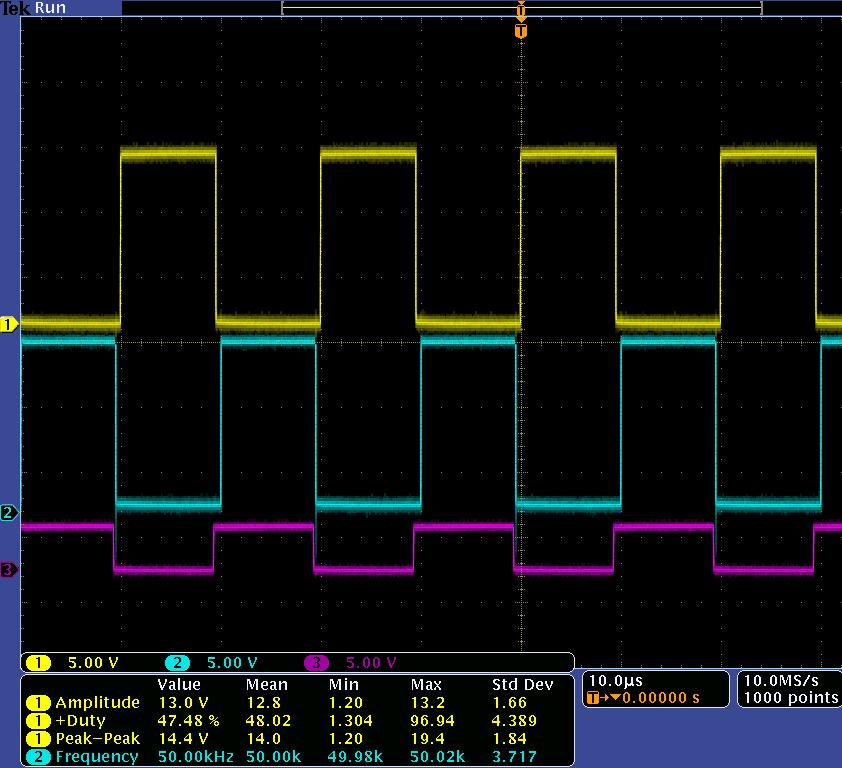
Continuous Current Mode since the output current is never zero. Figure 17 shows the output duty ratio of the gate drivers to be around 50%. At the final design, we monitor the output voltage only to cut the buck converter circuit off when the output voltageis higherthan13V.Therefore, duty ratio is set at constant 50% and no longer varied [14,15].
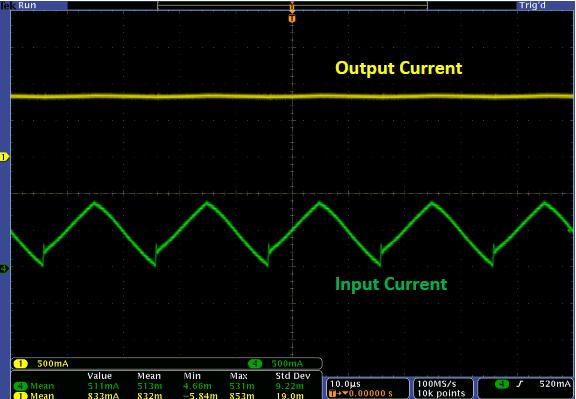
Figure 17. Synchronous 50% duty ratio of gate driver
Logic Power Supply
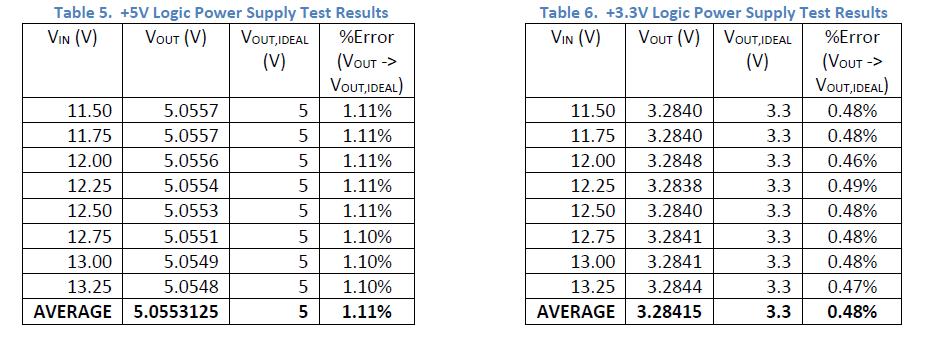
Both 3.3V and 5V power supplies were connected as in Figure 6. The input was connected to a bench top DC powersupply with a corresponding 50mA output load for each regulator. Table 5 and Table 6
shows the results of the test over the expected range of Battery voltages. The +3.3V Supply was within the 1% tolerance for all output voltages as required. Also, the+5VSupplywaswithinthe5%tolerance for all output voltages as required [16,17]
Motor Power Supply
Test results are listed in Table 7. Though the MPS tested satisfactory with the planned test procedure, the operational test with the DC motor driving the wiper blade on the PV Panel initially failed. The failure was due to the current limiting feature of the LM2678 IC causing the output voltage to sag near 2V with no motor motion. Current surges exceeding
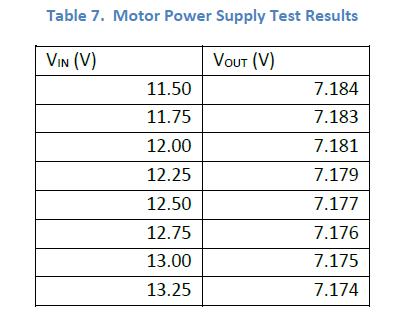
the rated 5A of the LM2678 IC were caused by unexpected friction in the threaded rod driving the wiper blade. Grease applied to the rod reduced friction and improved the output voltage to approximately 4V which was capable of driving the DC motor [17,18].
MOTOR AND VALVE CONTROL
Motor Control
In order to test whether the motor control circuit was being supplied with the correct voltages, we connected the motor and logic power supplies, along with the pins fromthemicrocontroller.Wemeasuredthe
voltages using a voltmeter. We tried different combinations of the input pins on the L298N IC and verified changes in motor direction.
We connected an LED between the NormallyOpen terminal of the switch and
www.idosr.org
ground and verified that pressing against theswitchlightsuptheLED.Thiswasdone before mounting the switches onto the panel.
Valve Control
We set up the circuit according to Figure 11. We applied a voltage at the gate of the N Channel MOSFET using a power supply, and verified that the valve actuates by hearing for a ‘click’ inside the solenoid valve. Table 8 shows the operating voltages of the solenoid valve. The lower the voltage is, the slower the valve actuates. This process, however, came to bite us back in the end since we had overlooked to test whether there is
Aryamanya etal
sufficientgatecurrentbeingsuppliedfrom the microcontroller.
Cleaning Mechanism
Wiper: Using a battery, we applied 12V at the motor connected to the panel to verify the wiper movement across the panel.
Sprayer: We could not test the valve with water in the lab. However, after the demo, we went outside and connected a water supply to the panel using a garden hose. Then, using a battery, we applied 12V at the solenoid valve. This allowed water to be sprayed onto the panel.
DISCUSSION
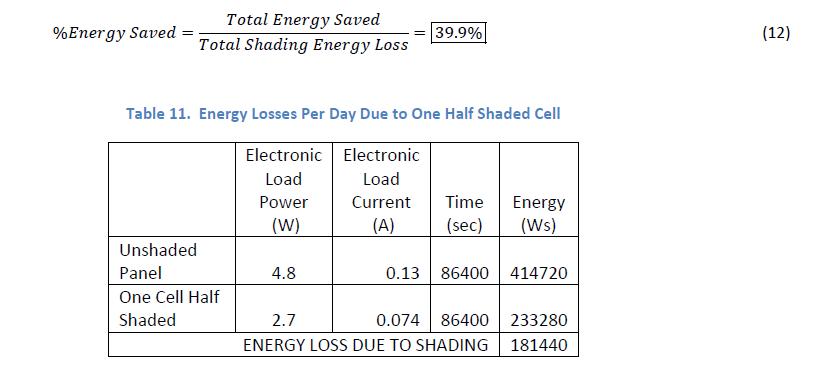
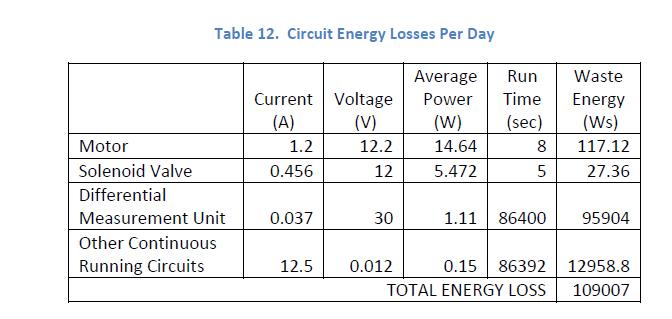
The fully assembled system was able to detect a shaded cell from debris. Furthermore, it initiated the wiper motion down and up the panel to clear the debris. Also, the system maintained the battery charged when there was no cleaning and sufficient power was available. More importantly, the project decreased the daily energy lost compared to the case where the PV panel was left shaded for an entire day. In order to determine energy savings, the PV Panel was placed under a solar test bed under identical conditions to test the
energy loss from one half shaded g a cell. The losses due to shading alone was determined by taking the difference between the maximum power of the unshaded PV Panel and the maximum power of with one PV cell half shaded. The power losses of the entire Automated Self Cleaning Solar Panel was also measured. Energy loss was normalized for one day of operation with one cleaning cycle. The results are tabulated in Table 11 and Table 12.The resulting percentenergysavings is shown in Equation 12.
Although our project worked almost exactly as we had planned, and each group member was satisfied with our final product, there were still some uncertainties that we could not address during the duration of this course. One uncertainty was whether we could make a significant long term profit. We were able to performpreliminary tests and calculations to determine our daily, or evenweekly,profitfromthedesign.Butwe
could not extrapolate that data to estimate our profit on a monthly or yearly basis because of the possibility of fluctuations in weather and long term maintenance costs. Another concern we had was marketability. What areas would our project be beneficial for? Would it be more beneficial on a residential scale, or an industrial scale? All these questions need to be addressed before our product can be produced on a large scale [18,19].
CONCLUSION
The fully assembled system was able to detect a shaded cell from debris. Furthermore, it initiated the wiper motion down and up the panel to clear the debris. Also, the system maintained the battery charged when there was no cleaning and sufficient power was available. More importantly, the project decreased the daily energy lost compared to the case where the PV panel was left shaded for an entire day. In order to determine energy savings, the PV Panel was placed under a solartestbedunderidenticalconditionsto
test the energy loss from one half shaded cell. The losses due to shading alone was determined by taking the difference between the maximum power of the unshaded PV Panel and the maximum power of with one PV cell half shaded. The power losses of the entire Automated Self Cleaning Solar Panel was also measured. Energy loss was normalized for one day of operation with one cleaning cycle. The results are tabulated. The resulting percent energy savings is shown in Equation
REFERENCES
1. Masters, G. (2013). Renewable and Efficient Electric Power Systems, Hoboken, NJ:JohnWiley&Sons Inc.
2. Sedra, A. S. and Smith, K. C. (2010). Microelectronic Circuits, 6th ed., New York, New York: Oxford University Press
3. Industries, Semiconductor Components, datasheet, MC34072, 21st ed., 2013.
4. Krein, P. T. (1998). Elements of Power Electronics, 1st ed., New York: Oxford University Press
5. SealedLeadAcidBattery, datasheet, UPG. Available at: http://powerupco.com/site/wpcon tent/files/Batteries/UPG/UB1270.p df.
6. Texas Instruments Incorporated, datasheet, LM78LXX Series 3 TerminalPositiveRegulators, 2013.
7. Texas Instruments Incorporated, datasheet, LP2950 Series of Adjustable Micropower Voltage Regulators, 2013.
8. Texas Instruments Incorporated, datasheet, LM2678 SIMPLE SWITCHER High Efficiency 5A Step DownVoltageRegulator, 2013.
9. L298 Dual FullBridge Driver, datasheet, STMicroelectronics, 2000. Available at: https://www.sparkfun.com/datash eets/Robotics/L298_H_Bridge.pdf.
10. Understanding a Microswitch Youtube. [Online]. Available: https://www.youtube.com/watch? v=q6nP1FjxAMU.
11.[11Controlling motors with an MSP430 (or Arduino). Maker Dreams. [Online]. Available: 12.http://lars.roland.bz/controlling motors with an msp430/.
13. Plastic Water Solenoid Valve. Adafruit. [Online]. Available: http://www.adafruit.com/products /997#Description.
14. MicrocontrollerInterfacingCircuits, 2000. [Online]. Available: http://faculty.unlv.edu/pushkin/m icrocontroller_interfacing_revoluti on.pdf.
15.Qin, S., Kim, K. A., Pilawa Podgurski, R. C. N. (2013). Laboratory emulation of a photovoltaic module for controllableinsolationandrealistic dynamic performance," Power and Energy Conference at Illinois (PECI). IEEE, vol., no., pp.23, 29, 22 23
16.Masisani William Mufana and Adabara Ibrahim(2022).Monitoring with Communication Technologies of the Smart Grid. IDOSRJournalof AppliedSciences 7(1) 102 112.
17.Nabiryo Patience and Itodo Anthony Ejeh (2022). Design and Implementation of Base Station Temperature Monitoring System Using Raspberry Pi. IDOSR Journal of Science and Technology 7(1):53 66.
18.Masisani William Mufana and Adabara Ibrahim (2022). Implementation of Smart Grid Decision Support Systems IDOSR
www.idosr.org
Journal of Scientific Research 7(1) 50 57, 2022.
19.Natumanya Akimu (2022). Design and Construction of an Automatic Load Monitoring System on a Transformer in Power Distribution Networks.IDOSR Journal of ScientificResearch 7(1)58 76,2022.
Aryamanya etal