
www.idosr.org
©IDOSR PUBLICATIONS
International Digital Organization for Scientific Research
Kisakye
IDOSR JOURNAL OF COMPUTER AND APPLIED SCIENCES 7(1):119 135,2022. ISSN: 2579 0803
Simulation and Analysis of Dipole Transmitter Antenna (KIU Laboratory)
Kisakye Rebecca
Department ofElectrical,Telecommunications &Computer Engineering,School of Engineering& Applied Sciences.Email: kisakye.with@gmail.com
ABSTRACT
The main objective of this project is to simulate and analyze a dipole antenna. It explains the principles related to the antenna. This project explains the antenna trainer set and its objectives, different antenna measurement techniques such as how to measure and plot antenna radiation pattern, measurement of antenna beamwidth, antenna gain, and how to interface panel for auto plotting of antenna radiation pattern. A parametric explanation is done to show how the flare angle, length, and lumped resistors of the antenna should be selected to achieve broadband properties and good target detection with less clutter. The screening of the antenna and the position of transmitting and receiving antennas concerning each other and ground surface is also done. Several other planar geometrical shapes are considered and compared with the bow tie to find what geometrical shape gives the bestperformance.
Keywords:Simulation, Dipole,Transmitter and Antenna
INTRODUCTION
The history of wireless communication started with the discovery of a coherer which is an original detection device for the detection of electromagnetic waves in a long wave frequency band [1,2,3,4]. To the coherer, a long wave wire antenna was connected. In the first experiments, the wire antenna was unmatched. When Marconi implemented the first tests in 1896, he used the trans matched long wire hang up on kite Consequently, he used wire antenna with the defined length depending on the wavelength [5,6,7,8] For the first radio connection across the Atlantic Ocean, the quarter wavelength monopole was used. After World War II, the antennas with a single fed element and parasitic elements were designed. Yagi Uda antenna is the most famous antenna of this type. Yagi Uda antenna was originated in 1926, and was practically used after World War II. The microwave circuits shifted the operating frequencies to higher bands [9,10]. The wavelength of electronics was decreased, and new possibilities of the design were created. Electric dipole antennas have been widely used in Through The Earth (TTE) communication via a current
injected into the earth at the power. The Coal Mine Security Standard has many restrictions on the permissible transmission power of TTE communication systems [11,12,13,14]
There are many methods that have been proposed and investigated to reduce the output power by changing the shape and material, increasing the inter electrode distance, or using only one electrode with different kinds of material, such as parabolt, copper braid extended aluminum foil, and steel rod. However, these methods have not discussed the grounding impedance model of several electrodes in array and still cannot reduce the electrodes grounding impedance to a level less than 300Ω. Many reports take the contact impedance [15,16].
Between the electrode and the earth into account and suggest lowering it with resistance reducing material but have not given the quantitative relationship between them. Some models have been proposed and investigated the dipole antenna in a two or three layered conducting medium. However, most of them discuss the propagation from the surface to surface or for far field
www.idosr.org Kisakye
transmission and have not given the optimal operating frequencyto reduce the TTE communication power in a stratified dissipative medium vertically. It is found that the grounding impedance model of several electrodes in array has a good match with the experimental results, and the optimal electric dipole antenna can reduce the grounding impedance to less than 5Ω. To further lower the output power and to improve communication quality, a full wave electromagnetic simulation model for the electromagnetic field propagation in the layered conducting medium is proposed, which is excited by the HED antennas. An optimum frequency for the field. Electric dipole
antennas are used to inject electrical power into the earth by establishing galvanic coupling between the earth and the power stage of the transmitter. The frequency dependent grounding impedance includes the wire impedance, the contact impedance between the wire and the electrode, theThe impedance of the electrode, the earth's current divergence impedance, and the contact impedance between the earth and the electrode. However, when the grounding impedance is in the frequency range of lower than 50 kHz, the grounding electrode exhibits the grounding impedance close to the grounding resistance.
SPECIFIC OBJECTIVES
Todetermine thestrength and travel distance ofa transmittedsignal. Tosimulate the dipolar antenna.
Design a working manualfor thedipolar transmittingantenna.
RESEARCH QUESTIONS
Howthe transmitting dipole antenna is designed. Howastrongand clearsignalis transmitted.
Howto implement a working transmitting dipole antenna.
METHODOLOGY
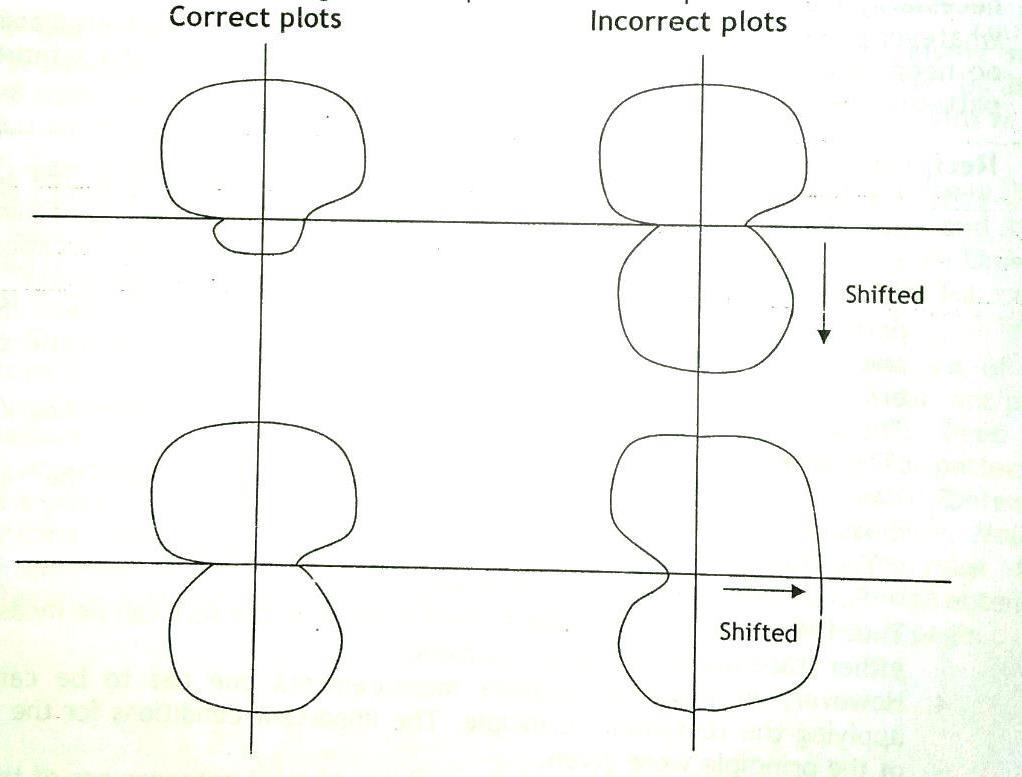
Figure 1: showing side lobe plot
INSTALLATION PROCEDURE
The overall height of the antenna stand both transmitting and receiving masks is of 85cm. however for the sake of packaging, the mask is made of two sections. One of stainless steel hollow pipe of 58cm at the upper side of the mask with two cross holes at the lower end and one M8 hole at the top end of the mount antenna holder box and other is bottom stand of 27cm overall height with the central shaft which is held between two bearings.
The holder box contains a Balun, which is connected between the input BNC socket and antenna apparatus. Two nos. of white nylon washers are mounted to the cushion centrally mask pipe with M8 hole for avoiding compression of the holder box when tightening with M8 wing nut. Now take the complete whole complete assembled antenna as per your experiment list with holder box. Place this antenna on top of the mask and tighten with the provided M8 metal screw wing nut andnylon washerfrominside.
One folded dipole antenna is provided to be used at only receiving side. Permanently mount this folded dipole antenna to the receiving antenna mask by using M8 screw. And at the transmitting antenna mask mount removable antenna which you are going to
perform the experiment using M8 screwand wingnut.
Reassembly of antennas. Unpack antenna from bubble sheet firmly. The long element antenna pipes such as log periodic: 4 pipes of LP6 and LP7 and 3lambder/2simple dipole: 2 pipes. Whose one of two fixing screws are removed at the time of dispatch. So that pipes can be mounted again at the time of unpacking for experiment using provide M7 screws. Hence mount those pipes with screwsandnuts.
For radiation pattern measurement. Actually the radiation pattern of an antenna under test is three dimension pattern in nature, but we cannot plot those pattern practically. For this separate two dimension patterns need to measure of the same antenna. Hence plotting these two dimension patterns, an arrangement is provided with the holder box (connected at bottom of antenna base plate) with two nos. of holes, one is at bottom and the other at the side. Mount antenna using bottom hole of the holder box on the transmitting mask for measurement of the antenna ‘Azimuth pattern’ and mount using side hole for antenna ‘Elevation pattern’ , for this refer holderbox diagram.
DESIGN OF HALF WAVE DIPOLE ANTENNA FOR WIRELESS COMMUNICATION SYSTEM
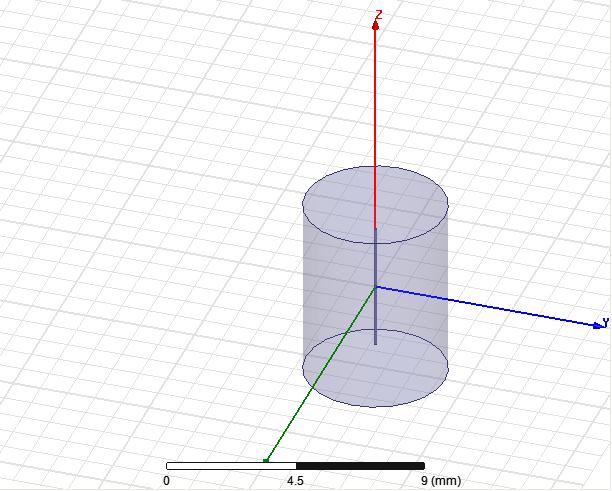
The common wire antenna is the dipole antenna. It is a gap between two arms of half wave dipole antenna for the purpose of feeding. Radiation resistance of the half wave dipole is 50 ohm and 73 ohm which matched with the impedance line. Based on the resonant frequency, the dimensions of an antenna changes. The resonant frequency of the antenna must be selected suitably. The wireless communication system uses the frequency range from 3 30 GHz. Hence the antenna designed must be able to operate in this frequency range. The resonant frequency selected for this design is 29.9792 GHz. The dipole antenna design using HFSS tool. The radiation boundary of the dipole antenna
which has a symmetric structure with the similarshape of the two arms. Eacharmis comprised of a cone and a cylinder appended toward the finish of the cone. Theantenna is fedat thecenterpoint bya 50 Ω coaxial cable. The symmetry of the antenna needs equal currents on both arms, but the coaxial cable is known as an unbalanced transmission line. To solve this issue, a balun is utilized to constrain the unbalanced transmission line to suitably feed the balanced antenna. For the antenna design, four key parameters ought to be calculated, which are the half cone angle θ, the feeding gap g, the cylinder radius r, and the cylinder length l.
Figure 3: showing directions of antenna signal transmission
TRAINER TRANSMITTING SIDE ARRANGEMENT
The following resources/ panel are requiredat the transmittingside. RF signal generator/ RF 16. It is an RF signal generator to generate RF frequency ranging from 10 600MHZ using the frequency knob provided on the front bezel of the signal generator. But for experimenting any antenna, set it to 500MHZrange only, because the provided antenna with antenna trainer set is designed only to work properly at 500MHZ. with a good response. Transmitting antenna. It is used to transfer the RF signal of RF generator to
space in the form of electromagnetic waves. You can use any antenna at the transmitting side from the list above. Transmitting mask.it is a manually rotating antenna mast or optionally driven by a stepper motor with the flexibility to mount all provided antenna using M8 screw. The transmitting mast consists of SS pipe and stand. The pipe is attached to the stand and the transmitting antenna is mounted on top of the pipe on base plate held in space using holder box. RF output of RF generator is connected to the female BNC socket holder box placed at the bottom of the base plate using a BNC to BNC cable.
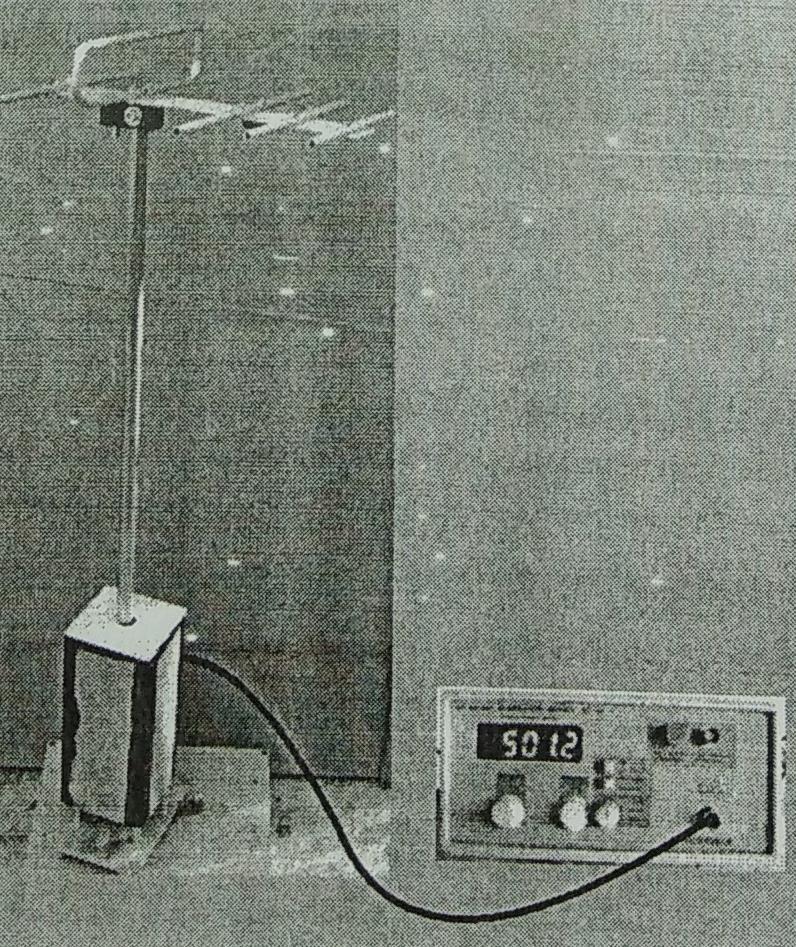
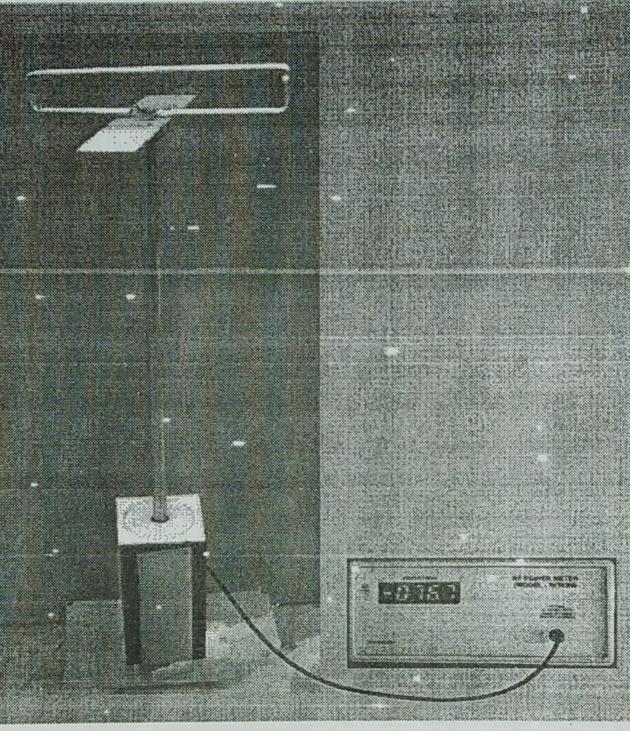
Figure 4: showing trainer transmitter antenna
PHYSICAL SPECIFICATION OF TRANSMITTING MAST
Dimension of transmittingmast Height = 850mm Weight = 3.5kg
SET UP PROCEDURE FOR TRANSMITTING MAST
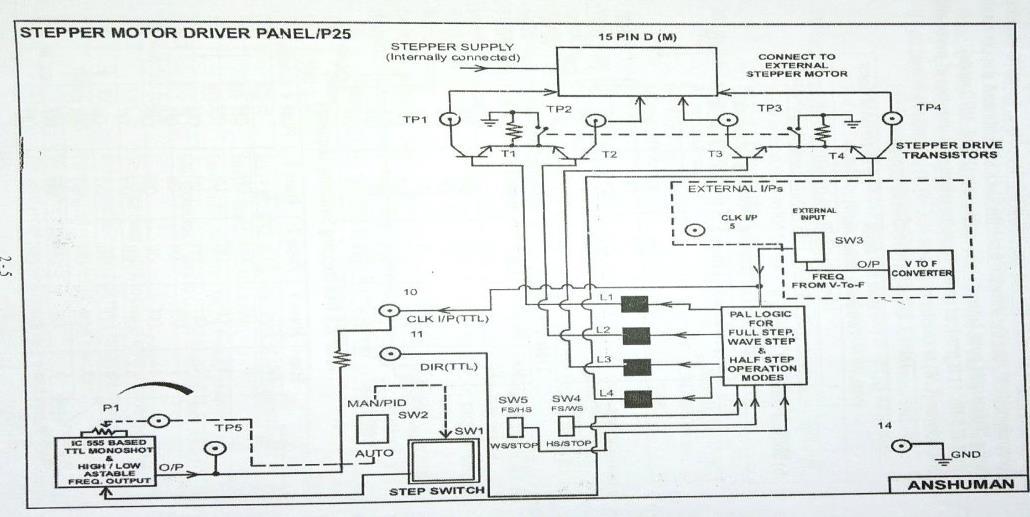
Complete transmitting mast is provided with the trainer set with a 2kg cm stepper motor (optional) internally installed with a 15 pin D connector female cable kept covered by an acrylic box. You only need to place this mast at a proper surface having enough empty spaces around it to prevent ghost interferences or absorption of RF energy from target objects for transmitting purpose while doing experiments. For mounting of different antennas on the mast, two nos of parallel are provided at the top end of the mast. Use an M8*45mm screw to mount antenna through the holes of the holder box
attached at the bottom of the antenna base plate as per your experiment. And tighten it properly by using the wing type brass nut and check it is parallel with ground, so as not to mismatch the line of sight arrangement at the time of experiment. Connect the output of the RF signal generator to the BNC provided at the holder box using the BNC to BNC coaxial cable and set frequency of RF generator at 500MHz only for any experiment. Connect the panel P25 to the 15 pin D connector provided at the transmitting mast, which is collected from the wires of the stepper motor to rotate the mast while doing the experiment of radiation pattern or you can rotate the mast by your hand also. Stepper motor driver panel/ P25. A panel P25 is optionally provided with a trainer set. This panel contains stepper motor driving circuitry to drive the in built
www.idosr.org
stepper motor on the transmitting mast, used only for radiation pattern measurement of antenna undertest. When stepper driver is facility is not provided then user may rotate transmitting mast by hand also by 10 degrees increasing the scale pointer.
Coaxialcable. A BNC to BNC coaxialcable isalsoprovided witha trainerset to connecttheRFgeneratorto the antenna directly by connecting oneside tooutput ofgeneratorand othertoBNCat the holderbox, which containsinternally a Balun.
TRAINER SIDE RECEIVING ARRANGEMENT
RF power meter/ RF 5M. Whatever the power absorbed by the receiving antenna will be displayed on it in the unit of dBm. The power measurement readings are ranging from 60 to +3dBm. Receiving mast.It islikea transmitting mast used as stand for receiving antenna, normally at receiving side a folded dipole antenna is used and fixed it as only for receiving purpose mount it using M8 screw. It does
SET UP PROCEDURE FOR THE RECEIVING MAST
Procedure is the same as the transmitting mast, only at the receiving mast there is no any stepper motor inside it. Mount folded dipole antenna at the receiving
Kisakye
not contain any stepper motor part inside it and is prevented from rotation. The receiving mast consist of SS pipe and stand. The stand is attached to SS pipe, and the receiving antenna is connected on the top of the stand. RF input of the RF power meter is connected to the female BNC socket of the stand by using a BNC to BNC cable. Receiving antenna.it is used to transfer the absorbed electromagnetic waves of space to electric current for further processing at the power meter. Please prefer to use folded dipole antenna at receiving side. Coaxial cable. A BNC to BNC coaxial cable is also provided with the trainer set to connect the RF power meter to antenna directly by connecting one side to the output power meter and other to BNC holder box which contain internally aBalun.
PHYSICAL SPECIFICATION OF THE RECEIVING MAST
Dimension of thereceivingmast Height = 850mm Weight = 3.0 kg
mast only use an M8*45mm screw to mount antenna using the holes of the holder box attached at bottom of the antenna base plate as per your experiment. And tight it properly by using the wing type brass nut and check it is
www.idosr.org Kisakye
parallel to ground so not to mismatch the line of sight experiment. Connect the RF input BNC of RF power meter to the BNC provided at holder box using a BNC to BNC coaxial cable and note down the power readings by observing on the display.
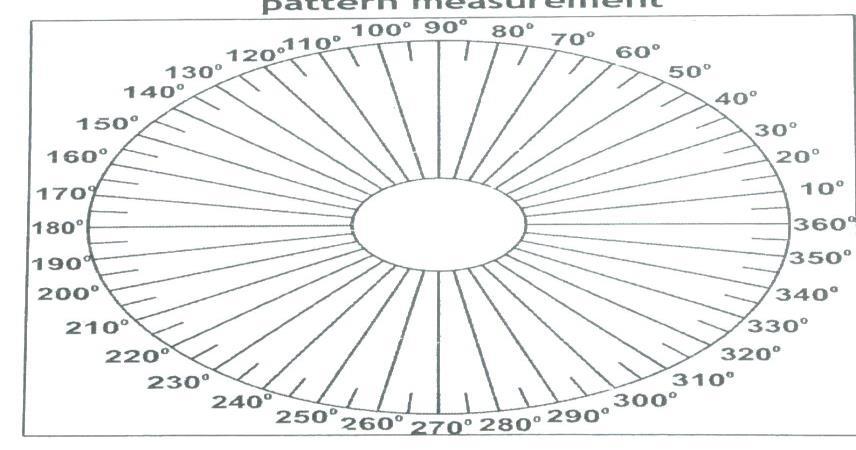
PRINTED 360 DEGREES ANGLE SCALE
On the top surface of the acrylic box at transmitting mast at 360 degrees paper angle scale is stuck with an angle pointer internally connected to the pipe. This angle scale provides a full 360 degrees rotation measurement use the above printed scale with pointer. Rotate the antenna by your hand with 10 degrees division increment and note down the readings on powermeterineach case.
Figure 6: showing 360 degree angle scale DISTANCE CONSIDERATION BETWEEN ANTENNAS WHILE PERFORMING THE EXPERIMENT
The fields surrounding the antenna are dividedinto three principle regions Far field region, Reactive near region and Radiatingnear field region. Any antenna can be successfully measured on either near field or far field. Range with appropriate implementation. In general, far field ranges are better choice for higher frequency antenna (>1GHz) and where complete pattern and polarization measurementare required. Far field region. The far field region is the most important, as this determines the antennas radiation pattern. Also antenna are used to communicate wirelessly from long distance, so as this is the region of operation for most antenna. In this region, the radiation pattern does not change with distance. If the maximum linear of an antenna is ‘D’, the following conditions must be satisfied for antenna to beinfarfield region.
R > (2D^2)/ lambda and R >>D and lambda
Reactive near field region. In the immediate vicinity of antenna, we have reactive field. In this region, the fields are predominately reactive fields, which means the E and H are out of phase by 90 degrees to each other, the boundary of this region nis commonlygiven as: R< (0.62)*SQRT (D^3/lambda)
Radiating near field region. The radiating nearfield region is the region between the near and far fields. In this region, the reactive fields are not dominated, the radiating fields begin to emerge. However, the shape of the radiating field may vary appreciably with distance like far field. The region is commonly given as: (0.62)*SQRT (D^3/lambda) < R < 2D^2/lambda
OPERATING PROCEDURE
First switch on the RF generator by using ON/OFF switch provided on the hind side of the panel and check the power ON LED on front side. For varying amplitude, use
amplitude knob located at the left side on front bezel. For varying frequency, use frequency knob located at the right of amplitude knob on the front bezel. Use
seven segment display for observing frequency generated by RF generator and use RF output BNC for taking of RF signal output from this panel. TABLE:1 SHOWING RF GENERATOR VIEW DESCRIPTION
Points Nomenclature
This is the maximum power is transferred when the load resistance is equal to the antenna resistance. Perfect impedance matching is achieved when Rrad = Rload. In this case, Pload = Pin / 2. Half of the power in the circuit is transferred to the load. There is a current flowing in the antenna. So it must be re radiating power. Even in the best case, half of the power absorbed by the antenna is immediately re radiated, without being transferred to any external circuitry. If an antenna is not matched to the interconnecting transmission line, standing waves is induced along the transmission line. The ration of maximum voltage to minimum voltage along the line is referred as voltage standing wave ratio (VSWR). The
VSWR is the measure of how much power is delivered to a device as opposed to the amount of power that is reflected from the device. If source and load impedance are the same, the VSWR is 1:1, there is no reflected power. So the VSWR is also a measure of how closely the source and loadimpedanceare matched. Hence for matching of impedance Balun is used in the trainer holder box for conversion of antenna impedance to 50 ohmonlyforgetting maximumefficiency.
ANTENNA UTILITY SOFTWARE
The antenna utility software may be used in either ONLINE mode or OFFLINE mode, for this drop down button provided on the software, use this button to select the modeof operation as perexperiment.
Figure 7: showing a polar chart Description of button/box utility antenna software
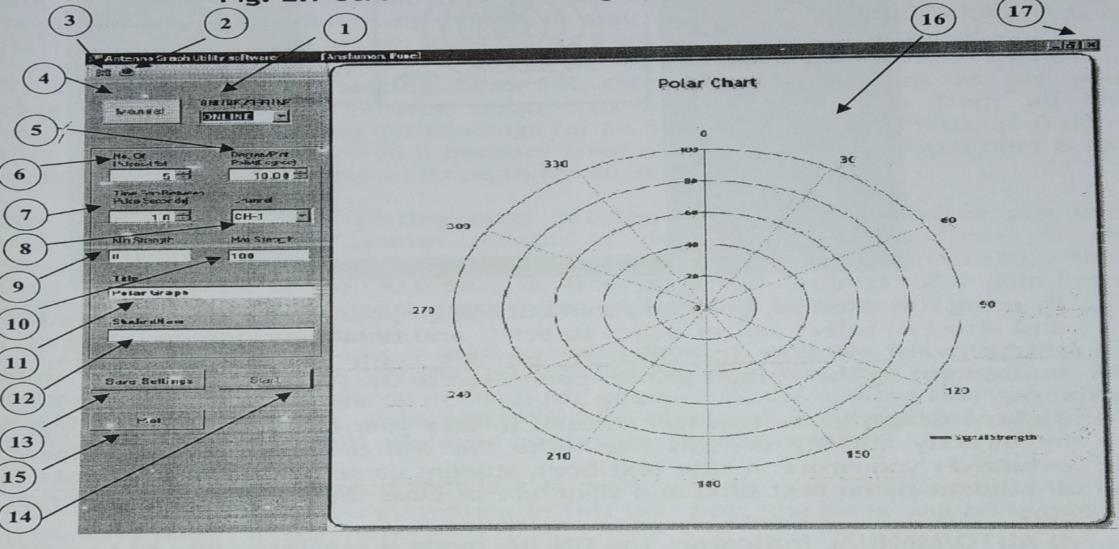
ONLINE/OFFLINE mode selection drop down button. By using this button, you can select the antenna operation mode if you wish to plot antenna directly by controlling stepper driver to PC and acquiring power data from RF power meter, then select ONLINE mode, while if
you have selected data manually for all 360 degrees AUT rotation, the use OFFLINE mode and fill the table to plot the pattern. Print graph icon. This graph is use for printing of observed polar graph by simply clicking on it, first it shows the preview printed window as shown below.
Figure 8: showing preview section of a polar chart

By using this window, you can zoom out the graph to check your observed readings and also can select the number of pages to print. And finally clicking on the print icon of this preview window, graph will get printed out by default printer connected to the PC. Save graph icon. This graph is used to save your observed graph in doc format by directly clicking on this icon. The file will be saved as experiment name, student name and signature of class teacher with observed polar graph.
AUTO/MANUAL indicator.
The ONLINE mode is separated into two sections, one is AUTO and the other is MANUAL. For this, a toggle switch is proved on the hind side of power meter, use this icon to select either ONLINE AUTO mode or ONLINE MANUAL mode. In the ONLINE AUTO mode, the indicator changes green, and in MANUAL the indicator changes to yellow and also text changes to either AUTO or MANUAL as per
selection. Degree/ plot point edit button. It is used to set degree steps for AUTO to capture strength in these angle steps, while in ONLINE AUTO mode only. And in OFFLINE mode set these degrees as per yourobservation. Means if you have taken reading at 10 degrees angle steps then set this edit box to 10 degrees. It is a floating edit box to set angle as per your selection of pulses or plot button. It is ranging from 1 99 degrees. The number of pulses/ plot edit buttons. This button is useful for capturing signal strength as per the setting used in ONLINE AUTO mode only. The time gap between the pulses edit button. This button is used to create a time gap between two pulses while the software is in ONLINE AUTO mode. ADC channel selection button. This drop down button is used for the selection of ADC channel, only one channel is to be selected at a time. Internally, channel 1 is selected by the hardware itself, by default, this is already to ADC channel 1,
www.idosr.org Kisakye
so no need to select while in use, it is rangingfrom channel0to channel4. Minimum strength setting box. Set the value of this box as per your observation for power meter output as minimum strength from all the observationsMaximum strength setting box. Set the value of this box as per your observation for power meter output as maximum strength from all the observations. Title text box. This box is used to write the name of the antenna for which you are going to take the antenna radiation pattern by writing on this box the same text will automatically display on top of the polar graph. Student name text box. This text is used to write the name of the student who is going to take the experiments. By writing in this text box, the same will be displayed on the samepage.
Setting the push button. Click this button to set different boxes provided on the software like ONLINE/ OFFLINE selection, pulses/ plot point, degree/ plot point, time graph, min. and max strength, ADC channel selection, etc. After setting these all, click on the same button to save the settings whatever you selected for your experiment. Start/ stop push button. In ONLINE AUTO mode, use this push button to start acquiring the polar graph. If you want to stop the plotting sequence, then click on the same button to stop plotting of the polar graph.Plot push button. When clicking this push button, a table will pop up with Colum angle and strength, fill the table for all 360 degrees and click the OK button to plot antenna pattern, this button is only used in OFFLINE mode.
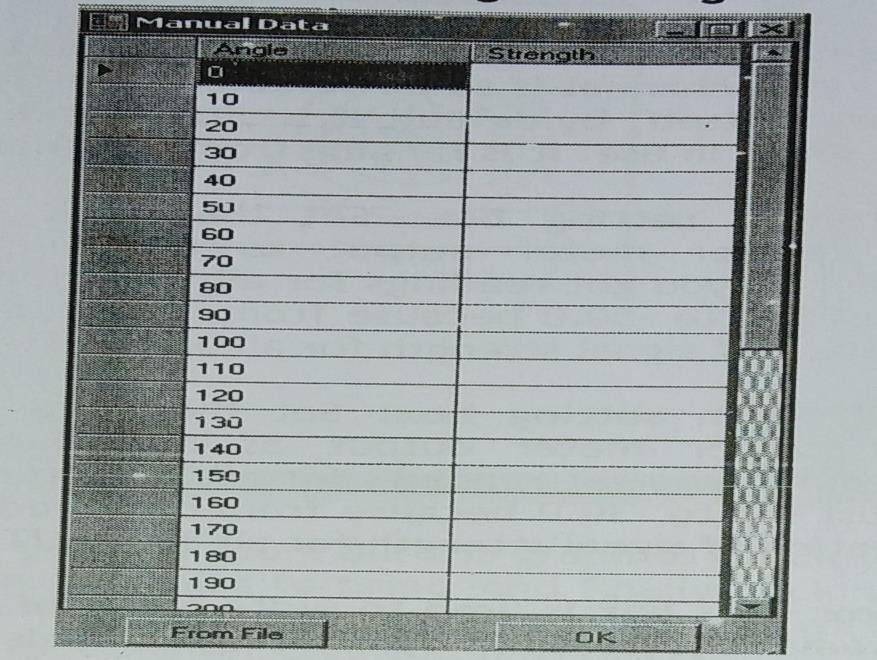
Figure 9: showing chart of polar data
ANTENNA MEASUREMENT TECHNIQUE
Measurement and plotting of antenna radiation pattern
The radiation pattern is the graphical representation of the radiation properties of the antenna as the function of space. The antenna pattern describes how the antenna radiates energy out into space. It is important to state that an antenna radiates energy into all directions, at least
some extent, so the antenna is actually in 3D. The antenna under test must be mounted at the transmitting side and another antenna is required at the receiving energy.
Measurement of antenna beamwidth
A directional antenna can be said to direct a beam of radiation in one or more
www.idosr.org
directions, the width of this beam is defined as the angle between its half power points or 3Db points at its maximum direction, this angle is called antenna beamwidth. Antennas with wide typically have low gain and antennas with narrow beamwidth tend to have higher gain.
Kisakye
Measurement of antenna gain. To be consistent in comparing different antennas, it is necessary to have a standard environment around the antenna. Ideally, measurements should be made with the measured antenna so far removed from any objects causing environmental effects that it can be consideredin theopen space. I (A) TIME
(s)
MEASUREMENT OF BEAM WIDTH USING RADIATION PATTERN PLOT
From the radiation pattern plot, take major lobe, means in which position the antenna radiation is maximum. Now by considering that lobe, find 3dB power levelon thecenterlineof theplot.
Draw an arc at either side of the plot using a compass or by your hand accuratelyfromthe origin ofthe plot. Now from either side of the cut position, draw straight lines to the origin. These lines show some angle difference from the centerline.
Center line
ANGLE
Major lobe Origin
Fig.11: Understanding the Dipole Antenna Control System
We take the view that the dipole antenna control system includes four interrelated subsystems or components:
1. TheUser
2. The transmitter
3. The receiver
4. The display
Each component directly affects another component: for example, the transmitter responds to the user, while the receiver responds to the display. Further, we will provide you with a set of visualized tools that will allow you to see these relationships and more thoroughly understand them.
FAULTS
A fault is any abnormal electric current thatoccurs within the powerline. In the simplest form faults are said to occur on a power system if abnormally
high currents or short circuit flows or if abnormally low current flows/no current flows at all i.e. open circuit.The major causes of ashort circuit are; Insulation breakdown/failure i.e. due to overvoltage application or heating effects ofcurrents.
Mechanical injury leading to conductor/insulation breaking then differentphases cominginto contact.
Tensions/badlysaggingconductors.
Moving objects knocking down supports andconductorsjoining up.
Moving objects coming into contact with the linesthemselves.
Some of the effects of power system faults areas follows; Equipment can get damaged due to high currents/short circuit.
www.idosr.org
Equipment operating at non protective levels.
Equipment not operating at all i.e. when the feederisnotin. It also causes the equipment to stall particularly motors.
CATEGORIES OF POWER LINE FAULTS
Transient faults: these are fault that occurs in line for a short period. These commonly in an overhead power line, transient faults may because due to Momentary tree contact; to address this problem,lineclearance isencouraged Lightning strike: this is the main cause of transient fault in overhead lines, this is common during rainy conditions. Birds or otheranimalgetsin contactwith the line
Conductors clashing each other: this may be due to poor sagging and tensioning of conductors or due vibrating forces from the ground. To overcome this problem resonance damper can be used to reduce the effectof vibrating forces
Asymmetric faults: these cause different effect in phases example of such faults are:
Linetolinefault dueshort circuit
Two lines to the ground faults: to lines getsin contact with the ground Symmetricfault: these causesimilar effectin different lines orphases
EXAMPLES OF COMMON FAULTS IN LINE
Broken neutral conductor
This led to some consumer experiencing high voltages and others getting a stable voltage and others will get dim lights. Consumers having effective earthling experienced a stable voltage since earthling was there to stabiles the voltage. The consumers with poor earthling system experienced high voltage due to broken return [neutral conductor] and ineffectiveearthsystem.
Kisakye
Short circuit
This a situation whereby the phase get into contact with another phase and thus leading to high value of current damaging the equipment and making the feeder to open Another situation here is to find an HV line falling in the LV line, this results into electrical shock and producing arcs on theline
Broken jumpers on the line.
Broken jumper of 11kv feeder of transformer: this results in 3 phase transformer being fed by two lines and as result low voltages were encountered on side of customer the low voltage was due voltage sharing in the winding of a 3phase transformer.
Falling of rotten poles due to bad weather.
Here during rainy seasons many of the rotten poles that were strong in sunny days were found down because of the wind andbad weather.
Permanent faults in power line
This is a fault that makes the feeder to trip out whenever racked in .The feeder can only be racked in when fault is completely corrected. Such a problem can be on a transformer which is burnt within the line or any other persistent cause. This problem is difficult to discover in absence of fault location protection system.it can be addressed by patrolling the feeder till problem discovered. If the feeder has many T offs, one by one t off is disconnected while feeder is racked in. this is done until when T off with a fault is got and patrolled again until the fault is disconnected from the feeder or line. Permanent fault in addition can also be due entangled conductors that can make feeder permanently refuse to be racked in. Can also be burnt vulture within the line contact and leading to high currents andtripping the feedersout.
CONCLUSION
During the stability of the electrical network, it is important to clear faults on high voltage transmission lines quickly with the aid of a high speed protection system. The conventional method of fault
detection is mainly based on impedance measurement techniques. Under fault conditions, the measured impedance is proportional to the distance to the fault fromthe relaylocation.
REFERENCES
1. American Relay League. ARRL Antenna Book, 13th Edition, ARRL Inc.Connecticut. 1999
2. Balanis, C. A. Antenna Theory Analysis and Design, 2nd Edition, John Wiley and Sons, Inc. New York, 1997. P 941.
3. Band, Y., Light, B. and Matter, K. (2011). 1st Edition, John Wiley Inc. England. Adv. Appl. Sci. Res., 2(6):41 50
4. Church, S. A. (2005). Analysis of the use of GSM phones in Nigeria.
International Journal of Communication, 2, P 84 88.
5. Kennedy, G. and Davis, B. (1993). Electronic Communication Systems. 4th Edition. Tata McGraw Hill Publishing Company Ltd. New Delhi., P 763.
6. Mukta, B. (2007). Dictionary of Electronics.1st Edition, Academic Publishers. India.P 358
7. Puri, R. K. and Babbar, V. K. (2007). Solid State Physics and Electronics.
www.idosr.org
4th Edition, Academic Publishers. India..
8. Rama, A. R. and Arora, D.L. (2006). Dictionary of Physics. India Academic Publishers. India.P 388.
9. Roddy, D., and Coolen, G. (1997). Electronic Communication. 4th Edition, Prentice Hall Inc. New York.P 820.
10.Steve, A. and Allday, J. (2000). Advanced Physics. 1st Edition, Oxford University Press. London. P 639.
11.www.tpub.com. Yagi Antenna. 2010.
12.www.wikipedia.org. Antenna Impedance Matching. 2010.
13.Peredacha dannykh (2011): information systems . Moscow.
14.Psurtsev, N. D. (2008). “Obespechenie ASU sredstvami sviazi.” Alternating current. Moscow
15. Emel’ianov, G. A. and V. O.ac power control.(2012) Moscow.
16.Etrukhin, N. N. and Malishevskaia, T. M. (2006). Data connection.’ Elektrosviaz’.
17.Lucky, R. W., Salz, J. and Weldon, E. J. (2007) Principles of Data Communications. New York
18.Masisani William Mufana and Adabara Ibrahim (2022). Monitoring with Communication Technologies of the Smart Grid. IDOSR Journal of Applied Sciences 7(1) 102 112.
19.Nabiryo Patience and Itodo Anthony Ejeh (2022). Design and Implementation of Base Station Temperature Monitoring System Using Raspberry Pi. IDOSR Journal of Science and Technology 7(1):53 66.
20.Masisani William Mufana and Adabara Ibrahim (2022). Implementation of Smart Grid Decision Support Systems IDOSR Journal of Scientific Research 7(1) 50 57, 2022.
21.Natumanya Akimu (2022). Design and Construction of an Automatic Load Monitoring System on a Transformer in Power Distribution
Kisakye
Networks. IDOSR Journal of Scientific Research 7(1) 58 76, 2022.