JetNet April14_PAMA interview November06 18/03/2014 16:34 Page 1
JETNET >>KNOW MORE
Business Turboprops: A Recovery In The Works? by Michael Chase & Marj Rose
1,604 ‘07
20
11
12
20
20
09
20
20
07
08
20
20
05
06
20
20
Year
420 ‘13
361 ‘11
13
535 ‘08
New
04
20
03
272 ‘03
Source: GAMA – New; JETNET excludes two Agricultural OEMs Pre-owned Whole & Leases; Presentation and Analysis by Chase & Associates
1,456 1,283 1,135 ‘11 ‘13 ‘09
Pre-owned
10
1,188 ‘01
20
01
1800 1600 1400 1200 1000 800 600 400 200 0 02
Worldwide New Deliveries Pre-owned Sale Transactions
20
A
CHART A - NEW VS USED TRANSACTIONS
20
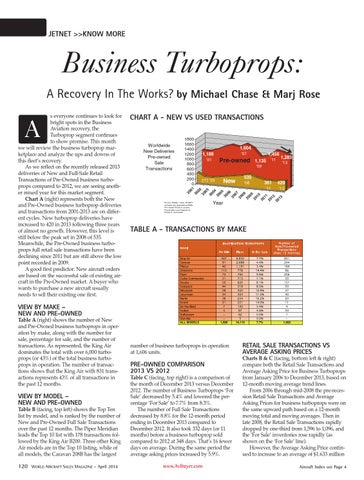
s everyone continues to look for bright spots in the Business Aviation recovery, the Turboprop segment continues to show promise. This month we will review the business turboprop marketplace and analyze the ups and downs of this fleet’s recovery. As we reflect on the recently released 2013 deliveries of New and Full-Sale Retail Transactions of Pre-Owned business turboprops compared to 2012, we are seeing another mixed year for this market segment. Chart A (right) represents both the New and Pre-Owned business turboprop deliveries and transactions from 2001-2013 are on different cycles. New turboprop deliveries have increased to 420 in 2013 following three years of almost no growth. However, this level is still below the peak set in 2008 of 535. Meanwhile, the Pre-Owned business turboprops full retail sale transactions have been declining since 2011 but are still above the low point recorded in 2009. A good first predictor: New aircraft orders are based on the successful sale of existing aircraft in the Pre-Owned market. A buyer who wants to purchase a new aircraft usually needs to sell their existing one first.
TABLE A - TRANSACTIONS BY MAKE
VIEW BY MAKE – NEW AND PRE-OWNED Table A (right) shows the number of New and Pre-Owned business turboprops in operation by make, along with the number for sale, percentage for sale, and the number of transactions. As represented, the King Air dominates the total with over 6,000 turboprops (or 43%) of the total business turboprops in operation. The number of transactions shows that the King Air with 831 transactions represents 43% of all transactions in the past 12 months.
VIEW BY MODEL – NEW AND PRE-OWNED Table B (facing, top left) shows the Top Ten list by model, and is ranked by the number of New and Pre-Owned Full Sale Transactions over the past 12 months. The Piper Meridian leads the Top 10 list with 178 transactions followed by the King Air B200. Three other King Air models are in the Top 10 listing, while of all models, the Caravan 208B has the largest
120
WORLD AIRCRAFT SALES MAGAZINE – April 2014
number of business turboprops in operation at 1,606 units.
PRE-OWNED COMPARISON 2013 VS 2012 Table C (facing, top right) is a comparison of the month of December 2013 versus December 2012. The number of Business Turboprops ‘For Sale’ decreased by 5.4% and lowered the percentage ‘For Sale’ to 7.7% from 8.3%. The number of Full Sale Transactions decreased by 8.8% for the 12-month period ending in December 2013 compared to December 2012. It also took 332 days (or 11 months) before a business turboprop sold compared to 2012 at 348 days. That’s 16 fewer days on average. During the same period the average asking prices increased by 5.9%. www.AvBuyer.com
RETAIL SALE TRANSACTIONS VS AVERAGE ASKING PRICES Charts B & C (facing, bottom left & right) compare both the Retail Sale Transactions and Average Asking Price for Business Turboprops from January 2006 to December 2013, based on 12-month moving average trend lines. From 2006 through mid-2008 the pre-recession Retail Sale Transactions and Average Asking Prices for business turboprops were on the same upward path based on a 12-month moving total and moving averages. Then in late 2008, the Retail Sale Transactions rapidly dropped by one-third from 1,596 to 1,096, and the ‘For Sale’ inventories rose rapidly (as shown on the ‘For Sale’ line). However, the Average Asking Price continued to increase to an average of $1.633 million Aircraft Index see Page 4