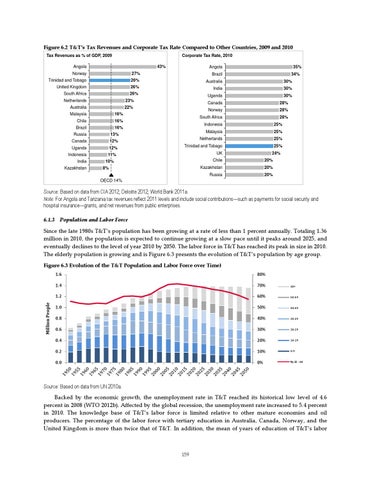
Figure 6.2 T&T’s Tax Revenues and Corporate Tax Rate Compared to Other Countries, 2009 and 2010 Tax Revenues as % of GDP, 2009
Corporate Tax Rate, 2010
Angola
43%
Norway
Angola
35%
27%
Brazil
Trinidad and Tobago
26%
Australia
30%
United Kingdom
26%
India
30%
South Africa
26%
Uganda
Netherlands
23%
Australia
22%
Malaysia
16%
Chile
16%
Brazil
13%
Canada
12%
Uganda Indonesia India Kazakhstan
12%
30%
Canada
28%
Norway
28%
South Africa
16%
Russia
34%
28%
Indonesia
25%
Malaysia
25%
Netherlands
25%
Trinidad and Tobago
25%
UK
11% 10% 8%
24%
Chile
20%
Kazakhstan
20%
Russia
20%
OECD 14%
Source: Based on data from CIA 2012; Deloitte 2012; World Bank 2011a. Note: For Angola and Tanzania tax revenues reflect 2011 levels and include social contributions—such as payments for social security and hospital insurance—grants, and net revenues from public enterprises. 6.1.3 Population and Labor Force
Since the late 1980s T&T’s population has been growing at a rate of less than 1 percent annually. Totaling 1.36 million in 2010, the population is expected to continue growing at a slow pace until it peaks around 2025, and eventually declines to the level of year 2010 by 2050. The labor force in T&T has reached its peak in size in 2010. The elderly population is growing and is Figure 6.3 presents the evolution of T&T’s population by age group.
Million People
Figure 6.3 Evolution of the T&T Population and Labor Force over Time) 1.6
80%
1.4
70%
60+
1.2
60%
50-59
1.0
50%
40-49
0.8
40%
30-39
0.6
30%
20-29
0.4
20%
10-19
0.2
10%
0-9
0.0
0%
% 15 - 64
Source: Based on data from UN 2010a.
Backed by the economic growth, the unemployment rate in T&T reached its historical low level of 4.6 percent in 2008 (WTO 2012b). Affected by the global recession, the unemployment rate increased to 5.4 percent in 2010. The knowledge base of T&T’s labor force is limited relative to other mature economies and oil producers. The percentage of the labor force with tertiary education in Australia, Canada, Norway, and the United Kingdom is more than twice that of T&T. In addition, the mean of years of education of T&T’s labor
159