16 | Jobs and Growth
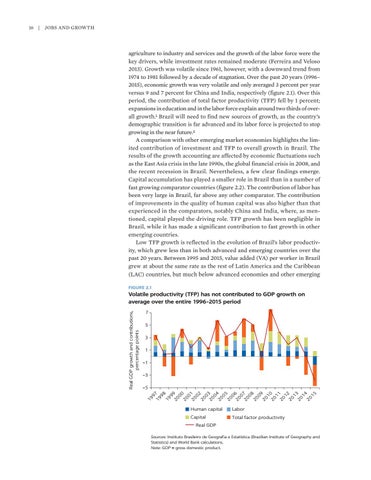
agriculture to industry and services and the growth of the labor force were the key drivers, while investment rates remained moderate (Ferreira and Veloso 2013). Growth was volatile since 1961, however, with a downward trend from 1974 to 1981 followed by a decade of stagnation. Over the past 20 years (1996– 2015), economic growth was very volatile and only averaged 3 percent per year versus 9 and 7 percent for China and India, respectively (figure 2.1). Over this period, the contribution of total factor productivity (TFP) fell by 1 percent; expansions in education and in the labor force explain around two thirds of overall growth.1 Brazil will need to find new sources of growth, as the country’s demographic transition is far advanced and its labor force is projected to stop growing in the near future.2 A comparison with other emerging market economies highlights the limited contribution of investment and TFP to overall growth in Brazil. The results of the growth accounting are affected by economic fluctuations such as the East Asia crisis in the late 1990s, the global financial crisis in 2008, and the recent recession in Brazil. Nevertheless, a few clear findings emerge. Capital accumulation has played a smaller role in Brazil than in a number of fast growing comparator countries (figure 2.2). The contribution of labor has been very large in Brazil, far above any other comparator. The contribution of improvements in the quality of human capital was also higher than that experienced in the comparators, notably China and India, where, as mentioned, capital played the driving role. TFP growth has been negligible in Brazil, while it has made a significant contribution to fast growth in other emerging countries. Low TFP growth is reflected in the evolution of Brazil’s labor productivity, which grew less than in both advanced and emerging countries over the past 20 years. Between 1995 and 2015, value added (VA) per worker in Brazil grew at about the same rate as the rest of Latin America and the Caribbean (LAC) countries, but much below advanced economies and other emerging FIGURE 2.1
7 5 3 1 –1 –3 –5 19 9 19 7 98 19 9 20 9 00 20 0 20 1 02 20 0 20 3 04 20 05 20 0 20 6 0 20 7 08 20 09 20 1 20 0 11 20 12 20 13 20 14 20 15
Real GDP growth and contributions, percentage points
Volatile productivity (TFP) has not contributed to GDP growth on average over the entire 1996–2015 period
Human capital
Labor
Capital
Total factor productivity
Real GDP Sources: Instituto Brasileiro de Geografia e Estatística (Brazilian Institute of Geography and Statistics) and World Bank calculations. Note: GDP = gross domestic product.