58
GROWING SMARTER
Grouping economies by their scores on PISA and TIMSS sheds light on the roots of high performance. Although test scores never tell the whole story, they are the best available comparative indicator. Scores from internationally comparable tests suggest a division of countries into four categories: three performance levels plus a group of countries designated as having emerging education systems because they do not participate in standardized international assessments (table 2.6). Table 2.7 shows the number of students enrolled at various levels in each type of system. Top Performing Systems consistently score more than half a standard deviation above the OECD average score of the tests they have taken. Comparator countries participating in these tests have almost always included the world’s top education systems and wealthiest
TABLE 2.5 Economies in East Asia and Pacific routinely score above 500 on PISA Average composite constructed PISA score of test takers (2000–15)
Economy Shanghai, China Singapore Hong Kong SAR, China Korea, Rep. Japan Taiwan, China Macao SAR, China B-S-J-G (China) Vietnam Thailand Indonesia East Asia and Pacific average OECD average
582 550 541 537 531 526 517 514 509 439 386 505 497
Total population of 15-year-olds 108,056 48,218 65,100 620,687 1,201,615 295,056 5,100 2,084,958 1,803,552 895,513 4,534,216
Sources: PISA 2012 (OECD 2013). Total population of 15-year-olds is from OECD 2016. Total population of 15-year-olds in Shanghai is from PISA 2012 (OECD 2013). Note: Excludes Malaysia’s 2015 score. Includes all economies participating in PISA 2015. Shanghai’s score is from PISA 2012. B-S-J-G (China) = Beijing, Shanghai, Jiangsu, and Guangdong (China); PISA = Programme for International Student Assessment.
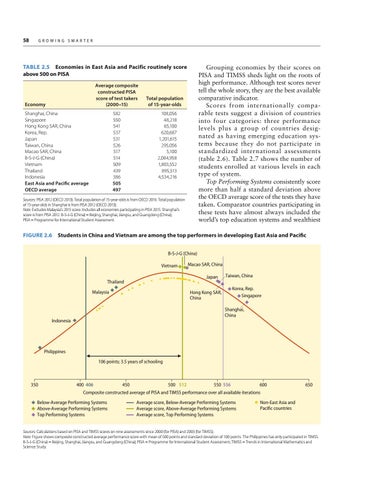
FIGURE 2.6 Students in China and Vietnam are among the top performers in developing East Asia and Pacific B-S-J-G (China) Vietnam
Macao SAR, China Japan
Thailand Malaysia
Hong Kong SAR, China
Taiwan, China Korea, Rep. Singapore Shanghai, China
Indonesia
Philippines 106 points; 3.5 years of schooling
350
400 406 450 500 512 550 556 600 Composite constructed average of PISA and TIMSS performance over all available iterations
Below-Average Performing Systems Above-Average Performing Systems Top Performing Systems
Average score, Below-Average Performing Systems Average score, Above-Average Performing Systems Average score, Top Performing Systems
650
Non-East Asia and Pacific countries
Sources: Calculations based on PISA and TIMSS scores on nine assessments since 2000 (for PISA) and 2003 (for TIMSS). Note: Figure shows composite constructed average performance score with mean of 500 points and standard deviation of 100 points. The Philippines has only participated in TIMSS. B-S-J-G (China) = Beijing, Shanghai, Jiangsu, and Guangdong (China); PISA = Programme for International Student Assessment; TIMSS = Trends in International Mathematics and Science Study.