45
Service Quality and Outcomes
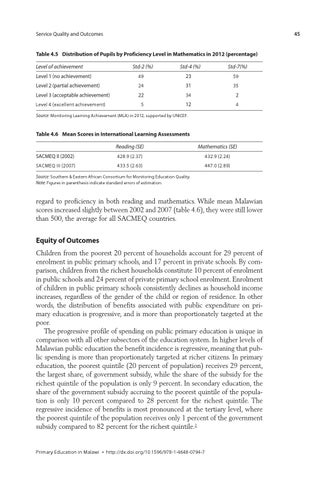
Table 4.5 Distribution of Pupils by Proficiency Level in Mathematics in 2012 (percentage) Level of achievement
Std-2 (%)
Std-4 (%)
Std-7(%)
Level 1 (no achievement)
49
23
59
Level 2 (partial achievement)
24
31
35
Level 3 (acceptable achievement)
22
34
2
5
12
4
Level 4 (excellent achievement)
Source: Monitoring Learning Achievement (MLA) in 2012, supported by UNICEF.
Table 4.6 Mean Scores in International Learning Assessments
Reading (SE)
Mathematics (SE)
SACMEQ II (2002)
428.9 (2.37)
432.9 (2.24)
SACMEQ III (2007)
433.5 (2.63)
447.0 (2.89)
Source: Southern & Eastern African Consortium for Monitoring Education Quality. Note: Figures in parenthesis indicate standard errors of estimation.
regard to proficiency in both reading and mathematics. While mean Malawian scores increased slightly between 2002 and 2007 (table 4.6), they were still lower than 500, the average for all SACMEQ countries.
Equity of Outcomes Children from the poorest 20 percent of households account for 29 percent of enrolment in public primary schools, and 17 percent in private schools. By comparison, children from the richest households constitute 10 percent of enrolment in public schools and 24 percent of private primary school enrolment. Enrolment of children in public primary schools consistently declines as household income increases, regardless of the gender of the child or region of residence. In other words, the distribution of benefits associated with public expenditure on primary education is progressive, and is more than proportionately targeted at the poor. The progressive profile of spending on public primary education is unique in comparison with all other subsectors of the education system. In higher levels of Malawian public education the benefit incidence is regressive, meaning that public spending is more than proportionately targeted at richer citizens. In primary education, the poorest quintile (20 percent of population) receives 29 percent, the largest share, of government subsidy, while the share of the subsidy for the richest quintile of the population is only 9 percent. In secondary education, the share of the government subsidy accruing to the poorest quintile of the population is only 10 percent compared to 28 percent for the richest quintile. The regressive incidence of benefits is most pronounced at the tertiary level, where the poorest quintile of the population receives only 1 percent of the government subsidy compared to 82 percent for the richest quintile.1
Primary Education in Malawi • http://dx.doi.org/10.1596/978-1-4648-0794-7