158
APPENDIX A
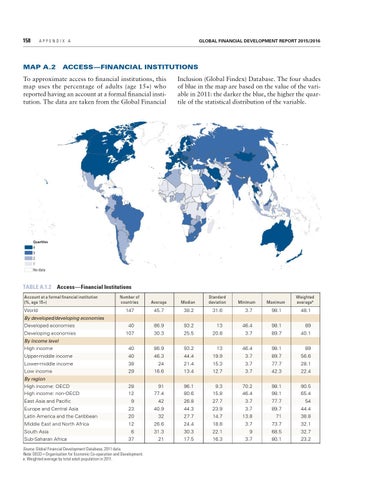
MAP A.2
GLOBAL FINANCIAL DEVELOPMENT REPORT 2015/2016
ACCESS—FINANCIAL INSTITUTIONS
To approximate access to fi nancial institutions, this map uses the percentage of adults (age 15+) who reported having an account at a formal financial institution. The data are taken from the Global Financial
Quartiles 4 3 2 1
Inclusion (Global Findex) Database. The four shades of blue in the map are based on the value of the variable in 2011: the darker the blue, the higher the quartile of the statistical distribution of the variable.
Quartiles 4 3 2 1 No data
No data
TABLE A.1.2
Access—Financial Institutions
Account at a formal fi nancial institution (%, age 15+)
Number of countries
Average
Median
Standard deviation
World By developed/developing economies
147
45.7
38.2
31.6
Developed economies Developing economies By income level
40 107
86.9 30.3
93.2 25.5
High income Upper-middle income Lower-middle income Low income By region High income: OECD High income: non-OECD
40 40 38 29
86.9 46.3 24 16.6
28 12
East Asia and Pacific Europe and Central Asia Latin America and the Caribbean Middle East and North Africa South Asia Sub-Saharan Africa
9 23 20 12 6 37
Source: Global Financial Development Database, 2011 data. Note: OECD = Organisation for Economic Co-operation and Development. a. Weighted average by total adult population in 2011.
Maximum
Weighted averagea
3.7
98.1
48.1
13 20.8
46.4 3.7
98.1 89.7
89 40.1
93.2 44.4 21.4 13.4
13 19.9 15.3 12.7
46.4 3.7 3.7 3.7
98.1 89.7 77.7 42.3
89 56.6 28.1 22.4
91 77.4
96.1 80.6
9.3 15.8
70.2 46.4
98.1 98.1
90.5 65.4
42 40.9 32 26.6 31.3 21
26.8 44.3 27.7 24.4 30.3 17.5
27.7 23.9 14.7 18.8 22.1 16.3
3.7 3.7 13.8 3.7 9 3.7
77.7 89.7 71 73.7 68.5 80.1
54 44.4 38.8 32.1 32.7 23.2
Minimum