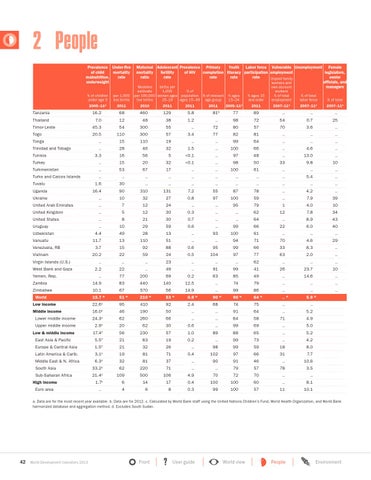
2 People Prevalence Under-five of child mortality malnutrition, rate underweight
Maternal Adolescent Prevalence Primary Youth Labor force Vulnerable Unemployment Female mortality fertility of HIV completion literacy participation employment legislators, ratio rate rate rate rate senior Unpaid family officials, and workers and managers Modeled births per own-account
estimate 1,000 % of per 100,000 women ages population % of relevant live births 15–19 ages 15–49 age group
% ages 15–24
% ages 15 and older
workers % of total employment
% of total labor force
% of total
2005–11a
2011
2007–11 a
2007–11 a
2007–11 a
% of children under age 5
per 1,000 live births
2005–11 a
2011
2010
2011
2011
Tanzania
16.2
68
460
129
5.8
81b
77
89
..
..
..
Thailand
7.0
12
48
38
1.2
..
98
72
54
0.7
25
2011
Timor-Leste
45.3
54
300
55
..
72
80
57
70
3.6
..
Togo
20.5
110
300
57
3.4
77
82
81
..
..
..
Tonga
..
15
110
19
..
..
99
64
..
..
..
Trinidad and Tobago
..
28
46
32
1.5
..
100
66
..
4.6
..
3.3
16
56
5
<0.1
..
97
48
..
13.0
..
Turkey
..
15
20
32
<0.1
..
98
50
33
9.8
10
Turkmenistan
..
53
67
17
..
..
100
61
..
..
..
Turks and Caicos Islands
..
..
..
..
..
..
..
..
..
5.4
..
Tuvalu
1.6
30
..
..
..
..
..
..
..
..
..
Uganda
16.4
90
310
131
7.2
55
87
78
..
4.2
..
Ukraine
..
10
32
27
0.8
97
100
59
..
7.9
39
United Arab Emirates
..
7
12
24
..
..
95
79
1
4.0
10
United Kingdom
..
5
12
30
0.3
..
..
62
12
7.8
34
United States
..
8
21
30
0.7
..
..
64
..
8.9
43
Uruguay
..
10
29
59
0.6
..
99
66
22
6.0
40
4.4
49
28
13
..
93
100
61
..
..
..
11.7
13
110
51
..
..
94
71
70
4.6
29
Tunisia
Uzbekistan Vanuatu Venezuela, RB Vietnam Virgin Islands (U.S.) West Bank and Gaza Yemen, Rep.
3.7
15
92
88
0.6
95
99
66
33
8.3
..
20.2
22
59
24
0.5
104
97
77
63
2.0
..
..
..
..
23
..
..
..
62
..
..
..
2.2
22
..
49
..
91
99
41
26
23.7
10
..
77
200
69
0.2
63
85
49
..
14.6
..
Zambia
14.9
83
440
140
12.5
..
74
79
..
..
..
Zimbabwe
10.1
67
570
56
14.9
..
99
86
..
..
..
15.7 w
51 w
210 w
53 w
0.8 w
90 w
90 w
64 w
.. w
World
5.9 w
Low income
22.6c
95
410
92
2.4
68
74
75
..
..
Middle income
16.0 c
46
190
50
..
..
91
64
..
5.2
Lower middle income
24.3c
62
260
66
..
..
84
58
71
4.9
Upper middle income
2.9c
20
62
30
0.6
..
99
69
..
5.0
Low & middle income
17.4 c
56
230
57
1.0
89
88
65
..
5.2
East Asia & Pacific
5.5c
21
83
19
0.2
..
99
73
..
4.2
Europe & Central Asia
1.5c
21
32
26
..
98
99
59
18
8.0
Latin America & Carib.
3.1c
19
81
71
0.4
102
97
66
31
7.7
Middle East & N. Africa
6.3c
32
81
37
..
90
91
46
..
10.6 3.5
South Asia
33.2c
62
220
71
..
..
79
57
78
Sub-Saharan Africa
21.4 c
109
500
106
4.9
70
72
70
..
..
High income
1.7c
6
14
17
0.4
100
100
60
..
8.1
Euro area
..
4
6
8
0.3
99
100
57
11
10.1
a. Data are for the most recent year available. b. Data are for 2012. c. Calculated by World Bank staff using the United Nations Children’s Fund, World Health Organization, and World Bank harmonized database and aggregation method. d. Excludes South Sudan.
42
World Development Indicators 2013
Front
?
User guide
World view
People Environment