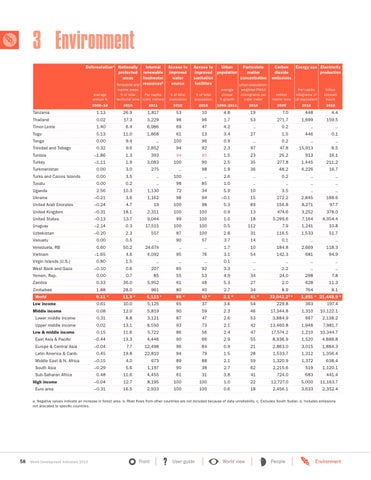
3 Environment Deforestationa Nationally protected areas
average annual %
Internal renewable freshwater b Terrestrial and resources
Access to improved water source
Access to Urban Particulate Carbon improved population matter dioxide sanitation concentration emissions facilities urban-population-
Energy use Electricity production
marine areas % of total Per capita territorial area cubic meters
% of total population
% of total population
average annual % growth
weighted PM10 micrograms per cubic meter
million metric tons
Per capita kilograms of oil equivalent
billion kilowatt hours
2009
2010
2010
2000–10
2010
2011
2010
2010
1990–2011
2010
Tanzania
1.13
26.9
1,817
53
10
4.8
19
7.0
448
4.4
Thailand
0.02
17.3
3,229
96
96
1.7
53
271.7
1,699
159.5
Timor-Leste
1.40
6.4
6,986
69
47
4.2
..
0.2
..
..
Togo
5.13
11.0
1,868
61
13
3.4
27
1.5
446
0.1
Tonga
0.00
9.4
..
100
96
0.9
..
0.2
..
..
Trinidad and Tobago
0.32
9.6
2,852
94
92
2.3
97
47.8
15,913
8.5
Tunisia
–1.86
1.3
393
94
85
1.5
23
25.2
913
16.1
Turkey
–1.11
1.9
3,083
100
90
2.5
35
277.8
1,445
211.2
Turkmenistan
0.00
3.0
275
..
98
1.9
36
48.2
4,226
16.7
Turks and Caicos Islands
0.00
3.5
..
100
..
2.6
..
0.2
..
..
Tuvalu
0.00
0.2
..
98
85
1.0
..
..
..
..
Uganda
2.56
10.3
1,130
72
34
5.9
10
3.5
..
..
Ukraine
–0.21
3.6
1,162
98
94
–0.1
15
272.2
2,845
188.6
United Arab Emirates
–0.24
4.7
19
100
98
5.3
89
156.8
8,271
97.7
United Kingdom
–0.31
18.1
2,311
100
100
0.9
13
474.6
3,252
378.0
United States
–0.13
13.7
9,044
99
100
1.0
18
5,299.6
7,164
4,354.4
Uruguay
–2.14
0.3
17,515
100
100
0.5
112
7.9
1,241
10.8
Uzbekistan
–0.20
2.3
557
87
100
2.8
31
116.5
1,533
51.7
Vanuatu
0.00
0.5
..
90
57
3.7
14
0.1
..
..
Venezuela, RB
0.60
50.2
24,674
..
..
1.7
10
184.8
2,669
118.3
Vietnam
–1.65
4.6
4,092
95
76
3.1
54
142.3
681
94.9
Virgin Islands (U.S.)
0.80
1.5
..
..
..
0.1
..
..
..
..
West Bank and Gaza
–0.10
0.6
207
85
92
3.3
..
2.2
..
..
0.00
0.7
85
55
53
4.9
34
24.0
298
7.8
Zambia
0.33
36.0
5,952
61
48
5.3
27
2.0
628
11.3
Zimbabwe
1.88
28.0
961
80
40
2.7
34
8.9
764
8.1
0.11 w
11.9 w
88 w
63 w
2.1
Yemen, Rep.
World
6,115 s
w
41 w
32,042.2d w
1,851 w 21,448.9 w
Low income
0.61
10.0
5,125
65
37
3.6
54
229.8
363
197.4
Middle income
0.08
12.0
5,819
90
59
2.3
46
17,344.8
1,310
10,122.1 2,138.2
Lower middle income
0.31
8.8
3,121
87
47
2.6
53
3,884.9
667
Upper middle income
0.02
13.1
8,550
93
73
2.1
42
13,460.8
1,948
7,981.7
Low & middle income
0.15
11.6
5,722
86
56
2.4
47
17,574.2
1,210
10,344.7
East Asia & Pacific
–0.44
13.3
4,446
90
66
2.9
55
8,936.9
1,520
4,888.8
Europe & Central Asia
–0.04
7.7
12,498
96
84
0.9
21
2,863.0
3,015
1,884.3
Latin America & Carib.
0.45
19.8
22,810
94
79
1.5
28
1,533.7
1,312
1,356.4
Middle East & N. Africa
–0.15
4.0
673
89
88
2.1
59
1,320.9
1,372
638.4
South Asia
–0.29
5.6
1,197
90
38
2.7
62
2,215.6
519
1,120.1
0.48
11.6
4,455
61
31
3.8
41
724.0
683
441.4
High income
Sub-Saharan Africa
–0.04
12.7
8,195
100
100
1.0
22
12,727.0
5,000
11,163.7
Euro area
–0.31
16.5
2,933
100
100
0.6
18
2,456.1
3,633
2,352.4
a. Negative values indicate an increase in forest area. b. River flows from other countries are not included because of data unreliability. c. Excludes South Sudan. d. Includes emissions not allocated to specific countries.
58
World Development Indicators 2013
Front
?
User guide
World view People view People Environment