Brazzaville Conakry Abuja Nairobi Kampala Ouagadougou Lubumbashi Blantyre Assessing Water Management Challenges and Capacities in African Cities 73 Lilongwe Dar es Salaam
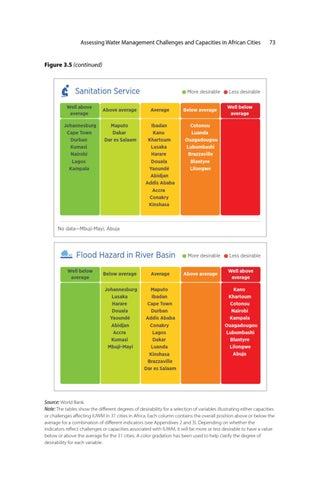
Figure 3.5 (continued)
Sanitation Service Well above average Johannesburg Cape Town Durban Kumasi Nairobi Lagos Kampala
More desirable
Above average
Average
Below average
Maputo Dakar Dar es Salaam
Ibadan Kano Khartoum Lusaka Harare Douala Yaoundé Abidjan Addis Ababa Accra Conakry Kinshasa
Cotonou Luanda Ouagadougou Lubumbashi Brazzaville Blantyre Lilongwe
Less desirable Well below average
No data—Mbuji-Mayi, Abuja
Flood Hazard in River Basin Well below average
Below average
Average
Johannesburg Lusaka Harare Douala Yaoundé Abidjan Accra Kumasi Mbuji-Mayi
Maputo Ibadan Cape Town Durban Addis Ababa Conakry Lagos Dakar Luanda Kinshasa Brazzaville Dar es Salaam
More desirable Above average
Less desirable Well above average Kano Khartoum Cotonou Nairobi Kampala Ouagadougou Lubumbashi Blantyre Lilongwe Abuja
Source: World Bank. Note: The tables show the different degrees of desirability for a selection of variables illustrating either capacities or challenges affecting IUWM in 31 cities in Africa. Each column contains the overall position above or below the average for a combination of different indicators (see Appendixes 2 and 3). Depending on whether the indicators reflect challenges or capacities associated with IUWM, it will be more or less desirable to have a value below or above the average for the 31 cities. A color gradation has been used to help clarify the degree of desirability for each variable.