24 The Future of Water in African Cities
wastewater treatment plants (half of which were lagoon-based), and many of these were not functioning or functioning significantly below capacity. For example, in Luanda, a city of over 4 million, all the collected wastewater is discharged untreated into the sea outfall. Harare had a relatively high level of wastewater treatment 15 years ago, but now it is estimated that only 5 percent of the wastewater produced is treated in two large activated sludge plants and two waste stabilization ponds. Even in South Africa, which has an extensive network of wastewater treatment plants, of the 1,600 treatment plants operating, 60 percent do not meet discharge requirements (GWI, 2009).
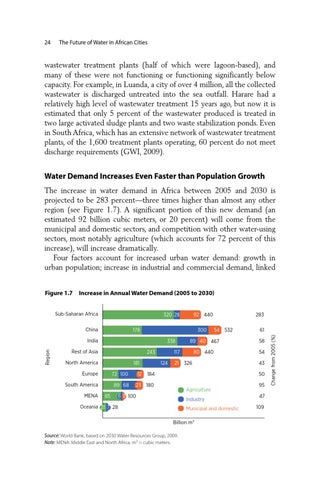
Water Demand Increases Even Faster than Population Growth The increase in water demand in Africa between 2005 and 2030 is projected to be 283 percent—three times higher than almost any other region (see Figure 1.7). A significant portion of this new demand (an estimated 92 billion cubic meters, or 20 percent) will come from the municipal and domestic sectors, and competition with other water-using sectors, most notably agriculture (which accounts for 72 percent of this increase), will increase dramatically. Four factors account for increased urban water demand: growth in urban population; increase in industrial and commercial demand, linked Figure 1.7 Increase in Annual Water Demand (2005 to 2030) 320 28
China
178
300
Region
India
338
Rest of Asia
243
North America
181
Europe
72 100
South America
89 68
MENA
92 440
85
12
54 532
61
89 440 40 467
58
80 440
54
117 124
283
21 326
43 50
184
23 180
Agriculture
6 9 100
Industry
Oceania 21 7 28
Municipal and domestic Billion m3
Source: World Bank, based on 2030 Water Resources Group, 2009. Note: MENA: Middle East and North Africa. m3 = cubic meters.
95 47 109
Change from 2005 (%)
Sub-Saharan Africa