22 The Future of Water in African Cities
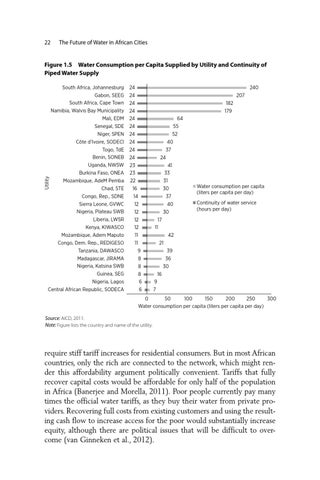
Figure 1.5 Water Consumption per Capita Supplied by Utility and Continuity of Piped Water Supply
Utility
South Africa, Johannesburg Gabon, SEEG South Africa, Cape Town Namibia, Walvis Bay Municipality Mali, EDM Senegal, SDE Niger, SPEN Côte d'Ivoire, SODECI Togo, TdE Benin, SONEB Uganda, NWSW Burkina Faso, ONEA Mozambique, AdeM Pemba Chad, STE Congo, Rep., SDNE Sierra Leone, GVWC Nigeria, Plateau SWB Liberia, LWSR Kenya, KIWASCO Mozambique, Adem Maputo Congo, Dem. Rep., REDIGESO Tanzania, DAWASCO Madagascar, JIRAMA Nigeria, Katsina SWB Guinea, SEG Nigeria, Lagos Central African Republic, SODECA
24 24 24 24 24 24 24 24 24 24 23 23 22 16 14 12 12 12 12 11 11 9 8 8 8 6 6
240 207 182 179 64 55 52 40 37 24 41 33 31 30 37 40 30 17 11 42 21 39 36 30 16 9 7
Water consumption per capita (liters per capita per day) Continuity of water service (hours per day)
0 50 100 150 200 250 300 Water consumption per capita (liters per capita per day) Source: AICD, 2011. Note: Figure lists the country and name of the utility.
require stiff tariff increases for residential consumers. But in most African countries, only the rich are connected to the network, which might render this affordability argument politically convenient. Tariffs that fully recover capital costs would be affordable for only half of the population in Africa (Banerjee and Morella, 2011). Poor people currently pay many times the official water tariffs, as they buy their water from private providers. Recovering full costs from existing customers and using the resulting cash flow to increase access for the poor would substantially increase equity, although there are political issues that will be difficult to overcome (van Ginneken et al., 2012).