Africa’s Emerging Urban Water Challenges 21
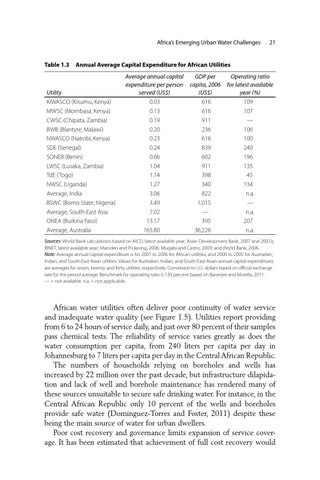
Table 1.3 Annual Average Capital Expenditure for African Utilities
Utility KIWASCO (Kisumu, Kenya) MWSC (Mombasa, Kenya) CWSC (Chipata, Zambia) BWB (Blantyre, Malawi) NWASCO (Nairobi, Kenya) SDE (Senegal) SONEB (Benin) LWSC (Lusaka, Zambia) TdE (Togo) NWSC (Uganda) Average, India BSWC (Borno State, Nigeria) Average, South-East Asia ONEA (Burkina Faso) Average, Australia
Average annual capital GDP per Operating ratio expenditure per person capita, 2006 for latest available served (US$) (US$) year (%) 0.03 616 109 0.13 616 107 0.19 911 — 0.20 236 106 0.23 616 100 0.24 839 240 0.66 602 196 1.04 911 135 1.14 398 45 1.27 340 134 3.06 822 n.a. 3.49 1,015 — 7.02 — n.a. 13.17 395 207 165.80 36,226 n.a.
Sources: World Bank calculations based on AICD, latest available year; Asian Development Bank, 2007 and 2007a; IBNET, latest available year; Marsden and Pickering, 2006; Mugabi and Castro, 2009; and World Bank, 2006. Note: Average annual capital expenditure is for 2001 to 2006 for African utilities, and 2000 to 2005 for Australian, Indian, and South-East Asian utilities. Values for Australian, Indian, and South-East Asian annual capital expenditures are averages for seven, twenty, and forty utilities, respectively. Conversion to U.S. dollars based on official exchange rate for the period average. Benchmark for operating ratio is 130 percent based on Banerjee and Morella, 2011. — = not available. n.a. = not applicable.
African water utilities often deliver poor continuity of water service and inadequate water quality (see Figure 1.5). Utilities report providing from 6 to 24 hours of service daily, and just over 80 percent of their samples pass chemical tests. The reliability of service varies greatly as does the water consumption per capita, from 240 liters per capita per day in Johannesburg to 7 liters per capita per day in the Central African Republic. The numbers of households relying on boreholes and wells has increased by 22 million over the past decade, but infrastructure dilapidation and lack of well and borehole maintenance has rendered many of these sources unsuitable to secure safe drinking water. For instance, in the Central African Republic only 10 percent of the wells and boreholes provide safe water (Dominguez-Torres and Foster, 2011) despite these being the main source of water for urban dwellers. Poor cost recovery and governance limits expansion of service coverage. It has been estimated that achievement of full cost recovery would