Africa’s Emerging Urban Water Challenges 17
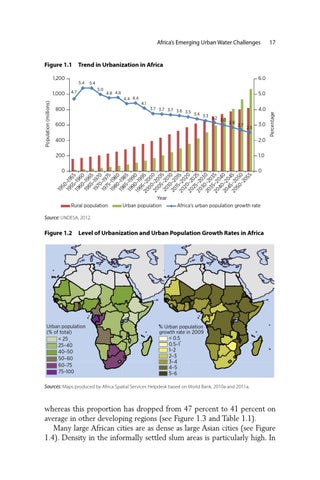
Figure 1.1 Trend in Urbanization in Africa
Population (millions)
1,000
5.4
6.0
5.4
4.7
5.0
4.8 4.8
800
4.4 4.4
5.0 4.1 3.7 3.7 3.7 3.6 3.5 3.4 3.3 3.2 3.0
600
4.0 2.9
2.7
2.5
3.0
400
2.0
200
1.0
0
Percentage
1,200
19 50 19 –19 55 55 19 –19 60 60 19 –19 65 65 19 –19 70 70 19 –19 75 75 19 –19 80 80 19 –19 85 85 19 –19 9 9 19 0–1 0 95 99 20 –2 5 00 00 20 –2 0 05 00 20 –20 5 10 1 20 –2 0 15 015 20 –2 20 02 20 –2 0 25 02 20 –2 5 3 03 20 0–2 0 35 03 20 –2 5 40 04 20 –2 0 45 04 20 –2 5 50 05 –2 0 05 5
0
Rural population
Year Urban population
Africa's urban population growth rate
Source: UNDESA, 2012.
Figure 1.2 Level of Urbanization and Urban Population Growth Rates in Africa
Urban population (% of total) < 25 25–40 40–50 50–60 60–75 75–100
% Urban population growth rate in 2009 < 0.5 0.5–1 1–2 2–3 3–4 4–5 5–6
Sources: Maps produced by Africa Spatial Services Helpdesk based on World Bank, 2010a and 2011a.
whereas this proportion has dropped from 47 percent to 41 percent on average in other developing regions (see Figure 1.3 and Table 1.1). Many large African cities are as dense as large Asian cities (see Figure 1.4). Density in the informally settled slum areas is particularly high. In