8 The Future of Water in African Cities
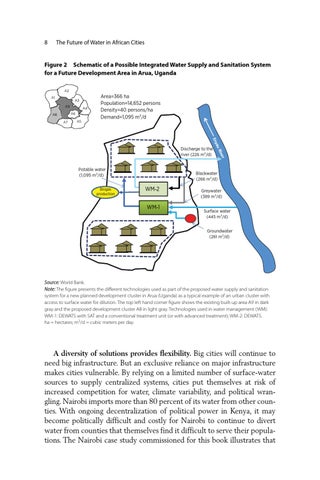
Figure 2 Schematic of a Possible Integrated Water Supply and Sanitation System for a Future Development Area in Arua, Uganda A2 A1
A3 A9
A4 A6
A8 A7
A5
Area=366 ha Population=14,652 persons Density=40 persons/ha Demand=1,095 m3/d
Discharge to the river (226 m3/d) Potable water (1,095 m3/d) Biogas production
Blackwater (266 m3/d)
WM-2 WM-1
Greywater (389 m3/d) Surface water (445 m3/d) Groundwater (261 m3/d)
Source: World Bank. Note: The figure presents the different technologies used as part of the proposed water supply and sanitation system for a new planned development cluster in Arua (Uganda) as a typical example of an urban cluster with access to surface water for dilution. The top left hand corner figure shows the existing built-up area A9 in dark gray and the proposed development cluster A8 in light gray. Technologies used in water management (WM): WM-1: DEWATS with SAT and a conventional treatment unit (or with advanced treatment); WM-2: DEWATS. ha = hectares; m3/d = cubic meters per day.
A diversity of solutions provides flexibility. Big cities will continue to need big infrastructure. But an exclusive reliance on major infrastructure makes cities vulnerable. By relying on a limited number of surface-water sources to supply centralized systems, cities put themselves at risk of increased competition for water, climate variability, and political wrangling. Nairobi imports more than 80 percent of its water from other counties. With ongoing decentralization of political power in Kenya, it may become politically difficult and costly for Nairobi to continue to divert water from counties that themselves find it difficult to serve their populations. The Nairobi case study commissioned for this book illustrates that