Overview 5
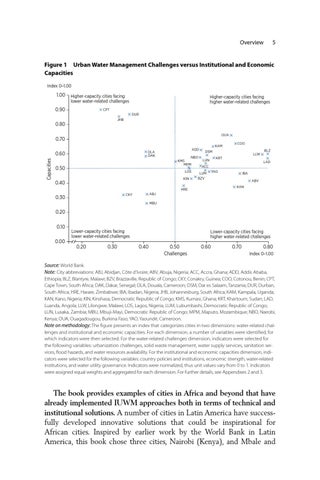
Figure 1 Urban Water Management Challenges versus Institutional and Economic Capacities Index 0–1.00
1.00
Higher-capacity cities facing lower water-related challenges
0.90
Higher-capacity cities facing higher water-related challenges
CPT DUR JHB
0.80
OUA
0.70 DLA DAK
Capacities
0.60 0.50
ADD NBO KMS MPM LOS KIN
0.40
KAM
LLW
KRT
LUN
BLZ LAD
ACC YAO
LUM BZV
IBA ABV KAN
HRE ABJ
CKY
0.30
COO
DSM
MBU
0.20 0.10 0.00
Lower-capacity cities facing lower water-related challenges
0.20
0.30
Lower-capacity cities facing higher water-related challenges
0.40
0.50 Challenges
0.60
0.70
0.80 Index 0–1.00
Source: World Bank. Note: City abbreviations: ABJ, Abidjan, Côte d’Ivoire; ABV, Abuja, Nigeria; ACC, Accra, Ghana; ADD, Addis Ababa, Ethiopia; BLZ, Blantyre, Malawi; BZV, Brazzaville, Republic of Congo; CKY, Conakry, Guinea; COO, Cotonou, Benin; CPT, Cape Town, South Africa; DAK, Dakar, Senegal; DLA, Douala, Cameroon; DSM, Dar es Salaam, Tanzania; DUR, Durban, South Africa; HRE, Harare, Zimbabwe; IBA, Ibadan, Nigeria; JHB, Johannesburg, South Africa; KAM, Kampala, Uganda; KAN, Kano, Nigeria; KIN, Kinshasa, Democratic Republic of Congo; KMS, Kumasi, Ghana; KRT, Khartoum, Sudan; LAD, Luanda, Angola; LLW, Lilongwe, Malawi; LOS, Lagos, Nigeria; LUM, Lubumbashi, Democratic Republic of Congo; LUN, Lusaka, Zambia; MBU, Mbuji-Mayi, Democratic Republic of Congo; MPM, Maputo, Mozambique; NBO, Nairobi, Kenya; OUA, Ouagadougou, Burkina Faso; YAO, Yaoundé, Cameroon. Note on methodology: The figure presents an index that categorizes cities in two dimensions: water-related challenges and institutional and economic capacities. For each dimension, a number of variables were identified, for which indicators were then selected. For the water-related challenges dimension, indicators were selected for the following variables: urbanization challenges, solid waste management, water supply services, sanitation services, flood hazards, and water resources availability. For the institutional and economic capacities dimension, indicators were selected for the following variables: country policies and institutions, economic strength, water-related institutions, and water utility governance. Indicators were normalized, thus unit values vary from 0 to 1. Indicators were assigned equal weights and aggregated for each dimension. For further details, see Appendixes 2 and 3.
The book provides examples of cities in Africa and beyond that have already implemented IUWM approaches both in terms of technical and institutional solutions. A number of cities in Latin America have successfully developed innovative solutions that could be inspirational for African cities. Inspired by earlier work by the World Bank in Latin America, this book chose three cities, Nairobi (Kenya), and Mbale and