183
Kampala
Kampala
Kampala
Lusaka
Lusaka
Lusaka
Harare
Harare
Harare
Uganda
Uganda
Uganda
Zambia
Zambia
Zambia
Zimbabwe
Zimbabwe
Zimbabwe
2010
2000
1990
2010
2000
1990
2010
2000
1990
2010
2000
1990
2010
2000
1990
2010
2000
Target period
170
170
170
172
172
172
171
171
171
166
166
166
173
173
173
170
170
Path
72
72
72
71
71
71
60
60
60
65
65
65
49
49
49
78
78
Row
5/26/09
9/30/00
6/23/90
5/30/11
2/22/02
3/1/90
1/28/10
11/27/01
2/27/89
07/01/09
02/09/01
12/09/89
1/26/10
12/24/00
12/10/89
5/26/09
1/7/02
Date
Landsat 5 TM
Landsat 7
Landsat 4-5 TM
Landsat 5 TM
Landsat 7
Landsat 4-5 TM
Landsat 5 TM
Landsat 7
Landsat 4-5 TM
n.a.
n.a.
n.a.
Landsat 5 TM
Landsat 7
Landsat 4-5 TM
Landsat 5 TM
Landsat 7
Platform
Good
Good
Good
Good
Good
Quality
36N 36N
Good
36N
35N
35N
35N
36N
36N
36N
37N
37N
37N
36N
36N
36N
35N
35N
UTM projection
Good
Good
Good
Good
Good
Good
Good
Good
Good
Poor - clouds
Poor - clouds
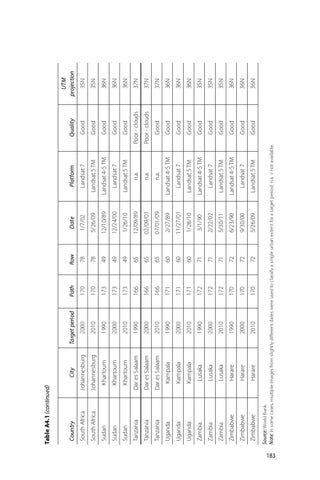
Source: World Bank. Note: In some cases, multiple images from slightly different dates were used to classify a single urban extent for a target period. n.a. = not available.
Dar es Salaam
Dar es Salaam
Tanzania
Dar es Salaam
Tanzania
Tanzania
Khartoum
Khartoum
Sudan
Sudan
Khartoum
Johannesburg
South Africa
Sudan
Johannesburg
City
South Africa
Country
Table A4.1 (continued)