Variable
Quantitative
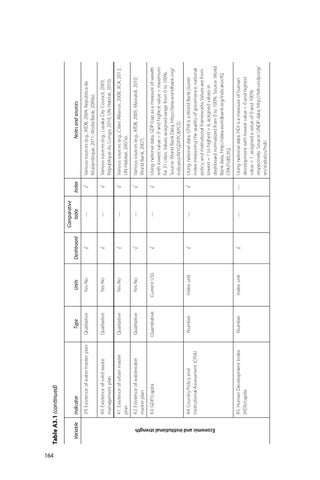
43. GDP/capita
Number
Qualitative
42. Existence of wastewater master plan
45. Human Development Index (HDI)/capita
Qualitative
41. Existence of urban master plan
Number
Qualitative
40. Existence of solid waste management plan
44. Country Policy and Institutional Assessment (CPIA)
Qualitative
Type
39. Existence of water master plan
Indicator
Table A3.1 (continued)
Economic and institutional strength
164 Index unit
Index unit
Current US$
Yes-No
Yes-No
Yes-No
Yes-No
Units
√
√
√
√
√
√
√
Dashboard
—
—
—
—
—
—
—
Comparative table
—
√
√
√
√
√
√
Index
Notes and sources
Using national data. HDI is a measure of human development with lowest value = 0 and highest value = 1, assigned a value of 0 and 100% respectively. Source: UNDP data, http://hdr.undp.org/ en/statistics/hdi/.
Using national data. CPIA is a World Bank cluster index measuring the quality of governance, national policy, and institutional frameworks. Values are from lowest = 1 to highest = 6, assigned values in dashboard normalized from 0 to 100%. Source: World Bank data, http://data.worldbank.org/indicator/IQ. CPA.PUBS.XQ.
Using national data. GDP/cap as a measure of wealth with lowest value = 0 and highest value = maximum for 31 cities. Values assigned range from 0 to 100%. Source: World Bank Data, http://data.worldbank.org/ indicator/NY.GDP.PCAP.CD.
Various sources (e.g., AfDB, 2005; Maoulidi, 2010; World Bank, 2007).
Various sources (e.g., Cities Alliance, 2008; JICA, 2012; UN-Habitat, 2007a).
Various sources (e.g., Lusaka City Council, 2003; République du Congo, 2010; UN-Habitat, 2010).
Various sources (e.g., AfDB, 2004; República de Mozambique, 2011; World Bank, 2009a).